 Sean McKelvey
 Amirhassan Abassi2†
 Metin Duran
94% of researchers rate our articles as excellent or good
Learn more about the work of our research integrity team to safeguard the quality of each article we publish.
Find out more
ORIGINAL RESEARCH article
Front. Environ. Eng., 28 May 2024
Sec. Water, Waste and Wastewater Engineering
Volume 3 - 2024 | https://doi.org/10.3389/fenve.2024.1401180
Drinking water treatment is a complex system of chemical, physical, and biological processes that is highly dependent on water quality and the design of the treatment process. To create decision-support tools, the prediction of key performance indicators, such as settled water turbidity, is needed. A variety of data-driven modeling techniques is available to formulate such predictions. Data-driven models provide valuable tools for formulating predictions where there is a lack of mechanistic models or the mechanisms are not fully understood, as in surface water treatment. The objective of this paper is to evaluate and compare the effectiveness of various data-driven techniques for this important, but difficult, problem. Recognizing that the size and quality of the dataset are most critical in this kind of analysis, this work uses one of the largest datasets used in this context consisting of 2,527 vectors of water quality and operational data (2,527 X nine data frame) from a full-scale water treatment plant. The paper constructs and compares the performance of the several data-driven models including k-nearest neighbor (KNN) regression, polynomial regression, and artificial neural networks (ANN). Based on test scaled root mean square error (RMSE), the ANN model was the most predictive (0.124). Similarly, the ANN model had the best predictive performance based on total scaled RMSE (0.086). These results show that ANNs have a high potential for the development of a future decision support system in selecting appropriate coagulant doses based on settled water turbidity.
Drinking water treatment is a vital public health program to deliver potable and palatable water to customers. Treatment regimes depend upon the source water, which is typically either surface water (e.g., rivers, lakes, or reservoirs) or groundwater. Surface water treatment systems are prone to seasonal changes in water quality, as well as more rapid changes, particularly during storm events (Wu and Lo, 2008). As such, chemical dosages (e.g., coagulant, pre-oxidant, disinfectant) are often adjusted to maintain effective treatment during these changing water quality conditions. Decisions to change chemical dosage have historically been made from a combination of operator experience and bench-scale analyses (Menezes et al., 2018). Changes to coagulant dosage are typically evaluated with a bench-scale jar test. While jar tests help predict the chemistry of coagulation, they are relatively expensive to run and do not allow for responses to sudden changes in water quality (Joo et al., 2000; Menezes et al., 2018; Edzwald, 2019). Hence, decision-support tools have become increasingly important in applying consistent dosages of the coagulant.
Mathematical models are common tools to gain insight into the performance of complex systems and to be able to predict future behavior accurately. Models can range in both complexity and accuracy of prediction, with many conventional models providing limited insights in scenarios where relationships are highly non-linear and/or poorly understood. Several software programs and programming languages have been developed to facilitate ease of model development and evaluation of predictive accuracy for increasingly complex problems. Efforts have been undertaken to utilize data-driven mathematical models to better understand drinking water treatment processes and formulate predictions of performance based on collected data especially in circumstances when science-based (such as from chemistry or physics) models are not available or are too inaccurate. As an example of data-driven models, artificial neural networks (ANNs) have been growing in use for modeling drinking water treatment processes, particularly in the prediction of turbidity at various points in the treatment process. ANN models are based on a model of the structure of human neural networks. Input nodes are connected to nodes in hidden layers through nonlinear transformation functions. These hidden nodes, which form hidden layers, can be connected to other hidden layers or an output layer that determines the predicted response variable. An example diagram of ANN architecture is shown in Figure 1.
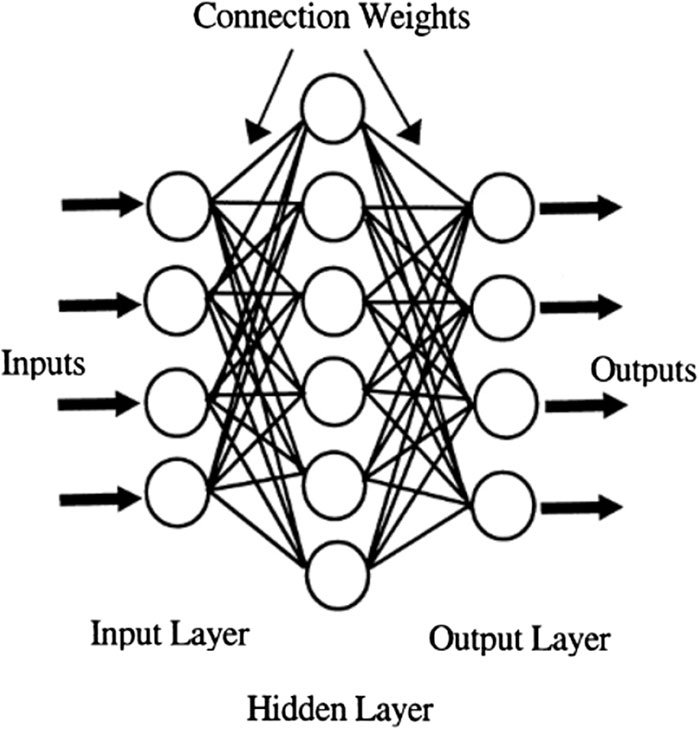
Figure 1. Example ANN architecture (Baxter et al., 1999).
ANN and other nonlinear model configurations have shown promise in several applications throughout the water treatment industry. Researchers have developed ANN models for cost optimization (Taloba, 2022), prediction of coagulant dose (Valentin and Denceux, 1999; Deveughèle and Do-Quang, 2004; Tahraoui et al., 2021; Lin et al., 2023), potassium permanganate dose requirements (Godo-Pla et al., 2019), source water quality (Hameed et al., 2023), sodium absorption in groundwater (Hasanpour Kashani et al., 2023), regional water demand (Zhang et al., 2019), and settled water turbidity (Wu and Lo, 2008; Al-baidhani and Alameedee, 2017; Kim and Parnichkun, 2017; Haghiri et al., 2018; Abba et al., 2020; Alsaeed et al., 2021; Ghasemi et al., 2022; Lin et al., 2023). Although several modeling techniques have been developed recently to predict coagulant dose based on source water quality, most of the work reported in literature either used bench-scale data (Haghiri et al., 2018) or lacked a sufficiently large data set (Al-baidhani and Alameedee, 2017; Abba et al., 2020).
Since the work presented here focuses on the prediction of settled water turbidity, a summary of the reported results from studies predicting settled water turbidity is given in Table 1. These studies show that data-driven models can be a highly effective decision-support tool for water treatment especially when large data sets are available. However, one glaring deficiency in these studies is that they were almost exclusively developed using small data sets from full-scale operations or they relied on bench-scale data, thereby severely limiting wider applicability in the field. In particular, bench-scale studies can be difficult to scale to replicate full-scale operations. Physical processes, such as mixing and settling, pose many challenges of forming predictions when scaling from bench-to full-scale systems, such as the fact that the power input of a mixer, the surface-area-to-volume ratio, and density of the fluid do not necessarily scale appropriately from the bench-to full-scale systems. Additionally, bench-scale results do not account for the temporal and spatial variation of surface waters (Joo et al., 2000; Menezes et al., 2018). Hence, there continues to be a need to evaluate and establish the efficacy of data-based models for predicting water turbidity using full-scale data. It is for this reason that the current study uses a large data set from a full-scale water treatment plant. To the authors’ knowledge, the dataset used in this paper is the largest ever used for this problem; in addition, this is also the first work to compare different modeling techniques including KNN regression for the modeling of a drinking water treatment process.
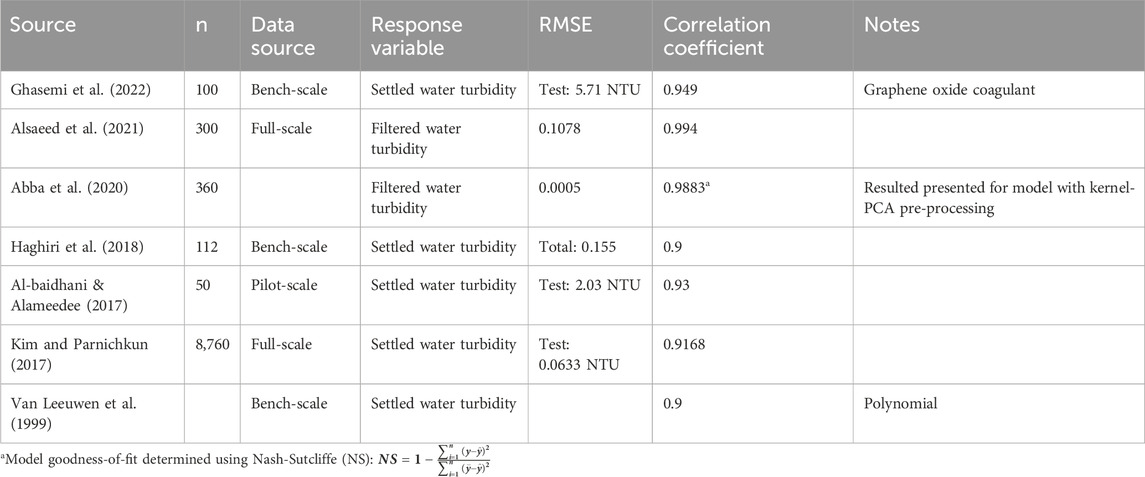
Table 1. Summary of reported results for models predicting turbidity in drinking water treatment.
The DWTP, that is the source of data used in this work, is dubbed “Plant A.” Plant A is a conventional, publicly owned treatment works that includes rapid mixing, flocculant mixing, sedimentation, and filtration. The plant utilizes ferric chloride as a primary coagulant with lime used for alkalinity addition and pH adjustment. Chlorine is applied in the rapid mix and post-sedimentation. Chlorine is also applied post-filtration with ammonia to generate chloramines for a distribution system residual.
Surface water treatment has several key performance indicators (KPIs) that can be evaluated to model plant performance. The KPIs for the effectiveness of a selected coagulant dose include total organic carbon (TOC) removal and settled water turbidity. Under the Stage-1 and Stage-2 Disinfectant and Disinfection Byproduct Rules (DBPRs), TOC is used as a surrogate for natural organic matter and its removal is required to reduce the formation of DBPs (US EPA, 1999). While vital to the performance and regulatory compliance of a DWTP, TOC removal requires laboratory analysis to measure, whereas turbidity can be measured by online instrumentation. Therefore, turbidity data is often more abundant than TOC data. Additionally, online data allows for a more immediate response to changing water quality conditions than laboratory data. Therefore, this study used settled water turbidity as the main KPI since abundant settled water turbidity data was available.
Data was collected in the period spanning 1 July 2011–30 June 2019 (aligning with the fiscal years of the public utility). Variables were initially selected based on interviews with DWTP Operations staff. Operational data included coagulant dose, raw water parameters (alkalinity, pH, turbidity), general plant parameters (water temperature and influent flow rate), and settled water turbidity. Additional operational parameters, such as chlorine dosing, were collected, but were not found to have a significant impact on model performance as they were held relatively constant. River parameters (flow rate and conductance) were collected from the United States Geological Survey (USGS) online database. A summary of the data used for model development is given in Table 2.
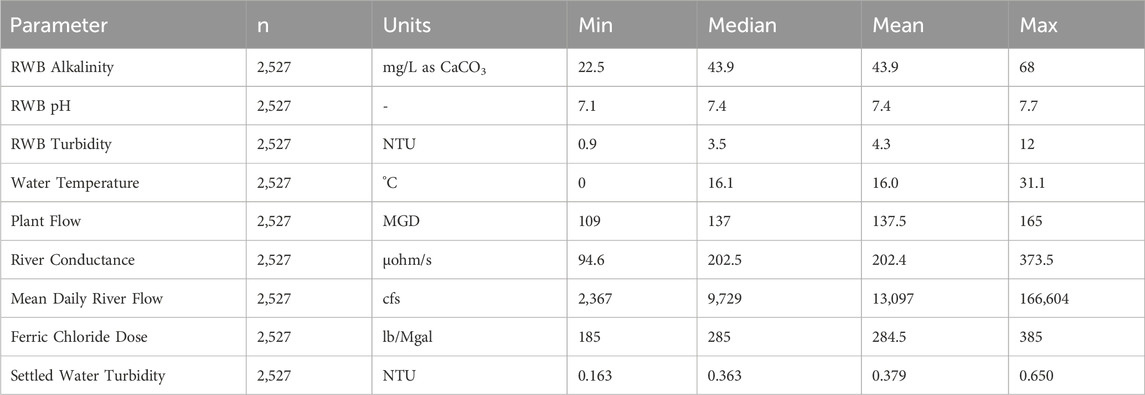
Table 2. Plant A data for model development.
Operational data frequently contains corrupted data points and outliers. Two common approaches exist for handling outliers: 1) the standard deviation method; 2) the median absolute deviation (MAD) method. The standard deviation method relies on the assumption that the data is normally distributed and filters out data that is more than a certain number of standard deviations away from the mean. The MAD method similarly removes data that is more than a certain number of MADs away from the median, although this relies on the assumption that the data is not normally distributed (Leys et al., 2013). In this work, a modified version of the standard deviation method was used, which included filtering out zero values for parameters that could not conceivably be zero. For example, river turbidity will fluctuate but will never be zero; however, data was filtered if more than two standard deviations from the mean and scaled to be between zero and one. Since most data-driven techniques are distance-based, scaling of data reduces unwarranted impacts on model predictions for parameters that are in higher orders of magnitude than others (James et al., 2017). In total, the data set contained 2,527 vectors of data after processing.
The data space was explored with a correlation matrix and principal component analysis (PCA). The correlation matrix (Figure 2) shows the linear correlation between variables. Correlation matrices for the training, validation, and test sets are given in Supplementary Figure S1-3, respectively. One concern is the phenomena of multicollinearity, where two or more predictors are highly correlated with one another. To assess multicollinearity, the variance inflation factor (VIF) is calculated (Eq. 1) for each predictor (Xj) based on all other predictors (X-j). The minimum value for VIF is 1, which suggests no multicollinearity. A VIF above five or 10 suggests the potential for multicollinearity to cause problems such as algorithm divergence and singularity during model development (James et al., 2017). For this prediction space, the VIF ranged between 1.06 and 2.3 for each predictor, suggesting an absence of multicollinearity.
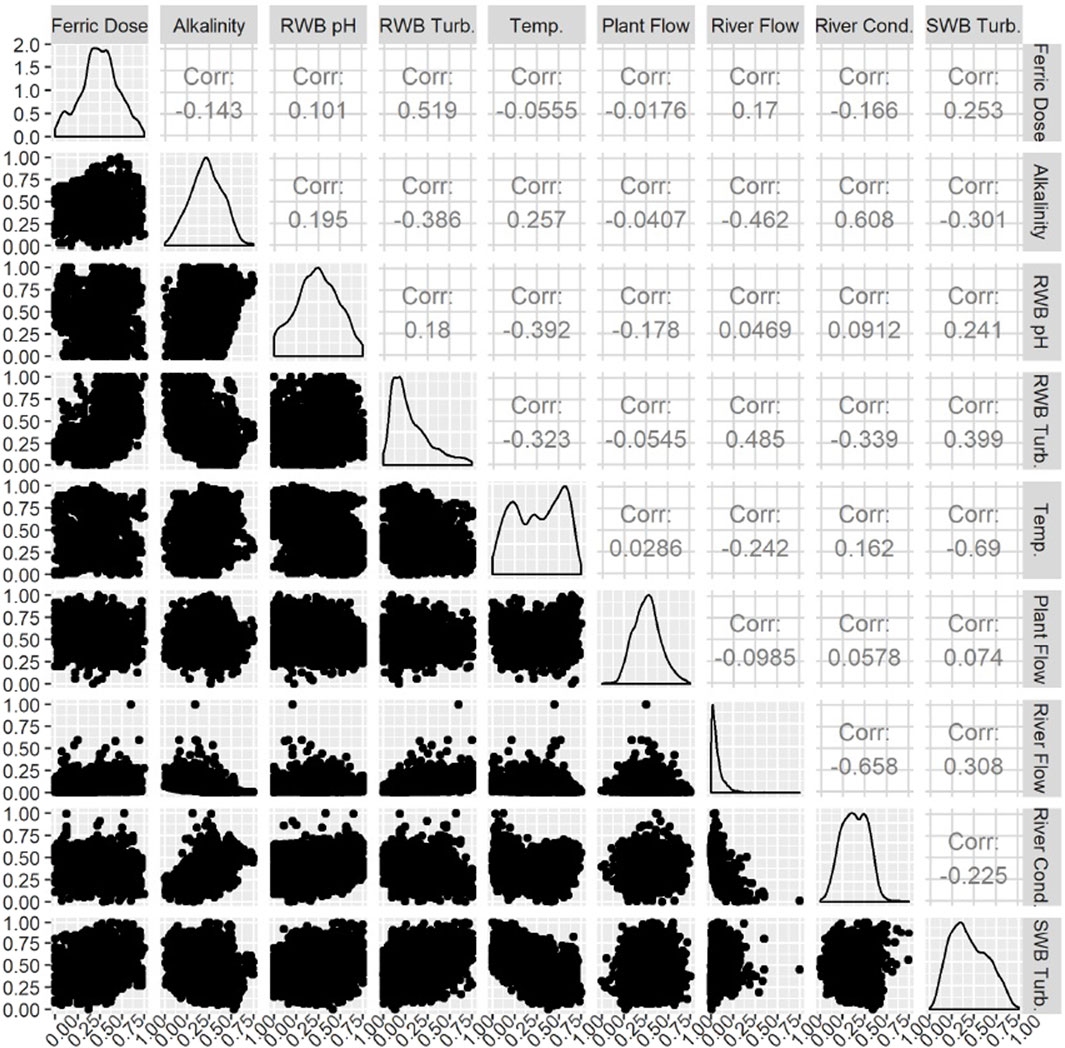
Figure 2. Correlation matrix of data space.
A PCA was performed to assess the linearity of the prediction space. One method to assess linearity of a data space is with the cumulative proportion of variance explained (PVE). In a linear data space, the cumulative PVE of one or two components will achieve a threshold of 90 or 95% (James et al., 2017). The cumulative PVE for the prediction space (Figure 3) shows that six of eight components are required to achieve 90% cumulative PVE, indicating a nonlinear data space, as is common in water quality parameters, suggesting that linear models may not be optimal for formulating accurate predictions (Baxter et al., 1999; Chun et al., 1999; Van Leeuwen et al., 1999; Heddam et al., 2012; James et al., 2017; Kim and Parnichkun, 2017; Zhang et al., 2019).

Figure 3. Cumulative PVE for prediction space.
In order to derive robust data-based models that can generalize well, appropriate features need to be identified from the source data. By ‘appropriate’ we mean, features that are best able to correlate the output with inputs. Here, the following features were selected based on known impacts on drinking water treatment processes, a review of literature and professional judgement, and data availability.
• River flow rate was selected to represent precipitation events throughout the watershed. River conductance was selected to represent the ionic strength of the source water, which can impact coagulant demand and thereby treatment efficacy, particularly the removal of colloidal particles (Edzwald et al., 1974; Jiang, 2015).
• Water quality parameters (raw water turbidity, pH, alkalinity, and temperature) were selected due to their well-documented relationships with the performance of coagulation and flocculation (Jiang, 2015).
• Operational parameters (coagulant dose and plant flow rate) were selected to measure the impacts of operational setpoints. Coagulant dose is an operational setpoint selected by the engineering staff based on raw water quality. Plant flow rate is set to meet water demand needs, but also has an impact on the hydraulic retention times in the individual unit processes.
Several data-driven modeling techniques were used to formulate predictions of settled water turbidity, including regular subset linear regression, KNN regression, polynomial regression, and ANN. These models range in complexity from relatively simple (e.g., linear regression) to complex (e.g., ANN). The strategy of employing models of increasing complexity was intentionally designed to result in an optimal model that balances interpretability with accuracy. While the ANN model was presumed to provide the best-fit model, linear, KNN, and polynomial regressions were selected to provide a baseline for comparison. Data was divided into a 70–15–15 training-validation-test split using random sampling to develop and test each model. The efficacy of model predictions is evaluated with both the RMSE (Eq. 2) and the correlation coefficient between actual and predicted values (Eq. 3).
Regular subset linear regression was used to determine the optimal combination of predictors without including unnecessary predictors (James et al., 2017; Lumley and Miller, 2020). The optimal set of predictors for the linear model includes raw water basin (RWB) effluent pH, RWB effluent turbidity, water temperature, plant flow rate, and river conductance.
KNN models provide a non-parametric approach to formulating predictions through determining the average value of the response variable a number of the neighbors, k, with the smallest Euclidean distance to the test value (James et al., 2017). KNN regression models were developed for all values of neighbors between one to the sample size (Beygelzimer et al., 2019). Backward stepwise selection of parameters was used to determine predictors for the polynomial regression model using a generalized additive model, beginning with all parameters raised to the third power (R Core Team, 2019). Parameters were removed if they were insignificant (p > 0.05), resulting in the model parameters in Table 3.
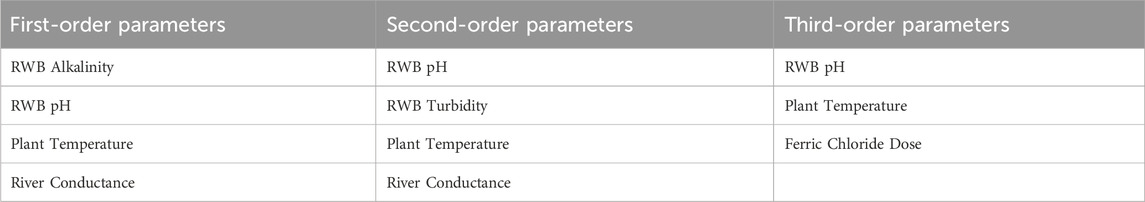
Table 3. Polynomial Regression Model parameters.
ANN models were developed using MATLAB (The MathWorks, 2019). Two hyperparameter optimization tasks were undertaken for this work: training algorithm selection and model architecture optimization. The three training algorithms assessed were Levenberg-Marquardt, Bayesian Regularization, and scaled conjugate gradient (SGM) backpropagation (Demuth and Beale, 2004). The Levenberg-Marquardt method stops when generalization of the model stops improving, which is measured by the mean square error (MSE) of the validation set. Bayesian Regularization has a higher computational cost, but is applicable for smaller and noisier, i.e., more randomly distributed datasets (Haykin, 2009). SGM backpropagation is an algorithm which an approximation to the function within a neighborhood of the neural network architecture is iteratively minimized, often using first- or second-order Taylor expansions of the function (Møller, 1993). SGM backpropagation is often recommended for larger problems, due to its computational efficiency. The Levenberg-Marquardt method was used in this work. The default learning rate of 0.01 with a loss goal of 10–5 over 300 epochs was selected for this study.
A manual grid search was performed to determine the optimal configuration of nodes based on test and total RMSE (Bergstra and Bengio, 2012). The manual search included between one and three hidden layers with between 1 and 100 nodes in each layer. Each model was fit three times to account for variations in model fit. The lowest test RMSE for each model architecture was recorded to compare the various architectures. The optimal ANN structure in this work was the largest size tested. Expanded architectures were tested (200, 300, 400, and 500 nodes in each hidden layer), but did not appear to improve performance, as measured by RMSE.
The pre-processed data was initially explored with PCA. A common threshold in PCA is a cumulative PVE of 0.9, with more linear prediction spaces often having 90% of the variance explained by the first two components (James et al., 2017). The results of the PCA suggest that the prediction space is nonlinear, which is typical for water quality and operational data (Van Leeuwen et al., 1999; Heddam et al., 2012; Zhang et al., 2019). This would suggest that a linear model would not be an appropriate tool to use as was observed in baseline model analysis. Indeed, the linear model had the highest test RMSE (0.176) and lowest R (0.683) of any of the models analyzed.
Prior to fitting the final KNN regression model, the optimal number of neighbors needed to be determined. The optimal number of neighbors, based on the RMSE, was 35 with a test RMSE of 0.154. The KNN model performed better than the linear model based on test RMSE (0.154) and R (0.805). Since there appear to be no reported studies of KNN regression being used to predict settled water turbidity in a drinking water treatment context, the model results are only comparable to the other models within this study. KNN regression performed better than all other modeling techniques, except for the ANN model. However, when the model was applied to the entire data set, the RMSE increased to 0.147 and the correlation coefficient decreased to 0.714 suggesting possible overfitting and model specialization.
The polynomial model was developed using backward stepwise selection (James et al., 2017). The model that was developed performed worse than the KNN regression and ANN models, but better than the linear model, based on test and total RMSE (0.171 and 0.14, respectively) and correlation coefficient (0.688 and 0.752, respectively). There are very few examples of polynomial regressions applied to drinking water treatment parameters. Van Leeuwen et al. (1999) developed a model for various plants for predicting alum dose using jar test and raw water quality parameters, with a correlation coefficient of 0.9. The results presented here do not match those results, which may result from inconsistencies in the collected data or more dramatic changes in water quality that make modeling more difficult in general. Additionally, this work utilized full-scale data, while Van Leeuwen et al. (1999) utilized bench-scale data. Bench-scale data may not provide a model that reflects the changes in the water quality of full-scale plants (Joo et al., 2000; Menezes et al., 2018; Edzwald, 2019).
The ANN led to the most effective models with the lowest total RMSE (0.086) and highest total correlation coefficient (0.911) between the actual and predicted values. Particularly, the ANN model appeared to formulate more accurate predictions around the extrema. As indicated by the PCA, the data space is nonlinear, which is common for water quality data (Kim and Parnichkun, 2017; Zhang et al., 2019). ANN have been shown to be an effective tool for recognizing patterns in nonlinear data to develop a predictive model, even with little to no knowledge of the underlying mechanisms (Haykin, 2009; Kim and Parnichkun, 2017; Zhang et al., 2019).
The pedictive accuracy of the ANN developed in this work aligns with those results presented in Table 4. However, this work utilizes a larger amount of full-scale data to predict settled water turbidity. The benefit of using full-scale data is the increased applicability over that of bench- or pilot-scale data, as there are no effects of scaling. The correlation coefficient between the actual and predicted values provides a good indication of the accuracy of predictions. The reported correlation values described in Table 1 range between 0.9 and 0.93, while the ANN total correlation coefficient is 0.91.
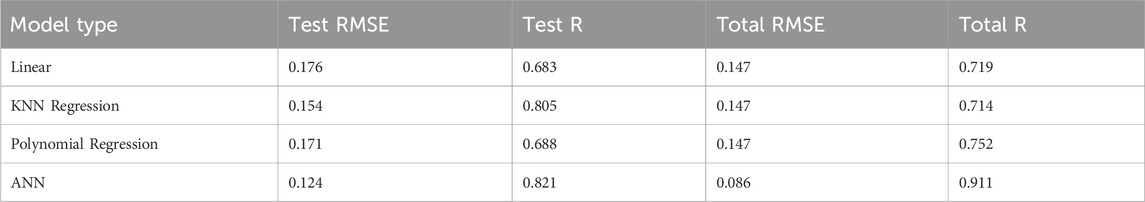
Table 4. Results table for prediction of settled water turbidity.
The test and total RMSE and correlation coefficient between actual and predicted values for the various models is given in Table 4. A summary of the training, validation, and test RMSE is given in Figure 4. Visualizations of the model test and total predictions plotted against the actual data points are given in Figure 5, 6, respectively. The lowest test and total RMSE were achieved by the ANN model at 0.124 and 0.086, respectively. The highest correlation coefficient between actual and predicted test data was 0.821 for the ANN model, and the highest total correlation coefficient was 0.911 for the ANN model.
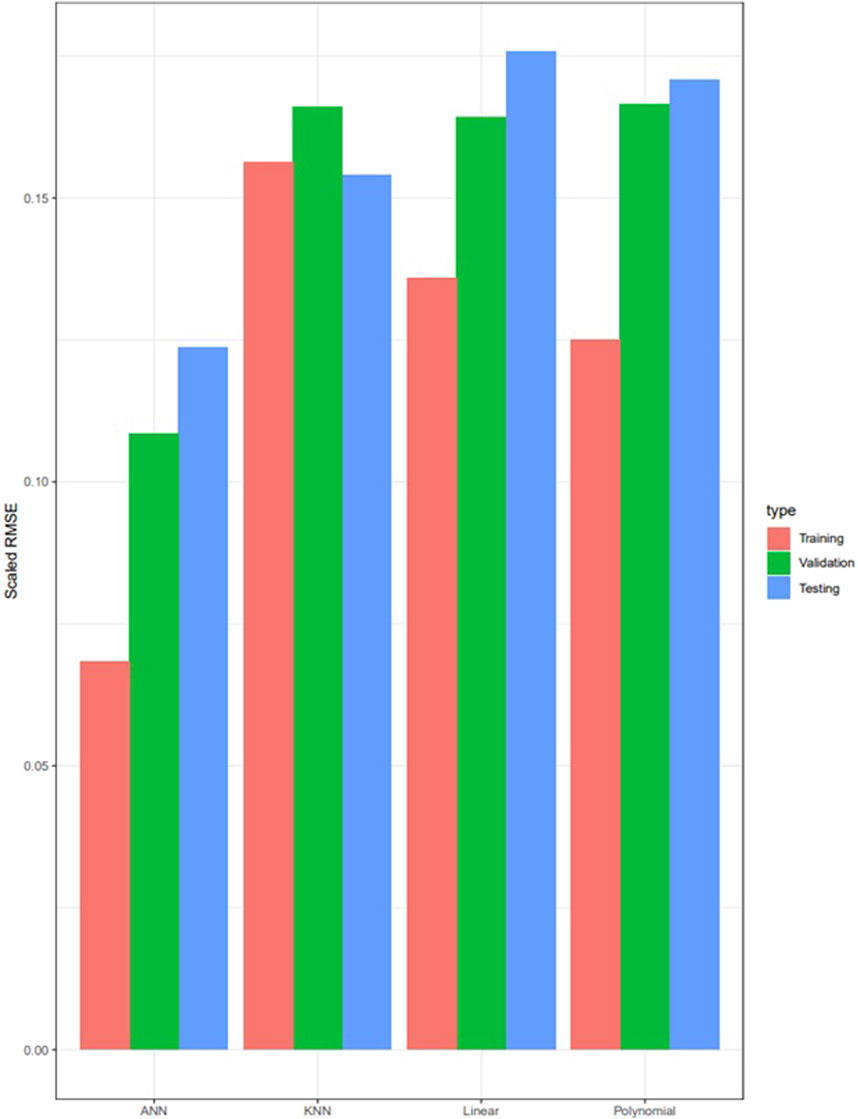
Figure 4. Training, validation, and test RMSE summary.
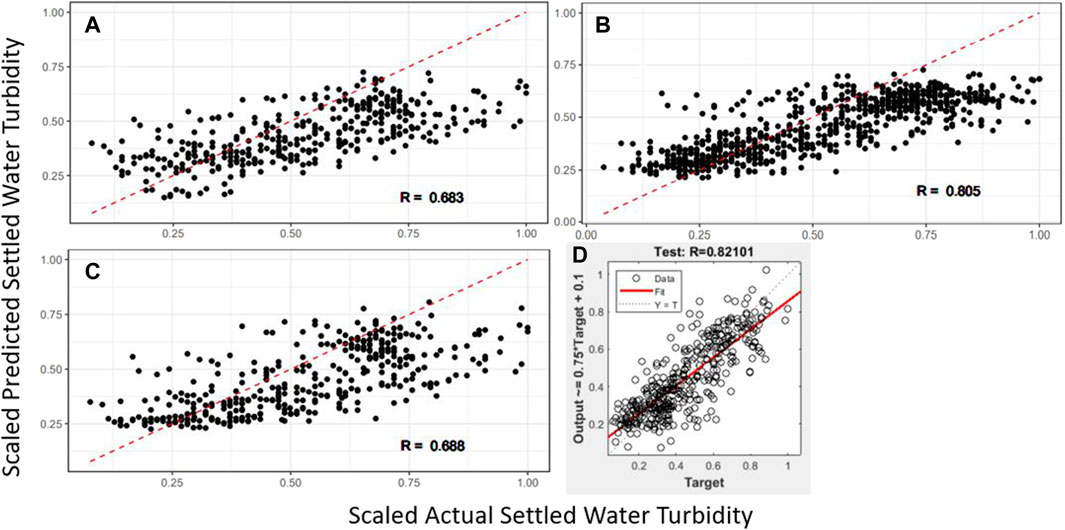
Figure 5. Model test predictions for regular sub-set linear regression (A), KNN regression (B), polynomial regression (C), and ANN (D).
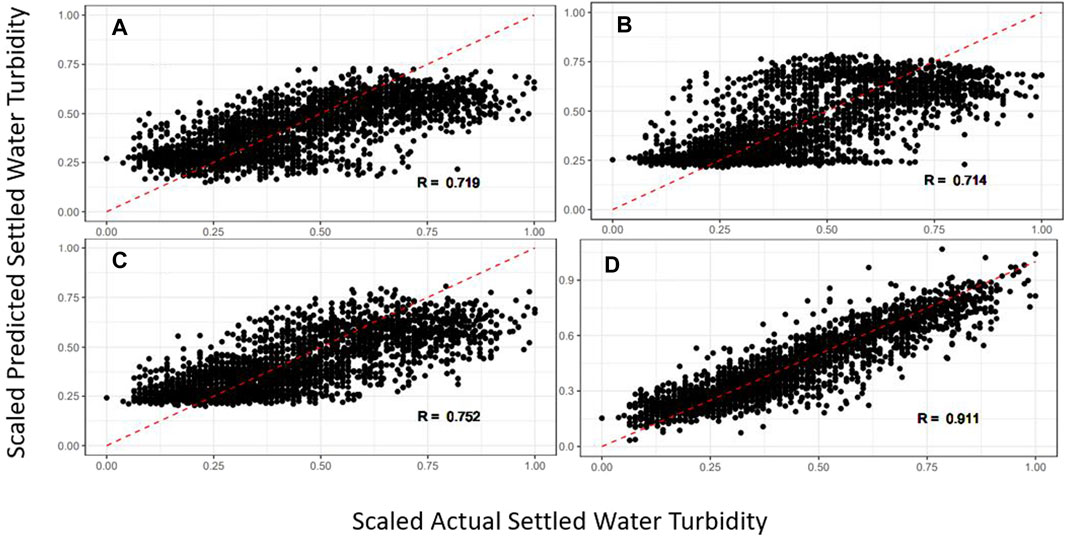
Figure 6. Model total predictions for regular sub-set linear regression (A), KNN regression (B), polynomial regression (C), and ANN (D).
The research presented here suffers from a few limitations. First, the data that was used to develop the model contained many outliers and some corrupted data points. This is characteristic of full-scale operational data, as opposed to bench-scale data. Better data management practices are recommended to further evaluate the performance of the models. Second, the data that was collected was daily averages. A higher degree of granularity in data would allow for the development of a model that would be more responsive to water quality changes. Third, additional model configurations, such as a generalized linear model or SVR, could possibly be explored instead of a strictly polynomial model. These models may provide a higher degree of predictive accuracy without sacrificing model interpretability, like “black box” methods (James et al., 2017). Finally, the surface water treatment process is highly complex due to the ever-shifting nature of influent water quality, including the composition of natural organic matter. We plan to address some of these limitations, where possible. In fact, future studies for this plant will incorporate higher-quality data, including more granular data, which will improve the applicability of these models to develop decision support tools.
This was conducted to develop and evaluate data-driven models for the prediction of settled water turbidity on a large set of full-scale data, where many studies to-date have focused solely on bench-scale data. The use of bench-scale data presents several challenges when applying these models to drinking water systems, as bench-scale studies do not account for the spatial or temporal variation of surface waters and aspects of physical processes are difficult to scale. In this work, computational data-driven models were developed using operational and water quality data from a DWTP. The modeling techniques examined here were regular subset linear regression, KNN regression, polynomial regression, and ANN. By test RMSE, the regular subset linear model was the least predictive (0.176), and the ANN had the lowest test RMSE at 0.124. The total RMSE of the regular subset linear regression, KNN regression, and polynomial regression were all similar at 0.147. The ANN outperforms other models resulting in the lowest total RMSE at 0.086, which is an acceptable accuracy for water turbidity prediction.
The results presented here indicate that ANN is a powerful tool. Combined with a reliable, large data set, ANN modeling can predict, with high accuracy, appropriate coagulant doses based on settled water turbidity. Such models have the potential to replace time-consuming and expensive jar tests and to provide faster response time to changing raw water quality and thus lead to cost and time savings for treatment plants.
Future extension of this work should include the development of a decision support tool for helping Plant A operations in determining the optimal ferric chloride dose, and the development of a model with a more granular time scale. The use of more granular data will allow for more real-time decisions to be made based on changes in raw water quality.
Some or all data, models, or code generated or used during the study are proprietary or confidential in nature and may only be provided with restrictions.
The data analyzed in this study is subject to the following licenses/restrictions: Data is owned by a large utility and not available to public. Requests to access these datasets should be directed to c2Vhbi5tY2tlbHZleUBwaGlsYS5nb3Y=.
SM: Conceptualization, Data curation, Formal Analysis, Investigation, Writing–original draft, Writing–review and editing, Methodology. AA: Data curation, Formal Analysis, Writing–original draft, Writing–review and editing. CN: Formal Analysis, Writing–original draft, Writing–review and editing. MD: Conceptualization, Writing–original draft, Writing–review and editing.
The author(s) declare that no financial support was received for the research, authorship, and/or publication of this article.
The authors declare that the research was conducted in the absence of any commercial or financial relationships that could be construed as a potential conflict of interest.
All claims expressed in this article are solely those of the authors and do not necessarily represent those of their affiliated organizations, or those of the publisher, the editors and the reviewers. Any product that may be evaluated in this article, or claim that may be made by its manufacturer, is not guaranteed or endorsed by the publisher.
The Supplementary Material for this article can be found online at: https://www.frontiersin.org/articles/10.3389/fenve.2024.1401180/full#supplementary-material
Abba, S. I., Pham, Q. B., Usman, A. G., Linh, N. T. T., Aliyu, D., Nguyen, Q., et al. (2020). Emerging evolutionary algorithm integrated with kernel principal component analysis for modeling the performance of a water treatment plant. J. Water Process Eng. 33 (February), 101081. doi:10.1016/j.jwpe.2019.101081
Al-Baidhani, J. H., and Alameedee, M. A. (2017). Prediction of water treatment plant outlet turbidity using artificial neural network. Int. J. Curr. Eng. Technol. 7 (4), 1559–1565.
Al-Baidhani, J. H., Fasal, A. H., Al-Mansori, N. J., and Fadel, L. S. (2019). An attempt to find suitable parameters for coagulation-flocculation processes for the treatment of water. J. Univ. Babylon Eng. Sci., 29–41.
Alsaeed, R., Alaji, B., and Ebrahim, M. (2021). Predicting turbidity and Aluminum in drinking water treatment plants using Hybrid Network (GA-ANN) and GEP. Drink. Water Eng. Sci. Discuss., 1–17. doi:10.5194/dwes-2021-8
Baouab, M. H., and Cherif, S. (2018). Prediction of the optimal dose of coagulant for various potable water treatment processes through artificial neural network. J. Hydroinformatics 20 (6), 1215–1226. doi:10.2166/hydro.2018.014
Baxter, C. W., Stanley, S. J., and Zhang, Q. (1999). Development of a full-scale artificial neural network model for the removal of natural organic matter by enhanced coagulation. Aqua 48 (4), 129–136. doi:10.1046/j.1365-2087.1999.00138.x
Bergstra, J., and Bengio, Y. (2012). Random search for hyper-parameter optimization. J. Mach. Learn. Res. 13 (2).
Beygelzimer, A., Kakadet, S., and Langford, J. (2019). Package class. CRAN. Available at: https://cran.r-project.org/web/packages/FNN/FNN.pdf (Accessed November 4, 2021).
Chollet, F., Burzstein, E., Zhu, Q., Jin, H., and Eldeeb, A. (2021). keras.io. Available at: https://keras.io/about/(Accessed November 4, 2021).
Chun, M. G., Kwak, K. C., and Ryu, J. W. (1999). Application of ANFIS for coagulant dosing process in a water purification plant. IEEE Int. Conf. Fuzzy Syst. 3, 1743–1748. doi:10.1109/fuzzy.1999.790170
Demuth, H., and Beale, M. (2004). Neural network toolbox for use with matlab. United States: The MathWorks Inc.
Deveughèle, S., and Do-Quang, Z. (2004). Neural networks: an efficient approach to predict on-line the optimal coagulant dose. Water Supply 4 (5-6), 87–94. doi:10.2166/ws.2004.0096
Edzwald, J. (2019). “Coagulation [conference lecture],” in Institute in drinking water treatment (Northampton, MA: Hotel Northampton).
Edzwald, J. K., Upchurch, J. B., and O'Melia, C. R. (1974). Coagulation in estuaries. Environ. Sci. Technol. 8 (1), 58–63. doi:10.1021/es60086a003
Ghasemi, M., Hasani Zonoozi, M., Rezania, N., and Saadatpour, M. (2022). Predicting coagulation–flocculation process for turbidity removal from water using graphene oxide: a comparative study on ANN, SVR, ANFIS, and RSM models. Environ. Sci. Pollut. Res. 29 (48), 72839–72852. doi:10.1007/s11356-022-20989-2
Godo-Pla, L., Emiliano, P., Valero, F., Poch, M., Sin, G., and Monclús, H. (2019). Predicting the oxidant demand in full-scale drinking water treatment using an artificial neural network: uncertainty and sensitivity analysis. Process Saf. Environ. Prot. 125, 317–327. doi:10.1016/j.psep.2019.03.017
Haghiri, S., Daghighi, A., and Moharramzadeh, S. (2018). Optimum coagulant forecasting by modeling jar test experiments using ANNs. Drink. Water Eng. Sci. 11 (1), 1–8. doi:10.5194/dwes-11-1-2018
Hameed, M. M., Kareem, A. S., Aljumaily, M. M., Masood, A., Afan, H. A., Al Omar, M. K., et al. (2023). Data-driven models for predicting water quality index: a case study of Klang and Langat rivers, Malaysia. AIP Conf. Proc. 3015 (1). doi:10.1063/5.0188646
Hasanpour Kashani, M., Nikpour, M. R., and Jalali, R. (2023). Water quality prediction using data-driven models case study: ardabil plain, Iran. Soft Comput. 27 (11), 7439–7448. doi:10.1007/s00500-022-07684-7
Haykin, S. S. (2009). Neural networks and learning machines. 3rd ed. United Kingdom: Pearson Education.
Heddam, S., Bermad, A., and Dechemi, N. (2012). ANFIS-based modelling for coagulant dosage in drinking water treatment plant: a case study. Environ. Monit. Assess. 184 (4), 1953–1971. doi:10.1007/s10661-011-2091-x
James, G., Witten, D., Hastie, T., and Tibshirani, R. (2017). An introduction to statistical learning with applications in R. Berlin, Germany: Springer. doi:10.1007/978-1-4614-7138-7
Jiang, J. Q. (2015). The role of coagulation in water treatment. Curr. Opin. Chem. Eng. 8, 36–44. doi:10.1016/j.coche.2015.01.008
Joo, D. S., Choi, D. J., and Park, H. (2000). The effects of data preprocessing in the determination of coagulant dosing rate. Water Res. 34 (13), 3295–3302. doi:10.1016/S0043-1354(00)00067-1
Kim, C. M., and Parnichkun, M. (2017). Prediction of settled water turbidity and optimal coagulant dosage in drinking water treatment plant using a hybrid model of k-means clustering and adaptive neuro-fuzzy inference system. Appl. Water Sci. 7 (7), 3885–3902. doi:10.1007/s13201-017-0541-5
Kingma, D. P., and Ba, J. (2014). Adam: a method for stochastic optimization. arXiv preprint arXiv:1412.6980.
Leys, C., Ley, C., Klein, O., Bernard, P., and Licata, L. (2013). Detecting outliers: do not use standard deviation around the mean, use absolute deviation around the median. J. Exp. Soc. Psychol. 49 (4), 764–766. doi:10.1016/j.jesp.2013.03.013
Lin, S., Kim, J., Hua, C., Kang, S., and Park, M. H. (2023). Comparing artificial and deep neural network models for prediction of coagulant amount and settled water turbidity: lessons learned from big data in water treatment operations. J. Water Process Eng. 54, 103949. doi:10.1016/j.jwpe.2023.103949
Luk’yanova, L. N., Kutasov, V. A., Popov, V. V., and Konstantinov, P. P. (2004). Galvanomagnetic and thermoelectric properties of p-Bi2-xSb xTe3-ySey, solid solutions at low temperatures (<220 K). Phys. Solid State 46 (8), 1404–1409. doi:10.1134/1.1788770
Lumley, T., and Miller, A. (2020). Package leaps. CRAN. Available at: https://cran.r-project.org/web/packages/leaps/index.html (Accessed November 4, 2021).
Menezes, F. C. de, Fontes, R. M., Oliveira-Esquerre, K. P., and Kalid, R. (2018). Application of uncertainty analysis of artificial neural networks for predicting coagulant and alkalizer dosages in a water treatment process. Braz. J. Chem. Eng. 35 (4), 1369–1381. doi:10.1590/0104-6632.20180354s20170039
Møller, M. F. (1993). A scaled conjugate gradient algorithm for fast supervised learning. Neural Netw. 6 (4), 525–533. doi:10.1016/s0893-6080(05)80056-5
R Core Team (2019). R: a language and environment for statistical computing. Vienna, Austria: R Foundation for Statistical Computing.
Tahraoui, H., Belhadj, A. E., Moula, N., Bouranene, S., and Amrane, A. (2021). Optimisation and prediction of the coagulant dose for the elimination of organic micropollutants based on turbidity. Kem. u Ind. 70 (11-12), 675–691. doi:10.15255/kui.2021.001
Taloba, A. I. (2022). An artificial neural network mechanism for optimizing the water treatment process and desalination process. Alexandria Eng. J. 61 (12), 9287–9295. doi:10.1016/j.aej.2022.03.029
US EPA (1999). Enhanced coagulation and enhanced precipitative softening guidance manual. Available at: https://nepis.epa.gov/Exe/ZyPDF.cgi?Dockey=200021WV.txt (Accessed September 17, 2020).
Van Leeuwen, J., Chow, C. W., Bursill, D., and Drikas, M. (1999). Empirical mathematical models and artificial neural networks for the determination of alum doses for treatment of southern Australian surface waters. J. Water Supply Res. Technol. - AQUA 48 (3), 115–127. doi:10.2166/aqua.1999.0012
Wang, D., Shen, J., Zhu, S., and Jiang, G. (2020). Model predictive control for chlorine dosing of drinking water treatment based on support vector machine model. Desalin. Water Treat. 173, 133–141. doi:10.5004/dwt.2020.24144
Wu, G. D., and Lo, S. L. (2008). Predicting real-time coagulant dosage in water treatment by artificial neural networks and adaptive network-based fuzzy inference system. Eng. Appl. Artif. Intell. 21 (8), 1189–1195. doi:10.1016/j.engappai.2008.03.015
Yamamura, H., Putri, E. U., Kawakami, T., Suzuki, A., Ariesyady, H. D., and Ishii, T. (2020). Dosage optimization of polyaluminum chloride by the application of convolutional neural network to the floc images captured in jar tests. Sep. Purif. Technol. 237, 116467. doi:10.1016/j.seppur.2019.116467
Zhang, Y., Gao, X., Smith, K., Inial, G., Liu, S., Conil, L. B., et al. (2019). Integrating water quality and operation into prediction of water production in drinking water treatment plants by genetic algorithm enhanced artificial neural network. Water Res. 164, 114888. doi:10.1016/j.watres.2019.114888
Keywords: water treatment, data-driven modeling, artificial neural network, k-nearest neighbor, linear regression, polynomial regression
Citation: McKelvey S, Abassi A, Nataraj C and Duran M (2024) Data-driven modeling techniques for prediction of settled water turbidity in drinking water treatment. Front. Environ. Eng. 3:1401180. doi: 10.3389/fenve.2024.1401180
Received: 14 March 2024; Accepted: 03 May 2024;
Published: 28 May 2024.
Edited by:
Jai Prakash Kushwaha, Thapar Institute of Engineering & Technology, IndiaReviewed by:
Parminder Kaur, LUT University, FinlandCopyright © 2024 McKelvey, Abassi, Nataraj and Duran. This is an open-access article distributed under the terms of the Creative Commons Attribution License (CC BY). The use, distribution or reproduction in other forums is permitted, provided the original author(s) and the copyright owner(s) are credited and that the original publication in this journal is cited, in accordance with accepted academic practice. No use, distribution or reproduction is permitted which does not comply with these terms.
*Correspondence: Sean McKelvey, c2Vhbi5tY2tlbHZleUBwaGlsYS5nb3Y=
†ORCID ID:Sean McKelvey, orcid.org/0000-0003-0583-4840; Amirhassan Abassi, orcid.org/0000-0002-0953-4928; C. Nataraj, orcid.org/0000-0002-5816-3932
Disclaimer: All claims expressed in this article are solely those of the authors and do not necessarily represent those of their affiliated organizations, or those of the publisher, the editors and the reviewers. Any product that may be evaluated in this article or claim that may be made by its manufacturer is not guaranteed or endorsed by the publisher.
Research integrity at Frontiers
Learn more about the work of our research integrity team to safeguard the quality of each article we publish.