 Francesca Cecconi
 Leah Pifer
 Fabrizio Sabba
95% of researchers rate our articles as excellent or good
Learn more about the work of our research integrity team to safeguard the quality of each article we publish.
Find out more
ORIGINAL RESEARCH article
Front. Environ. Eng. , 23 May 2024
Sec. Environmental Impact Assessment
Volume 3 - 2024 | https://doi.org/10.3389/fenve.2024.1378621
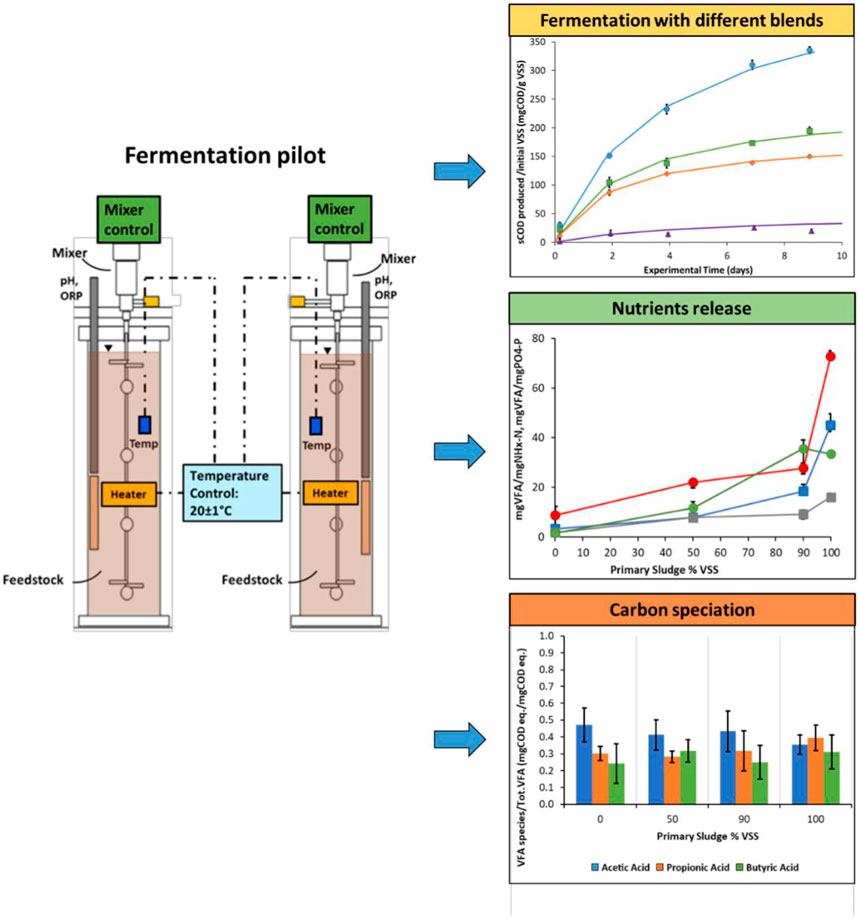
Wastewater treatment plants are transitioning from a sole focus on treatment objectives to integrated resource recovery and upcycling. Effective carbon management is critical for upcycling within a water resource recovery facility (WRRF) to produce energy or other usable products, which involves carbon diversion at primary treatment and waste activated sludge (WAS) from biological treatment processes. Many WRRFs are also driven to meet stringent effluent nutrient discharge targets while minimizing energy usage and chemical addition. Nutrient removal systems still rely on biodegradable organic carbon to support denitrification and enhanced biological phosphorus removal (EBPR). Biological nutrient removal not only requires sufficient organic substrate, but also the right type of bioavailable carbon for optimal utilization. The main objective of this pilot fermentation testing was to evaluate the most effective utilization of the range of organic-carbon rich feedstocks within a WRRF. Preliminary results suggest that a 50–50 blend of primary sludge (PS) and return activated sludge (RAS) fermentation leads to highest volatile fatty acid (VFA) yield. PS fermentation resulted in the minimum nutrients release per unit of volatile suspended solids (VSS), which makes it a best suited for biological nutrients removal WRRFs with stringent nitrogen (N) and phosphorus (P) limits. The volatile fatty acids fractions produced from different combinations of RAS and PS can impact the most suitable end use for each sludge type fermentation. PS resulted into higher levels of propionate, which are ideal for selecting phosphate accumulating organisms (PAO) over glycogen-accumulating organisms (GAO). On the other hand, for denitrification, acetate is the preferred substrate, which was most abundant with RAS only fermentation. Our research outcomes will be of value to utilities aiming to integrate the stringent effluent nutrient (N and P) discharge targets with energy and resource recovery.
Conventional wastewater treatment plants are more rapidly transitioning from an exclusive focus on treatment objectives to integrated resource recovery and upcycling. To effectively facilitate upcycling within a water resource recovery facility (WRRF) to produce energy or other usable products, management of biodegradable organic carbon within the WRRF is a critical backbone to build on. This involves developing and implementing approaches to carbon diversion at primary treatment and waste activated sludge (WAS) from the biological treatment processes. Carbon management also includes management of imported bio-feedstocks such as fat, oil, and grease (FOG) or food-waste. Typically, primary sludge (PS) and WAS may be digested using anaerobic digestion to stabilize the solids produced in the plant and recovery energy as biogas from the anaerobic decomposition of organics (Ozyildiz et al., 2023). In addition to a drive to boost resource recovery, many WRRFs are driven to meet increasingly stringent effluent nutrient nitrogen (N) and phosphorus (P) discharge targets while also minimizing energy usage and chemical addition (Roots et al., 2019; Kehrein et al., 2020; Zekker et al., 2021a; Di Costanzo et al., 2021; McNamara et al., 2022; Sabba et al., 2022). Most nutrient removal systems still rely on a conventional, but optimized, nitrification-denitrification treatment approach requiring biodegradable organic carbon to support denitrification and biological phosphorus removal. Furthermore, WRRFs performing enhanced biological phosphorus removal (EBPR) often experience unstable performance and unexpected disruptions, particularly when dealing with influent that has low levels of readily biodegradable COD (Nielsen et al., 2019a; Gao et al., 2020; Sabba et al., 2023; Zhang et al., 2023). Many years of experience have culminated in the clear understanding that biological nutrient removal not only requires sufficient organic substrate, but importantly, the right type of bioavailable carbon must be supplied in the appropriate location at the right time for optimal utilization (Wu et al., 2009; Carvalheira et al., 2014). There are a range of available biodegradable organic carbon sources (for example, PS: 10–70 gCOD/L; WAS: 4–13 gCOD/L) across a WRRF with disparate characteristics (Metcalf and Eddy, 2013). Each of the carbon-rich feedstocks has a suite of optimal value and utility; in all the use cases, fermentation and hydrolysis play a starring role in mediating the eventual fate of biodegradable carbon within WRRFs. Fermentation is a three-step process (Gavala et al., 2003). Hydrolysis, the first step, involves breaking down complex organic matter into dissolved compounds by fermentative bacteria (Kim et al., 2012), which results in the decrease of sludge volatile suspended solids (VSS) and increase of soluble COD (sCOD) (Wu et al., 2009). In the second step, called acidogenesis, fermentative bacteria utilize the soluble substrates generated by hydrolysis as an energy source for growth, producing fermentation products like volatile fatty acids (VFA), lactate, and ethanol; as well as mineral compounds such as carbon dioxide, hydrogen, ammonia (NH4+-N), and hydrogen sulfide gas. The rate of hydrolysis and acidification is influenced by factors such as pH, temperature, substrate loading, hydraulic and solids residence times (hydraulic retention time, HRT, and solids retention time, SRT) (Veeken and Hamelers, 1999). The third step, called acetogenesis, transforms the products generated via acidogenesis into acetate, and propionate, amounting to 70% of the initial COD, while the remaining 30% into hydrogen, and carbon dioxide (Gujer and Zehnder, 1983; van Haandel and Lettinga, 1994). Banister and Pretorius conducted a study to optimize the performance of PS acidogenic fermentation without pH adjustment. The findings revealed that retention time, seeding, solids concentration, and mixing were the crucial variables governing the production of volatile fatty acids (VFAs), and most of the potential VFA yield was reached within the fermentation time. This study investigates fermentation rates, hydrolysis mechanisms, and the impact of various factors on fermentation performance through a pilot-scale evaluation and batch experiments. Key research objectives include the following:
1) analyse kinetics and products formed through fermentation
2) examine the impact of different mixing strategies, solids concentration, and different blends of PS and RAS
3) evaluate the impact of solids retention time (SRT) of the RAS when blended at different ratios with PS on the fermentation performance
The fermentation tests were performed collecting samples of PS and RAS at three WRRFs in the north of California. Plant one was selected as a facility with trickling filter followed by solids contact tank with a typical SRT in the range of 2–3 days. The plant treats an average dry weather influent flow of 34,100 m3/d primarily for COD and TSS removal. Plant two was selected as a nitrification/denitrification plant with a typical SRT in the range of 7–11 days. The plant treats an average dry weather influent flow of 50,000 m3/d. Plant three was selected only to act as a surrogate sample of PS for Plant 1. This was needed due to the low solids content of Plant 1 PS which rendered it infeasible to use for the batch experiments, and also not characteristic of typical PS. Plant three treats an average dry weather influent flow of 46,900 m3/d and was selected as a surrogate due to its proximity to Plant one and its similar influent characteristics primary treatment performance to Plant 1. More information on the plant characteristics, raw influent concentrations, as well as primary clarifier operation for each plant can be seen in Table 1.
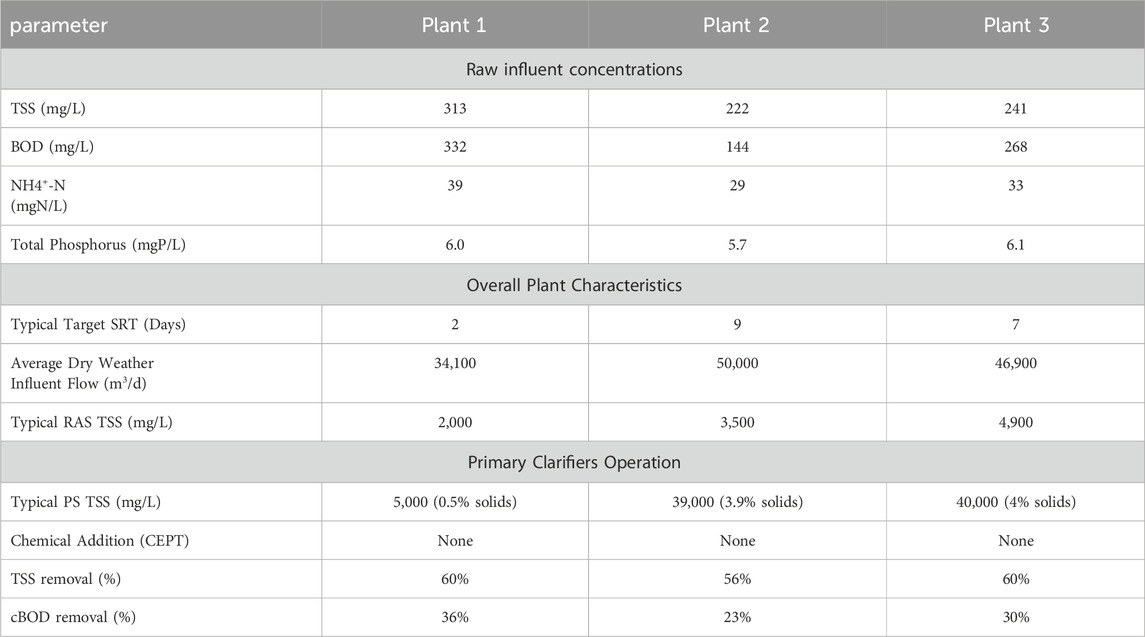
Table 1. Typical raw influent and operating concentrations from Plant one, Plant two and Plant three.
Was not used because of low % solids content. We acknowledge that influent characteristics can impact both (i) the COD content in PS, also as a function of the primary treatment solids removal efficiency and (ii) the COD content in RAS, also as a function of SRT. Therefore, the results of the fermentation tests with the blending of primary sludge from Plant 3 with RAS from Plant one could potentiality be impacted by the differences in influent characteristics between Plant one and Plant 2.
Pilot-scale fermentation experiments were performed using a two-tank pilot system (Figure 1). Each bioreactor had a working capacity of 75 L with a depth to width ratio of 3:1, to limit the 8 intrusion of air and maintain anaerobic conditions. Each bioreactor was equipped with five sampling points with one at 5, 20, 40, 60, and 80 L (for overflow) of volume. The 40 L sampling port was used for all analysis except when mixing strategy was investigated, in which case a sample near the top and bottom were both taken to determine the difference in various areas of the reactor. An additional port at the bottom of the reactors was used to drain and flush the reactors with secondary effluent between batch tests. Each bioreactor was equipped with a mixer set at 200 rpm with an impeller (pitched blades) at approximately 50% depth and a surface impeller (flat blades) to avoid solids stratification and promote good mixing. A pH probe (DPD1, Hach Company, Loveland, CO) and an oxidation reduction potential (ORP) probe (DRD1, Hach, Loveland, CO) were installed in each reactor. ORP and pH probe data was logged and calibrated using a universal controller (SC 2000, Hach Company, Loveland, CO). The temperature was controlled at 20°C ± 2°C in each bioreactor using a heating strip connected to a temperature probe (ITC-308, Inkbird Tech., China).
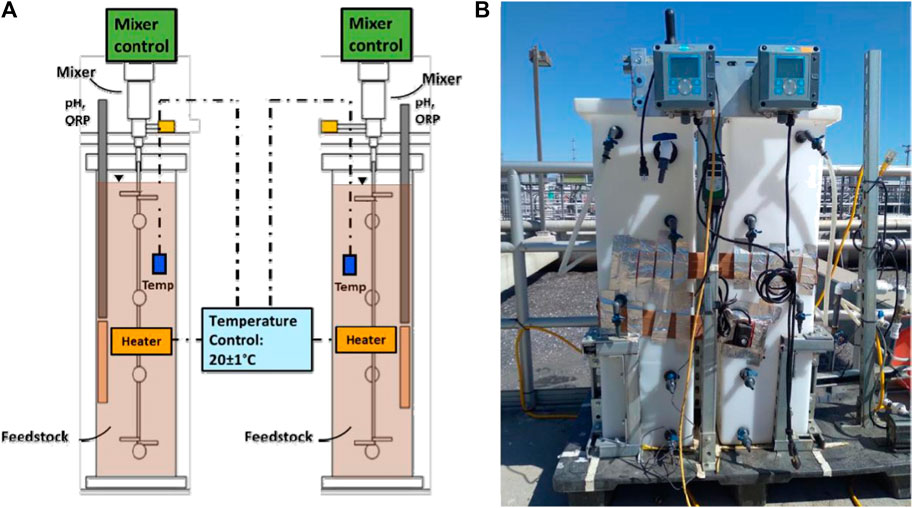
Figure 1. (A) Batch experimental schematics and (B) picture of on-site reactors at Hayward, CA.
Table 2 shows the summary of all the experiments conducted, in terms of different biomass and blends tested, mixing conditions and solids concentrations. Each fermentation experiment was run in duplicate, for 2 weeks. For each experiment, samples of RAS and PS were collected from each respective plant and were added to the two pilot reactors. The target solids concentrations in the pilot reactors were obtained by either diluting the RAS samples with secondary effluent or by letting the samples settle in the reactors and removing the supernatant to increase the solids concentration. Supplementary Table S1, S2 in the provide details for the initial conditions and sludge characteristics in each test. VSS were measured throughout the experiments and the VSS time series plots for each experiment can be found in Supplementary Figure S9. The yield of soluble COD for each experiment was calculated as the soluble COD produced from the beginning of the experiment per unit of initial VSS, mg sCOD/(gVSS), as shown in Eq 1. Each yield is shown in the results as mean ± standard deviation for each duplicate.

Table 2. Summary of fermentation experiments conditions.
The fermentation rate (sCOD production rate) was calculated as soluble COD produced from the beginning of the experiment per unit of initial VSS per unit of time, mg sCOD/(gVSS,h), as shown in Eq 2. Each fermentation rate is shown in the results as mean ± standard deviation for each duplicate.
Both the sCOD yield and production rate were important metrics used to compare the fermentation performance between different experiments under a standardized approach. The sCOD production rate was calculated as following:
1) at 24 h from the beginning of the experiment, to compare the different mixing strategies and VSS concentrations.
2) at 72 h (3 days) from the beginning of the experiment to investigate the fermentation performance of the various feedstocks and blends. The 3-day fermentation rate was ultimately used to ensure a representative fermentation rate was reached for each condition.
Sampling during the experiment was conducted with the focus of characterizing the predominant trends of each water quality parameter with time. Data were collected on 3 days during each week of the experiment, for a total of 6 days of data collection evenly spaced throughout the two weeklong batch experiment. Sampling ports were purged three times before sampling to ensure fresh sample was obtained. Grab samples were collected during the experiments to measure VFA, soluble COD, total COD, total suspended solids (TSS), VSS, alkalinity, NH4+-N and orthophosphate (PO43--P). Specifically, major soluble species (i.e., VFA, sCOD, NH4+−N, PO43--P) were collected three times per day at 4-h intervals, spaced to characterize the trend of each species throughout the data collection day. Sampling of VFA and sCOD informed the rate of production during the experiment, while sampling of NH4+-N and PO43--P informed the re-release of nutrients back into the reactor. Alkalinity was sampled once per data collection day. Samples were centrifuged and filtered through a 0.45 µm filter before analysis and were refrigerated at 4°C for up to 48 h if analysis could not occur immediately. Unfiltered sample was collected at the first sample time of each data collection day and analyzed for total solids, volatile solids, and total COD, to characterize how these were consumed over time. Sample was collected for VFA speciation on day 0, 4, and nine to characterize the VFA proportions at the beginning, middle, and end of the experiment. VFA species analyzed include butyric acid, malic acid, acetic acid, citric acid, fumaric acid, lactic acid, propionic acid, pyruvic acid, succinic acid, and tartaric acid. pH and ORP were monitored continuously to ensure adequate conditions for fermentation were maintained during the experiment (i.e., ORP at least below −100, pH near neutral conditions). Representative information for pH, ORP, and temperature for the major experimental conditions can be seen in Supplementarys Figure S1-S8. Details of sample collection and analysis are listed further in Table 3.
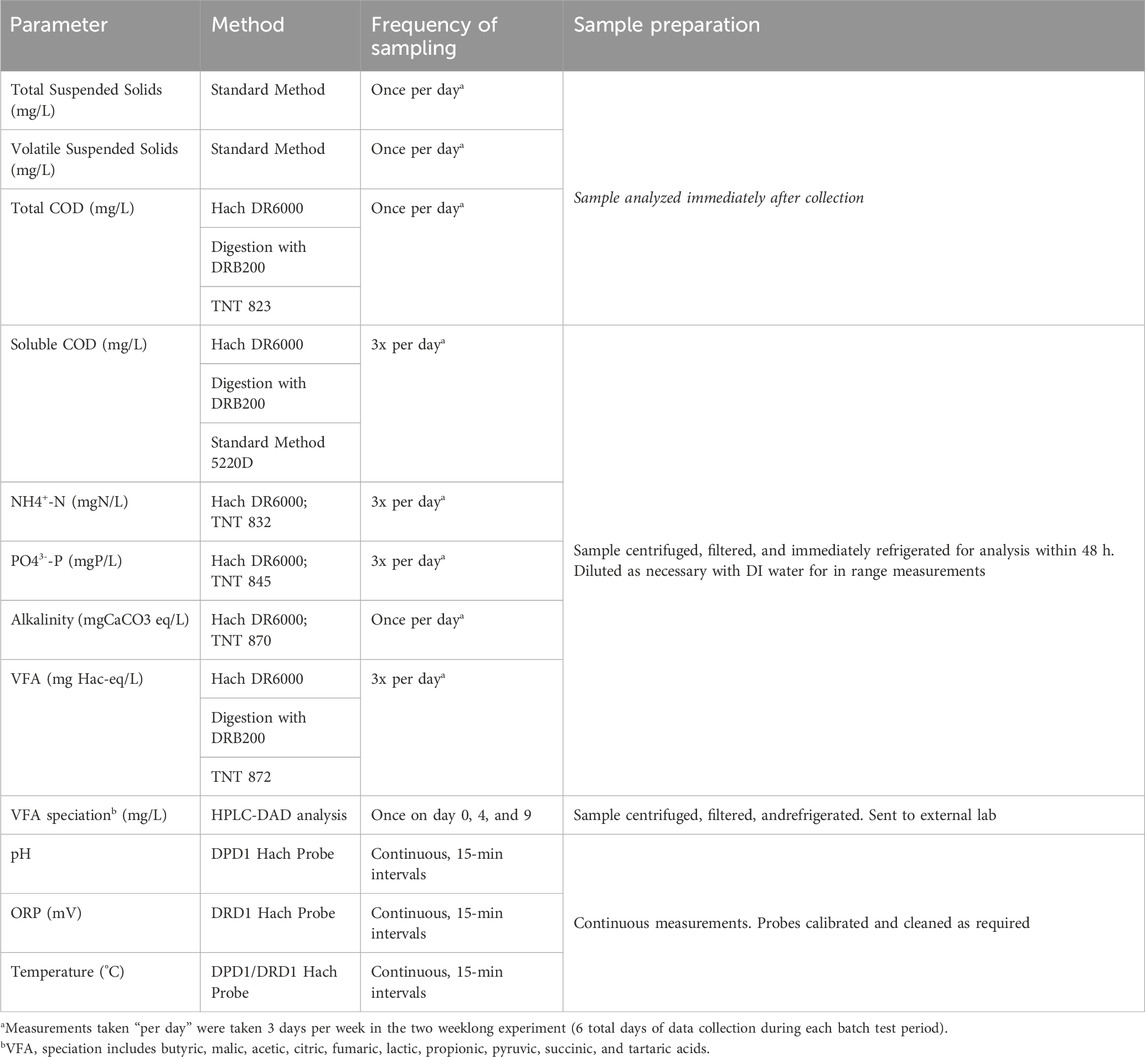
Table 3. Analytical method, probe, or kit used for analysis, frequency of data collection, and preparation for each sample.
Carbon management through hydrolysis and fermentation at WRFFs refers to the process of managing carbon emissions using hydrolysis and fermentation at wastewater resource recovery facilities. This process involves breaking down organic matter in wastewater through hydrolysis, which produces VFA. The VFA then can either be used as a substrate for fermentation, producing biogas, which can be used as a renewable energy source or as a substrate for biological nutrients removal. This approach not only helps to reduce carbon emissions but also generates renewable energy and minimizes waste. The batch fermentation results of this study are evaluated in the following subsections:
• Impact of solids concentrations and mixing conditions on RAS fermentation rate, to analyse the influence of the fermenter operating conditions on the fermentation performance
• Impact of SRT of the RAS when blended at different ratios with PS on the fermentation performance
• Impact of SRT of the RAS when blended at different ratios with PS on fermentation products, including the VFA content in the COD produced and the nutrients release
• Impact of SRT of the RAS when blended at different ratios with PS on VFA distribution, focusing on which VFAs are most abundant and how the distribution changes based on the different RAS/PS content.
Figure 2A shows the comparison of fermentation rates between two continuously mixed experiments with short SRT RAS at different solids concentration (low, 3.8 g/L VSS and high, 7.5 g/L VSS). This range was chosen as it represents a typical range of RAS concentrations at a variety of WRRFs with different biological processes (Metcalf and Eddy, 2013). The findings highlight that the increase in solids concentration (twice the concentration from the default condition) did not impact the fermentation rate. Both scenarios produced instead around 1.5 ± 0.1 mg sCOD/h/gVSS; this compares well with previous work on RAS fermentation, with ranges from 0.6 to 2.5 mg sCOD/h/gVSS (WRF 4975 Report). The similar sCOD yield between the two different concentrations could be attributed to how the fermentation process is a function of the solids and its composition rather than concentrations as the enzymatic hydrolysis of RAS is commonly described by empirical first-order kinetics (Vavilin et al., 2008). Hydrolysis is usually the rate limiting step in fermentation (Miron et al., 2000; Guo et al., 2021) and it involves breaking down complex organic matter in particulate form into dissolved compounds. Banister and Pretorius, 1998, show analogous results, with similar VFA yields after 6 days of tests at different solids concentrations. However, they suggested to limit the solids concentration to approximately 0.5%–2% to avoid mixing issues and decrease of fermentation performance.
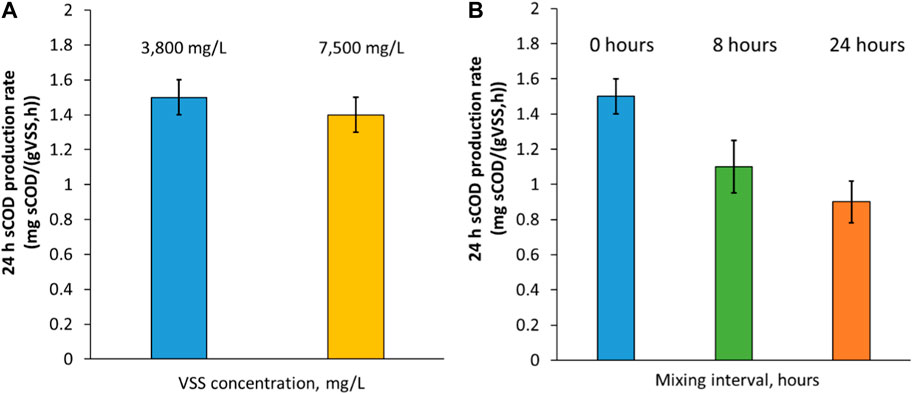
Figure 2. (A) RAS fermentation rate at 24 h with short SRT at different continuously mixed solids concentration; (B) RAS fermentation rate at 24 h with short SRT at different mixing conditions. The error bars show ± one standard deviation of the duplicate tests.
While the first set of experiments focused on understanding the impact of solids concentration on fermentation rates, the second set of experiments investigated the impact of mixing conditions. Three main mixing conditions were tested:
1) Continuous mixing throughout the experiment
2) Intermittent mixing: 10 min of mixing every 8 h of non-mixing
3) Intermittent mixing: 10 min of mixing every 24 h of non-mixing
In fermentation processes, the pH typically decreases due to the VFA production in the acidogenesis step. The pH for all three mixing strategies started at seven and decreased and 16 stabilized to 6. The ORP of the intermittent mixing tests showed a faster decrease from the initial anoxic conditions (∼+50 mV) of RAS to deep and stable anaerobic conditions (∼-450 mV) within 24 h, while it took 48 h for continuously mixed tests to achieve the same ORP. The faster decrease of ORP for intermittent mixing tests is likely due to less oxygen intrusion from the pilot surface and could be beneficial for full scale applications to achieve deep anaerobic conditions at shorter HRTs. Figure 2B shows the fermentation rate comparison between the three experiments at different mixing strategies and same solids concentration. The highest fermentation rate was achieved under continuously mixed conditions, at around 1.5 ± 0.1 mg sCOD/h/gVSS. On the other hand, the longer the interval between mixing episodes, the lower the amount of soluble COD produced. For example, with 24 h non-mixing intervals, the production was as low as 0.9 ± 0.1 mg sCOD/h/gVSS, which is 40% less than the continuously mixed conditions. The mixing trends observed in our study align with the findings in the literature, as mixing is a crucial factor in biomass fermentation; it keeps organic material suspended and enhances the contact between microorganisms and substrate (Pfeffer, 1974), as the surface and transport phenomena are key characteristics of the hydrolysis process (Vavilin et al., 2008). Gomez et al. (2009) conducted a study comparing the effects of mixing and static conditions and found that agitation could improve the performance of the fermentation system. In another bench-scale investigation by Danesh and Oleszkiewicz (1997), it was found that a lack of mixing significantly reduced the amount of VFA-COD generated, particularly at low temperatures.
This section explores the impact of mixing blends of different feedstocks on fermentation rates. For example, samples of short and long SRT RAS were blended with PS (see Table 1 in section 2.2). All the RAS and PS blends tests were performed in continuously mixed conditions. The pH range for RAS-only experiments was between six and 8, while for PS-only experiments it ranged from five to 4. In contrast, the different blends of PS and RAS showed a larger variation in pH between the experiments, ranging from five to 8. Regarding ORP, the RAS experiments achieved consistently deep fermentative ORP, around −300 mV to −450mV, the PS showed higher ORP, ranging from anaerobic to deep fermentative conditions from −150 mV to −200 mV. The blend of PS and RAS showed ORP ranges from −150 mV to −300 mV. Figure 3 shows the timeseries of the soluble COD yield, expressed as mass of sCOD produced per unit mass of VSS (mgCOD/gVSS) throughout the experiment for the different RAS and PS blends, for both short SRT combinations (Figure 3A) and long SRT combinations (Figure 3B). Similar results are shown in Ozyildiz et al. (2023) where different anaerobic hydrolysis rates were observed with different blends of PS and RAS. It can be noticed that the sCOD yield is different between the different PS and RAS blend combinations and between the long and short SRT RAS. Overall, the highest fermentation rate is achieved around 3 days from the start of the experiment for all the tests. Higher sCOD yields are shown in the first week, while the sCOD production largely slows down in the second week of the test, which compares well to the bench-scale RAS fermentation results observed by Yuan et al., 2011.
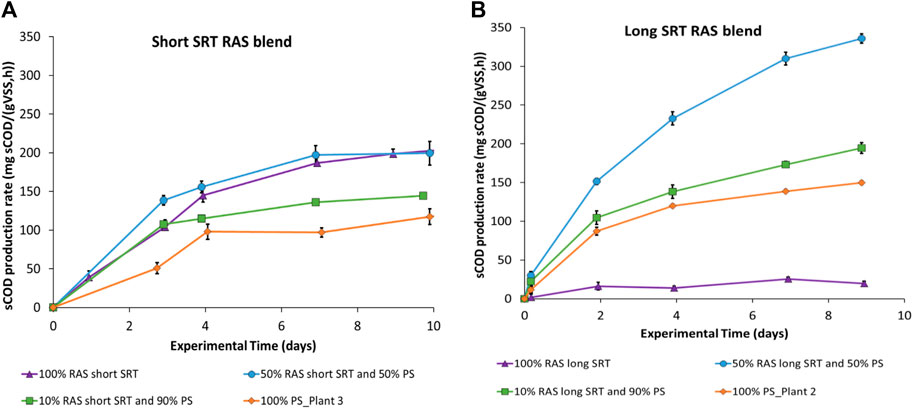
Figure 3. Time series of the sCOD yield, expressed as mass of sCOD produced per unit of initial mass of VSS (marker represent experimental data points while lines are trendlines). (A) Comparison of sCOD production between 100% RAS, 100%PS, 50%RAS/50%PS and 10%RAS/90%PS blends with short SRT RAS from Plant one and PS from Plant 3. PS from Plant three was used as a surrogate sample of PS because of low % solids content in Plant one primary sludge. (B) Comparison of sCOD production between 100% RAS, 100%PS, 50%RAS/50%PS and 10%RAS/90%PS blends with long SRT RAS. The error bars show ± one standard deviation of the duplicate tests.
Figure 4 compares the 3-day fermentation rate for the different RAS (long and short SRT) and PS blends. For the short SRT RAS blends, the average 3-day fermentation rates ranged from 1.4 ± 0.1 mg sCOD/gVSS/h for RAS only to 2 ± 0.2 mg sCOD/gVSS/h for 50% PS and 50% RAS. For the long SRT RAS blends, the average 3-day fermentation rates ranged from 0.25 ± 0.1 mg sCOD/gVSS/h for RAS only to 3.1 ± 0.2 mg sCOD/gVSS/h for 50% PS and 50% RAS. Overall, the 50/50 ratio was noticed to be the optimum ratio to maximize soluble COD production, with both RAS types, however a higher fermentation rate (around 50% higher) was achieved when longer SRT RAS was combined with PS compared to the short SRT/PS blends. PS only fermentation rates from both plants were similar and ranged around 1.8 ± 0.2 mg sCOD/gVSS/h. RAS only fermentation rates for short SRT RAS was around 1.4 ± 0.2 mg sCOD/gVSS/h, while for the long SRT RAS, the fermentation rate was 5 times lower, around 0.25 ± 0.1 mg sCOD/gVSS/h. The lower fermentation rates observed for long SRT RAS is likely due to the accumulation of non-biodegradable particulate COD from the influent and endogenous decay products in the RAS for long SRT biological systems (WRF 4975 report).
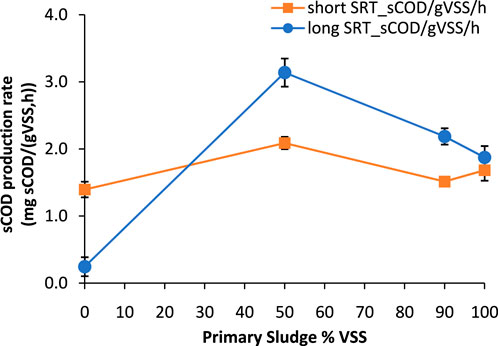
Figure 4. Fermentation rates as function of the PS content at day 3. Note that long SRT refers to Plant two blend experiments while short SRT refers to experiments with Plant 1 RAS and Plant three primary sludge. Plant 3 PS was used as a surrogate for Plant one due to the low % solids content of Plant 1 PS. The error bars show ± one standard deviation of the duplicate tests.
The fermentation performance is driven by the ratio between the concentration of hydrolysing microorganisms, mainly deriving from RAS, and the fermentable substrate, which is more available in PS. In this study, the 50% PS-50% RAS combination represents the optimal trade-off for both short and long SRT RAS blends. Furthermore, the lower fermentation rate of PS compared to the blends with RAS may be explained by the lower content of hydrolysing bacteria or by the lower pH of PS (∼5) compared to RAS (∼6.8–7) and the higher initial VFA concentration which may exert product inhibition (Wu et al., 2009; Huang et al., 2018). The potential low pH inhibition of PS fermentation was likely reflected also by the higher ORP conditions achieved for PS tests, where the ORP reached anaerobic conditions but not as deep and fermentative ORP levels as for the RAS experiments. Continuous fermenter reactors would potentially show a different pH and ORP range than the batch experiments of this study; likely, continuous systems would have a narrower span of variability compared to the batch experiments.
The low fermentation rate observed with long SRT RAS only could be attributed to the low fermentable substrate available in proportion to the hydrolysing bacteria. However, when PS is added, higher fermentation rates are achieved compared to the low SRT RAS blends because of the broader hydrolysing and fermenting bacteria population available with longer SRT biomass. Similar results are presented in the WRF 4975 Report, which focuses on RAS only fermentation and it shows increased RAS fermentation rates as the ratio of the RAS SRT to primary clarifier solids removal efficiency increases. In other words, this entails that:
• with an activated sludge system that operates at short SRT, the fermentation of only RAS typically shows good fermentation rates, even when combined with high performing primary clarification (high primary solids percentage removal via chemically enhanced primary treatment, primary filtration or similar).
• with an activated sludge system that operates at long SRT instead, the fermentation of only RAS typically shows lower fermentation rates, especially when combined with high primary clarifier performance. This is because of a typically lower fermentable substrate content in long SRT RAS. Therefore, for long SRT activated sludge systems, it would be beneficial for their RAS fermenters to integrate primary sludge addition.
Practically speaking, for continuous fermenter reactors the content and variety of fermenting and hydrolysing bacteria would be augmented and could result in higher fermentation rates compared to the tests presented in this study. This is especially true for PS only fermentation which could have been likely limited by the content of hydrolysing bacteria in primary clarifiers. Similarly, the short SRT RAS and PS blend fermentation tests consistently showed lower rates compared to the long SRT and PS blends. However, these blends may exhibit higher fermentation rates in continuous systems due to the limited variety of hydrolyzing bacteria available in short SRT sludge, as compared to the enrichment that can be achieved with continuous fermenter operation.
Sections 3.1 and 3.2 showed that fermentation of sludge leads to the production of sCOD through hydrolysis and acidification. Additionally, the fermentation of PS and RAS results in the release of nitrogen and phosphorus as the VSS are reduced. To analyse the nutrients’ release during fermentation, VFA were monitored to characterize the sCOD content as well as NH4+- N and PO43--P data. Figure 5A shows the VFA produced as COD over soluble COD produced at day 3 of fermentation. Figure 5B instead shows the VFA produced/NH4+-N produced and VFA produced/PO43--P produced as function of the PS content, at the two different SRT. For the short SRT RAS blends, the VFA content ranged from 60% to 65% of the overall soluble COD produced. For the long SRT RAS blends the VFA content was around 55% of the soluble COD for the 50/50 and 10/90 ratio while for the RAS only - long SRT tests it decreased to 20% only. The two PS tests from Plant three and two showed similar VFA/sCOD ratios, around to 60%–65%. These results highlight how not only the long SRT RAS only is characterized by a much lower fermentation rate but also that the quality of the sCOD produced is inferior (lesser content of VFA).
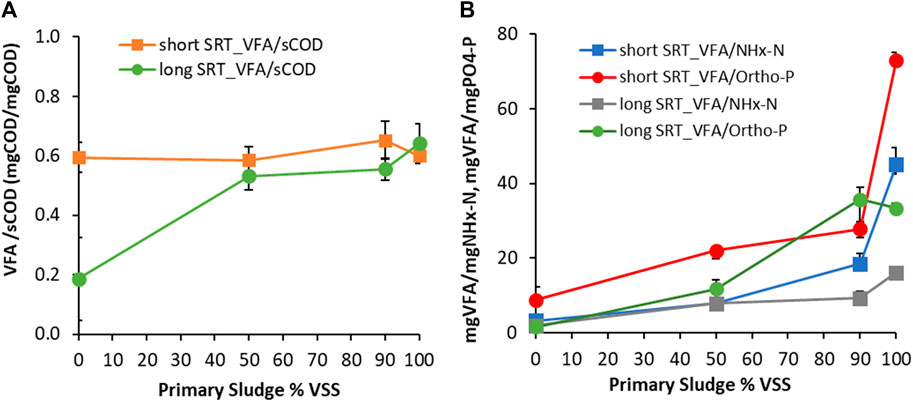
Figure 5. (A) VFA produced as COD over soluble COD produced at day 3 of fermentation and (B) VFA produced/NH4+-N produced and VFA produced/PO43--P produced ratios as function of the PS content, at the two different SRT (long and short). Note that long SRT refers to Plant two blend experiments while short SRT refers to experiments with Plant 1 RAS and Plant three primary sludge. Plant 3 PS was used as a surrogate for Plant one due to the low % solids content of Plant 1 PS. The error bars show ± one standard deviation of the duplicate tests.
Figure 5B shows similar results regarding the nutrients release, for short and long SRT blends. A lower release of both NH4+-N and PO43--P occurs when higher content of PS is present, while a minimum release occurs with PS only. This is due to the high content of bacteria in RAS, which typically contain more nitrogen and phosphorous (nitrogen 2.8%–5.6% by dry weight and phosphorus 0.5%–1.2% by dry weight) as shown in Lu et al. (2019) compared to primary sludge solids (nitrogen 3.4%–4.4% by dry weight and phosphorus 0.6%–1.0% by dry weight) as shown in Gao et al. (2020). The two types of PS only tests show different releases of nutrients; this is likely due to the difference in treatment plant influent composition. One important thing to note is that for a successful application of RAS and RAS/PS blend fermentation, the production of VFA is needed to drive EBPR and denitrification in the mainstream. However, the release of nitrogen and phosphorus can overwhelm the process (Vale et al., 2008; Barnard et al., 2011). Therefore, understanding the perfect trade-off is beneficial for successful EBPR and denitrification. A practical outcome of this set of experiments is that PS fermentation may be best suited to produce additional readily biodegradable carbon for WRRFs with stringent N and P limits. This would result in lower nutrients release; if that is not the case, additional processes are needed to remove nutrients from the fermentate (e.g., struvite recovery) (Wu and Vaneeckhaute, 2022).
The tests conducted in Section 3.3 were also expanded to investigate the VFA distribution in the VFA produced. Figure 6 shows the most abundant VFA species as fractions of the VFA produced as function of the PS content. The VFA fractions are reported as mgCOD equivalent of each VFA species over the total VFA produced expressed as mgCOD equivalent. The VFA 24 species were converted to COD concentration by using the following conversion factors: 1.07 for acetic acid, 1.51 for propionic acid, 1.82 for butyric acid (Yuan et al., 2011).
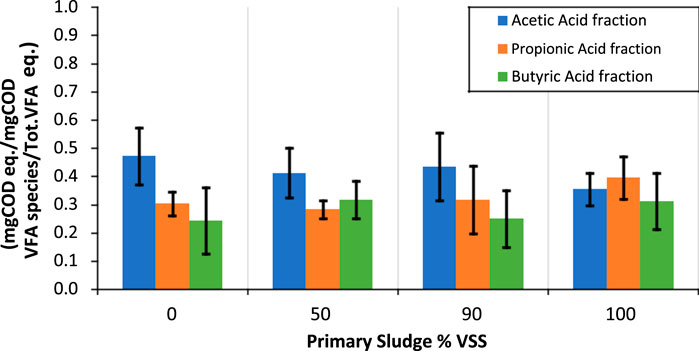
Figure 6. Most abundant VFA fractions of the VFA produced as function of the PS content. Each bar is shown as the average ±standard deviation of the different blends of PS and RAS, grouping together the short and long SRT RAS experiments. The VFA fractions are reported as mgCOD equivalent of each VFA species over the total VFA produced expressed as mgCOD equivalent. The error bars show ± one standard deviation of the duplicate tests.
Overall, the acetic acid was the most abundant species of VFA, representing typically 50% of the VFA, followed in decreasing order by the propionic acid (30%) and butyric acid (around 20%). Other VFA species like malic acid, pyruvic acid and lactic acid were only detected in traces in some of the tests. Barnard and Abraham, 2006; Vollertsen et al., 2006 show similar VFA composition, with acetate accounting for majority of VFA (60%–80%), followed by other volatile organic compounds like propionate, isobutyrate, and butyrate. Elefsiniotis and Oldham (1994) found that acetic, propionic, and butyric acids accounted for 45%, 31% and 9%, respectively, while Coats et al., 2018 found that acetic acid dominated the VFA production at 42%, followed by propionic, butyric and valeric acid. The VFA produced from the RAS fermentation was largely composed of acetic acid (50% of the overall VFA produced) while the VFA produced by PS fermentation presented higher levels of propionic acid (around 40% of the overall VFA produced) (Figure 6B). The findings of these experiments confirm that the distribution of VFA is critical to determine the best end use of each sludge type fermentation. Elefsiniotis and Oldham (1994) reported that naturally produced VFAs serve as an excellent carbon source for denitrification, and among the various VFA species, acetic acid was preferred by denitrifiers. Additional research with studies by Winkler et al. (2011) and Coats et al. (2018) has highlighted the potential benefits of propionate, demonstrating improved and stabilized EBPR metrics when a blend of VFA was used. This would in turn help selecting for phosphate accumulating organisms (PAO) over glycogen-accumulating organisms (GAO) (Oehmen et al., 2007; Carvalheira et al., 2014; Tchobanoglous et al., 2014; Shen and Zhou, 2016). Therefore, PS fermentation could be advised given the higher levels of propionates observed for EBPR, while for denitrification RAS fermentation may be best suited because of the higher levels of acetate produced.
The purpose of this study was to investigate fermentation performance through a pilot-scale evaluation and batch experiments. Key conclusions and considerations are as follows:
• Short SRT RAS fermentation rate was around 1.4 ± 0.2 mg sCOD/gVSS/h, five times higher than long SRT fermentation rates, around 0.25 ± 0.1 mg sCOD/gVSS/h.
• The 50/50 PS and RAS blend was the optimal ratio for maximizing soluble COD production with both RAS types, but longer SRT RAS combined with PS achieved a higher fermentation rate (approximately 50% higher) compared to short SRT/PS blends.
• VFA content ranged from 55% to 65% of the overall soluble COD produced for the different experiments, except for long SRT RAS only tests, with 20% only.
• Acetic acid was the most abundant species of VFA, representing typically 50% of the VFA, followed by propionic acid (30%) and butyric acid (around 20%).
• PS fermentation could be best suited for EBPR applications due to the higher levels of propionates observed, while RAS fermentation may be best suited for denitrification because of the higher levels of acetate produced.
• Continuous fermenter reactors may have higher fermentation rates than in this study due to the increased content and variety of bacteria, particularly for PS-only fermentation, which may have been limited by low content of hydrolysing bacteria in primary clarifiers.
Future research will be focused on modelling the different batch fermentation experiments and calibrating the kinetics parameters, specifically the hydrolysis rates. An important step will be the review of the fermentation rates based on the EBPR activity of the RAS biomass, estimating the COD uptake by PAO bacteria based on the PO43--P release in the fermentation tests. Furthermore, future efforts will focus on microbial community analysis of the different feedstocks and its impact on fermentation performance.
The original contributions presented in the study are included in the article/Supplementary Material, further inquiries can be directed to the corresponding author.
FC: Conceptualization, Data curation, Formal Analysis, Investigation, Methodology, Validation, Visualization, Writing–original draft, Writing–review and editing. LP: Data curation, Methodology, Writing–review and editing. FS: Conceptualization, Methodology, Validation, Visualization, Writing–original draft, Writing–review and editing. LD: Funding acquisition, Investigation, Resources, Supervision, Writing–review and editing.
The author(s) declare that no financial support was received for the research, authorship, and/or publication of this article.
FC, LF, FS, and LD were employed by Black & Veatch.
All claims expressed in this article are solely those of the authors and do not necessarily represent those of their affiliated organizations, or those of the publisher, the editors and the reviewers. Any product that may be evaluated in this article, or claim that may be made by its manufacturer, is not guaranteed or endorsed by the publisher.
The Supplementary Material for this article can be found online at: https://www.frontiersin.org/articles/10.3389/fenve.2024.1378621/full#supplementary-material
Banister, S. S., and Pretorius, W. A. (1998). Optimization of primary sludge acidogenic fermentation for biological nutrient removal. Water s. A 24 (1), 35–42.
Barnard, J., Houweling, D., Analla, H., and Steichen, M. (2011). Fermentation of mixed liquor for phosphorus removal. in Proceedings of the WEF/IWA conference on nutrient recovery and management. Miami, Fl., Jan.
Barnard, J. L., and Abraham, K. (2006). Key features of successful BNR operation. Water Sci. Technol. 53, 1–9. doi:10.2166/wst.2006.400
Carvalheira, M., Oehmen, A., Carvalho, G., and Reis, M. A. M. (2014). The effect of substrate competition on the metabolism of polyphosphate accumulating organisms (PAOs). Water Res. 64, 149–159. doi:10.1016/j.watres.2014.07.004
Coats, E. R., Eyre, K., Bryant, C., Woodland, T., and Brinkman, C. K. (2018). Assessing the effects of RAS fermentation on EBPR performance and associated microbial ecology. Water Environ. Res. 90 (7), 659–671. doi:10.2175/106143017x15131012153130
Danesh, S., and Oleszkiewicz, J. A. (1997). Volatile fatty acid production and uptake in biological nutrient removal systems with process separation. Water Environ. Res. 69, 1106–1111. doi:10.2175/106143097X125830
Di Costanzo, N., Cesaro, A., Di Capua, F., and Esposito, G. (2021). Exploiting the nutrient potential of anaerobically digested sewage sludge: a review. Energies 14 (23), 8149. doi:10.3390/en14238149
Downing, L., Dunlap, P., Tse, Y., Sabba, F., Loconsole, J., Alvia, I., et al. (2022). Practices to enhance internal fermentation of side-stream secondary sludge and mixed liquor suspended solids for biological phosphorus removal. Project 4975. Denver, CO: The Water Research Foundation.
Drewnowski, J., and Makinia, J. (2013). Modeling hydrolysis of slowly biodegradable organic compounds in biological nutrient removal activated sludge systems. Water Sci. Technol. 67 (9), 2067–2074. doi:10.2166/wst.2013.092
Elefsiniotis, P., and Oldham, W. K. (1994). Anaerobic acidogenesis of primary sludge: the role of solids retention time. Biotechnol. Bioeng. 44, 7–13. doi:10.1002/bit.260440103
Gao, H., Zhao, X., Zhou, L., Sabba, F., and Wells, G. F. (2020). Differential kinetics of nitrogen oxides reduction leads to elevated nitrous oxide production by a nitrite fed granular denitrifying EBPR bioreactor. Environ. Sci. Water Res. Technol. 6 (4), 1028–1043. doi:10.1039/c9ew00881k
Gao, J., Peng, Y., Li, Y., and Wang, H. (2020). Characterization of primary sludge organic matter and nutrient distribution in a full-scale wastewater treatment plant. J. Environ. Sci. 95, 120–131. doi:10.1016/j.jes.2020.05.030
Gavala, H. N., Yenal, U., Skiadas, I. V., Westermann, P., and Ahring, B. K. (2003). Mesophilic and thermophilic anaerobic digestion of primary and secondary sludge. Effect of pre-treatment at elevated temperature. Water Res. 37 (19), 4561–4572. doi:10.1016/S0043-1354(03)00401-9
Gómez, X., Cuetos, M. J., Prieto, J. I., and Morán, A. (2009). Bio-hydrogen production from waste fermentation: mixing and static conditions. Renew. Energy 34 (4), 970–975. ISSN 0960-1481. doi:10.1016/j.renene.2008.08.011
Gujer, W., and Zehnder, A. J. B. (1983). Conversion processes in anaerobic digestion. Water Sci. Technol. 15 (8/9), 127–167. doi:10.2166/wst.1983.0164
Guo, H., Oosterkamp, M. J., Tonin, F., Hendriks, A., Nair, R., van Lier, J. B., et al. (2021). Reconsidering hydrolysis kinetics for anaerobic digestion of waste activated sludge applying cascade reactors with ultra-short residence times. Water Res. 202 (2021), 117398. doi:10.1016/j.watres.2021.117398
Huang, X., Dong, W., Wang, H., and Feng, Y. (2018). Role of acid/alkali-treatment in primary sludge anaerobic fermentation: insights into microbial community structure, functional shifts and metabolic output by high-throughput sequencing. Bioresour. Technol. 249 (2018), 943–952. doi:10.1016/j.biortech.2017.10.104
Kehrein, P., van Loosdrecht, M., Osseweijer, P., Garfi, M., Dewulf, J., and Posada, J. (2020). A critical review of resource recovery from municipal wastewater treatment plants – market supply potentials, technologies and bottlenecks. Environ. Sci. Water Res. Technol. 6, 877–910. doi:10.1039/c9ew00905a
Kim, H. W., Nam, J. Y., Kang, S. T., Kim, D. H., Jung, K. W., and Shin, H. S. (2012). Hydrolytic activities of extracellular enzymes in thermophilic and mesophilic anaerobic sequencing-batch reactors treating organic fractions of municipal solid wastes. Bioresour. Technol. 110, 130–134. doi:10.1016/j.biortech.2012.01.146
Lu, X., Zhang, X., and Zhao, Y. (2019). Nitrogen and phosphorus content of bacterial biomass in wastewater treatment systems. Sci. Total Environ. 671, 836. doi:10.1016/j.scitotenv.2019.03.128
McNamara, P., Sabba, F., Redmond, E., Dunlap, P., Worley-Morse, T., Marks, C., et al. (2022). Post aerobic digestion (PAD) is a solids sidestream nutrient removal process that utilizes native carbon: performance and key operational parameters from two full-scale PAD reactors. Environ. Sci. Adv. 1, 216–228. doi:10.1039/d2va00045h
Miron, Y., Zeeman, G., Van Lier, J. B., and Lettinga, G. (2000). The role of sludge retention time in the hydrolysis and acidification of lipids, carbohydrates and proteins during digestion of primary sludge in CSTR systems. Water Res. 34 (5), 1705–1713. doi:10.1016/s0043-1354(99)00280-8
Nielsen, P. H., McIlroy, S. J., Albertsen, M., and Nierychlo, M. (2019a). Re-evaluating the microbiology of the enhanced biological phosphorus removal process. Curr. Opin. Biotechnol. 57, 111–118. doi:10.1016/j.copbio.2019.03.008
Oehmen, A., Lemos, P. C., Carvalho, G., Yuan, Z. G., Keller, J., Blackall, L. L., et al. (2007). Advances in enhanced biological phosphorus removal: from micro to macro scale. Water Res. 41, 2271–2300. doi:10.1016/j.watres.2007.02.030
Ozyildiz, G., Zengin, G. E., Güven, D., Cokgor, E., Özdemir, O., Hauduc, H., et al. (2023). Restructuring anaerobic hydrolysis kinetics in plant-wide models for accurate prediction of biogas production. Water Res. 245 (2023), 120620. ISSN 0043-1354. doi:10.1016/j.watres.2023.120620
Pfeffer, J. T. (1974). Temperature effects on anaerobic fermentation of domestic refuse. Biotechnol. Bioeng. 16, 771–787. doi:10.1002/bit.260160607
Roots, P., Wang, Y., Rosenthal, A. F., Griffin, J. S., Sabba, F., Petrovich, M., et al. (2019). Comammox Nitrospira are the dominant ammonia oxidizers in a mainstream low dissolved oxygen nitrification reactor. Water Res. 157, 396–405. doi:10.1016/j.watres.2019.03.060
Sabba, F., Farmer, M., Jia, Z., Di Capua, F., Dunlap, P., Barnard, J., et al. (2023). Impact of operational strategies on a sidestream enhanced biological phosphorus removal (S2EBPR) reactor in a carbon limited wastewater plant. Sci. Total Environ. 857 (Part 1), 159280. 2023, 159280, ISSN 0048-9697. doi:10.1016/j.scitotenv.2022.159280
Sabba, F., McNamara, P., Redmond, E., Ruff, C., Young, M., and Downing, L. (2022). Lab-scale data and microbial community structure suggest shortcut nitrogen removal as the predominant nitrogen removal mechanism in post-aerobic digestion (PAD). Water Environ. Res. a Res. Publ. Water Environ. Fed. 94, e10762. doi:10.1002/wer.10762
Shen, N., and Zhou, Y. (2016). Enhanced biological phosphorus removal with different carbon sources. Appl. Microbiol. Biotechnol. 100 (11), 4735–4745. doi:10.1007/s00253-016-7518-4
Tchobanoglous, G., Stensel, D. H., and Burton, L. F. (2014). Wastewater engineering: treatment and resource recovery. New York: McGraw-Hill Higher Education.
Vale, P., Barnard, J. L., Thomas, D., and Dold, P. (2008). “RAS fermentation to enhance biological phosphorus removal,” in Proceedings of the WEFTEC 2008 conference.
Van Haandel, A. C., and Lettinga, G. (1994). Anaerobic sewage treatment: a practical guide for regions with a hot climate. Chichester, UK: John Wiley and Sons.
Vavilin, V. A., Fernandez, B., Palatsi, J., and Flotats, X. (2008). Hydrolysis kinetics in anaerobic degradation of particulate organic material: an overview. Waste Manag. 28 (6), 939–951. doi:10.1016/j.wasman.2007.03.028
Veeken, A., and Hamelers, B. (1999). Effect of temperature on hydrolysis rates of selected biowaste components. Bioresour. Technol. 69, 249–254. doi:10.1016/s0960-8524(98)00188-6
Vollertsen, J., Petersen, G., and Borregaard, V. R. (2006). Hydrolysis and fermentation of activated sludge to enhance biological phosphorus removal. Water Sci. Technol. 53 (12), 55–64. doi:10.2166/wst.2006.406
Winkler, M., Coats, E. R., and Brinkman, C. K. (2011). Advancing post-anoxic denitrification for biological nutrient removal. Water Res. 45 (18), 6119–6130. doi:10.1016/j.watres.2011.09.006
Wu, H., and Vaneeckhaute, C. (2022). Nutrient recovery from wastewater: a review on the integrated Physicochemical technologies of ammonia stripping, adsorption and struvite precipitation. Chem. Eng. J. 433, 133664. doi:10.1016/j.cej.2021.133664
Wu, H., Yang, D., Zhou, Q., and Song, Z. (2009). The effect of pH on anaerobic fermentation of primary sludge at room temperature. J. Hazard. Mater. 172 (Issue 1), 196–201. doi:10.1016/j.jhazmat.2009.06.146
Wu, H., Yang, D., Zhou, Q., and Song, Z. (2009). The effect of pH on anaerobic fermentation of primary sludge at room temperature. J. Hazard. Mater. 172 (1), 196–201. doi:10.1016/j.jhazmat.2009.06.146
Yuan, Q., Sparling, R., and Oleszkiewicz, J. A. (2011). VFA generation from waste activated sludge: effect of temperature and mixing. Chemosphere 82 (4), 603–607. doi:10.1016/j.chemosphere.2010.10.084
Zekker, I., Artemchuk, O., Rikmann, E., Ohimai, K., Dhar Bhowmick, G., Madhao Ghangrekar, M., et al. (2021a). Start-up of anammox SBR from non-specific inoculum and process acceleration methods by hydrazine. Water 13, 350. doi:10.3390/w13030350
Keywords: carbon diversion, hydrolysis, fermentation, carbon speciation, sustainable nutrient management
Citation: Cecconi F, Pifer L, Sabba F and Downing L (2024) Improving carbon management through maximizing hydrolysis and fermentation at water resource recovery facilities . Front. Environ. Eng. 3:1378621. doi: 10.3389/fenve.2024.1378621
Received: 29 January 2024; Accepted: 25 April 2024;
Published: 23 May 2024.
Edited by:
Nehreen Majed, University of Asia Pacific, BangladeshCopyright © 2024 Cecconi, Pifer, Sabba and Downing. This is an open-access article distributed under the terms of the Creative Commons Attribution License (CC BY). The use, distribution or reproduction in other forums is permitted, provided the original author(s) and the copyright owner(s) are credited and that the original publication in this journal is cited, in accordance with accepted academic practice. No use, distribution or reproduction is permitted which does not comply with these terms.
*Correspondence: Fabrizio Sabba, c2FiYmFmQGJ2LmNvbQ==
†ORCID: Fabrizio Sabba, orcid.org/0000-0002-6369-9432
Disclaimer: All claims expressed in this article are solely those of the authors and do not necessarily represent those of their affiliated organizations, or those of the publisher, the editors and the reviewers. Any product that may be evaluated in this article or claim that may be made by its manufacturer is not guaranteed or endorsed by the publisher.
Research integrity at Frontiers
Learn more about the work of our research integrity team to safeguard the quality of each article we publish.