 Junhua Wei1
 Na Wei
- 1State Key Laboratory of Eco-Hydraulics in Northwest Arid Region of China, Xi'an University of Technology, Xi'an, China
- 2Shaanxi Provincial Institute of Water Resources and Electric Power Survey and Design Research, Xi'an, China
Introduction: As a typical ecologically fragile area, Shaanxi Province has a prominent contradiction between sustainable economic development and ecological environmental protection, and ecological compensation is needed. Existing studies predominantly focus on single ecosystems, often neglecting the supply-demand relationship between human and nature, the ability to pay compensation amount and the economic development level at the same time, resulting in poor operability.
Methods: In view of this, this paper introduces the adjustment coefficient of payment capacity and the adjustment coefficient of economic level to modify ecosystem service value (ESV). By coupling the improved ESV and ecological footprint model, the ecological compensation amount of Shaanxi Province was calculated.
Results: The results show that: (1) The improved ESV of Shaanxi Province in 2022 was 6.174 billion CNY. Among them, the ESV of forest and water area were as high as 4.884 billion CNY and 485 million CNY, respectively, accounting for 86.98% of the total ESV. In addition, the value of regulating service accounted for the largest proportion of ESV in all services, reaching 68.7%. (2) The ecological footprint (EF) of Shaanxi Province in 2022 was 134.2669 million hectares but the total ecological carrying capacity (ECC) was 14.262 million hectares. The ecosystems with the most serious ecological deficit were fossil energy land and farmland. (3) The ecological overload index (EFI) of Shaanxi Province in 2022 was −8.41, which means that the resources of the whole province were seriously in short supply.
Discussion: As the payer of ecological compensation, the amount of compensation was 51.947 billion CNY. This study comprehensively considers the supply-demand relationship between human and nature, regional payment capacity and economic development level, so that the proposed ecological compensation scheme can better meet the actual needs and has strong operability, which provides a valuable reference for implementing ecological compensation and advancing environmental protection in Shaanxi Province.
1 Introduction
With the rapid development of the global economy and the accelerating process of urbanization, ecological and environmental challenges have become increasingly prominent, resulting in significant ecological degradation (Ariken et al., 2021; Zhu et al., 2025). Simultaneously, global carbon emissions are unevenly distributed (Chancel, 2022), with substantial disparities in economic development levels across regions. Especially in China, the spatial and temporal characteristics of carbon emissions vary considerably between regions (Liu et al., 2023; Jia et al., 2023), exacerbating social inequities and intensifying ecological pressures. The concept of ecological compensation emerged in the early 1980s. As an important policy tool, ecological compensation aims to promote ecological protection and sustainable development among different regions through rational allocation of resources and environmental benefits. This approach not only facilitates regional economic balance and ecological restoration but also serves as a critical strategy for advancing green and low-carbon transformation and addressing climate change. It plays a vital role in mitigating the tension between environmental protection and economic growth (Nie et al., 2024). In 2005, the Chinese government incorporated the core principle of ecological compensation—“those who develop must protect, and those who benefit must compensate”—into the “11th Five-Year Plan.” Since then, research and practical efforts in this field have deepened significantly. A series of policies and measures have been successively introduced, marking steady progress in ecological compensation legislation. Table 1 below outlines the development milestones of ecological compensation laws in China.
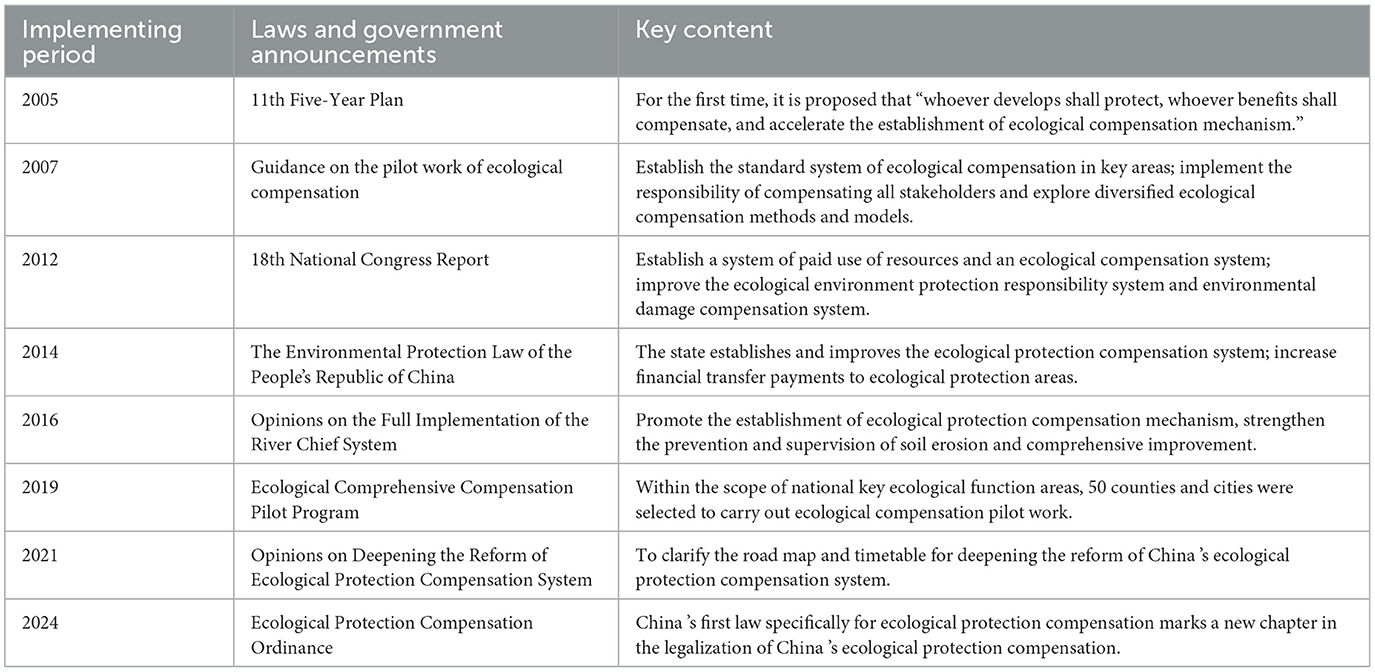
Table 1. The development milestones of ecological compensation law in China.
In order to respond to relevant policies and measures, all over the country within the scope of key ecological function areas, give priority to choose concentrated contiguous destitute areas and areas with good ecological protection compensation as ecological compensation pilot, carry out ecological compensation research, its core is the ecological compensation mechanism. The main challenge in developing such a mechanism is accurately determining compensation standards and clearly identifying the stakeholders involved—namely, “how much to compensate,” “who to compensate,” and “compensation to whom.” By setting clear ecological compensation standards, the compensation amount can be precisely calculated, addressing the question of “how much to compensate” and facilitating the implementation of these standards. The ecosystem services value (ESV) is closely related to the ecological compensation amount. By evaluating ESV, the contribution of ecosystems to human wellbeing can be quantified, providing a scientific basis for the implementation of ecological compensation (Zhong et al., 2020). The ESV was first proposed in the 1960s, which reflects the value of various service functions provided by different ecosystems in a certain area (Guan et al., 2024). In recent years, two primary methods for evaluating ESV have been widely adopted in academia: functional value method and equivalent factor method. The functional value method mainly includes market value method (Jin et al., 2024; Balasubramanian and Sangha Kamaljit, 2023), carbon tax method (Richardson et al., 2015), etc. However, due to the complexity and diversity of its formulas, it is difficult to standardize evaluation methods and parameters, which limits the comparability of results (Yu et al., 2020). Moreover, this approach involves high implementation costs and is mainly suitable for small-scale applications. Equivalent factor method was proposed by Costanza et al. (1998). Compared with the functional value method, the equivalent factor method requires less data and has a unified subsystem classification standard and a benchmark equivalent factor table. After verification and revision by many domestic scholars, this method has become a widely applicable comprehensive value assessment system (Xie et al., 2015a; Chen et al., 2023; Ren et al., 2022). The calculation of this method is relatively simple and has horizontal comparability (Shao et al., 2021). Therefore, the equivalent factor method can estimate ESV on a large scale more effectively.
In addition to quantifying ecological compensation standards, accurately identifying the stakeholders involved—namely, the subject and object of ecological compensation—is essential for establishing an effective ecological compensation mechanism (Yuan and Zhou, 2014). The ecological footprint (EF) method offers a valuable approach for this purpose. It quantifies the consumption of ecological resources driven by economic and social development, evaluates whether a region experiences an ecological surplus or deficit, and helps distinguish the payer and recipient of ecological compensation. This directly addresses the key questions of “who to compensate,” and “compensation to whom,” which has important reference value for the calculation of ecological compensation standards. Rees (1992) proposed the concept of ecological footprint (EF), which is the conversion of the human consumed natural resources and generated waste into bio-productive land area through the coefficients (Dai et al., 2023), which reflects the degree of human utilization of the resources generated by the ecosystems. Wackernagel and Rees (1997) later refined and popularized this concept, and proposed the ecological footprint model. By comparing the EF with the ecological carrying capacity (ECC), the difference between the two can reflect the supply-demand relationship between human demand and the resources provided by ecosystems, and then analyze the ecological surplus and deficit state of the region, which can provide a basis for the calculation of the ecological compensation amount, so as to measure the ecological compensation more scientifically (Xu and Zheng, 2017). In recent years, the ecological footprint model has been extensively studied and applied across various scales. Scholars have conducted theoretical and practical research, employing the model to analyze ecological compensation in contexts ranging from national (Pençe et al., 2024) and provincial (Liu and Lei, 2018; Jia et al., 2010) scales to more localized applications, such as universities (Liu et al., 2024) and reservoirs (Jing et al., 2024).
In recent years, numerous scholars have taken the Yangtze River (Guan et al., 2022; Ling et al., 2023; Mao and Niu, 2024), Lishui River Basin (Guo and Shen, 2017) and Three Gorges Reservoir Area (Zhou et al., 2018) as examples, combined ESV assessment with ecological footprint model, and conducted a large number of empirical studies on ecological compensation around various river basins and water areas. Combining the two can effectively solve the problems of “how much to compensate,” “who to compensate,” and “compensation to whom.” On the whole, the existing studies have proposed various approaches for calculating ecological compensation. However, there are few existing ecological compensation calculation methods that simultaneously consider the supply-demand relationship between human and nature, the ability of the study area to pay compensation amount and the level of economic development. Consequently, the resulting ecological compensation mechanisms are often inefficient, fail to meet practical requirements, and are challenging to implement effectively.
Shaanxi Province, as an important province in the western region, is the major ecological barrier in the middle reaches of the Yellow River basin and an important base of national energy and resources. However, with the vigorous development of the economy and the accelerating process of industrialization and urbanization, the ecological environment of Shaanxi Province is facing serious soil erosion, expansion of ecologically fragile areas, excessive resources consumption and reduction of biodiversity. At present, Shaanxi is in a critical period of economic transformation and the pursuit of sustainable development, and carbon emissions are at a high level (Guo et al., 2024). It is urgent to accelerate the work of ecological compensation. A large number of scholars have carried out research on ecological compensation in Shaanxi Province. Ma and Gao (2020) analyzed the impact of ecological compensation policies on farmers' income and satisfaction through a field survey of farmers in public welfare forest areas in Shaanxi Province, and provided a reference for further improving ecological compensation policies. Jin et al. (2015) proposed a compensation zoning scheme from the dual perspectives of food security and ecological security through the regional differentiation analysis of the economic compensation policy for cultivated land protection in Shaanxi Province, which provided valuable policy suggestions for the sustainable development of cultivated land protection. However, the current research on ecological compensation in Shaanxi Province mainly focuses on a single ecosystem, and the research results are not universal. Therefore, it is urgent to explore an effective and suitable ecological compensation method for Shaanxi Province to maintain the balance between economic development and ecological environment protection.
In view of this, this paper takes Shaanxi Province as the research object, and uses the ecological compensation method which coupling improved ESV—EF model to carry out ecological compensation research on farmland, forest, grassland, wetland, water area and other ecosystems. Firstly, the ESV of multiple ecosystems in Shaanxi Province was calculated, and the payment capacity adjustment coefficient and the economic level adjustment coefficient were used to correct the ESV. Analyze the proportion of ESV and the causes behind it from the perspective of ecosystem and service function. Secondly, the EF and ECC of multiple ecosystems were calculated by using the ecological footprint model. By comparing the two, the ecological surplus and deficit state of Shaanxi Province can be clarified, that is, to solve the problem of “who to compensate” and “compensation to whom.” Finally, the improved ESV and EF model were coupled to quantify the amount of ecological compensation in Shaanxi Province, that is, “how much to compensate.” This method provides a new perspective for ecological compensation research in Shaanxi Province, and provides a basis for the coordination of ecological environment protection and sustainable economy development.
2 Materials and methods
2.1 Study area
Shaanxi Province occupies 205,624.3 km2 and is situated in the northwest Chinese inland region, as shown in Figure 1. The province features a long and narrow geographical shape extending from north to south and encompasses diverse landforms, including plateaus, mountains, and plains. Its topography is characterized by higher elevations in the north and south and lower elevations in the central region, resulting in a wide range of natural landscapes and ecosystems. The climate in most parts of Shaanxi is dry, which belongs to the temperate and north subtropical monsoon climate. The annual average temperature is between 9 and 16 degrees Celsius, and the annual average precipitation is between 340 and 1,240 mm. The precipitation is more in the south and less in the north. Shaanxi Province spans the Yellow River basin and the Yangtze River basin. The areas of the Yellow River and Yangtze River basins within the province are 132,900 and 72,700 km2, respectively, accounting for 64.7 and 35.3% of the province's total area.
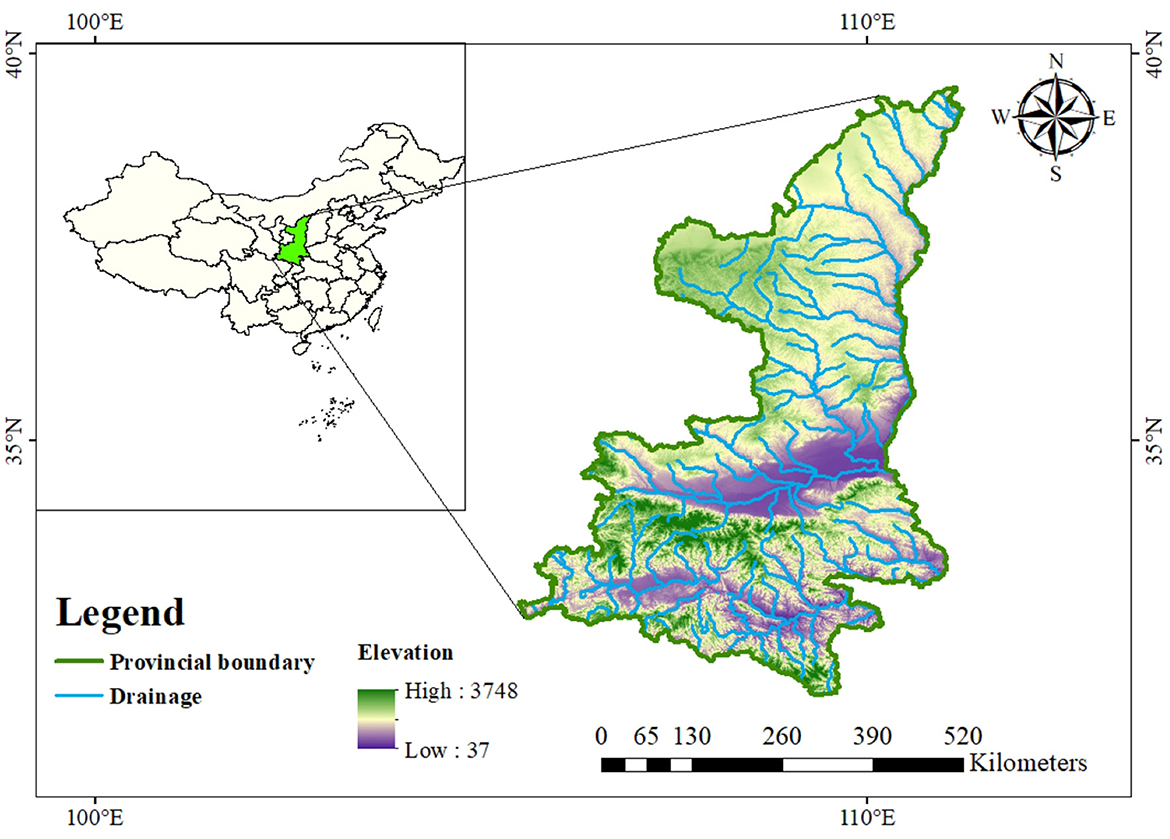
Figure 1. Geographical map of Shaanxi Province.
By the end of 2022, Shaanxi Province had a permanent population of 39.56 million, representing 2.80% of China's total population. With a population density of 192 people per square kilometer, the land area comprises only 2.12% of China. In particular, the provincial capital, Xi'an, houses 13 million permanent residents, accounting for 32.86% of Shaanxi's population. With a population density of 1,286 people per square kilometer, the land area accounts for 4.92% of Shaanxi. In general, the population distribution is relatively dense, and the carrying capacity of the population is relatively heavy. In 2022, the GDP (Gross Domestic Product) of Shaanxi reached 3,277.268 billion CNY, accounting for 2.56% of the national GDP, and the per capita disposable income was 30,116 CNY, which was in the lower middle stage. In addition, as an ecologically fragile region and an underdeveloped region in western China, Shaanxi faces severe challenges between economic development and ecological environment, and it is urgent to carry out ecological compensation research.
2.2 Data sources
Data on ESV, EF, ECC, and ecological compensation for Shaanxi Province in 2022 were collected from sources such as the “China Statistical Yearbook 2023,” “Shaanxi Statistical Yearbook 2023,” and other relevant official websites. And then the state of ecological surplus or ecological deficit and the final ecological compensation amount of Shaanxi Province in 2022 were analyzed. The research area comprises several land types such as farmland, forest, grassland, wetland, desert, water area, construction land and fossil energy land. Relevant data were organized and summarized based on the specific calculation requirements, as presented in Table 2.
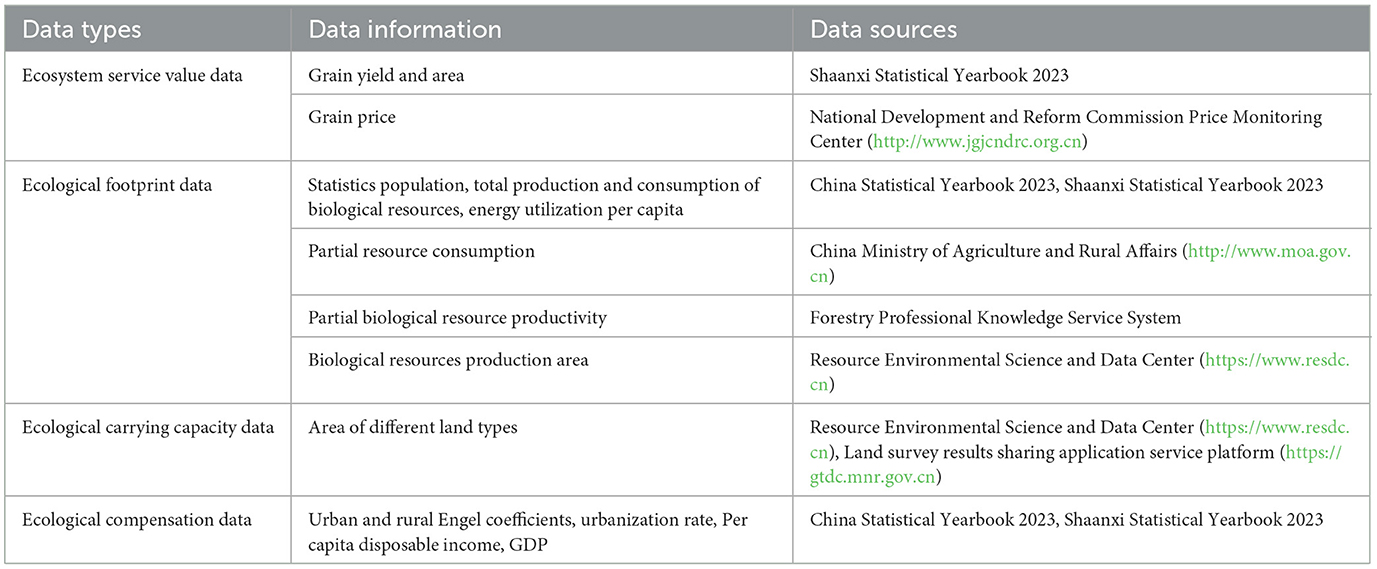
Table 2. Data types and sources.
2.3 Research methods
The calculation method of ecological compensation coupling improved ESV and EF model is illustrated in Figure 2. The process involves three primary steps: (1) Improved ESV. Based on the specific characteristics of the study area, relevant ecosystem service functions were identified. The equivalent factor table was localized to align with regional conditions, and the ESV was calculated using the equivalent factor method. Subsequently, the ESV was improved by the adjustment coefficients for payment capacity and economic development level. (2) EF model. The consumption items were chosen according to the specific situation of the study area, and the correlation coefficient was used to convert resource consumption into land area, and the EF was calculated. Ecosystems with the ability to support ECC were chosen, and convert their land areas based on the correlation coefficients to calculate the ECC. Based on the ecological footprint model, the ecological surplus or deficit status of the study area was determined, so as to judge the study area as the payer or recipient of ecological compensation, and the EFI was calculated. (3) Ecological compensation. By coupling the improved ESV and EFI, the ecological compensation amount was calculated.
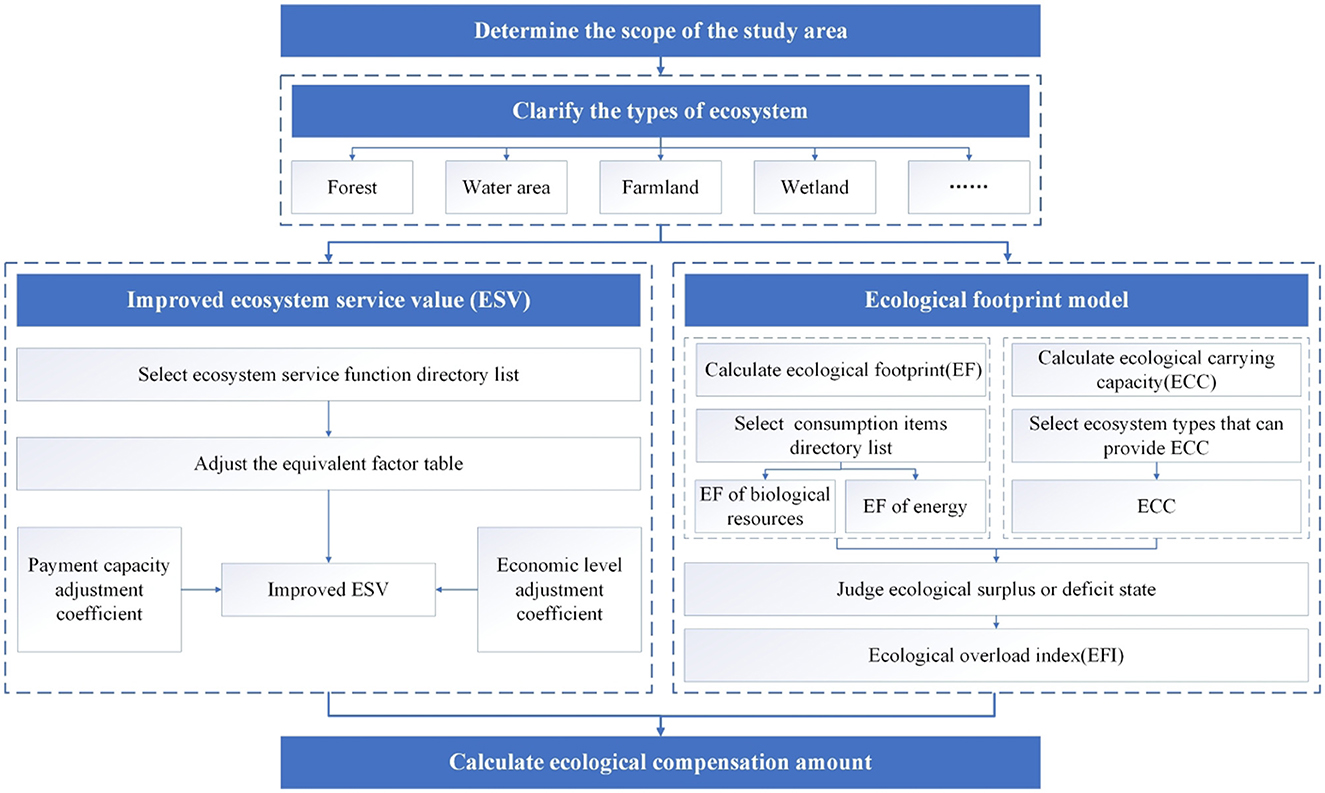
Figure 2. Framework diagram of research method.
2.3.1 Improved ecosystem service value
The equivalent factor method has the advantage of having a unified subsystem classification standard and a benchmark equivalent factor table of ESV per unit area. Therefore, it is suitable for the study of ESV at a large watershed scale (Shao et al., 2021). This method requires fewer data inputs and involves simpler calculations. Given the extensive scale of Shaanxi Province and the challenges in obtaining comprehensive ecological data, this study employs the equivalent factor method to calculate ESV.
In the equivalent factor method, the national average net profit of grain production per unit area of farmland ecosystem is taken as an equivalent factor of ESV, which is used as a reference to establish the equivalent factor table containing different ecosystems, and the service values corresponding to different ecosystems can be calculated (Wackernagel, 1998). Additionally, studies have shown that without human intervention, the value of original ecological services that natural ecosystems provide is only one seventh of the food market value provided by the unit farmland area under the condition of human intervention (Yu et al., 2023). Then, ESV per unit area is multiplied by the corresponding equivalent factor value, and ESV can be obtained by combining the area of each ecosystem (Li et al., 2015). The calculation process of ESV has been displayed in Equations 1 and 2.
In the formula, ESVij is the total ESV of the i-th ecosystem service function under the j-th ecosystem, in billions of CNY; eij is the equivalent factor of the i-th ecosystem service function under the j-th ecosystem; the type of ecological service function that is i; j represents the kinds in the ecosystem; Aj represents the area under the j-th ecosystem, hm2; Ea represents the per equivalent factor of ESV, CNY/hm2; n is the selected grain type, and this paper mainly selects corn, wheat, rice and soybean for calculation according to the actual situation of grain cultivation in Shaanxi Province; mn is the regional planting area of the n-th type of grain, hm2; pn is the national average price of the n-th type of grain, CNY/kg; qn is the regional unit area yield of the n-th type of grain, kg/hm2; M is the total area planted with n grains in the region, hm2.
Based on the current state of ecosystems and land use in Shaanxi Province, the ecosystem is primarily divided into 13 categories. Using the method of Millennium Ecosystem Assessment (MA) and the classification method of Xie et al. (2015b), the ecosystem services are divided into four categories and 11 subcategories (Table 3). At the same time, based on the equivalent factor table of ESV per unit area modified by Xie et al. (2015a), the equivalent factor values of irrigated land, arbor and garden plot are added to the equivalent factor table of Shaanxi Province by referring to the method used in previous research (Zhou et al., 2017; Cao and Liu, 2024; Peng et al., 2024). Considering the regional economic disparities, the equivalent factor table was localized. In 2022, the annual average yield per unit area of the main grain crops in Shaanxi Province was 4,301 kg/hm2, which is 0.74 times the China grain yield of 5,802 kg/hm2. Table 3 displays the revised equivalent factors of ESV in Shaanxi Province.
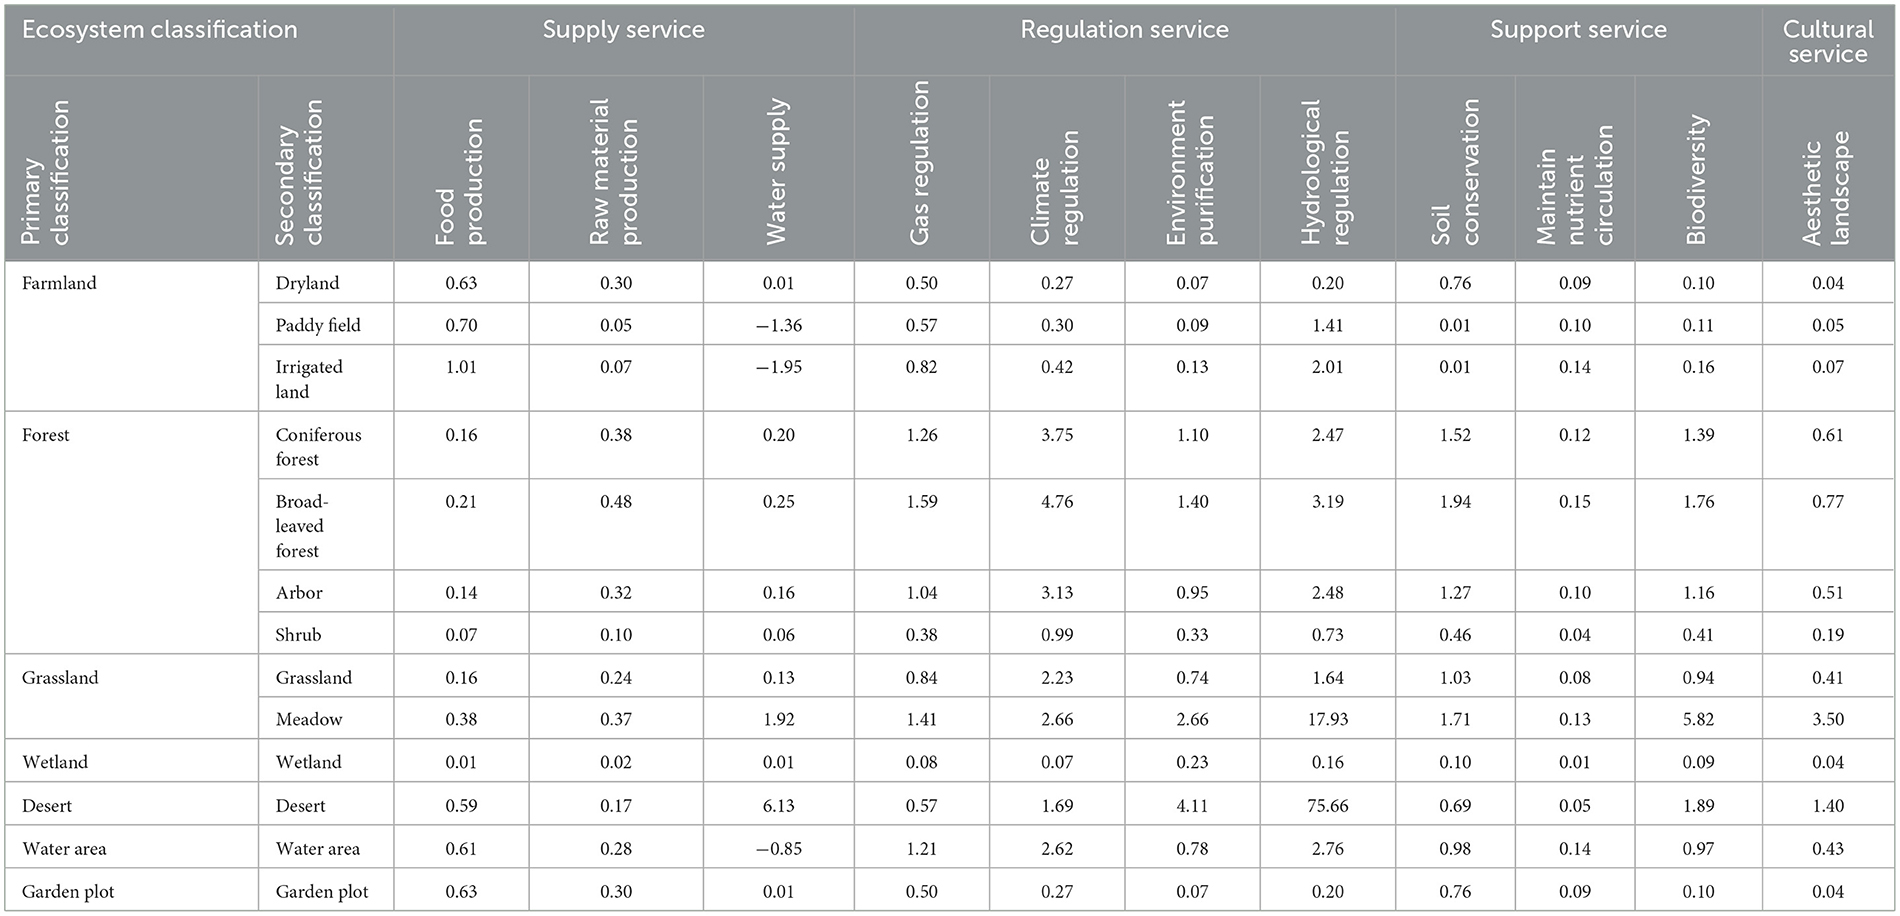
Table 3. Revised equivalent factors of ESV in Shaanxi Province.
In addition, considering the level of economic development and the ability to pay in the study area, the adjustment coefficient of payment capacity and the adjustment coefficient of economic level were introduced to modify the ESV (Zhang et al., 2015). The formula is presented in Equations 3–6.
In the formula, ESV is the improved ecosystem service value, in billions of CNY; F is the adjustment coefficient of payment capacity; K is the adjustment coefficient of economic level; f′ is the per capita disposable income of Shaanxi's residents, CNY; f is the per capita disposable income of Chinese residents, CNY; GDP′ is the annual gross domestic product of Shaanxi, CNY; GDP is Chinese Gross Domestic Product, CNY; En denotes the comprehensive Engel coefficient; Ea denotes the urban Engel coefficient; Eb denotes the rural Engel coefficient; θ denotes the degree of urbanization. The formulas demonstrate a positive correlation between the level of local socio-economic development and the region's willingness to pay for ecological compensation. Specifically, when En is smaller and f′is larger, it means the higher level of regional socio-economic development and personal living standard, and the K and F would be correspondingly larger, indicating that the willingness and the pay ability for ecological compensation are higher.
2.3.2 Ecological footprint model
2.3.2.1 Ecological footprint
EF reflects the need for natural resources in human life and production processes. It is mainly composed of the EF of biological resources and energy, which, respectively stand for the production and waste absorption functions of bio-productive land to natural resources. Based on the research results of Wackernagel and Rees (1997), bio-productive land is classified into six categories: forest, construction land, grassland, fossil energy land, farmland and water area. Through the conversion of equilibrium factors, the total EF can be obtained by converting the local consumption items into the area of bio-productive land and summing up them.
(1) Ecological footprint calculation of biological resources
Biological resources are fundamental to human survival and development. To calculate the EF of biological resources, it is essential to classify consumption items. Based on the data from the “China Statistical Yearbook 2023” and “Shaanxi Statistical Yearbook 2023,” combined with the actual conditions of Shaanxi Province, these items are categorized into four types: farmland footprint, forest footprint, grassland footprint, and water area footprint. Equation 7 illustrates the calculating procedure for the biological resources' EF (Yang and Jia, 2015):
In the formula, EFb shows the overall EF of biological resources, hm2; efb represents the per capita EF, hm2; N represents the total population of Shaanxi Province; i represents the category of consumption items for biological resources; pi represents the average production capacity of the i-th consumption item, kg/hm2; ci refers to the per capita consumption of the i-th consumption item, kg; ri is the equilibrium factor. This paper selects the suitable equilibrium factors for Shaanxi Province based on the research findings of Liu and Li (2010). The consumption items and equilibrium factors of biological resources in Shaanxi Province are shown in Table 4.
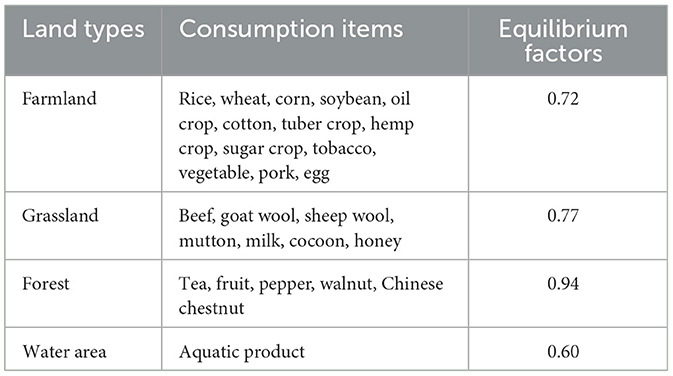
Table 4. Consumption items and equilibrium factors of biological resources in Shaanxi Province.
(2) Ecological footprint calculation of energy
According to the “Shaanxi Energy Statistics Yearbook,” the calculation of energy EF considers both fossil energy land and construction land. Equation 8 illustrates the calculation of energy EF (Niu et al., 2024):
In the formula, EFe represents the energy EF of Shaanxi Province, hm2; efe is per capita EF, hm2; N represents the total population of Shaanxi Province; j represents the category of energy consumption items; tj is Shaanxi's per capita consumption of the j-th kind of energy, tons; Rj is the energy conversion coefficient of the j-th kind of energy; Ej is the global average EF of the j-th kind of energy, GJ/hm2;rj is the equilibrium factor. The equilibrium factors of fossil energy land and construction land in this study are 0.94 and 0.72, respectively, based on the research findings of Liu and Li (2010). And the energy consumption items and their corresponding global average EF and conversion coefficients would be seen on the research findings of Wackernagel et al. (2002).
The total EF can be obtained by adding the biological resources EF and the energy EF. The calculation process has been displayed in Equation 9.
In the formula, EF represents the total EF of Shaanxi Province, hm2; EFb represents the biological resources EF of Shaanxi Province, hm2; EFe represents the energy EF of Shaanxi Province, hm2.
2.3.2.2 Ecological carrying capacity
ECC represents the supply side of EF. The types of land that can provide ECC are farmland, forest, grassland, water area, construction land, etc. Simple biological production areas do not have regional comparability due to the different production factors of various resources. Therefore, they need to be converted by equilibrium factors and yield factors (Ouyang et al., 2023), and 12% of the area set aside for biodiversity must to be subtracted, so that the regional overall ECC is 88% of the total ECC (Yang et al., 2022). In the meantime, humans have not set aside a specific land area to absorb carbon dioxide during planning due to the scarcity of land resources, which resulting in zero ECC of fossil energy land. The ECC is calculated according to Equation 10.
In the formula, ECC means the overall ECC of Shaanxi, hm2; N represents the total population of Shaanxi Province; ecc stands for per capita ECC, hm2; j is the j-th ecosystem, consisting of five types; rj is the equilibrium factor; aj is the per capita land area, hm2; yj is the yield factor. The yield factors suitable for Shaanxi province are selected based on the research findings of Liu et al. (2010), including 0.51 for farmland, 0.83 for forest, 2.16 for grassland, 2.16 for water area, and 0.51 for construction land.
2.3.2.3 Ecological overload index
EF and ECC jointly determine the ecological surplus or deficit state of the region, which subsequently indicates whether the region is a payer or recipient of ecological compensation. The framework theory is shown in Figure 3. When the ECC is bigger than the EF, it indicates that the resource utilization degree does not exceed the ECC, and is in a state of ecological surplus, which can be considered as the recipient of ecological compensation. When the ECC is less than the EF, it indicates that the ECC is insufficient to meet the needs of regional resource utilization, and there is an ecological deficit that is not conducive to regional sustainable development, which can be considered as the payer of ecological compensation. When the two are equal, it indicates that the regional resource utilization level is equivalent to ECC, which is a natural equilibrium state (Galli et al., 2015). The specific calculation is shown in Equation 11.
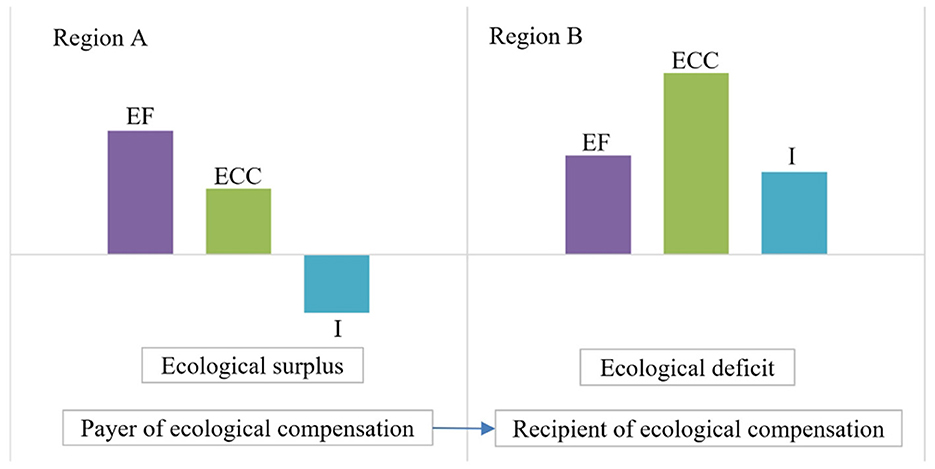
Figure 3. Framework diagram of determining whether payer or recipient of ecological compensation.
In the formula, I denotes the ecological surplus and deficit state of the region, hm2; the overall EF is represented by EF, measured in hm2; ECC refers to the overall ECC, also measured in hm2. In principle, when I>0, it is in an ecological surplus state and accepts ecological compensation; when I < 0, there is an ecological deficit state and pays ecological compensation; when I = 0, it is in a natural equilibrium state.
The ecological overload index (EFI) can reflect the balance between supply and demand of local resource, and reflect the level of local ecological resource utilization (Wackernagel, 1999). More importantly, it can combine ESV with EF to achieve the calculation of ecological compensation. The formula of EFI is given in Equation 12.
Where, EFI stands for EFI; the overall EF is represented by EF, measured in hm2; ECC refers to the overall ECC, also measured in hm2. When EFI is positive, there is an ecological surplus. The larger the value, the greater the ecological surplus in the region. When EFI is negative, there is an ecological deficit. The lower the value, the more serious the ecological deficit. When EFI is equal to 0, it represents the rational utilization of natural resources and the supply-demand balance of resources in the region.
2.3.3 Ecological compensation
Determining a reasonable amount of ecological compensation requires consideration of both ecological and economic factors. Therefore, in the calculation of ecological compensation, this paper uses the theories and methods of ESV and EF model. ESV is modified based on the regional economic development level and the pay ability, and EFI is used to express the level of resource utilization. The calculation formula is given in Equation 13.
In the formula, E is the amount of ecological compensation that the region must pay or accept, in billions of CNY, ESV is the improved ecosystem service value, in billions of CNY; the EFI is referred to as EFI.
3 Results
3.1 Analysis of improved ecosystem service value
Based on the existing data, the per unit area ESV in Shaanxi Province could be calculated, as shown in Table 5.
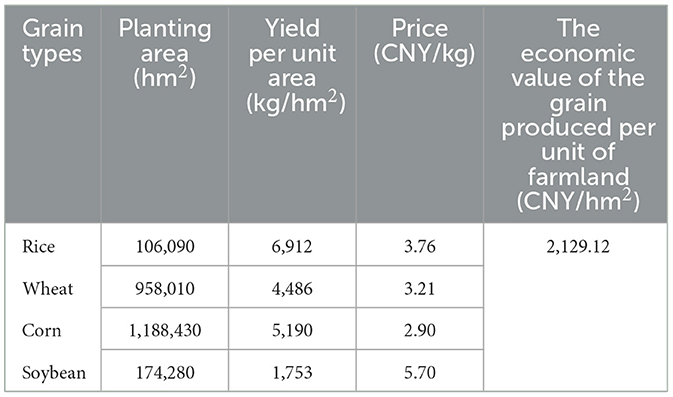
Table 5. Per unit area ESV of Shaanxi Province in 2022.
According to the above data, the per unit area ESV in Shaanxi Province in 2022 was 2,129.12 CNY/hm2. Multiply it with the ecosystem service equivalent factor, and according to the area of each ecosystem, the ecological service function values corresponding to different types of ecosystems were calculated by Equation 1. Based on the data from “China Statistical Yearbook 2023” and “Shaanxi Statistical Yearbook 2023,” China's per capita disposable income in 2022 was 36,883 CNY, while Shaanxi's per capita disposable income was 30,116 CNY. Consequently, the payment capacity adjustment coefficient was 81.65%. The urban Engel coefficient was 27.44%, the rural Engel coefficient was 29.72%, and the urbanization rate was 64.02%. Consequently, the comprehensive Engel coefficient was 0.28. The GDP of Shaanxi Province accounted for 2.56% of the national GDP, so the economic level adjustment coefficient of Shaanxi Province was 1.46%. The improved ESV was finally calculated by Equation 3, as shown in Figure 4. We can see that:
(1) The estimated ESV in Shaanxi Province for the year 2022 was ~6.174 billion CNY. From the perspective of ecosystem, the ESV of farmland, forest, grassland, wetland, desert, water area, and garden plot were around 0.204 billion CNY, 4.884 billion CNY, 0.209 billion CNY, 0.046 billion CNY, 0.055 billion CNY, 0.485 billion CNY, and 0.290 billion CNY, respectively. From the perspective of ecosystem service functions, the ESV of supply service, regulation service, support service and cultural service were 0.366 billion CNY, 4.202 billion CNY, 1.337 billion CNY, and 0.269 billion CNY, respectively.
(2) The function values of climate regulation and hydrological regulation of forest ecosystem were significantly higher than others. Further analysis indicates that the forest has strong carbon sink function, temperature regulation function and air purification function, which can effectively regulate the climate. Additionally, forest vegetation and roots play a key role in hydrological regulation by absorbing water and transpiration to maintain regional water cycle, reducing flood risk by reducing surface runoff, and improve water quality by filtering sediments and pollutants.
(3) Most of the ESV were positive, and only the water supply function of farmland and garden plot ecosystem were negative. There are many reasons responsible for this instance, and the following are the typical ones. Farmland and garden plot typically require significant irrigation water to maintain the growth of crops and plants. Agricultural activities often involve the application of pesticides, chemical fertilizers and other agricultural chemicals, which can enter the water body through runoff, leading to water pollution. Most of the Shaanxi Province is the Loess Plateau, and the reclamation and planting of farmland have destroyed the original vegetation, caused soil erosion, and introduced significant sediment into lakes and rivers, affecting the cleanliness and ecological health of water bodies. In contrast, other ecosystems play an active role in the regulation, filtration and conservation of water resources, and each ecosystem also contributes to other functions, so they usually show positive values.
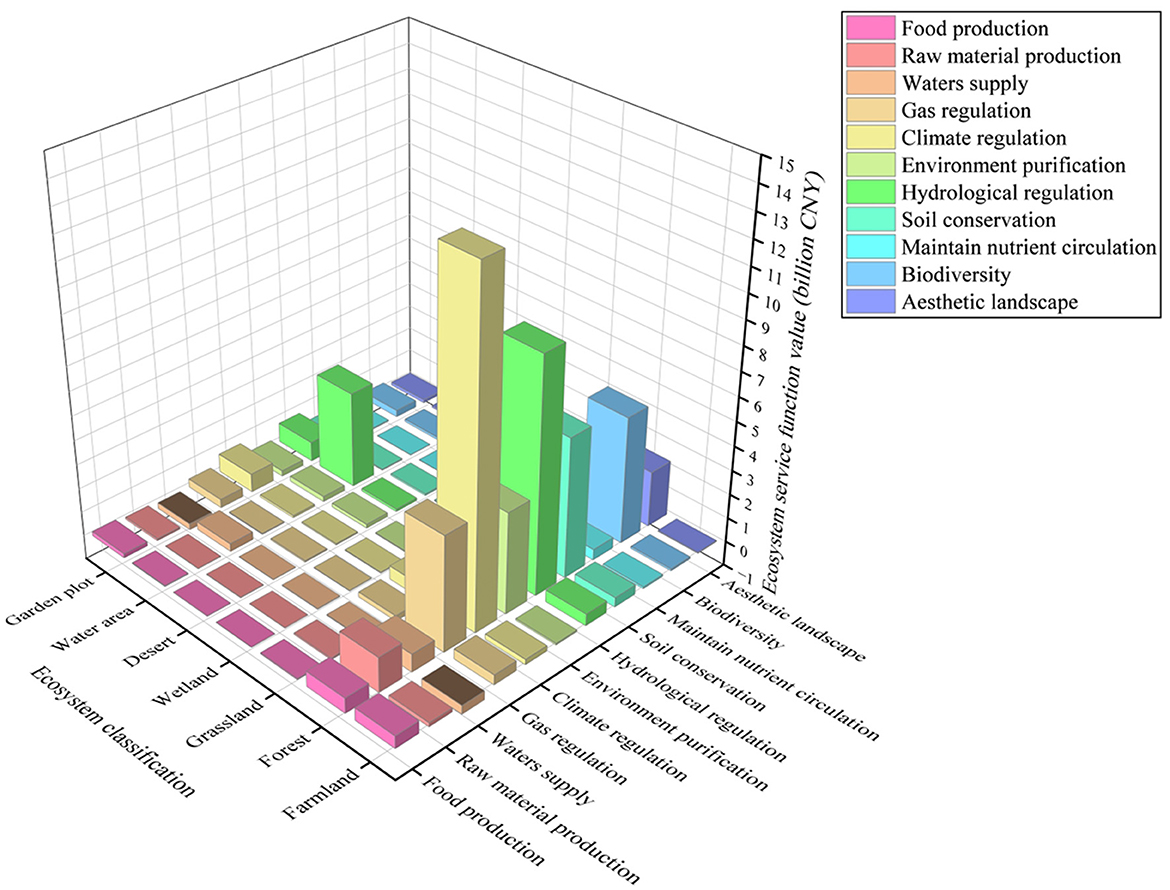
Figure 4. The ESV of Shaanxi Province.
From the perspective of ecosystem types, the ESV of different ecosystem types were added, respectively, and the value proportion diagram was drawn (Figure 5). According to the diagram, the order of service value of each ecosystem type was forest, water area, garden plot, grassland, farmland, desert, wetland. Among them, the ESV of forest was relatively high, accounting for 79.12% of the overall ESV. The ESV of water area, garden plot, grassland and farmland were relatively smaller compared with water area and forest ecosystems. The ESV of desert and wetland ecosystems were significantly low, accounting for <1% of the total ESV.
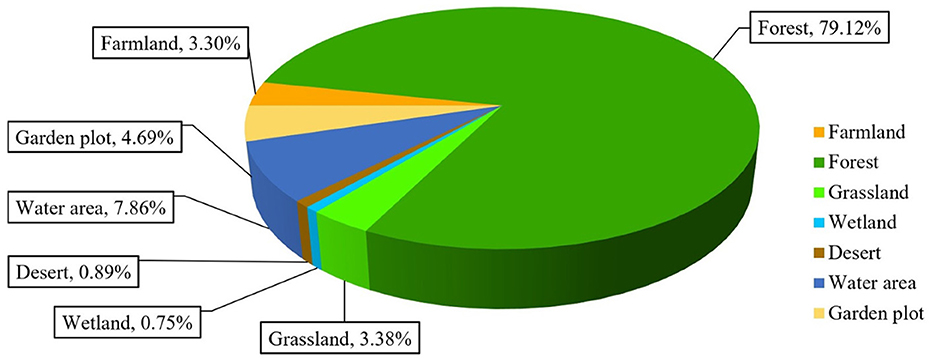
Figure 5. The proportion of ESV of different ecosystem types in Shaanxi Province in 2022.
It is evident that the contribution of ESV in Shaanxi Province is mainly concentrated in forest, water area, garden plot, grassland and farmland. Among them, forest accounted for 60.56% of the province's territory, and water area accounted for 1.00% of the province's territory. The two together provided 86.98% of the total ESV. Thus, it is necessary to protect forest ecosystem and water area ecosystem. On the basis of maintaining and repairing the existing vegetation, the farmland should be returned to forest and lake. For each orchard base in Shaanxi province, it is necessary to strengthen orchard construction and attach importance to the orchard environment. Under the guidance of the ecological integration policy, the resources of forest, water area, garden plot and grassland must be protected.
From the perspective of service function types, the values of different ecosystem service functions were added and calculated, and the value proportion diagram was drawn (Figure 6). Among the four categories of ecological service functions, the value of regulating service accounted for 68.07% of the total ESV in Shaanxi province. Supporting service accounted for 21.65% of the total ESV. The values of supply service and cultural service accounted for 5.93 and 4.35% of the total value, respectively. In addition, further analysis of the data showed that among the 11 subcategories of ecological service functions, the value of six ecosystem service functions of climate regulation, hydrological regulation, soil conservation, biodiversity, gas regulation and environment purification accounted for 88.78% of the total ESV, which were the main functions of the ecosystem in Shaanxi Province. It can be seen that the regulation service contributed the greatest percentage of the total ESV, indicating that the regulation service is crucial to Shaanxi's ecosystem. Once again, it has been proven that water area and forest are ecosystems that require key protection. In addition, Wang et al. (2010) separated ESV into two categories: market value and non-market value. Of the entire value, the non-market value accounted for about 95%, and the market value, which includes the production of food and raw material, accounted for about 5%. It shows that non-market value is crucial to the whole ecosystem services.
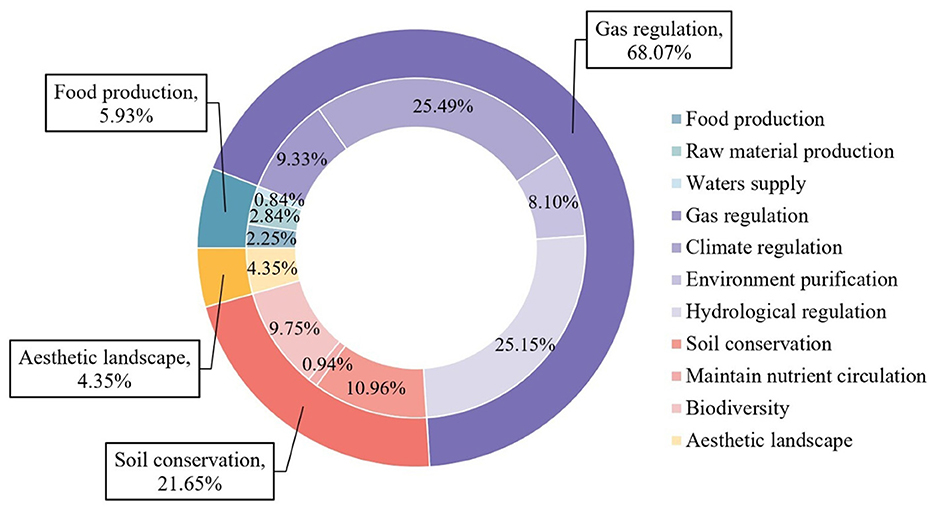
Figure 6. The proportion of different ecosystem service function values in Shaanxi Province in 2022.
3.2 Analysis of ecological footprint
3.2.1 Ecological footprint
The calculation process of EF based on the formula and related data is shown in Tables 6, 7. According to the data in the table, the EF proportion of various land types in Shaanxi Province in 2022 can be obtained, as shown in Figure 7. It can be seen that the EF of the six land types in Shaanxi Province in 2022 were successively fossil energy land, farmland, forest, grassland, construction land and water area. Among them, the EF of fossil energy land and farmland accounted for about 95.38% of the total EF, ranking the top two. In comparison, the EF of forest, grassland, construction land and water area were relatively minor. In addition, further research on fossil energy land revealed that the relatively higher consumptions were raw coal and crude oil. This shows that coal and oil are the major energy sources consumed in Shaanxi Province, but the consumption of coal and oil would aggravate environmental pollution. Therefore, Shaanxi Province should consider adjusting the energy consumption structure and promoting the development of new energy sources to mitigate environmental impact.
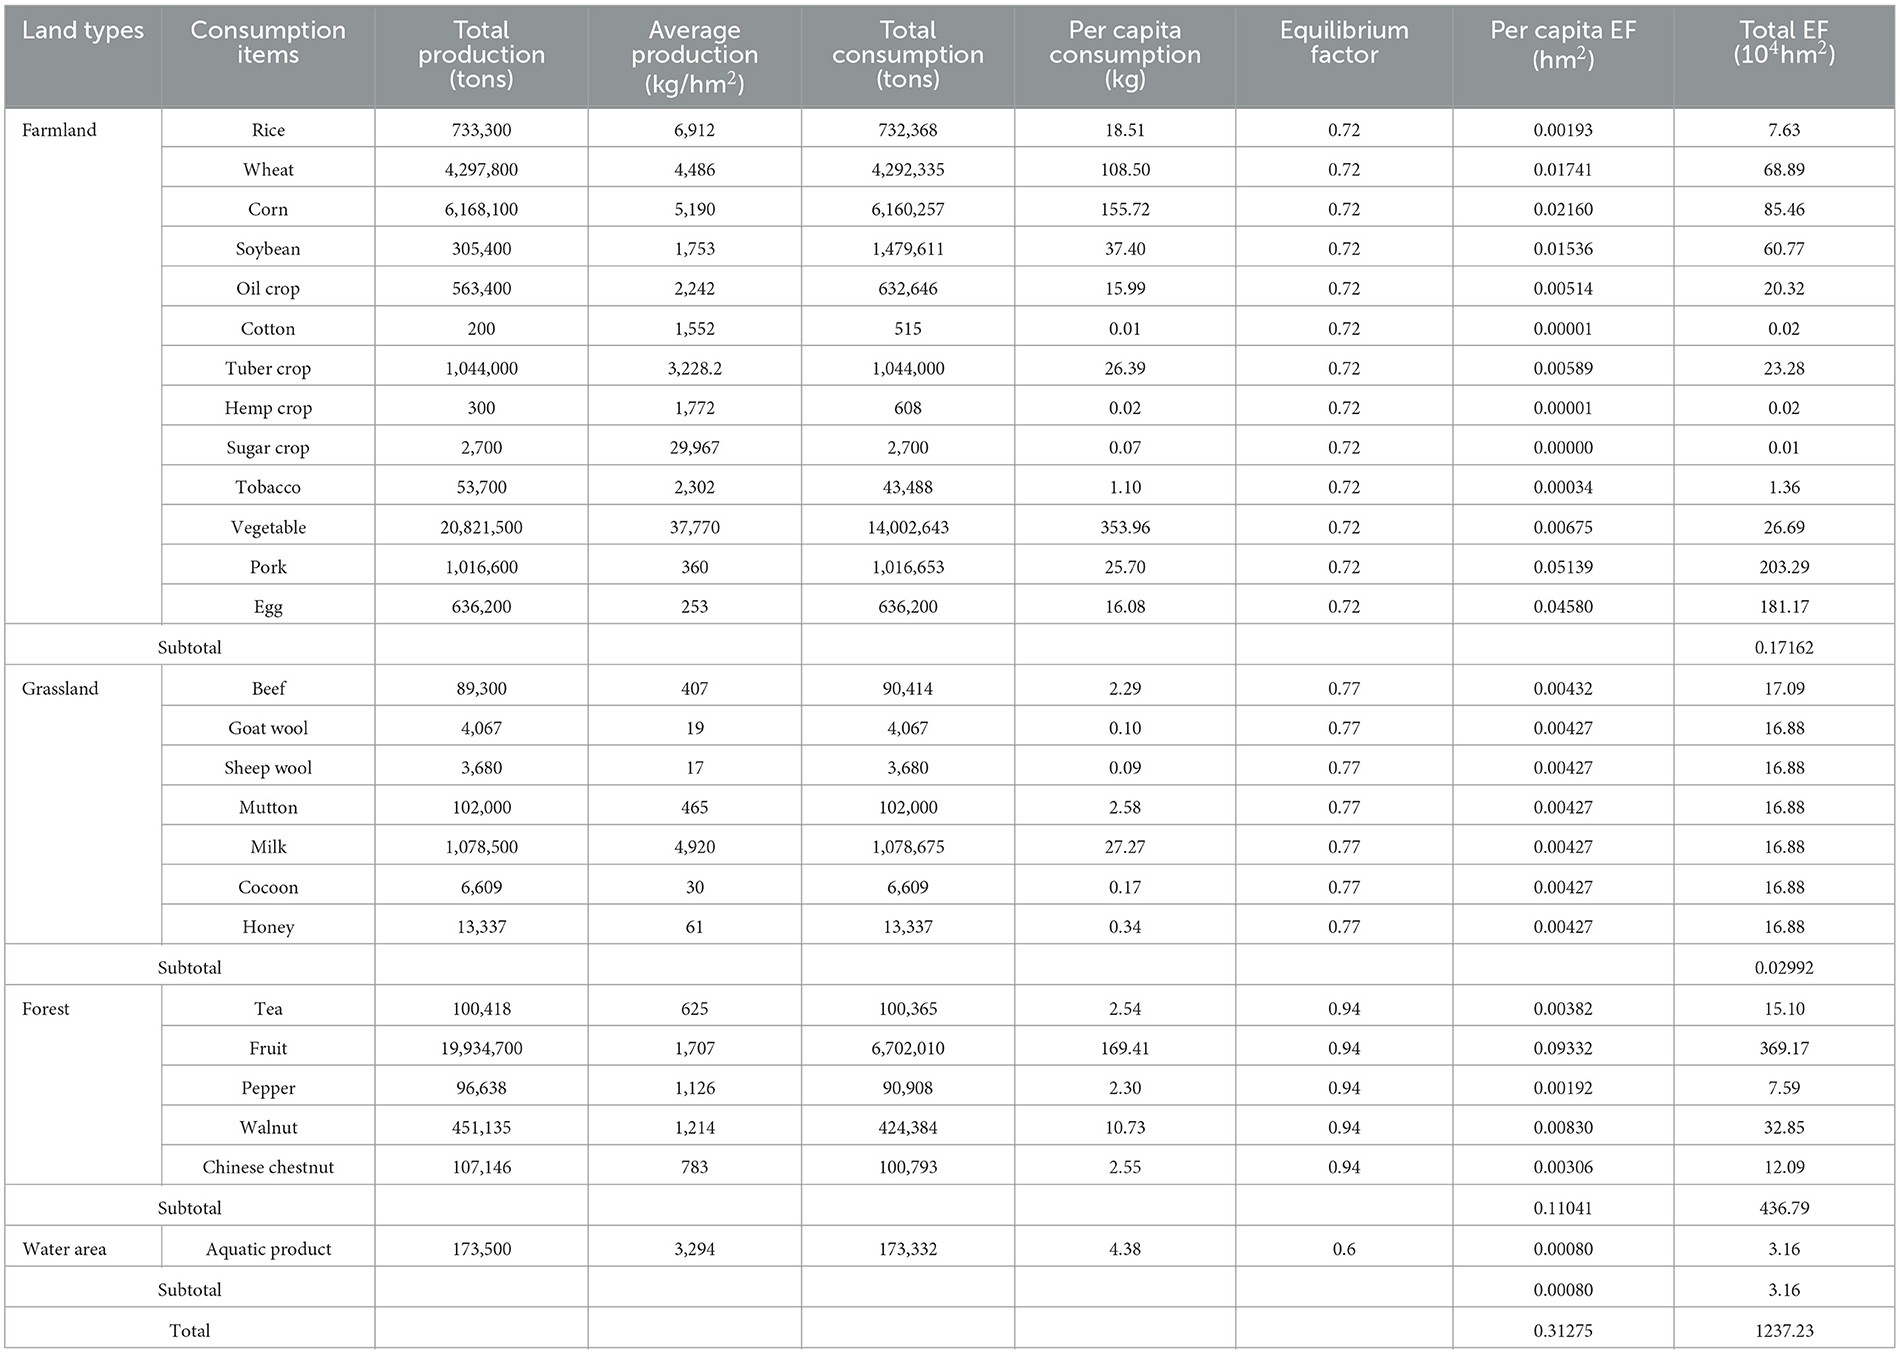
Table 6. Biological resources EF of Shaanxi in 2022.
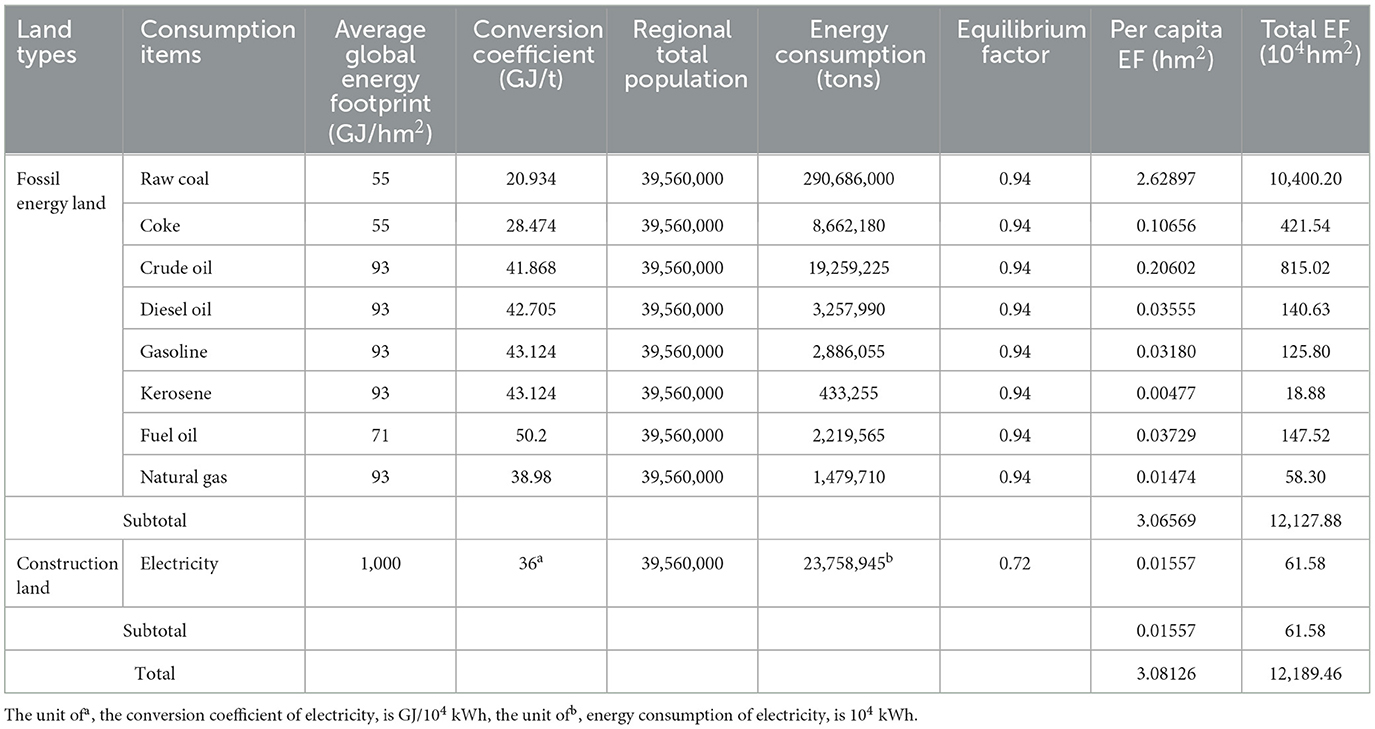
Table 7. Energy EF of Shaanxi in 2022.
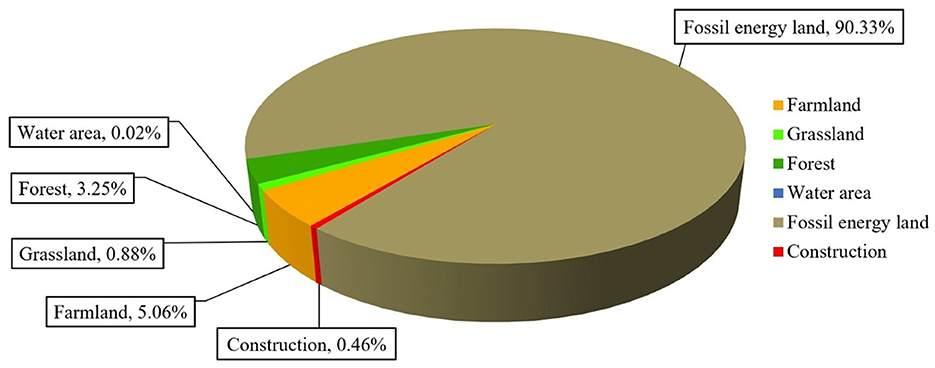
Figure 7. The proportion of EF of different land types in Shaanxi Province in 2022.
3.2.2 Ecological carrying capacity
Combined with the previously mentioned data on various types of biological production land area, the formula of ECC can be utilized to calculate the ECC of Shaanxi's ecosystems. As can be observed, Shaanxi's ECC in 2022 was ~14.262 million hectares. Through further analysis, the proportion of ECC of different ecosystems can be obtained, as Figure 8 illustrates. The order of ECC was forest, grassland, farmland, construction land, water area. Among them, the ECC provided by forest, grassland, farmland and construction land accounted for about 98.13% of the local total ECC. It is evident that the protection of forest, farmland, grassland, the rational development and utilization of construction land are of great significance to the sustainable development of ecological economy in Shaanxi Province.
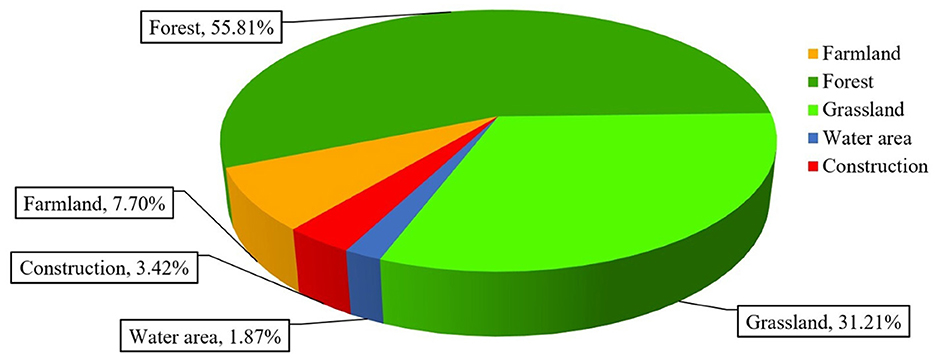
Figure 8. The proportion of ECC of different land types in Shaanxi Province in 2022.
3.2.3 Ecological overload index
Based on the ECC and EF of Shaanxi Province in 2022, the ecological surplus and deficit situation was calculated, as shown in Table 8. It can be seen that Shaanxi Province was in a state of ecological deficit in 2022. The EF reached 134.2669 million hectares, which was 9.41 times the ECC. It is obvious that the EF and ECC of Shaanxi Province were unbalanced, and the ecological environment was severely overloaded. Table 8 indicates that forest, grassland and water area have achieved ecological surplus, which shows that Shaanxi has taken effective measures in the planning and management of water resources, returning farmland to forest and lake, and has achieved sustainable development. However, other land types, such as fossil fuel land, farmland, construction land, were in a state of ecological deficit. With 121.2788 million hectares, fossil energy land had the worst ecological deficiency. The statistical analysis shows that this was caused by the unreasonable consumption structure, excessive dependence on fossil fuels, and excessive carbon emissions. Secondly, the ecological deficit of farmland was 5.6915 million hectares. In the process of urbanization construction and development, the occupation of farmland leads to the reduction of farmland area, the unscientific mode of agricultural production and the haphazard use of pesticides and fertilizers lead to the poor efficiency of farmland production and management, and it is easy to form the state of ecological deficit. There was an ecological deficit of 0.1275 million hectares on construction land. This was primarily caused by inadequate land use planning, excessive development intensity, and pollution from industrial, transportation, and domestic sources. In addition, there are industrial pollution, traffic pollution and domestic pollution in the process of construction development and utilization. The lack of effective ecological protection and restoration measures makes it difficult to effectively compensate for ecological functions and easily forms an ecological deficit.

Table 8. Ecological surplus and deficit of different land types in Shaanxi Province in 2022.
Combined with the above data and related calculation formulas, the EFI of Shaanxi Province in 2022 could be calculated to be −8.41, indicating that Shaanxi Province was in a state of ecological deficit, the ecological compensation amount was negative, the ecological supply and demand were unbalanced, the serious overload and the unsustainable development need to be compensation accordingly.
3.3 Analysis of ecological compensation
By coupling improved ESV and EFI, the amount of ecological compensation can be obtained, which was about 51.947 billion CNY, accounting for 1.59% of Shaanxi's GDP in 2022. In addition, some studies have calculated that when the proportion of ecological compensation in local GDP is higher than 1%, the difficulty of implementation would increase accordingly (Zhao et al., 2020). The proportion of ecological compensation amount calculated by this method to local financial revenue was relatively lower, which was more reasonable and operable.
4 Discussion
4.1 Influencing factors of ecosystem service value
The land area of various ecosystems is the key factor in determining ESV. Changes in land use across different ecosystems are influenced by factors such as urbanization, agricultural development, and industrial construction. On the one hand, these factors indirectly affect ESV by affecting the land area. On the other hand, they directly affect ESV by affecting the function of ecosystem services. This study's analysis reveals that forest ecosystems occupy 60.56% of the province's total area and contribute 79.12% of the total ESV. This highlights the significant achievements of Shaanxi Province's farmland-to-forest restoration efforts in recent years.
Furthermore, factors like biodiversity would also affect ESV. Rich species and genetic resources make the ecosystem more resilient and ensure its long-term stable operation. For example, forest ecosystem with high biodiversity can provide better services such as soil conservation, air purification, and water conservation. It is suggested that the future ecosystem protection and restoration in Shaanxi Province should continue to focus on forest, and pay attention to the coordinated promotion of economic development and ecosystem protection.
4.2 Reasons for ecological deficit in Shaanxi Province
In 2022, the EFI of Shaanxi Province was −8.41, and the ecological deficit was serious. The main reasons are as follows:
(1) Fossil energy land, farmland and construction land were all in a state of unsustainable development, and they accounted for about 95.84% of the total EF, which were the crucial components in determining the ecological state of the whole Shaanxi Province. Further analysis shows that the consumption of raw coal and crude oil for fossil energy land was too large, and these two kinds of energy would cause serious pollution to the environment when burning, resulting in EF and ECC of fossil energy land can't be balanced. For farmland, over-reliance on groundwater or surface water for irrigation exacerbates drought conditions. Additionally, the overuse and mismanagement of pesticides and chemical fertilizers degrade soil quality and pollute water sources, diminishing the functionality of agricultural ecosystems. As for construction land, early urban planning often prioritized economic growth over ecological preservation, adversely affecting ecosystem health.
(2) Data analysis revealed that the secondary industry contributed 48.62% to Shaanxi's total economy. However, this sector consumes substantial energy and generates significant environmental pollution. Large volumes of industrial waste discharged into the environment contaminate air, water, and soil, disrupt the fragile ecosystem balance, and hinder the sustainable development of the ecological environment.
(3) In 2022, China had a population density of 142 people per square kilometer, while Shaanxi's population density was 192 people per square kilometer. High population density increases demand for food, water, and energy, intensifying resource consumption and environmental pollution, thereby further deteriorating ecosystem health.
4.3 Proposals to promote the implementation of ecological compensation
The ecological compensation standard of Shaanxi Province in 2022 was 51.947 billion CNY, representing 15.69% of the local general public budget revenue. Promoting the implementation of ecological compensation is crucial. As an early pilot province for ecological compensation in the Yellow River Basin, Shaanxi has gained substantial experience. For instance, the province has issued several government directives to protect the Weihe River sub-basin. To enhance ecological compensation efforts and establish a fair and efficient system, the following recommendations are proposed:
(1) Based on the experiences and lessons from the ecological compensation pilot in the Weihe River sub-basin, it is advisable to conduct timely evaluations of the policy's effectiveness, promptly summarize successful practices, and promote them. Additionally, the ecological compensation policy and evaluation mechanisms should be continuously refined in accordance with practical realities.
(2) The government supports and subsidizes ecological protection efforts through financial measures or directly implements ecological preservation and construction projects. It should establish dedicated compensation funds for different river basins, develop more practical compensation standards, and promote an innovative compensation model that integrates diverse approaches.
(3) Strengthen the promotion of ecological environmental protection and ecological compensation across the province. Efforts should focus on raising awareness of ecological compensation policy development from the perspectives of social morality, citizens' rights and obligations, social equity, and social responsibility. Additionally, public participation in ecological compensation initiatives should be encouraged and facilitated to foster a greater sense of responsibility and engagement in ecological conservation efforts.
4.4 Limitations
(1) The lack of foundational and dynamic monitoring data, as well as the accuracy of datasets, are major factors influencing the assessment of ecosystem service functions. This study employs the equivalent factor method to estimate the ESV of Shaanxi Province in 2022. Differences in research periods and regional conditions may introduce discrepancies between the calculated ESV and actual values. Future studies should leverage 3S technologies to acquire dynamic and field-based monitoring data and adopt multiple methodologies to achieve more accurate and comprehensive evaluations of ESV in Shaanxi Province.
(2) With ongoing urbanization, the expansion of artificial water bodies, green belts, and community green spaces contributes increasingly to ecosystem services. Ignoring these factors would lead to an underestimation of the overall ESV, thereby increasing the uncertainty of research findings. Consequently, the ESV estimated in this study serves only as an approximate evaluation.
(3) This study calculates the ecological compensation amount, providing a reference point for ecological compensation research in Shaanxi Province. However, it does not address the allocation methods for ecosystem funds, despite the diverse ecological conditions across different regions in the province. To ensure effective implementation, it is essential to consider the geographical, economic, and demographic characteristics of each region when determining the allocation weights for compensation funds. This targeted approach would support the implementation of tailored ecological protection measures. Furthermore, unresolved issues, such as identifying who should compensate and determining appropriate compensation mechanisms, highlight the challenges that must be overcome for ecological compensation to be fully realized.
5 Conclusions
Given that most existing research focuses on single ecosystems, it often fails to comprehensively account for the supply-demand relationship between humans and nature, the capacity to pay compensation, and the level of regional economic development, resulting in limited practicality. This study takes Shaanxi Province as its research object and explores an ecological compensation method based on a coupled and improved ESV—EF model. The research results offer a new perspective and methodology for the rational development of ecological compensation strategies in Shaanxi Province. They contribute to fostering a new paradigm of ecological protection and sustainable economic development while also providing a foundation for studying ecological compensation in other ecologically fragile regions.
(1) The improved ESV in Shaanxi in 2022 was ~6.174 billion CNY. The ranking of ESV by ecosystem type was forest, water area, garden plot, grassland, farmland, desert, and wetland. Together, forest and water area contributed 86.98% of the total ESV, highlighting their critical importance for ecological protection in Shaanxi. Regulation services accounted for the largest proportion of all ecosystem services, underscoring their vital role in maintaining ecosystem functions. Moreover, market value constituted only 5% of the overall ESV, emphasizing the need to avoid an overreliance on market-centered strategies when formulating ecological development plans. This study incorporates multiple ecosystems and adjusts ESV using economic level adjustment coefficient and payment capacity adjustment coefficient, enhancing the accuracy and reliability of the results.
(2) According to the calculation and analysis of EF and ECC, the total EF of Shaanxi Province in 2022 was 134.2669 million hectares, of which the EF of fossil energy land was the largest, reflecting the high demand for energy by human beings. Concurrently, the total ECC of Shaanxi Province in 2022 was about 14.262 million hectares, mainly provided by forest, grassland, farmland and construction land. It indicates that Shaanxi, as an important agricultural province in China, is facing greater food pressure while undertaking the task of production and economic development.
(3) By comparing the EF and ECC, the ecological surplus and deficit states can be obtained, which further reflects the supply and demand relationship between humans and nature. The calculation results showed that Shaanxi was in ecological deficit state in 2022. The supply-demand relationship of ecological resources was seriously out of balance. The ecological deficit of fossil energy land was the largest, followed by farmland, and the ecological deficit of construction land was the smallest. Therefore, it is necessary to carry out reasonable planning of fossil energy land, farmland and construction land to ensure the good development of these ecosystems and coordinate the balance between different ecosystems.
(4) After calculating and analyzing ecological compensation, it was discovered that Shaanxi Province had a serious overload phenomenon in 2022, with the EFI of −8.41. The imbalance between the supply and demand relationship of resources in the province was severe, resulting in negative environmental benefits. The compensation amount for 2022, as the payer of ecological compensation, was 51.947 billion CNY. This amount, calculated using the ecological compensation method based on the coupled improved ESV-EF model, accounted for only 1.59% of the province's GDP, highlighting its feasibility for implementation.
Data availability statement
The original contributions presented in the study are included in the article/supplementary material, further inquiries can be directed to the corresponding author.
Author contributions
JW: Conceptualization, Data curation, Investigation, Methodology, Writing – original draft, Writing – review & editing. NW: Data curation, Formal analysis, Methodology, Validation, Writing – review & editing. KL: Supervision, Validation, Writing – review & editing. XZ: Writing – review & editing, Validation, Formal analysis. LZ: Writing – review & editing, Resources , Investigation. FG: Formal analysis, Supervision, Writing – original draft. KJ: Investigation, Validation, Writing – review & editing. YY: Formal analysis, Investigation, Writing – original draft.
Funding
The author(s) declare financial support was received for the research, authorship, and/or publication of this article. This research was funded by Shaanxi Provincial Department of Water Resources Science and Technology Plan Project, grant number 2024slki-14, the Scientific Research Plan Projects of Shaanxi Education Department, grant number 22JT029, National Natural Science Foundation of China, grant number 51979221, and the Key Science and Technology Program of Shaanxi Province, grant number 2021slki-5.
Conflict of interest
The authors declare that the research was conducted in the absence of any commercial or financial relationships that could be construed as a potential conflict of interest.
Publisher's note
All claims expressed in this article are solely those of the authors and do not necessarily represent those of their affiliated organizations, or those of the publisher, the editors and the reviewers. Any product that may be evaluated in this article, or claim that may be made by its manufacturer, is not guaranteed or endorsed by the publisher.
References
Ariken, M., Zhang, F., Chan, N., and Kung, H. (2021). Coupling coordination analysis and spatio-temporal heterogeneity between urbanization and eco-environment along the Silk Road Economic Belt in China. Ecol. Indic. 121:107014. doi: 10.1016/j.ecolind.2020.107014
Balasubramanian, M., and Sangha Kamaljit, K. (2023). Valuing ecosystem services applying indigenous perspectives from a global biodiversity hotspot, the Western Ghats, India. Front. Ecol. Evol. 11:1026793. doi: 10.3389/fevo.2023.1026793
Cao, Y., and Liu, J. (2024). Value evaluation of ecological products in key state-owned forest areas of Heilongjiang Province. China Market. 11, 51–54. doi: 10.13939/j.cnki.zgsc.2024.11.012
Chancel, L. (2022). Global carbon inequality over 1990–2019. Nat. Sustain. 5, 931–938. doi: 10.1038/s41893-022-00955-z
Chen, X., Li, H., Luo, F., He, Z., Bai, W., Xiao, Y., et al. (2023). Dynamic characteristics and impacts of ecosystem service values under land use change: a case study on the Zoigê plateau, China. Ecol. Inform. 78:102350. doi: 10.1016/j.ecoinf.2023.102350
Costanza, R., d'Arge, R., Groot, R. D., Farber, S., Grasso, M., Hannon, B., et al. (1998). The value of the world's ecosystem services and natural capital. Ecol. Econ. 25, 3–15. doi: 10.1016/S0921-8009(98)00020-2
Dai, J., Ouyang, Y., Hou, J., and Cai, L. (2023). Long-time series assessment of the sustainable development of Xiamen City in China based on ecological footprint calculations. Ecol. Indic. 148:110130. doi: 10.1016/j.ecolind.2023.110130
Galli, A., Halle, M., and Grunewald, N. (2015). Physical limits to resource access and utilisation and their economic implications in Mediterranean economies. Environ. Sci. Policy. 51, 125–136, doi: 10.1016/j.envsci.2015.04.002
Guan, D., Jiang, Y., Yan, L., Zhou, J., He, X., Yin, B., et al. (2022). Calculation of ecological compensation amount in the Yangtze River Basin based on the perspective of ecological footprint. Acta Ecol. Sin. 42, 8169–8183. doi: 10.5846/stxb202010282764
Guan, S., Gao, Y., and Dong, Z. (2024). Assessing the dynamics of ecosystem service value in China: a perspective on equality and efficiency. Ecol. Indic. 165:112176. doi: 10.1016/j.ecolind.2024.112176
Guo, R., and Shen, H. (2017). Study on ecological compensation of Lishui River Basin based on ecological footprint. Res. Soil Water Conserv. 24, 353–358. doi: 10.13869/j.cnki.rswc.2017.02.058
Guo, Y., Jia, J., Li, L., Hu, M., and Wu, G. (2024). Spatio-temporal pattern and influencing factors of carbon emissions in the middle reaches of the Yellow River from the perspective of urban shrinkage. Acta Ecol. Sin. 44, 903–914. doi: 10.20103/j.stxb.202303080429
Jia, J., Xin, L., Lu, C., Wu, B., and Zhong, Y. (2023). China's CO2 emissions: a systematical decomposition concurrently from multi-sectors and multi-stages since 1980 by an extended logarithmic mean divisia index. Energy Strategy Rev. 49:101141. doi: 10.1016/j.esr.2023.101141
Jia, J., Zhao, J., Deng, H., and Duan, J. (2010). Ecological footprint simulation and prediction by ARIMA model—A case study in Henan Province of China. Ecol. Indic. 10, 538–544. doi: 10.1016/j.ecolind.2009.06.007
Jin, F., Xu, L., and Lu, Q. (2024). Ecological security patterns of Chinese lakes based on ecosystem service values assessment and human threat factors evaluation. Ecol. Inform. 82:102754. doi: 10.1016/j.ecoinf.2024.102754
Jin, Y., Zhao, K., and Xiao, G. (2015). Study on the zoning of economic compensation for cultivated land protection in Shaanxi Province: Based on the dual perspective of food security and ecological security. China Land Sci. 29, 12–19.
Jing, P., Sheng, J., Wang, Y., Hu, T., Guo, L., Zhu, R., et al. (2024). Assessing the ecological security of the Three Gorges reservoir complex ecosystem based on the improved three-dimensional emergy ecological footprint model. Sci. Total Environ. 933:173086. doi: 10.1016/j.scitotenv.2024.173086
Li, X., Zhu, Y., Zhao, L., Tian, J., and Li, J. (2015). Study on the change of ecosystem service value in Qinglong County based on the dynamic adjustment of value coefficient. Chin. J. Ecoagric. 23, 373–381. doi: 10.13930/j.cnki.cjea.140595
Ling, D., Chen, J., Lv, Z., and Ding, Z. (2023). Quantitative research on ecological compensation in the Yangtze River Economic Belt based on the ‘consumption-output' ecological footprint model. J. Econo. Water Resour. 41, 37–44+111.
Liu, J., Wang, H., and Zhao, Z. (2024). Improvement and application of the ecological footprint calculation Method—A case study of a Chinese university. J. Clean. 450:141893. doi: 10.1016/j.jclepro.2024.141893
Liu, L., and Lei, Y. (2018). An accurate ecological footprint analysis and prediction for Beijing based on SVM model. Ecol. Inform. 44, 33–42. doi: 10.1016/j.ecoinf.2018.01.003
Liu, M., and Li, W. (2010). Calculation of ecological footprint equilibrium factors in various regions of China based on net primary productivity. J. Ecol. Rural Environ. 26, 401–406.
Liu, M., Li, W., and Xie, G. (2010). Calculation of China 's ecological footprint yield factor based on net primary productivity. Chin. J. Ecol. 29, 592–597. doi: 10.13292/j.1000-4890.2010.0097
Liu, S., Jia, J., Huang, H., Chen, D., Zhong, Y., and Zhou, Y. (2023). China's CO2 emissions: a thorough analysis of spatiotemporal characteristics and sustainable policy from the agricultural land-use perspective during 1995–2020. Land 12:1220. doi: 10.3390/land12061220
Ma, C., and Gao, J. (2020). Forest ecological compensation, income impact and policy satisfaction – based on the survey data of farmers in public welfare forest areas in Shaanxi Province. J. Arid Land Res. Environ. 34, 58–64. doi: 10.13448/j.cnki.jalre.2020.298
Mao, C., and Niu, J. (2024). Quantitative analysis of ecological compensation in the Yangtze River Delta region based on the value of ecosystem services and ecological footprint. Front. Ecol. Evol. 12:1335761. doi: 10.3389/fevo.2024.1335761
Nie, X., Li, X., Lyu, C., Su, Y., and Wang, H. (2024). Can ecological compensation based on the transfer of development rights (TDR) improve ecosystem service value? A multi-scenario simulation. Land Use Policy 138:107024. doi: 10.1016/j.landusepol.2023.107024
Niu, J., Mao, C., and Xiang, J. (2024). Based on ecological footprint and ecosystem service value, research on ecological compensation in Anhui Province, China. Ecol. Indic. 158:111341. doi: 10.1016/j.ecolind.2023.111341
Ouyang, X., Liao, H., Jiang, Q., and Wang, Z. (2023). Simulation and regulation of water resources sustainable utilization in china based on improved water resources ecological footprint model. Environ. Sci. 44, 1368–1377. doi: 10.13227/j.hjkx.202204267
Pençe, I., Çeşmeli, M. S., Kuma,ş, K., Akyüz, A., Tuncer, A. D., and Güngör, A. (2024). Study of biocapacity areas to reduce ecological footprint deficits: a case study of Turkey. Sci. Total Environ. 932:173018. doi: 10.1016/j.scitotenv.2024.173018
Peng, L., Hu, S., Zhang, J., Zhou, H., Shi, Q., and Wu, X. (2024). Reconstruction of ecological security network in central urban area considering the value of suburban farmland ecological service. Acta Ecol. Sin. 44, 1–15. doi: 10.20103/j.stxb.202307311645
Rees, W. E. (1992). Ecological footprints and appropriated carrying capacity: what urban economics leaves out. Environ. Urban. 4, 121–130. doi: 10.1177/095624789200400212
Ren, Y., Chen, Y., Chen, D., and Zhang, H. (2022). Spatial and temporal effects on the value of ecosystem services in arid and semi-arid mountain areas—A case study from Helan Mountain in Ningxia, China. Front. Ecol. Evol. 10:1072015. doi: 10.3389/fevo.2022.1072015
Richardson, L., Loomis, J., Kroeger, T., and Casey, F. (2015). The role of benefit transfer in ecosystem service valuation. Ecol. Econ. 115, 51–58. doi: 10.1016/j.ecolecon.2014.02.018
Shao, W., Chen, M., and Liu, H. (2021). Comparison of functional value method and equivalent factor method in ecological value accounting. Agric. Tech. 41, 105–107. doi: 10.19754/j.nyyjs.20210115033
Wackernagel, M. (1998). The ecological footprint of Santiago de Chile. Local Envir. 3, 7–25. doi: 10.1080/13549839808725541
Wackernagel, M. (1999). Ecological Economics Forum: why sustainability analyses must include biophysical assessments. Ecol. Econ. 29, 13–15. doi: 10.1016/S0921-8009(98)00071-8
Wackernagel, M., and Rees, W. E. (1997). Perceptual and structural barriers to investing in natural capital: economics from an ecological footprint perspective. Ecol. Econ. 20, 3–24. doi: 10.1016/S0921-8009(96)00077-8
Wackernagel, M., Schulz, N. B., Deumling, D., Linares, A. C., Jenkins, M., Kapos, V., et al. (2002). Tracking the ecological overshoot of the human economy. Proc. Nati. Acad. Sci. U. S. A. 99, 9266–9271. doi: 10.1073/pnas.142033699
Wang, N., Liu, J., Wu, D., Gao, S., and Wang, R. (2010). Regional ecological compensation based on ecosystem service value: a case study of Shandong Province. Acta Ecol. Sin. 30, 6646–6653.
Xie, G., Zhang, C., Zhang, L., Chen, W., and Li, S. (2015a). Improvement of ecosystem services valuation method based on unit area value equivalent factor. J. Nat. Resour. 30, 1243–1254.
Xie, G., Zhang, C., Zhang, S., Xiao, Y., and Lu, C. (2015b). The value of ecosystem services in China. Resour. Sci. 37, 1740–1746.
Xu, X., and Zheng, Y. (2017). Ecological compensation standard of Lhasa rural tourism destination based on tourism ecological footprint: a case study of Cijiolin Village. Econ. Geogr. 37, 218–224. doi: 10.15957/j.cnki.jjdl.2017.04.027
Yang, Y., and Jia, T. (2015). The changes of ecological footprint and carrying capacity in Shaanxi Province since the 21st century. Acta Ecol. Sin. 35, 7987–7997. doi: 10.5846/stxb201407111419
Yang, Y., Lu, H., Liang, D., Chen, Y., Tian, P., Xia, J., et al. (2022). Ecological sustainability and its driving factor of urban agglomerations in the Yangtze River Economic Belt based on three-dimensional ecological footprint analysis. J. Clean. Prod. 330:129802. doi: 10.1016/j.jclepro.2021.129802
Yu, F., Yang, W., Ma, G., and Zhou, Y. (2020). The latest progress and prospect of ecological value accounting at home and abroad. Environ. Prot. 48, 18–24. doi: 10.14026/j.cnki.0253-9705.2020.14.004
Yu, H., Chen, C., and Shao, C. (2023). Spatial and temporal changes in ecosystem service driven by ecological compensation in the Xin'an River Basin, China. Ecol. Indic. 146:109798. doi: 10.1016/j.ecolind.2022.109798
Yuan, W., and Zhou, X. (2014). A review of foreign research progress on ecological compensation. China Popul. Res. Environ. 24, 76–82.
Zhang, H., Fang, B., Wei, Q., Qu, Y., and Wang, Q. (2015). The construction of quantitative model of cultivated land ecological value compensation in the region – Taking Jiangsu Province as an example. China Land Sci. 29, 63–70. doi: 10.13708/j.cnki.cn11-2640.2015.01.007
Zhao, Z., Yu, D., Wang, K., and Lv, A. (2020). Ecosystem service value and ecological compensation strategy in western Jiangxi. Acta Ecol. Sin. 40, 7507–7518.
Zhong, J., Wang, B., Mi, W., Fan, X., Yang, M., and Yang, X. (2020). Spatial recognition of ecological compensation standard for grazing grassland in Yanchi County based on InVEST model. Sci. Geogr. Sin. 40, 1019–1028. doi: 10.13249/j.cnki.sgs.2020.06.018
Zhou, J., Guan, D., and Zhou, L. (2018). Quantitative research on ecological compensation standards for the follow-up development of the Chongqing section of the Three Gorges Reservoir area based on ecological footprint. Acta Sci. Circumst. 38, 4539–4553. doi: 10.13671/j.hjkxxb.2018.0297
Zhou, Y., Zhou, J., Tao, T., Yan, J., Qin, J., and Ye, J. (2017). Quantitative research on inter-regional ecological compensation standards-Taking the compensation of three intervals in Ezhou City as an example. Environ. Sustain. Dev. 42, 143–150. doi: 10.19758/j.cnki.issn1673-288x.2017.03.042
Keywords: ecological compensation, ecological service value, ecological footprint model, ecological sustainability, Shaanxi Province
Citation: Wei J, Wei N, Lu K, Zhang X, Zhang L, Gao F, Ji K and Yang Y (2025) Research on ecological compensation of coupling improved ecosystem service value-ecological footprint model in Shaanxi Province, China. Front. Environ. Econ. 4:1500266. doi: 10.3389/frevc.2025.1500266
Received: 23 September 2024; Accepted: 13 January 2025;
Published: 04 March 2025.
Edited by:
Hanxi Wang, Harbin Normal University, ChinaReviewed by:
Junsong Jia, Jiangxi Normal University, ChinaM. Jahanzeb Butt, Shandong University, China
Copyright © 2025 Wei, Wei, Lu, Zhang, Zhang, Gao, Ji and Yang. This is an open-access article distributed under the terms of the Creative Commons Attribution License (CC BY). The use, distribution or reproduction in other forums is permitted, provided the original author(s) and the copyright owner(s) are credited and that the original publication in this journal is cited, in accordance with accepted academic practice. No use, distribution or reproduction is permitted which does not comply with these terms.
*Correspondence: Na Wei, d2VpbmFAeGF1dC5lZHUuY24=