 Melkamu Tilaye Wondim
 Guta Bukero Geyo
- Ethiopian Institute of Agricultural Research, Wondo Genet Agricultural Research Center, Agricultural Economics Research, Shashemene, Ethiopia
This study examined the determinants of onion commercialization of smallholder farmers in the Wolayita and Gomo zones of southern Ethiopia. Both primary and secondary data were used in this study. Primary data were collected from randomly selected 160 onion producers by using a structured questionnaire. Both descriptive statistics and the double-hurdle econometric model were employed in the analysis. The descriptive statistics indicated that the mean commercialization level of smallholder farmers in the study area was 79.51%, highlighting that onion producers in this region primarily focus on marketing their produce. Using the econometric model the first-stage double hurdle results revealed that family size, farming experience, frequency of extension contacts, and distance to the nearest market were factors significantly affecting the market participation decision of onion producers. The second stage of the double hurdle results indicates that education level, family size, frequency of extension contacts, land size allotted for onion production, and distance to the nearest market were factors that significantly affected the level of onion commercialization. Therefore, policies aimed at increasing farmers' access to better road networks and transportation facilities, improving access to education, promoting agricultural training programs, and improving extension services are recommended to improve the commercialization of onion production.
1 Introduction
Ethiopia's economy depends primarily on agriculture, with smallholder farmers cultivating 95% of the country's farmland and producing 90% of its total agricultural production (Kusse et al., 2022). Agriculture is an essential driver of economic growth in Ethiopia. Crop and livestock production account for roughly 65 and 25% of agricultural GDP (ITA, 2024). Agriculture contributed 20.6% to poverty reduction, 37.2% to GDP, 78% to export income, and 75% to employment opportunities (World Bank, 2017). The GDP contribution of agriculture is growing in absolute terms over time, although the sector's share of the national GDP has been declining over time (Trading Economics, 2024). Ethiopian agriculture is dominated by small-scale farming. Around 67.5% of farmers have farmland of <4 hectares, and the average small farm size is 0.9 ha. Only 1.8% of farming households are operating on a farm size of more than 15 hectares (Kirui, 2019). Ethiopia's overall economy is dependent on the growth of the agricultural sector, to which smallholder farmers make a significant contribution to the country's overall agricultural growth. The movement of the agriculture sector depends entirely on what is happening in the smallholder subsector (MoARD, 2010; NBE, 2019).
Agricultural commercialization refers to the increase in the proportion of the supply of agricultural output that is sold, instead of the quantity of agricultural output used by farm households for home consumption (Olwande et al., 2015; Minot et al., 2022). There are numerous perspectives and definitions of agricultural commercialization. It can be viewed as either a static or dynamic process over time. The static form of smallholder farm commercialization could be seen as a measure of the strength of the linkage between farm households and markets at a given point in time. This household-to-market linkage could relate to output or input markets, either in selling, buying, or both, including labor (Moti et al., 2009; Tamrat et al., 2023). Considering farm commercialization as a dynamic process, it could be seen as a process in which the speed of the share of outputs sold and inputs purchased changes over time at the household level. According to this principle, agricultural commercialization occurs when enterprises involved in agriculture and/or the agricultural sector as a whole increasingly rely on the market for the sale of produce and the acquisition of production inputs (Poulton, 2017). The process of agricultural commercialization occurs when agricultural enterprises and the agricultural sector as a whole rely more on the market to sell their produce and buy labor and other production inputs (Poulton, 2017). Commercialization of smallholder agriculture refers to the transition from subsistence to market-oriented farming, which can result in increases in production, income, and employment, as well as a decrease in poverty. Agricultural commercialization also improves the food supply in urban areas, with broader growth and welfare effects (Barrett, 2008; Carletto et al., 2017; Ogutu and Qaim, 2019).
Vegetable production, which involves commercial state farms, private commercial farms, and smallholder farming, is a vital economic activity in Ethiopia (Hagos et al., 2018). Onion (Allium cepa) is one of the most significant vegetable crops worldwide. Onion has mainly grown as a food source, is used as a cousin, and is a valuable addition to various dishes. In Ethiopia, it is grown mainly for its bulb, which is widely used for its flavoring properties, daily stews, and other applications in vegetable food preparation (Goldman, 2011; AgroBIG, 2016). Because of these significant advantages, onion production is increasing in the country's many agro-ecologies in small-scale production systems, being one component of commercialization and a daily source of income for both rural and urban populations (Muluneh et al., 2019). Onion is an important economic center in Ethiopia because of its ease of cultivation, higher yield per hectare, and the irrigation system that increases onion production from time to time. In Ethiopia, the total area under onion production was about 38,952.58 ha, of which 3,460,480.88 tons were produced in 2020/2021, with an average yield of about 8.8 t ha−1. However, productivity is significantly lower than the global average of onion productivity, which is 18.8 t ha−1 (CSA, 2021).
Wolayita and Gomo zones are among the potential onion production zones of South Region Ethiopia. Despite the livelihood contribution of onion commercialization, so far as the author's knowledge is concerned, in the study areas, there have been no similar studies on the commercialization and level of commercialization of onion producers in study areas. To fill this gap, this study aimed to investigate the determinants of onion commercialization and the level of commercialization. In addition, some related studies conducted in different areas did not conduct model specification tests to select an appropriate model for their dataset. For example, Taye et al. (2018) used the Heckman two-stage model to analyze the determinants of commercialization of smallholder onion farmers in Fogera district, Ethiopia; Engida et al. (2021) used the Tobit model for analyzing commercialization and intensity of commercialization of sorghum in Southwest Ethiopia; Dubale et al. (2022) used a double hurdle model to analyze the commercialization level and determinants of market participation of smallholder wheat farmers in northern Ethiopia; Ater et al. (2021) analyzed the Factors Influencing the commercialization of Horticultural Crops Among Smallholder Farmers in Juba, South Sudan Using Tobit Model; Zelalem et al. (2023) used the Double Hurdle model to analyze the commercialization and level of commercialization of teff growers and determinants in west Ethiopia. However, there is limited empirical evidence on the commercialization of onion in Ethiopia and in the study area in particular. Smallholder farming typically experiences low productivity in agriculture-based economies due to a lack of access to necessary inputs such as land, better seeds, fertilizers, irrigation, technology, and expertise. Furthermore, there are notable deficits in institutional support and infrastructure, as well as a general lack of market orientation (Bezabih and Hadera, 2007; Moti, 2007; MoFED, 2010, 2016). Some empirical studies indicated that infrastructure, market conditions, household resources, and particular household characteristics all have a major impact on smallholder agricultural commercialization (Berhanu et al., 2009; Berhanu and Moti, 2010). Addressing the commercialization difficulties faced by farmers through a well-designed policy will have a significant impact on enhancing commercialization and positively contribute to the country's economy as well. Therefore, it is important to identify the factors that affect the onion commercialization of smallholder farms to use it as an input in policy designing. This study aimed to fill the research gap by identifying specific factors influencing onion commercialization and assessing its extent in Diguna Fango and Mirab Abaya districts where no past empirical evidence addressed the issue in the area.
2 Methodology
2.1 Description of the study area
The study was conducted in major onion-producing regions of the South Region of Ethiopia. The study was conducted in the largest onion producers in the Digna Fango district of Wolayita zone and Mirab Abaya district of Gamo zone in the South regional state of Ethiopia. Mirab Abaya Wereda (district) is located 225 km south of Hawassa, covering a total area of 1,405 km2. Of this area, 17,437 hectares are used for farming. The wereda's elevation ranges from 1,100 to 2,900 meters above sea level. It receives an average annual rainfall between 800 and 1,600 mm, with temperatures typically ranging from 24 to 30°C (Direslgne et al., 2016). Diguna Fango Woreda is located 42 km east of the zonal city Wolaita Sodo, 73 km southwest of Hawassa, and 300 km south of Addis Ababa. Geographically, the woreda lies between 6°45′00′′ and 7°5′00′′ N latitude, and 37°58′00′′ and 38°8′00′′ E longitude (Aklilu et al., 2020).
2.1.1 Sources and method of data collection
The survey was conducted in Gomo and Wolayita zones, South Regional State of Ethiopia. For the study, both primary and secondary data were collected. The field survey was conducted in 2019 to collect data from primary and secondary sources. Primary data were collected from randomly selected onion-producing households using a semi-structured questionnaire, with trained enumerators conducted face-to-face interviews under the researcher's supervision. The questionnaire used to collect primary data fron respondents includes both closed-ended and open-ended components to gather detailed information about the issue under study. The questionnaire was pretested and amended based on the feedback obtained to ensure validity and reliability. Before the commencement of the survey, training was provided to enumerators. Then data were collected using these trained enumerators from March to June 2019. Secondary data were collected from the Central Statistical Agency (CSA), Office of Agriculture and Rural Development, FAO, International Research Institution Report, and Online publications. Finaly triangulation of data sources were used to increase validity of the results.
2.2 Sampling procedure and sample size
A multi-stage random sampling technique was employed to select the study locations and onion-producing households. In the first stage, the Wolayita and Gamo zones of the South Region were selected purposively based on their potential for onion production. The Second Mirab Abaya district of Gomo zone and Dugna Fango districts of Wolayita zone were selected based on their highest potential for onion production. Thirdly two onion-producing kebeles from each district, that is Bilate Chericho and Bilate Eta kebeles of Diguna Fango district and Kola Muleta and Yayke of kebeles of Abaya district were randomly selected. Finally, respondents were selected using a random lottery method from a list of onion growers, with data obtained from the district and kebele agricultural offices. Farmers from each kebele were chosen based on probability proportional to the size of the population within each kebele. In total, 160 respondents were selected using Yamane's (1967) formula.
Where: where n is the sample size; e is the level of precision (e = 7.6%) and N is total number of onion producers in the sampled districts (N = 2,100).
2.3 Method of data analysis
The collected data were analyzed using descriptive and econometric methods of data analysis. For the descriptive analysis, mean, frequency, and percentages were used. Inferential statistical tests such as t-test and chi-square test were used for the existence of any statistically verifiable differences among households participating in the onion market and their counterpart non-market participants. Under econometric analysis, double-hurdle model was used to estimate market participation decisions and the level of commercialization of onion producers.
2.3.1 Model specification
Following the work of Von-Braun (1994), the Household Commercialization Index (HCI) formula is given as:
A commercial index value of zero implies non-commercialization of onion while the closer it is to one, the higher the degree of onion commercialization.
Various limited dependent variable models including the double-hurdle model, Heckman two-stage model, and Tobit model, are employed to examine crop market participation and its intensity of participation. But, the model specification mainly depends on the purpose of the study and the type of data available. Our dependent variable is Onion crop commercialization index which ranges from 0 to 1, and has no missing values. Becuse heckman's two-stage model is designed to correct for sample selection bias in a situation where the dependent variable is only observed for part of the population due to some selection process (e.g., only commercilized households have observed sales data). The 0′s in this case would indicate unobserved data rather than actual outcomes. In this case the 0 values in our data are not due to selection bias but are instead real observations that is, households who genuinely have zero commercialization index or zero sales, using the Heckman two stage model could lead to incorrect conclusions because it assumes those zeros are unobserved or missing due to selection bias. Therefore, Heckman would attempt to “correct” something that does not need correcting, leading to biased estimates. Thus, heckman's two-stege model is not an appropriate econometric model for this data set. Hence, the Tobit model and double hurdle models were compared using the model-specified test (Komarek, 2010). Based on the model specification test result as indicated results and the discussion section of limited dependent variables model specification of Tobit, and Double hurdle, the double hurdle model is appropriate for this dataset as compared to the Tobit regression model.
According to Wooldridge (2002), the Tobit model assumes that the household's decision to sell and how much to sell if the sale occurs is determined by the same mechanism. With the model specification test discussed later below and shown as well in the model result, Tobit does not fit this research dataset following the specified test. Double hurdle fittest model for this dataset. Cragg's or double hurdle model has two hurdles to overcome before observing the positive value of the dependent variable. First is the decision to be made about whether to consider a change or not. Then, a decision on the amount of the change is taken (Cragg, 1971). According to Newman et al. (2001), the first hurdle involves the choice of to sell or not to sell onion production (market participation decision), whereas the second hurdle concerns the level of commercialization of the producer choices (quantity of sales decision). It indicates that a producer makes two decisions concerning the sale of onion production.
According to Humphreys (2013), the standard likelihood ratio test can be used to test the double-hurdle model against the Tobit model since the Tobit model is nested in the double-hurdle model. That is, the Tobit model can be derived from the double-hurdle model by restricting the parameters of the probit model to be equal to the parameters of the truncated regression.
If LLprobit is the log-likelihood of probit model, LLtruncreg is the log-likelihood of truncated regressions and LLtobit is the log-likelihood value of Tobit model. Then, the likelihood ratio test (LR) can be carried out as follows:
The test statistic has a χ2 distribution with degrees of freedom equal to the number of parameters that are included in the regression (Tobit = truncated = probit), plus the intercept. With the null hypothesis, the Tobit model is a better fit than the double-hurdle model. However, on the other hand, rejection of the null hypothesis means that the double-hurdle model is a better alternative to the data.
According to Moffatt (2005), the equations for the double huddle can be written as:
First hurdle that presents the onion market participation decision is expressed as Equation 2:
The second hurdle, which represents intensity commercialization, is modeled as a truncated regression as follows (Equation 3):
Where; i represent the ith household head; X1i and X2i are vectors of explanatory variables; is the latent or unobserved market participation decision; β1 and β2 are the corresponding vectors of parameters to be estimated; yi is the observed amount of commercialization in the market; and is the latent or unobserved amount of commercialization to the market; and εi and ui are uncorrelated normally distributed error terms for both decisions, respectively.
According to Humphreys (2013), the Cragg hurdle assumes no correlation between εi and ui (σ12 = 0) is estimated by the following likelihood function (Equation 4):
The likelihood of the probit model and the truncated regression model under the assumption of independent error terms is the likelihood of the Cragg hurdle model. In this case, the first two terms on the left-hand side are the probit model for participation and the third term is a truncated regression model.
2.4 Definition of variables and hypothesis
2.4.1 Dependent variables
2.4.1.1 Market participation
It is a dummy variable that indicates the participation of the household in the market that is regressing in the first step of the two-step estimation procedure. If the household participates in the onion market, it takes a value of one. However, it takes a value of zero for households that do not participate in the onion market during the production season.
2.4.1.2 Commercialization index of households (HCI)
It is a continuous variable in the second step of the selected model. It is measured in the commercialization index and represents the actual level of commercialization of onions marketed by farm households during the production season.
2.4.2 Explanatory variables
Explanatory factors include demographic, socioeconomic, and institutional factors that affect onion commercialization and the level of commercialization. Table 1 presents a list of explanatory variables expected to affect onion market participation, the level of onion commercialization, and the hypothesized direction of association with the dependent variables. They were hypothesized based on the reviewed literature and economic theory.
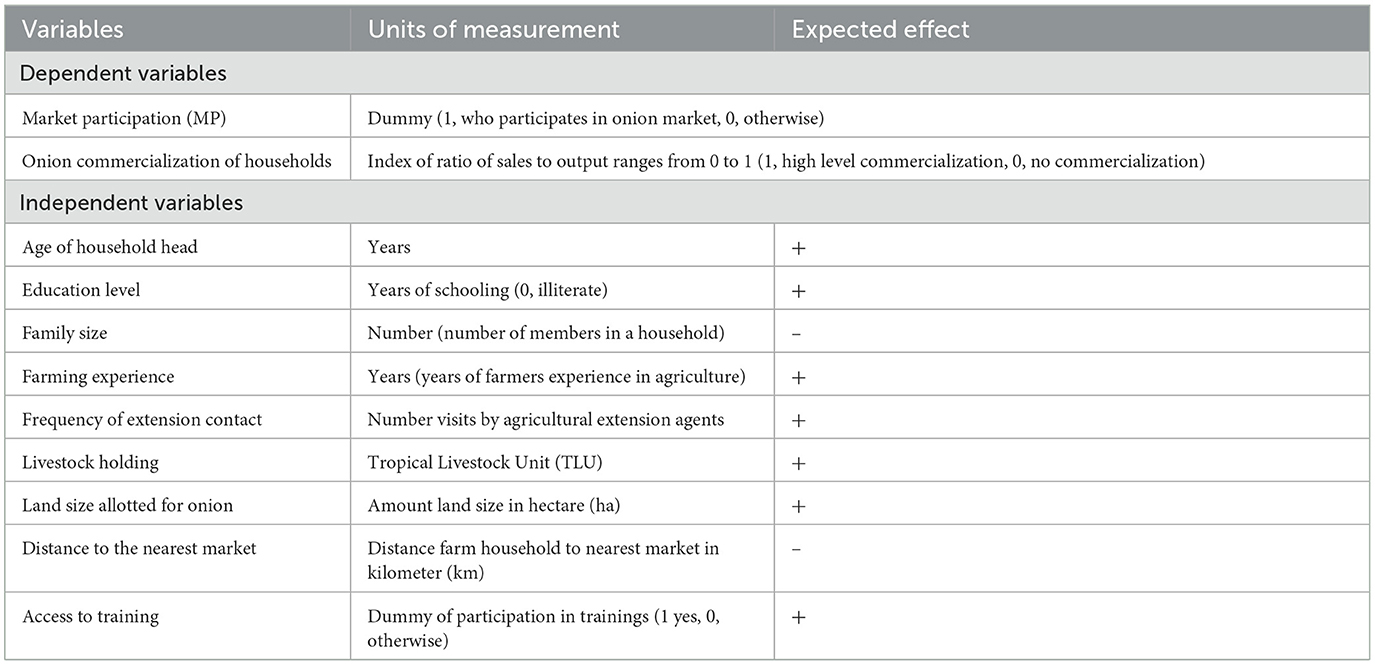
Table 1. Variables and hypothesis.
3 Results and discussions
3.1 Descriptive statistics
This section provides an analysis of the demographic, socioeconomic, and institutional factors affecting onion producer households. The pertinent details are presented in Tables 2, 3.
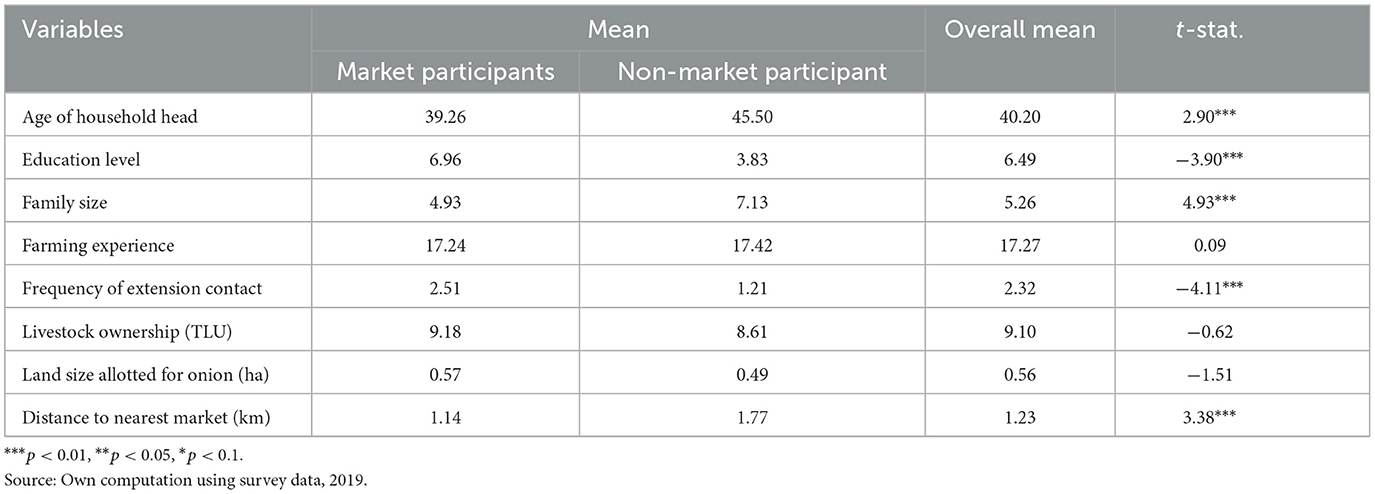
Table 2. Summary of continuous variables.
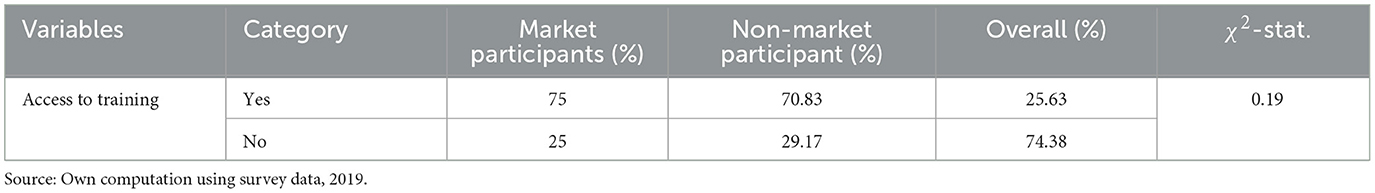
Table 3. Summary of dummy variable.
3.1.1 Age
The minimum and maximum age of household were 20 and 64 years, respectively, while in terms of onion market participation, the average age of household head was 39.26 years for market participants and 45.5 years for non-market participants. The t-test result shows that the mean difference was statistically significant at 1% level, indicating that there is a variation in households in terms of the average age of household heads between onion market participants and non-participants (Table 2; Appendix Table A1).
3.1.2 Education level
The minimum and maximum education levels of household heads were 0 and 12 years of schooling, respectively, while in terms of onion market participation, the average education level of households was 6.96 years of schooling for market participants and 3.83 for non-market participants. The t-test result shows that the mean difference was statistically significant at 1% indicating that there is variation in the household head in terms of average education level of household heads between market participants and non-participants (Table 2; Appendix Table A1).
3.1.3 Family size
The minimum and maximum family sizes of households were 1 and 10, respectively, while in terms of onion market participation, the average household size was five for market participants and seven for non-market participants. The t-test result shows that the mean difference was statistically significant at 1% level, indicating that there is variation in households in terms of average family size between market participants and non-participants (Table 2; Appendix Table A1).
3.1.4 Farming experience
The minimum and maximum farming experience of households was 2 and 40 years, respectively, while in terms of onion market participation, the average household farming experience was 17.24 for market participants and 17.42 for non-market participants. The t-test result shows that the mean difference was insignificant, indicating that there was no variation in households in terms of average farming between market participants and non-participants (Table 2; Appendix Table A1).
3.1.5 Frequency of extension contact
The minimum and maximum frequency of extension contact of households was 0 and 5 times, respectively, while in terms of onion market participation, the average frequency of extension contact was 2.51 for market participants and 1.21 for non-market participants. The t-test results show that the mean difference was statistically significant at 1% indicating that there is a variation of households in terms of the average frequency of extension contact between market participants and non-participants (Table 2; Appendix Table A1).
3.1.6 Livestock ownership
The minimum and maximum livestock ownership in terms of tropical livestock units for households were 0.195 and 17.21, respectively, while in terms of onion market participation, the average livestock ownership was 9.18 for market participants and 8.61 for non-market participants. The t-test result shows that the mean difference was statistically insignificant, indicating that there was no variation in households in terms of average livestock ownership between market participants and non-participants (Table 2; Appendix Table A1).
3.1.7 Land allotted to onion
the minimum and maximum land size allotted for onion production by households was 0.125 and 1 hectare, respectively, while in terms of onion market participation, the average land allotted to onion production was 0.57 hectare for market participants and 0.49 hectare for non-market participants. The t-test result shows that the mean difference was statistically insignificant, indicating that there was no variation in households in terms of average land size allotted for onion production between market participants and non-participants (Table 2; Appendix Table A1).
3.1.8 Distance to the nearest market
the minimum and maximum distance to the nearest marketplace of households was 0 and 3 kilometers, respectively, while in terms of onion market participation, the average distance to the nearest marketplace was 1.14 kilometers for market participants and 1.77 kilometers for non-market participants. The t-test results show that the mean difference was statistically significant at 1% level, indicating that there was variation in households in terms of the average distance to the nearest market between market participants and non-participants (Table 2; Appendix Table A1).
3.1.9 Access to training
The results in Table 3 show that 74.38% of households had access to training, whereas 25.63% of households had no access to training on improved onion production. As shown in Table 75% of market participants had access to training, whereas 25% of market participants had no access to training. On the other hand, out of non-market participants, 70.83% of non-market participants had access to training while 29.17% of non-market participants had no access to training. The results of the chi-square test show that access to training was statistically insignificant, indicating that there was no association between market participation and access to training for households.
3.2 Econometric results
As mentioned in the research method of model specification, the double-hurdle model is evaluated against the Tobit model specification. The test statistic for the log-likelihood ratio test of onion commercialization is (LR = 250.93) which by far exceeds the critical χ2 value of 23.209 at the 1% level of statistical significance and 10 degrees of freedom. This reveals that the double-hurdle model is appropriate against Tobit. A full double hurdle model is appropriate for the dataset if there is a correlation between error terms of participation and level of participation in the onion market (Humphreys, 2013; Engel and Moffatt, 2014). For this data full double hurdle is not appropriate since the IMR is insignificant (has a p-value of 0.13), indicating that there is no correlation between the error terms (see Table A2). Thus, the Cragg hurdle model of double-hurdle model was appropriate for this dataset.
3.2.1 Determinants of onion market participation
The results for the determinants of market participation are estimated using the probit model, and the first step of the double hurdle is displayed in Table 4. The likelihood ratio chi-square (LR chi-square) value of the probit model is 54.71 is statistically significant at 1% indicating that the explanatory variables in the model explain the probability of participating in onion markets. Out of the nine explanatory variables included in the model, four variables that were found to significantly influence the probability of participation in the onion market of producers in the study area are discussed as follows.
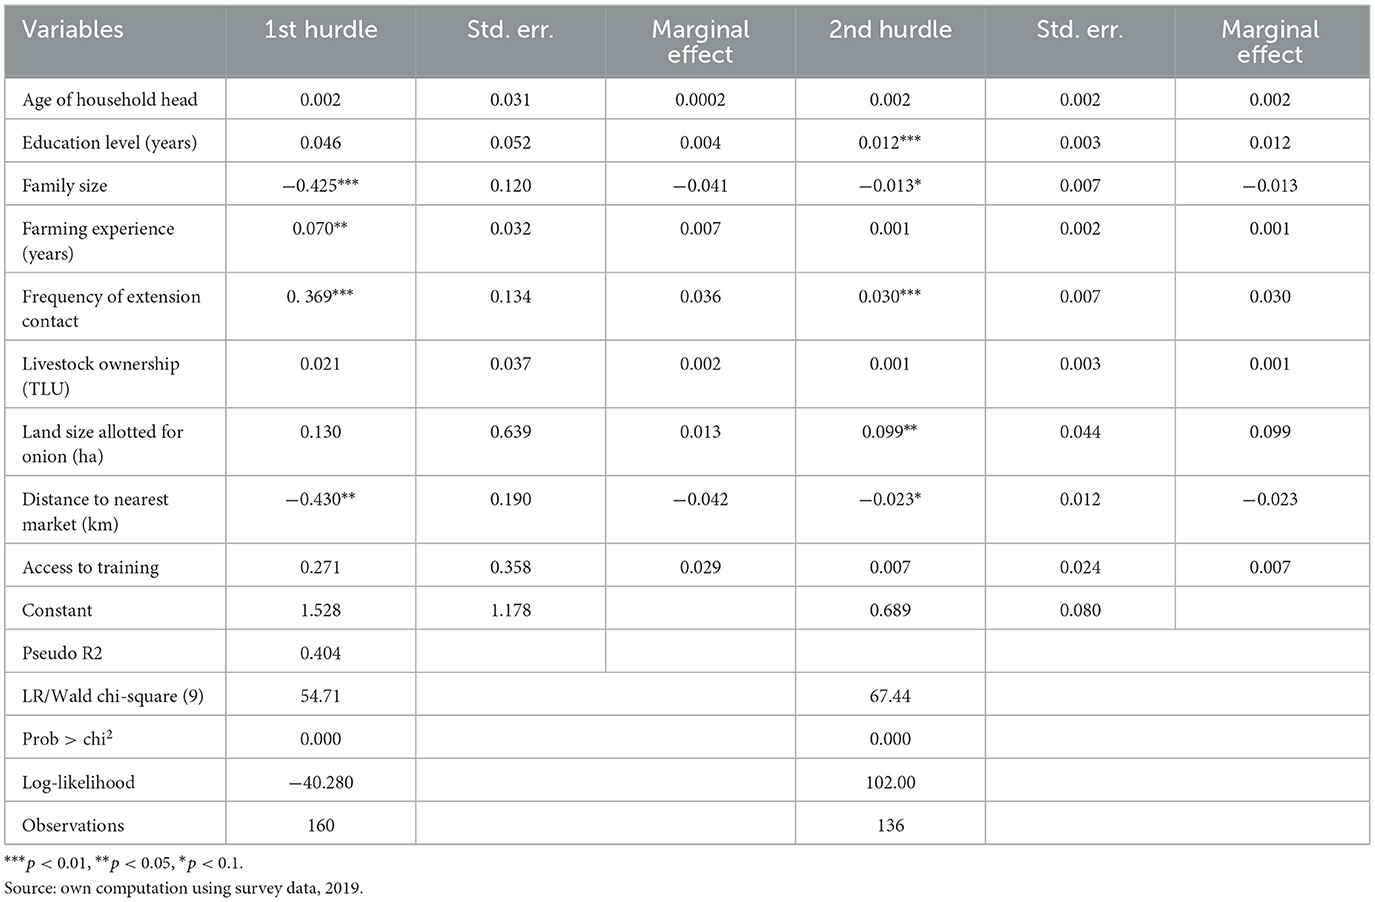
Table 4. Regression result for double hurdle model of onion commercialization.
3.2.1.1 Family size
Family size has negatively affected the likelihood of onion market participants at the 1% level of significance. The marginal effect shows that an additional member increase in family size in the family decreased the probability of onion producers' market participation by 4.1% (Table 4). This indicates that as the number of family members increases, farm households are more concentrated on consumption rather than production for the market due to a lack of sufficient onion surplus production for the market. This is due to the large number of children who contribute more to consumption rather than labor for the production of onions. This result is in line with the findings of Arega et al. (2008) which stated that a larger household is likely to consume more output, leaving smaller and decreasing proportions for sale; Gebreslassie et al. (2015), family size had negative and significant association with the market participation of the smallholder wheat farmers; Guta et al. (2020) family size negatively affected vegetable market participation; Nigus and Tsegaye (2022), found that family size negatively and significantly affected Avocado market participation. These findings are in contrast to the findings of Osmani and Hossain (2015), who found that family size has a positive effect on smallholder market participation, and Banchamlak and Akalu (2022) found that family size is positively associated with farmers' likelihood of participating in vegetable market supply in the Yayo and Hurumu districts of Ethiopia.
3.2.1.2 Farming experience (years)
Farming experience positively affected the probability of onion market participants at the 5% level of significance. The marginal effect shows that an additional year increase in the farming experience of the household head increases the probability of onion producers' market participation by 0.7% (Table 4). This is because farmers with more farming experience have greater awareness and knowledge regarding the production and marketing of onions, as compared to their counterpart onion non-producer farmers; therefore, they are more likely to take the risk of production and marketing and participate in the marketing of onions. This result is inconsistent with Tesfaye (2021), who found that farming experience positively affected onion commercialization in Ethiopia.
3.2.1.3 Frequency of extension contact
The frequency of extension contact positively affected the probability of onion market participants at the 1% level of significance. As shown in Table 4, an extra day of extended visits by extension workers increases the probability of onion producer participation in the market by 3.6%. This is because extension agents consult farmers on modern onion production methods and provide information on market availability and new and better varieties that enhance productivity. This result agrees with the studies conducted by Tesfaye (2021); Banchamlak and Akalu (2022) found that extension contacts positively affected onion and vegetable market participation, respectively.
3.2.1.4 Distance to nearest market (km)
Distance to the nearest market negatively affected the probability of onion market participants at the 5% level of significance. The marginal effect shows that an additional kilometer increase in distance for the household decreases the probability of onion producers' market participation by 4.2% (Table 4). This is because the further is a household from the onion market, the more difficult and costly it is to get involved in the onion market. The closer a farmer is to the market; the easier it is to take the products to the market because the farmer may not incur a high transportation cost. This result is in agreement with the study of Guta et al. (2020), who reported that distance to the marketplace has a negative and statistically significant influence on the commercialization of vegetables. Similarly, Berhanu et al. (2009) found that a large increment in the distance of the nearest market causes a reduction in the probability of participating in the maize market. Gizachew (2005) and Holloway and Ehui (2002) also found that negative relationship between distance to the market and the probability of participation in the milk market.
3.3 Factors affecting the level of onion commercialization
To determine the factors influencing the level of onion market commercialization, a truncated model was estimated in the second step of the double-hurdle model equation. The Wald chi-square value of the truncated regression model is 67.44 is statistically significant at 1% indicating that explanatory variable(s) in the model explain the level of commercialization of onion. Education level, family size, frequency of extension contact, land size allotted for onion production, and distance to the nearest market were found to have significantly influenced the level of onion commercialization in the onion market (Table 4).
3.3.1 Education level
The education level of household heads affected onion producers' level of commercialization positively and significantly at the 1% significance level. The result of the marginal effect revealed that a 1-year increase in the level of education of the household head increased the level of commercialization in the onion market by 1.2% (Table 4). This is because, as the level of education of household heads increases, the capacity to analyze and plan profitable types of farming business increases. The results of this study are consistent with those of Tadele et al. (2017), Addisu (2018), Agerie et al. (2020), and Asfaw et al. (2024), who found that the level of formal education increased the level of commercialization of wheat, teff, maize, and vegetables.
3.3.2 Family size
Family size is negatively and significantly affected the level of commercialization at a 10% level of significance. The marginal effect shows that an increase in the family size decreases the level of onion commercialization by 1.3% (Table 4). This is because a large family needs more onion to consume and less amount remains for sale as compared to small family-size households. This finding is consistent with that of Gani and Adeoti (2011): Musah et al. (2014) and Zelalem et al. (2023) who Confirmed that the household's level of market participation decreased because of increased family size. These are in contrast to the findings of Banchamlak and Akalu (2022), who reported that family size positively and significantly affected the vegetable market supply.
3.3.3 Frequency extension contact
The frequency of extension contact positively and significantly affects the level of onion commercialization at the 1% level of significance. As shown in Table 4, an extra day of extended visits by extension workers increased the level of onion producer participation in commercialization by 3%. The positive and significant relationship of frequency of extension contact indicates that extension contact improved onion farming households' ability to acquire new technologies and capacity of production, which in turn improved productivity and thereby increased commercialization of onion. This result is in line with the study by Gezahegn et al. (2022), who found that the frequency of extension contact positively and significantly affected the quantity of onion and tomato sold to the market. Similarly, Kassa et al. (2020), Teklebrhan et al. (2020), and Nigus and Tsegaye (2022) find that extension contact positively and significantly affects banana, onion, and avocado levels of market participation.
3.3.4 Land size allotted for onion production
Land size allotted for onion production positively and significantly affected the level of onion commercialization at the 5% level of significance. As shown in Table 4, a one-hectare increase in land allotted to onion production increased the level of onion producers' level of market commercialization by 9.9%. Households who allocate large plots of land for onion cultivation can produce more onions in surplus production beyond household consumption, thereby enabling households to supply more onion products to the market. This result is in line with Taye et al. (2018), who found that land allotted to onion production positively affects the amount of onion supplied to the market. Similarly, Ibrahim et al. (2021) found that the land allocated for tomato production positively affects the level of market participation.
3.3.5 Distance to nearest market (km)
Distance to the nearest market negatively and significantly affects the level of onion market commercialization at the 10% level of significance. The marginal effect shows that an additional kilometer increase in distance for the household decreases the level of onion producers' market commercialization by 2.3% (Table 4). This implies that the farther from the marketing center, the lesser the household's tendency to participate in the market. The more likely reason may be the high transportation cost of products per unit volume of the products. As a result, households may be discouraged from participating in the market because of the high transportation cost of transporting farm produce to the marketplace. This result is consistent with the studies by Efa et al. (2016), Kassa et al. (2020), Ibrahim et al. (2021), and Dagmawe et al. (2022), who found that distance from the center of the marketplace hurts market participation.
4 Conclusion and policy implications
This study examined the determinants of onion commercialization and the level of commercialization among smallholder farmers in Ethiopia, particularly in the Wolayita and Gomo zones of the South Region of Ethiopia. The study used both descriptive statistics to summarize household characteristics and an econometric model, namely the double-hurdle model, to uncover several factors influencing market participation and the level of commercialization in the onion market. The results of the study showed that the mean level of commercialization of smallholder farmers in the study area was 79.51%, which indicates that on average households are mainly producing for commercial purposes.
The findings revealed that demographic, socioeconomic, and institutional factors play significant roles in determining smallholder farmers' participation and level of commercialization in the onion market. Family size, farming experience, frequency of extension contact, and distance to the nearest market are significant factors affecting the market participation of onion producers. Educational level, family size, frequency of extension contact, land size allotted for onion production, and distance to the nearest market were factors affecting the level of onion commercialization.
Thus, the following recommendations were made.
To enhance onion commercialization and support smallholder farmers, policy initiatives should focus on several key areas. Investing in transportation infrastructure is crucial, as improved road networks and transportation facilities can lower costs and facilitate better market access for farmers. Additionally, expanding educational opportunities and agricultural training programs will equip farmers with the necessary knowledge and skills to engage more effectively in the market. Strengthening extension services, including increasing the frequency of visits, is essential for providing farmers with up-to-date information on modern production techniques, market opportunities, and new varieties. Furthermore, sustained research efforts are needed to explore additional factors influencing market participation and commercialization. By addressing these policy issues, governments and stakeholders can create a more supportive environment for onion commercialization, ultimately improving productivity and market access for smallholder farmers.
Data availability statement
The original contributions presented in the study are included in the article/Supplementary material, further inquiries can be directed to the corresponding author.
Ethics statement
Ethical review and approval was not required for the study on human participants in accordance with the local legislation and institutional requirements. Written informed consent from the participants was not required to participate in this study in accordance with the national legislation and the institutional requirements.
Author contributions
MW: Conceptualization, Data curation, Formal analysis, Investigation, Methodology, Software, Writing – original draft, Writing – review & editing. GG: Data curation, Investigation, Methodology, Supervision, Validation, Writing – review & editing.
Funding
The author(s) declare that financial support was received for the research, authorship, and/or publication of this article. This study was supported by the Ethiopian Institute of Agricultural Research.
Acknowledgments
We would like to express our deepest gratitude to the Ethiopian Institute of Agricultural Research for its funding, which made this research possible. Our heartfelt thanks go to the dedicated data collectors whose hard work and commitment were crucial in gathering the necessary data for this study. We are also immensely grateful to the households who participated in this research. Your cooperation and willingness to share your information were invaluable. This research would not have been possible without the contributions of each and every one of you.
Conflict of interest
The authors declare that the research was conducted in the absence of any commercial or financial relationships that could be construed as a potential conflict of interest.
Publisher's note
All claims expressed in this article are solely those of the authors and do not necessarily represent those of their affiliated organizations, or those of the publisher, the editors and the reviewers. Any product that may be evaluated in this article, or claim that may be made by its manufacturer, is not guaranteed or endorsed by the publisher.
Supplementary material
The Supplementary Material for this article can be found online at: https://www.frontiersin.org/articles/10.3389/frevc.2024.1443921/full#supplementary-material
References
Addisu, G. T. (2018). Determinants of Commercialization and Market Outlet Choices of Tef: The Case of Smallholder Farmers in Dendi District of Oromia, Central Ethiopia (A Master thesis). Haramaya University, Ethiopia.
Agerie, N. W., Fikeremaryam, B. F., Tadie, M. A., Gebrehiwot, A., and Wassihun, A. B. (2020). Analysis of maize commercialization among smallholder farmers: empirical evidence from north western Ethiopia. Lett. Spat. Resour. Sci. 15, 113–127. doi: 10.1007/s12076-021-00289-y
AgroBIG (2016). Onion Value Chain Analysis. Agro Big Programme for Agribusiness Induced Growth in the Amhara Region, Ethiopia.
Aklilu, B. M., Merkineh, M. M., and Barana, B. B. (2020). Causes and impacts of deforestation and forest degradation at Duguna Fango Woreda. Int. J. Nat. Resour. Ecol. Manag. 5, 14–25. doi: 10.11648/j.ijnrem.20200501.13
Arega, D. A., Manyong, V. M., Omanya, G., Mignouma, H. D., Bokanga, M., and Odhiambo, G. (2008). Smallholder market participation under transactions costs: maize supply and fertilizer demand in Kenya. J. Food Policy 33, 318–328. doi: 10.1016/j.foodpol.2007.12.001
Asfaw, S. G., Tebarek, L. M., and Meskerem, A. T. (2024). The extent and determinants of vegetable commercialization among smallholders in Sebeta Hawas Woreda, Oromia Region, Ethiopia. Cogent. Soc. Sci. 10:2299133. doi: 10.1080/23311886.2023.2299133
Ater, E. A., Mutai, B. K., and Bett, H. K. (2021). Factors influencing commercialization of horticultural crops among smallholder farmers in Juba, South Sudan. J. Econ. Sustain. Dev. 12, 45–56. doi: 10.7176/jesd/12-14-05
Banchamlak, H., and Akalu, T. (2022). Vegetable market supply by smallholder farmers in Ethiopia. Cogent Soc. Sci. 8, 1–23. doi: 10.1080/23311886.2022.2057058
Barrett, C. B. (2008). Smallholder market participation: concepts and evidence from eastern and southern Africa. Food Policy 33, 299–317. doi: 10.1016/j.foodpol.2007.10.005
Berhanu, G., Jaleta, M., and Hoekstra, D. (2009). Smallholders, institutional services, and commercial transformation in Ethiopia. Agric. Econ. 40, 773–787. doi: 10.1111/j.1574-0862.2009.00414.x
Berhanu, G., and Moti, J. (2010). “Commercialization of smallholders: Is market participation enough?” in Contributed Paper presented at the Joint 3rd African Association of Agricultural Economists (AAAE) and 48th Agricultural Economists Association of South Africa (AEASA) Conference (Cape Town).
Bezabih, E., and Hadera, G. (2007). Constraints and Opportunities for Horticulture Production and Marketing in Eastern Ethiopia. Dryland Coordination Group (DCG) Report, Ethiopia.
Carletto, C., Corral, P., and Guelfi, A. (2017). Agricultural commercialization and nutrition revisited: empirical evidence from three African countries. Food Policy 67, 106–118. doi: 10.1016/j.foodpol.2016.09.020
Cragg, J. (1971). Some statistical models for limited dependent variables with application to the demand for durable goods. Econometrica 39, 829–844. doi: 10.2307/1909582
CSA (2021). Agricultural Sample Survey of 2020/2021. Farm Management Practices (Private Peasant Holdings, Meher Season). Volume III. Addis Ababa: Central statistical Agency.
Dagmawe, M. A., Sirage, M. S., and Atinkugn, A. B. (2022). Determinants of market participation decision and intensity among date producers in Afar Region, Ethiopia: a double hurdle approach. Int. J. Fruit Sci. 22, 741–758. doi: 10.1080/15538362.2022.2119189
Direslgne, M., Begosew, M., and Gistane, A. (2016). House hold dietary diversity and associated factors in Mirab Abaya wereda southern Ethiopia 2016; community based cross sectional study. Diver Equal Health Care 13, 293–296. doi: 10.21767/2049-5471.100065
Dubale, A., Fikadu, M., and Rijalu, N. (2022). Commercialization level and determinants of market participation of smallholder wheat farmers in northern Ethiopia. Afr. J. Sci. Technol. Innovat. Dev. 14, 428–439. doi: 10.1080/20421338.2020.1844854
Efa, G. T., Degye, G., Tinsae, D., and Tadesse, K. (2016). Determinants of market participation and intensity of marketed surplus of teff producers in Bacho and Dawo districts of Oromia State, Ethiopia. J. Agric. Econ. Dev. 5, 20–32.
Engel, C., and Moffatt, P. G. (2014). Dhreg, Xtdhreg, and Bootdhreg: commands to implement double-hurdle regression. Stata J. 14, 778–797. doi: 10.1177/1536867X1401400405
Engida, G., Agegnehu, W., and Kusse, H. (2021). Determinants of sorghum crop commercialization the case of Southwest Ethiopia. Heliyon 7, 1–8. doi: 10.1016/j.heliyon.2021.e07453
Gani, B. S., and Adeoti, A. I. (2011). Analysis of market participation and rural poverty among farmers in northern part of Taraba State, Nigeria. J. Econ. 2, 23–36. doi: 10.1080/09765239.2011.11884934
Gebreslassie, H., Kebede, M., and Kiros, M. A. (2015). Crop commercialization and smallholder farmers livelihood in Tigray Region, Ethiopia. J. Dev. Agric. Econ. 7, 314–322.
Gezahegn, A., Aman, R., and Chala, H. (2022). Producers' participation decision in tomato and onion marketing with level of participation in Ejersa lafo district of west Shewa Zone, Oromia National Regional State, Ethiopia. Malays. Bus. Manag. J. 1, 1–6. doi: 10.26480/mbmj.01.2022.01.06
Gizachew, G. (2005). Dairy Marketing Patterns and Efficiency: The Case of Ada'Liben District, Eastern Oromia (MSc thesis). Alemaya University, Ethiopia.
Goldman, I. L. (2011). Molecular breeding of healthy vegetables. EMBO Rep.12, 96–102. doi: 10.1038/embor.2010.215
Guta, R. M., Rijalu, N., Adugna, E. B., and Diriba, B. N. (2020). Smallholder market participation and its associated factors: evidence from Ethiopian vegetable producers. Cogent. Food Agric. 6, 1–15. doi: 10.1080/23311932.2020.1783173
Hagos, A. R., Abraha, K. Z., Gebreslassie, W. L., and Beyene, W. G. (2018). Assessment of production potential and post-harvest losses of fruits and vegetables in northern region of Ethiopia. Agric. Food Sec. 7, 1–13. doi: 10.1186/s40066-018-0181-5
Holloway, G. J., and Ehui, S. (2002). Expanding Market Participation Among Smallholder Livestock Producers: A Collection of Studies Employing Gibbs Sampling and Data From the Ethiopian Highlands. 1998-2001 (No. 48). Nairobi: ILRI (aka ILCA and ILRAD).
Humphreys, B. R. (2013). Dealing With Zeros in Economic Data. Department of Economics, University of Alberta, 1–27.
Ibrahim, A., Abduselam, F., Assefa, A., Alemayehu, O., and Mulubrihan, B. (2021). Determinants of market participation among smallholder vegetable producers in Southwest Ethiopia. Ethiop. J. Appl. Sci. Technol. 12, 24–37.
ITA (2024). International Trade Administration. Available at: https://www.trade.gov/country-commercial-guides/ethiopiaagricultural-sectors (accessed April 28, 2024).
Kassa, T., Akililu, A., Tesfaye, G., and Yishak, S. (2020). Value chain analysis of banana in Bench Maji and Sheka Zones of Southern Ethiopia. Cogent. Food Agric. 6:1785103. doi: 10.1080/23311932.2020.1785103
Kirui, O. (2019). “The agricultural mechanization in Africa: micro-level analysis of state drivers and effects,” in ZEF-Discussion Papers on Development Policy (272) (University of Bonn – Center for Development Research (ZEF), Germany).
Komarek, A. (2010). Determinants of banana market commercialization in Western Uganda. Afr. J. Agric. Res. 5, 775–784.
Kusse, H., Engida, G., and Agegnehu, W. (2022). Determinants of market participation among smallholder farmers in Southwest Ethiopia: double-hurdle model approach. Agric. Food Sec. 11:18. doi: 10.1186/s40066-022-00358-5
Minot, N., Warner, J., Samson, D., and Tadiwos, Z. (2022). Agricultural Commercialization in Ethiopia Trends, Drivers, and Impact on Well-Being, Discussion Paper-02156. Washington, DC: IFPRI.
MoARD (2010). Ethiopia's Agricultural and Sector Policy and Investment Framework (PIF): 2010–2020. Addis Ababa.
MoFED (2010). Growth and transformation plan (GTP) 2010/11 2014/15. Addis Ababa: Ministry of Finance and Economic Development, Government of Ethiopia.
MoFED (2016). Growth and Transformation Plan II (2015/16- 2019/20). Vol. I. Ministry of Finance and Economic Development, Ethiopia.
Moffatt, P. G. (2005). Hurdle models of loan default. J. Operat. Res. Soc. 56, 1063–1071. doi: 10.1057/palgrave.jors.2601922
Moti, J. (2007). Econometric Analysis of Horticultural Production and Marketing in Central and Eastern Ethiopia. Wageningen University, Netherlands.
Moti, J., Berhanu, G., and Hoekstra, D. (2009). “Smallholder commercialization: processes, determinants and impact,” in Discussion Paper No. 18. Improving productivity and market success (IPMS) of Ethiopian Farmers Project. Nairobi: ILRI.
Muluneh, B. E., Mosissa, C. A., and Bikila, O. F. (2019). Major onion (Allium cepa L.) production challenges in Ethiopia: a review. J. Biol. Agric. Healthc. 9, 42–47. doi: 10.7176/JBAH
Musah, A. B., Bonsu, O. A. Y., and Seini, W. (2014). Market participation of smallholder maize farmers in the upper west region of Ghana. Afr. J. Agric. Res. 9, 2427–2435. doi: 10.5897/AJAR2014.8545
NBE. (2019). Ethiopia's Overall Economic Performance. Available at: https://nbebank.com/wp-content/uploads/pdf/annual_bulletin/report-2018-2019 (accessed April 23, 2024).
Newman, C., Henchion, M., and Matthews, A. (2001). The infrequency of purchase and double hurdle model of Irish households? meat expenditure. Eur. Rev. Agric. Econ. 28, 393–412. doi: 10.1093/erae/28.4.393
Nigus, G., and Tsegaye, M. (2022). Analysing the factors that influence market participation among avocado producers in Kaffa Zone of South-Western Ethiopia. Int. J. Fruit Sci. 22, 794–808. doi: 10.1080/15538362.2022.2129549
Ogutu, S. O., and Qaim, M. (2019). Commercialization of the small farm sector and multidimensional poverty. World Dev. 114, 281–293. doi: 10.1016/j.worlddev.2018.10.012
Olwande, J., Smale, M., Mathenge, M. K., Place, F., and Mithöfer, D. (2015). Agricultural marketing by smallholders in Kenya: a comparison of maize, kale and dairy. Food Policy 52, 22–32. doi: 10.1016/j.foodpol.2015.02.002
Osmani, A. G., and Hossain, E. (2015). Market participation decision of smallholder farmers and its determinants in Bangladesh. Економика пољопривреде 62, 163–179. doi: 10.5937/ekoPolj1501163G
Poulton, C. (2017). What Is Agricultural Commercialization, Why Is It Important and How Do We Measure It? Agricultural Policy Research in Africa. Working paper-06, agricultural Policy Research in Africa (APRA) workshop in Brighton from January 23–26.
Tadele, M., Wudineh, G., Agajie, T., Ali, C., Tesfaye, S., Aden, A., et al. (2017). Analysis of wheat commercialization in Ethiopia: the case of SARD-SC wheat project innovation platform sites. Afr. J. Agric. Res. 12, 841–849. doi: 10.5897/AJAR2016.11889
Tamrat, G., Mengistu, K., Arega, S., and Getachew, L. (2023). Drivers of crop commercialization in central and southern Oromia, Ethiopia. Discover Food. 3:15. doi: 10.1007/s44187-023-00055-7
Taye, M., Abebe, B. D., and Tadie, M. A. (2018). Determinants of commercialization by smallholder onion farmers in Fogera district, South Gondar Zone, Amhara national regional State, Ethiopia. J. Dev. Agric. Econ. 10, 339–351. doi: 10.5897/JDAE2018.0964
Teklebrhan, A., Bezabih, E., and Girma, G. G. (2020). Factors affecting onion market supply in the Medebay Zana district, Tigray regional state, Northern Ethiopia. Cogent. Food Agric. 6:1712144. doi: 10.1080/23311932.2020.1712144
Tesfaye, T. (2021). Determinants of onion output market participation level among smallholder farming households: the case of Fentale District, Oromia Regional State, Ethiopia. J. Market. Cons. Res. 82, 1–11. doi: 10.7176/JMCR/82-01
Trading Economics (2024). Available at: https://tradingeconomics.com/ethiopia/gdp-from-agriculture (accessed April 28, 2024).
Von-Braun, J. (1994). “Introduction,” in Agricultural Commercialization, Economic Development, and Nutrition, eds. J. Von Braun, and E. Kennedy (Baltimore, MD: Johns Hopkins University Press), 3–8.
Wooldridge, J. (2002). Econometric Analysis of Cross-Section and Panel Data. Massachusetts: The MIT Press.
World Bank (2017). International Development Association: Project Appraisal Document on a Proposed Credit in the Amount of SDR 121.1 Million (US$ 170 Million Equivalent) to the Federal Democratic Republic of Ethiopia for a Livestock and Fisheries Sector Development Project (Project Appraisal Document no. PAD2396). Washington, DC.
Yamane, T. (1967). Statistics: An Introductory Analysis. 2nd ed. New York, NY; Evanston, IL; London; Tokyo: Harper and Row; John Weatherhill, Inc.
Keywords: commercialization, double hurdle, households, market participation, onion
Citation: Wondim MT and Geyo GB (2024) Determinants of commercialization among onion producer households in southern Ethiopia: a double hurdle approach. Front. Environ. Econ. 3:1443921. doi: 10.3389/frevc.2024.1443921
Received: 04 June 2024; Accepted: 25 September 2024;
Published: 09 October 2024.
Edited by:
Djamel Rahmani, Center for Agro-Food Economics and Development (CREDA), SpainReviewed by:
Sameh Missaoui, Center for Agro-Food Economics and Development (CREDA), SpainLouinord Voltaire, Université du Littoral Côte d'Opale, France
Copyright © 2024 Wondim and Geyo. This is an open-access article distributed under the terms of the Creative Commons Attribution License (CC BY). The use, distribution or reproduction in other forums is permitted, provided the original author(s) and the copyright owner(s) are credited and that the original publication in this journal is cited, in accordance with accepted academic practice. No use, distribution or reproduction is permitted which does not comply with these terms.
*Correspondence: Melkamu Tilaye Wondim, bWVsa2FtdXR3QGdtYWlsLmNvbQ==