 Yuling Ruan
 Anqi Zhang
- 1Faculty of Business Administration, Yamanashi Gakuin University, Kofu, Japan
- 2School of Customs and Public Economics, Shanghai Customs College, Shanghai, China
While economic development brings serious environmental problems, technological advances can effectively reduce pollution, which helps to achieve the Sustainable Development Goals. Although the impact of green technology innovation on atmospheric pollutants and carbon emissions has been extensively studied, the effect of such innovation on pollutant reduction varies due to the diverse regional distribution characteristics of different pollutants. Thus, this paper contributes to the literature by examining the influence of green technology innovation on water pollution from a regional perspective, with a particular emphasis on the pronounced clustering of wastewater pollution in China's coastal areas. Both Fixed-Effect model and spatial analysis are adopted. Our findings reveal a significant U-shaped relationship between technology innovation and water pollution, as measured by both industrial wastewater and the ratio of unprocessed sewage. Interestingly, this pollution reduction effect also exhibits a U-shaped spatial spillover. Given the rapid development of the digital economy, it can further amplify the spatial spillover effect of green innovation, especially in eastern regions. This study also provides recent empirical evidence from China to the Environmental Kuznets Curve.
1 Introduction
While China is experiencing rapid economic growth after the opening-up reform in 1978, the country has also been grappling with serious environmental pollution issues. Since 2012, the 18th National Congress of the Chinese Communist Party has aimed to make great efforts to promote ecological progress. Moreover, in 2017, the 19th National Congress of the Chinese Communist Party established the goal of achieving high-quality development. This goal recognizes the importance of promoting green, low-carbon, and circular economies as the country transitions from high-speed growth to high-quality development. Meanwhile, pollution also poses significant challenges to the health of our planet and its inhabitants, which directly contradicts the United Nation's Sustainable Development Goals (SDGs). Therefore, the foundation for achieving high-quality development and SDGs lies in enhancing innovation capability. This capability includes not only traditional R&D activities but also research activities in sustainable development, with a focus on developing and applying green technologies. Green innovation encompasses a range of technologies such as renewable energy, energy conservation, recycling, waste disposal, emission gas treatment, and environmental assessment technologies. The adoption of these technologies is expected to lead to more efficient and environmentally friendly products and services, which can help to reduce pollution and conserve resources.
Literature has demonstrated that technological advances can ameliorate environmental pollution since the 1970s. Ehrlich and Holdren (1971) point out that technological advances could mitigate the growth of pollution engendered by population growth. Besides traditional technological advances, Yang et al. (2023) observe that enterprises are equally benefiting from the reduction of pollutant emissions as they adopt digital technologies. However, Brookes (1978, 1990) and Khazzoom (1980) argue that energy savings resulting from energy efficiency improvements may be negated by increased energy consumption due to behavioral responses of economic individuals. They suggest that energy efficiency improvements do not necessarily lead to a reduction in energy demand [this is referred to as the “Khazzoom-Brookes (K-B) hypothesis”]. Later in 1995, Grossman and Krueger (1995) pointed out that there is an inverted U-shaped relationship between the level of economic development and the emission of environmental pollutants, which is known as the environmental Kuznets Curve (EKC). The relationship between technological or economic development levels and pollution reduction is not only linear. Furthermore, it is necessary to consider the spatial effects of green innovations on the reduction of industrial water pollutants, considering the following two facts. Firstly, both green technologies (knowledge) and industrial water pollutants are characterized by spatial spillovers. One the other hand, there is variation in the spatial relationship between land use and water pollution (Huang et al., 2015), which may have implications for the relationship between green technologies and industrial water pollutant abatement.
At present, the effects of green technology innovation on pollution reduction are widely confirmed (Levinson, 2009; Dangelico and Pujari, 2010; Hecker et al., 2020; Yi et al., 2020; Zhou et al., 2023; Tian et al., 2024; Yu and Zhang, 2024). Recent studies also notice the spillover effect of green technology innovation on pollutant emissions (Ma et al., 2016; Li et al., 2023; Zhang and Xu, 2023; Zhou et al., 2023). However, the majority of studies predominantly address air pollution issues and carbon emission, with few addressing water pollution and wastewater management. Particularly in China, water pollution is significantly influenced by geographical factors, leading to considerable regional disparities in the spatial impact of green technology innovation on water pollution and sewage treatment. This paper aims to fill the gap by examining the influence of green technology innovation on water pollution from a regional perspective. First, considering the non-linear relationship between economic development and environmental pollution indicated by the Environmental Kuznets Curve (EKC), this paper explores whether there is a non-linear relationship between green technology innovation and water pollution, measured by industrial wastewater emissions or municipal wastewater treatment capacity. i.e., the ratio of unprocessed sewage. Second, it analyzes both the spatial spillover effect of water pollution between cities and water pollution, re-examining the effect of green technology innovation on pollution reduction considering the spatial spillover characteristic of water pollution. We find a significant U-shaped relationship between technology innovation and water pollution, measured by both industrial wastewater and the ratio of unprocessed sewage. Moreover, this pollution reduction effect of the green technology innovation has a U-shaped spatial spillover. Considering the rapid development of the digital economy, it can further enhance the spatial spillover effect of green innovation and can help to reduce the regional inequality in pollution reduction capability between Eastern and Central-Western areas. Therefore, this paper also provides more recent empirical evidence of China to the Environmental Kuznets Curve.
This paper is organized as follows: Section 1 provides an introduction; and Section 2 discusses the literature. Section 3 describes the research methodology and data; Section 4 shows the empirical results; Section 5 provides further analysis of the results in terms of spatial heterogeneity and Section 6 concludes.
2 Literature review
2.1 Green technology and pollutant emissions
The relation between technology and pollution reduction has long been studied. Levinson (2009) contend that technology and international trade could diminish the level of environmental pollution. A significant portion of the pollution reduction in the U.S. manufacturing sector has primarily resulted from technological advances, given that technology can further decrease the level of environmental pollution through economies of scale and learning-by-doing methods. Some literature argues that green technology, which encompasses the use of clean energy, pre-treatment, and final treatment technologies for pollution, can reduce wastewater emissions through improvements in these technologies. Due to the physical life cycle of green products, green product innovation has varying impacts on materials, energy, and pollution in the three stages of manufacturing, product use, and disposal. Although not all products have significant impacts during every stage of their physical life cycle, most products do have a considerable environmental impact during at least one stage. Especially in emerging alternative energy markets, demand for green products can be stimulated by public policies, subsidies, and consumer rebates (Dangelico and Pujari, 2010). Nonetheless, there are studies indicating that the impact of technology on reducing pollution is not instantaneous. For instance, Yi et al. (2020) examine the impact of heterogeneous technologies on haze pollution by using interprovincial data from China. This study points out that although technological progress can manage haze pollution in the long run, they are not effective in haze reduction if the energy-saving effect fails to outweigh the energy rebound effect. More recently, Wang et al. (2019) show that industrial agglomeration, environmental regulations, and technological inputs facilitate emissions intensity abatement. Zhou et al. (2023) find that green technology innovation not only plays a significant role in reducing atmospheric environmental pollution but also generates spatial spillover effects. Tian et al. (2024), using data from the Yangtze River urban agglomeration, demonstrate that technological innovation can have an inhibitory effect on the haze pollution effect of co-agglomeration. Yu and Zhang (2024) argue that raising the level of urban innovation can reduce haze pollution through the effects of technological upgrading, structural optimization, and resource agglomeration.
In addition, the process of industrialization and urbanization is accompanied by technological progress, which includes both green and non-green technologies. Since technological innovation is endogenous in economic development, the relationship between technological progress and environmental pollution may be influenced by the relationship between the level of economic development and environmental pollution. However, as previously mentioned, Grossman and Krueger (1995) propose the Environmental Kuznets Curve (EKC), which illustrates an inverted U-shaped relationship between the level of economic development and emissions of environmental pollutants. The EKC illustrates that during the primary stage of economic development, environmental pollution increases with economic growth. However, once a certain level of economic development is reached, the situation of environmental pollution can be alleviated with further economic growth. This is primarily attributed to the fact that the emission of pollutants increases in areas at the primary stage of economic development with their rapid industrialization and urbanization. In regions with a lower level of economic development, rapid development of infrastructure projects may result in more industrial water pollutant emissions. Nevertheless, Dasgupta et al. (2002) suggest that the curve is flattening and shifting to the left, affected by economic liberalization, clean technology diffusion, and new approaches to pollution regulation in developing countries. Kaika and Zervas (2013) propose that income is a possible factor in the EKC relationship due to energy consumption. Later Stern (2017) proves that economic growth has a strong positive effect on carbon dioxide, and sulfur dioxide, but weaker effects on non-industrial greenhouse gas emissions and concentrations of particulates.
More empirical research on EKC has shown up in the recent decade. Huang et al. (2015) find that built-up had a positive spatial effect on water pollutants, especially in sub-watersheds with low build-up density, with the greatest increase in pollution per increase in building density. However, when economic development reaches a certain level, the environmental pollution increases prompting the government to introduce a series of environmental regulations used to strengthen pollution regulation and treatment, and the level of environmental pollution will be improved. Therefore, it is likely that there is not a simple linear relationship between technological progress and environmental pollution reduction. Acemoglu et al. (2016) argue that in production and innovation, clean and dirty technologies compete with each other, and if the level of dirty technologies is more advanced, or the gap between clean and dirty technologies is too large, it may discourage research incentive on directed to clean technologies. Therefore, regions with a higher degree of economic development, where the gap between existing technologies and green technologies is smaller, are likely to adopt green technologies more readily and apply them quickly to reduce emissions. Dasgupta et al. (2002), and Park and Lee (2011) also find that the shape of the EKC is likely to be different due to the different characteristics of each region and pollutant type. Sirag et al. (2018) apply the dynamic panel threshold method to estimate the EKC turning point. It reveals the existence of a nonlinear relationship between income (GDP per capita) and carbon dioxide emissions. Song et al. (2023) point out that there exists a typical U-shaped curve relationship between technological innovation and air pollution. When technological innovation falls below a certain threshold, it will exert a noticeable inhibitory effect on air pollution. Conversely, when technological innovation surpasses a certain critical threshold, excessive technological innovation will exacerbate air pollution.
However, other studies do not support the EKC hypothesis. For instance, when assessing the impact of population, income, and technology on energy consumption and industrial pollutant emissions in China, Liu et al. (2015) do not find evidence of the EKC hypothesis for industrial waste in China. Furthermore, Özokcu and Özdemir (2017) use two different models and show that N-shape and an inverted N-shape relationship between income and Carbon Dioxide emissions. Thus, the result implies that environmental degradation cannot be solved automatically by economic growth. Allard et al. (2018) empirically investigate the relationship between CO2 emissions and GDP per capita and find an N-shaped EKC in all income groups, except for upper-middle-income countries.
2.2 The role of digital economics on pollutant emissions
Since 2012, the 18th CPC National Congress has aimed to make great efforts to promote ecological progress and low-carbon economic. To achieve this goal and accelerate the green transformation, in addition to focusing on previous technological innovations (e.g., traditional technologies in the past), more attention is being paid to green technology innovations. In this context, with the arrival of the fourth industrial revolution and the rapid development of digital technology, more and more scholars are focusing on the digital technology application on green technology innovation.
The digital economy has rapidly developed and expanded since 2011. The overall scale of China's digital economy expanded from 9.49 trillion yuan in 2011 to 31.29 trillion yuan (added value) in 2018, and the proportion of the digital economy in GDP rose from 20.3% in 2011 to 32.9% (China Academy of Information and Communications Technology, 2020). With the rapid development of the digital economy, digital technology is constantly infiltrating China's social development. This includes digital industrialization, industrial digitization, and digital governance. Industrial digitization helps to improve the production efficiency of traditional industries, while digital governance helps the government optimize governance models and improve the quality of public services. Zhang et al. (2024) argue that digital technology applications help companies to save energy and reduce emissions. The improvement of productivity in traditional industries and the improvement of the quality of government public services are closely related to pollution reduction and the improvement of urban municipal pollution treatment capabilities. The digital economy can contribute to pollution reduction primarily in two ways.
First, it provides robust technical support for green technology innovation activities. Hampton et al. (2013) found that the emergence of big data during the information age has facilitated ecologists' scientific research and turned ecology into a data-intensive industry. Lee et al. (2022) consider that information and communication technology (ICT) contribute to the advancement of renewable energy technology innovation (RETI) by influencing human capital accumulation, financial development and information disclosure. Intelligent manufacturing can significantly reduce the concentration of PM2.5 in the air and environmental pollution by optimizing resource allocation during production and operation. Tang et al. (2022) find that telecommunications infrastructure fosters eco-efficiency growth by facilitating green innovation, upgrading industrial structure, and enhancing resource allocation efficiency. Xu et al. (2022) find that the digital economy can reduce urban carbon emissions. Shen and Zhang (2023) discover that intelligent manufacturing can notably decrease the concentration of PM2.5 in the air and environmental pollution by optimizing resource allocation throughout production and operations.
Second, through the development of modern information networks, the digital economy enhances environmental monitoring and improves the efficiency of resource use. Moyer and Hughes (2012) argue that ICT technologies can reduce overall energy intensity and help to reduce carbon emissions. Angelidou (2017) considers that the digital economy favors networking at the physical and digital levels. Participation in networks for exchanging knowledge and experience, as well as sharing of resources, is achieved through cooperation with other cities. Deng and Zhang (2022) use Chinese urban panel data to investigate the impact of the digital economy on urban pollution. The study revealed that the digital economy significantly reduced urban environmental pollutant emissions and contributed to the reduction of overall regional environmental pollution emissions. This effect was mainly achieved through the green innovation effect and the optimization of industrial structures to reduce urban environmental pollution emissions.
While the development of the digital economy has a positive effect on pollution reduction and the urban governance capacity, it may also have a negative impact on the environment. Ren et al. (2021) discuss that the Internet promotes the energy consumption scale through economic growth. Moreover, Lange et al. (2020) argue that digitalization leads to more energy consumption when the direct energy growth effects from economic growth are greater than the energy efficiency improvement effects from digitalization. Thus, the impact of the digital economy on the relationship between green technology innovation and industrial wastewater emission reductions may vary, given the regional imbalances in China's economic development and the degree of development of digital economics.
2.3 Spatial spillover effects of green technology innovation on pollutant emissions
Since environmental pollutants spread from one region to another with air and water flow, spatial spillover effects should be considered when studying pollutant emissions. Ma et al. (2016) pointed out that the relationship between economic development and PM2.5 pollution in China is consistent with the EKC hypothesis, and factors such as urbanization, population density, number of cars, and energy intensity are the main sources of haze pollution. There is also a spatial spillover effect of PM2.5 influenced by inter-regional economic linkages. Wang et al. (2021) find that the rationalization and upgrading of the industrial structure in neighboring cities help alleviate local haze pollution. Similarly, Zhou et al. (2023) construct a spatial measurement model and find out green-technology innovation has a significant inhibitory effect and a spatial spillover effect on atmospheric environmental pollution. When environmental regulation reaches a level of intensity, green-technology innovation can effectively curb atmospheric environmental pollution. Accordingly, environmental regulations, especially on green technology innovation can effectively reduce pollution in various ways. For instance, Keller and Levinson (2002), and Copeland and Taylor (2004) argue that the strengthening of environmental regulations can induce firms to relocate their businesses to reduce the cost of environmental pollution management. More recently, Li et al. (2023) assess the effect of green technology innovation on energy-environmental efficiency and find a U-shaped impact, while environmental regulation can mitigate the negative impact while strengthening its positive effect. Interestingly, Zhang and Xu (2023) use panel data from 284 prefecture cities in China between 2007 and 2019 to demonstrate the existence of the spatial spillover effect of green technology innovation, which is affected by different types of environmental regulations in distinct ways. More specifically, Chang et al. (2023) investigate the moderating effect of environmental regulations on green innovation and carbon dioxide emissions reduction. Among different types of regulatory instruments, investment-based regulation is the most effective in promoting the relationship between green innovation and emissions reduction. Besides regulations, financial agglomeration level is another influencing factor in the effect of green technology innovation on carbon emission (Han et al., 2022). In addition, the exchange of knowledge and experience through digital technologies may result in spatial spillovers from the role of green technologies in pollutant emissions. Therefore, the efficiency of environmental management may also be influenced by spatial factors.
Although previous research has established the spatial spillover effect of green technology innovation on carbon emission, we found fewer studies have focused on the spatial spillover effects of industrial wastewater. Hecker et al. (2020) suggest that wastewater treatment spills over among neighboring municipalities. But their study focuses on the spatial spillover effects of the degree of social development and urbanization on sewage treatment capacity. Shao (2020) finds that per capita gross ocean product has notably intensified marine pollution. Nevertheless, the impact of this trend appears to be diminishing over time, indicating that China is still situated in the early phase of the EKC, with the peak yet to be reached. Furthermore, high-quality marine patents exhibit a more pronounced effect in reducing marine pollution. However, the study focuses on the marine economy and does not provide a detailed analysis of wastewater generated by industry as a whole, as well as municipal wastewater management.
Different from the existing literature on the effect of green technology innovation on atmospheric pollutants and carbon emissions, this paper contributes to the literature by focusing more on wastewater and municipal pollutant treatment capacity. More specifically, we analyze the spatial spillovers of green technology innovations on wastewater reduction and municipal wastewater treatment capacity improvements, and on this basis we compare whether such spatial spillovers differ between regions due to differences in the level of economic development or the degree of development of digital economics.
3 Methodology and data
3.1 Model
3.1.1 Effect of green innovation on water pollution
As previously stated, there exists a non-linear relationship between the level of technological or economic development and pollution reduction. One of the objectives of this paper is to ascertain whether a similar non-linear relationship exists between the level of innovation in green technology innovation and pollution reduction. To test whether there is a nonlinear relationship between green technology innovation and integrated water pollution prevention and control, the following basic model (Equation 1) is estimated:
Where i and t represent the city and year respectively. a0 is a constant term, Grinvit represents the green technology innovation level, and represents the square of green technology innovation. CVit is the vector of control variables, γi and λt are the city and year fixed effect, respectively, and εit is an error term. Yit is the vector of dependent variables to represent the degree of integrated water pollution prevention and control. We utilize two primary indicators to assess the water pollution treatment. The first is the volume of industrial wastewater, which is known as a major component of water pollution. The second indicator is the ratio of wastewater untreated by the centralized sewage treatment plants. This measures the degree of a city's sewage collection and treatment capabilities from the perspective of municipal infrastructure construction. Indeed, lower values of these two indicators signify a better level of water pollution control.
Furthermore, considering the spatial spillover of pollutant emissions, the subsequent spatial Durbin model is estimated to control the possible bias. This bias could be caused by the influence of spatial correlation of wastewater emissions or municipal wastewater treatment capacity on the non-linear relationship between green innovation and pollution. To test whether there is a spatial effect, we estimate the following model (Equation 2):
Where ρ is the spatial lag estimator and shows the degree of mutual influence of pollutant emissions in neighboring areas, φ represents the spatial lag estimator of explanatory variables, and Wij represents the spatial weight matrix. The spatial matrix here is established in two ways: one is the spatial proximity matrix, which assigns a value of 1 if two cities are geographically adjacent, and 0 otherwise. The other is the spatial distance matrix, which assigns a value of 1 according to the reciprocal of the distance between cities. Given that neighboring regions have greater weights in the spatial weight matrix, there may be a proximity transfer effect of the positive impact of green technology innovation on pollution reduction or an increase in municipal wastewater treatment capacity.
The key independent variable Grinvit represents the green technology innovation level, presented by the natural logarithm of the amount of a city's green invention patents. There are two main dependent variables are selected as the proxies of integrated water pollution prevention and control in cities, including industrial wastewater (lnew) and the ratio of wastewater untreated by the centralized sewage treatment plants, representing the municipal wastewater treatment capacity, i.e., the ration of unprocessed sewage (sewage ratio).
In terms of control variables, we utilize the ratio of the secondary industry to GDP (IS) to represent the industrial structure. The natural logarithm of per capita GDP (lnpgdp) is used to measure the level of economic development in cities. Referring to Shen et al. (2017), we use the proportion of actual FDI to total GDP (Open) by cities to represent the degree of trade openness, and the proportion of total retail sales of social consumer goods to total GDP (Consumption) is adopted to indicate domestic consumption. Additionally, we also included population density (PD) as a control variable to measure urbanization level.
3.1.2 The influence of the digital economics
The above section aims to demonstrate the effect of green innovation on water pollution, now we further explore how digital economic development affects the relationship between green technology innovation and pollutant reduction (Equation 3):
According to the principal component analysis by Zhao et al. (2020), we measure the level of digital economic development using the following five indicators: the number of Internet users per 100 people, the proportion of employment in the computer service and software industry, per capita telecommunications cost (yuan), the number of mobile phone users per 100 people, and the China Digital Inclusive Finance Index. Therefore, the index digitalit is obtained to measure the level of digital economic development in city i in year t.
By adding the interaction of the digital economic development proxy digitalit and the green innovation variable Grinvit and comparing it with Model (2), we can observe how digital economic development affects the relationship between green innovation level and pollutant reduction.
3.2 Data
The key explanatory variable in this study is the number of green invention patents granted in each city, published by China's National Intellectual Property Administration. Based on the definition of green patents from the International Patent Green Classification List published by the World Intellectual Property Organization (WIPO GREEN), it includes Alternative energy production, Transportation, Energy conservation, Waste management, Agriculture/Forestry, Administrative, Regulation or design aspects and Nuclear power generation. Notably, the actual patents granted can filter out invalid applications and represent the quality of invention patents. Besides, considering obtaining patent grants is generally 2 years after patent application, using the number of patents granted can more accurately measure the effect of green inventions on pollutant reduction (Xu and Zhang, 2021).
The wastewater emissions data, the ratio of unprocessed sewage and control variables are from the China Urban Statistical Yearbook. Some missing values are replaced by data in the city's statistical yearbooks. For missing values that cannot be obtained from either resource, we use linear interpolation to make them balance. The China Digital Inclusive Finance Index is collected from the Digital Finance Research Center of Peking University.
This paper focuses on 283 prefecture cities in China from 2011 to 2018, with a total of 2264 observations. Table 1 shows the descriptive statistics of the main variables in this paper.
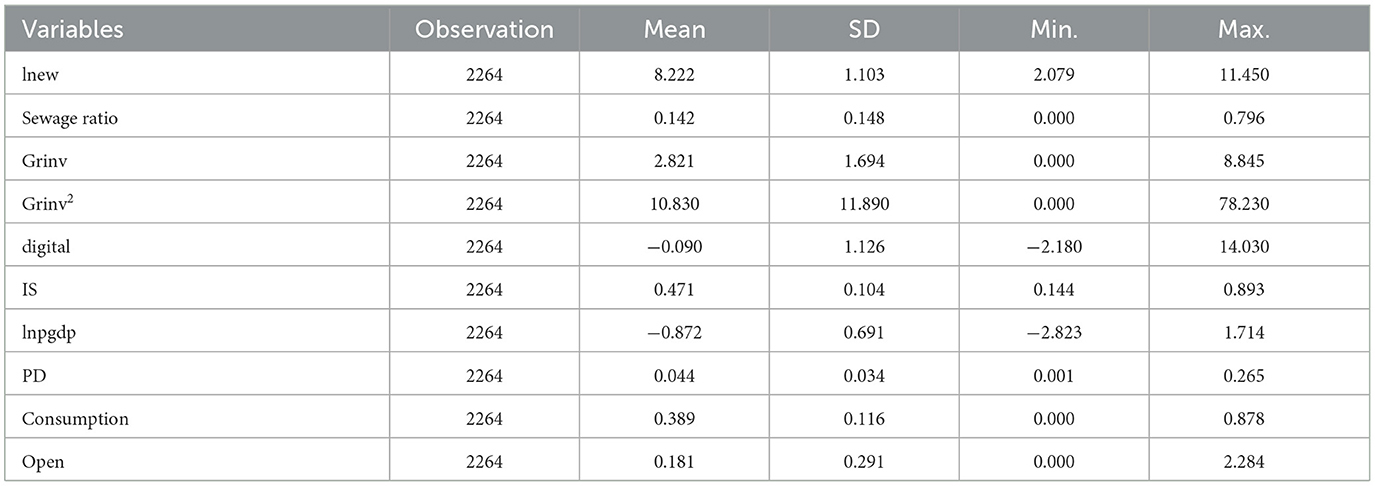
Table 1. Descriptive statistics.
Figure 1 demonstrates the geographical distribution characteristics of industrial wastewater emissions in 2011 and 2018. It shows a significant reduction in industrial wastewater emissions in 2018 compared to 2011. Meanwhile, regions with high industrial wastewater levels are mainly concentrated in the eastern coastal areas. In 2018, the cities with the highest industrial wastewater were Shanghai, Suzhou, and Zhangzhou. The Pearl River Delta urban agglomeration, Fujian Province, Shandong Province, and the Yangtze River Delta urban agglomeration are all heavily affected by industrial wastewater emissions. In the central region, Wuhan and Jiujiang have higher industrial wastewater emissions, while in the western region, Chongqing has higher industrial wastewater emissions.
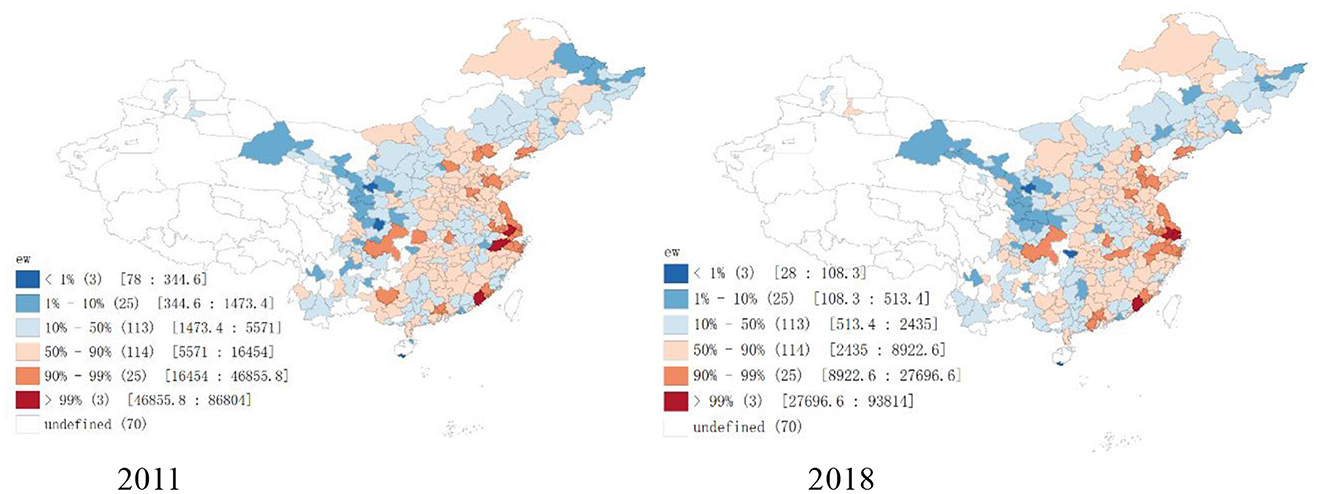
Figure 1. The geographical distribution of wastewater in 2011 and 2018.
Figure 2 illustrates the ratio of unprocessed sewage in the East, Central, and West regions from 2011 to 2018, reflecting changes in municipal wastewater treatment capacity in each region. It is evident that there has been a substantial increase in municipal wastewater treatment capacity nationawide. Notably, in 2011, the Central region's municipal wastewater treatment capacity was close to that of the Western region, but by 2018, it had nearly equaled the capacity of the Eastern region. For the Eastern region, the significant improvements in sewage treatment capacity is primarily due to the concentration of industrial wastewater discharges and the persistent gap between sewage collection capacity, treatment technology, and that of developed countries.
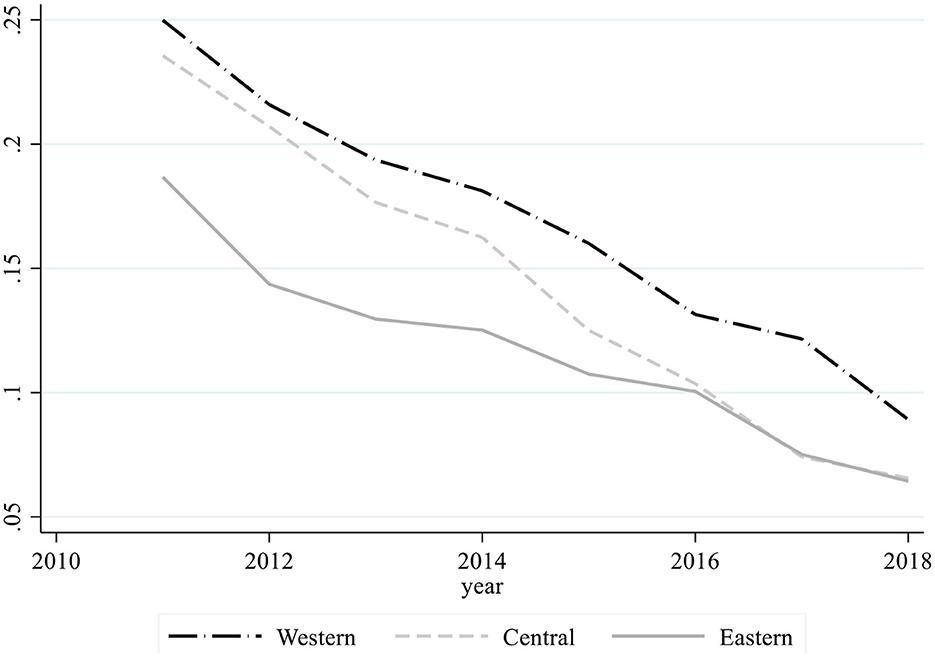
Figure 2. The ratio of unprocessed sewage in eastern, central and western region (2011–2018).
4 Empirical results
4.1 Baseline FE results
Table 2 shows the baseline results of the fixed-effects model (1). Columns 1 and 3 indicate that green innovation has a negative impact on both industrial wastewater emission and the wastewater untreated by the centralized sewage plants, but these estimators are not significant. Columns 2 and 4 show the estimation with the addition of the quadratic term of green innovation. It reveals a U-shaped relationship between green technology innovation and both wastewater emissions and the ratio of unprocessed sewage. More specifically, as green technology innovation progresses, industrial water pollution first decreases and then increases, and so does the ratio of unprocessed sewage.
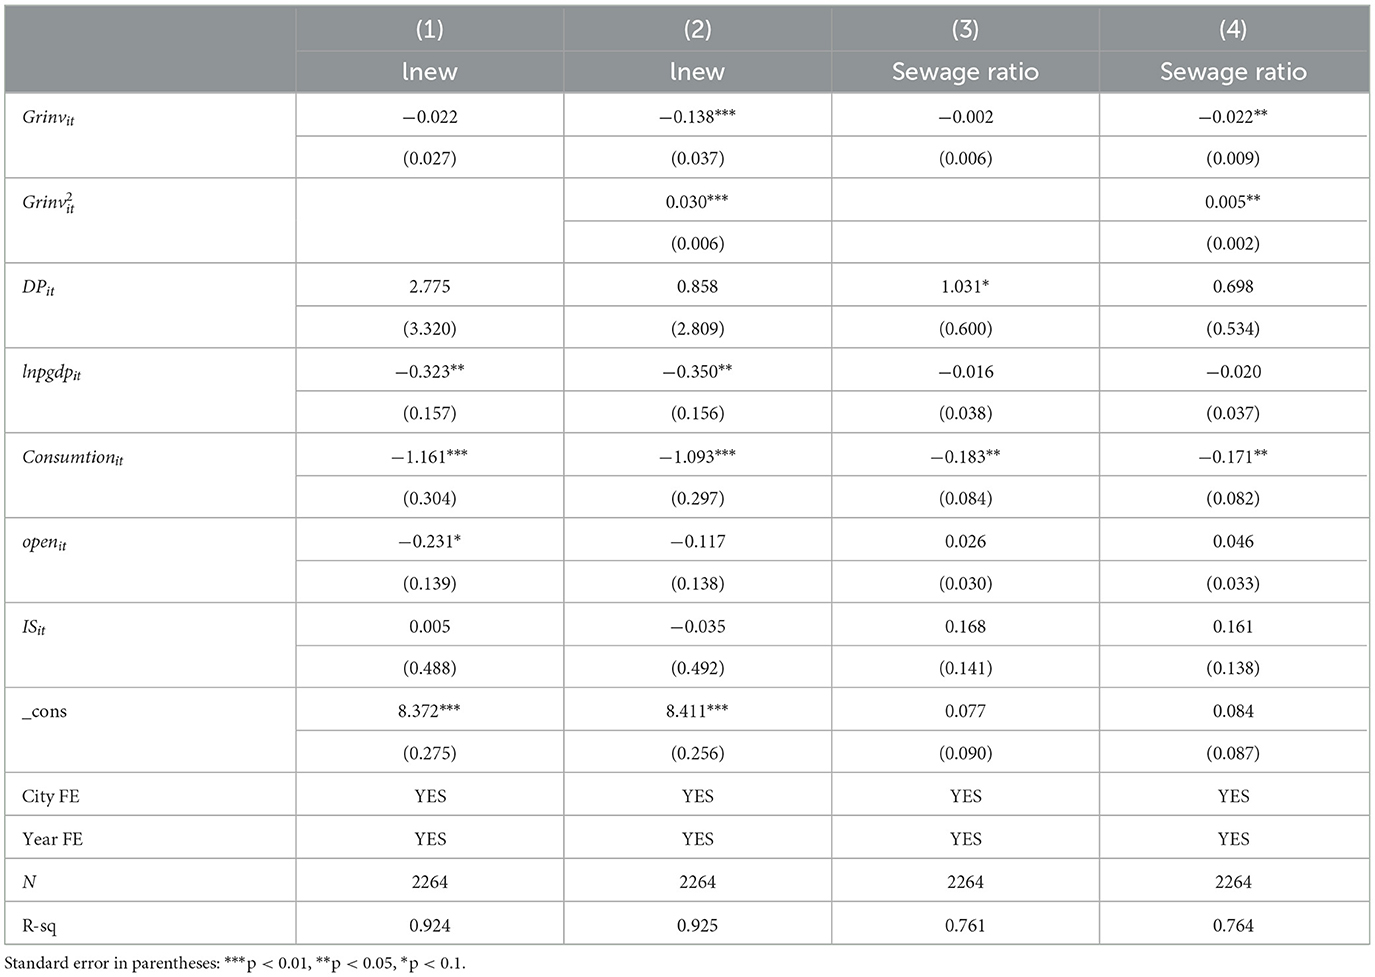
Table 2. Baseline results.
A possible reason for the observed trends is that wastewater primarily originates from industries such as papermaking, chemical production, coal mining, and food processing, while wastewater treatment relies on biochemical technology. When purifying industrial wastewater, physical and chemical treatments of higher difficulty commence after biochemical treatment. It means that, when a city promotes biochemical green technology due to environmental regulations, it can quickly reduce industrial wastewater emissions through biochemical green technology and also relocate enterprises that fail to meet environmental requirements to other areas with less stringent requirements. As a result, wastewater reduces quickly. Combined with Figure 1 above, cities most affected by industrial wastewater are mainly concentrated in the economically better-developed eastern coastal areas. Compared with the central and western regions, the level of green technology innovation in the east is higher, which is also the reason why wastewater treatment regulation has achieved instant results. However, when considering cost, it is still difficult to biodegrade polluted wastewater that cannot be treated by green technology, especially when the wastewater containing toxic substances cannot be treated by biochemical green technology. At this time, this reduction effect decreases. After the biochemical treatment facilities reach their limit, the mismatch between the technology improvement and the accumulation of hard-to-biodegrade pollution has led to a decreasing trend in the emission reduction effect of green technology on industrial wastewater.
Regarding control variables, scientific and technological expenditure and domestic consumption levels have a significant impact on industrial wastewater emissions. The higher scientific and technological expenditure is associated with lower wastewater emissions. On the contrary, the higher scientific and technological expenditure raises the sewage unprocessed rates. Besides, a higher domestic consumption level is associated with lower wastewater emissions and sewage unprocessed rates.
4.2 Spatial autocorrelation analysis
The above FE models illustrate the relationship between green technology innovation and wastewater emissions or the ratio of unprocessed sewage. However, can this effect spatially spill over to neighboring companies? To answer this question, we employ Moran's Index (Moran, 1950) to identify the spatial association. The Global Moran's I is used to reflect the degree of correlation differences between the attribute values of spatially adjacent or neighboring regions at the global level.
Table 3 displays the global Moran's I index of wastewater emissions and the ratio of unprocessed sewage using both spatial proximity and spatial distance matrices. It shows that Moran's I index is always significantly positive regardless of different spatial weight matrices. Besides the overall agglomeration characteristics, Moran's I index of water pollution indicates different trends. More specifically, compared to 2011, Moran's I index of industrial wastewater volume in the spatial adjacency matrix has a downward trend, but it still remains above 0.3 in 2018. It indicates that the spatial agglomeration characteristics of industrial wastewater discharge volume are relatively obvious. Moran's I index of the untreated sewage rate, on the other hand, has an upward trend, reflecting that the centralized untreated rate of sewage is relatively similar among neighboring cities. From the results of the spatial distance matrix, Moran's index is much smaller than the results of the spatial adjacency matrix, reflecting that the spatial agglomeration characteristics of industrial wastewater discharge volume and the untreated rate of urban sewage are more obvious among neighboring cities. In addition, Moran's I index in Table 4 also indicates that green innovation patents have significant spatial agglomeration characteristics, and the spatial agglomeration of green innovation is also on an upward trend.
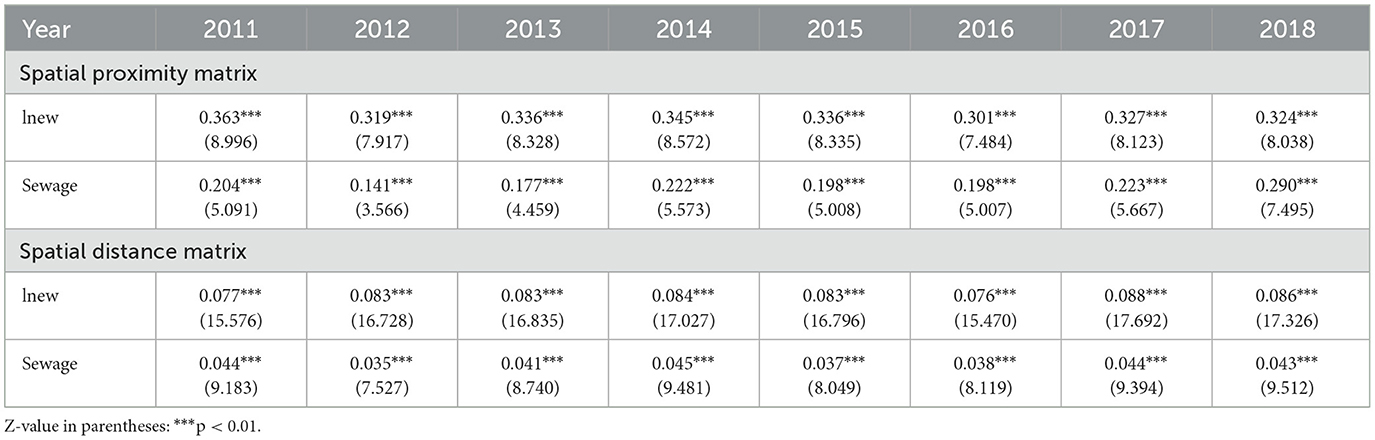
Table 3. Moran's I index of industrial wastewater and the ratio of unprocessed sewage: 2011–2018.
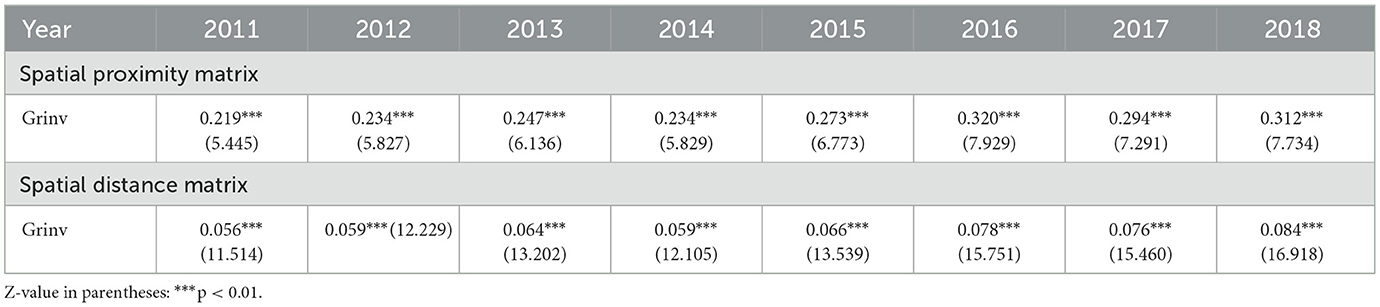
Table 4. Moran's I index of green technology innovation: 2011–2018.
4.3 General spatial autoregressive model
To test the validity of the spatial model, this paper first conducts Wald and LR tests. This result shows that the hypothesis that the spatial Durbin model can be degraded to the spatial lag model and spatial error model is rejected at a 1% significance level. It means that the spatial Durbin model with spatiotemporal double fixed effects is superior to other models. Since the spatial Durbin model assumes that the dependent variable of one region is affected by the independent variable of other regions, that is, considering the spatial lag of independent variables in the model, it is consistent with the research question of testing the impact of local green innovation on pollutant emissions in surrounding areas in this paper. Therefore, all tests in this paper use the spatial Durbin model. Table 5 shows the results of the spatial Durbin model analysis of both the spatial proximity matrix and spatial distance matrix of each city. It shows that in both the analysis of the spatial proximity and distance matrix, we can see results that are consistent with the baseline FE model in terms of direct effects.
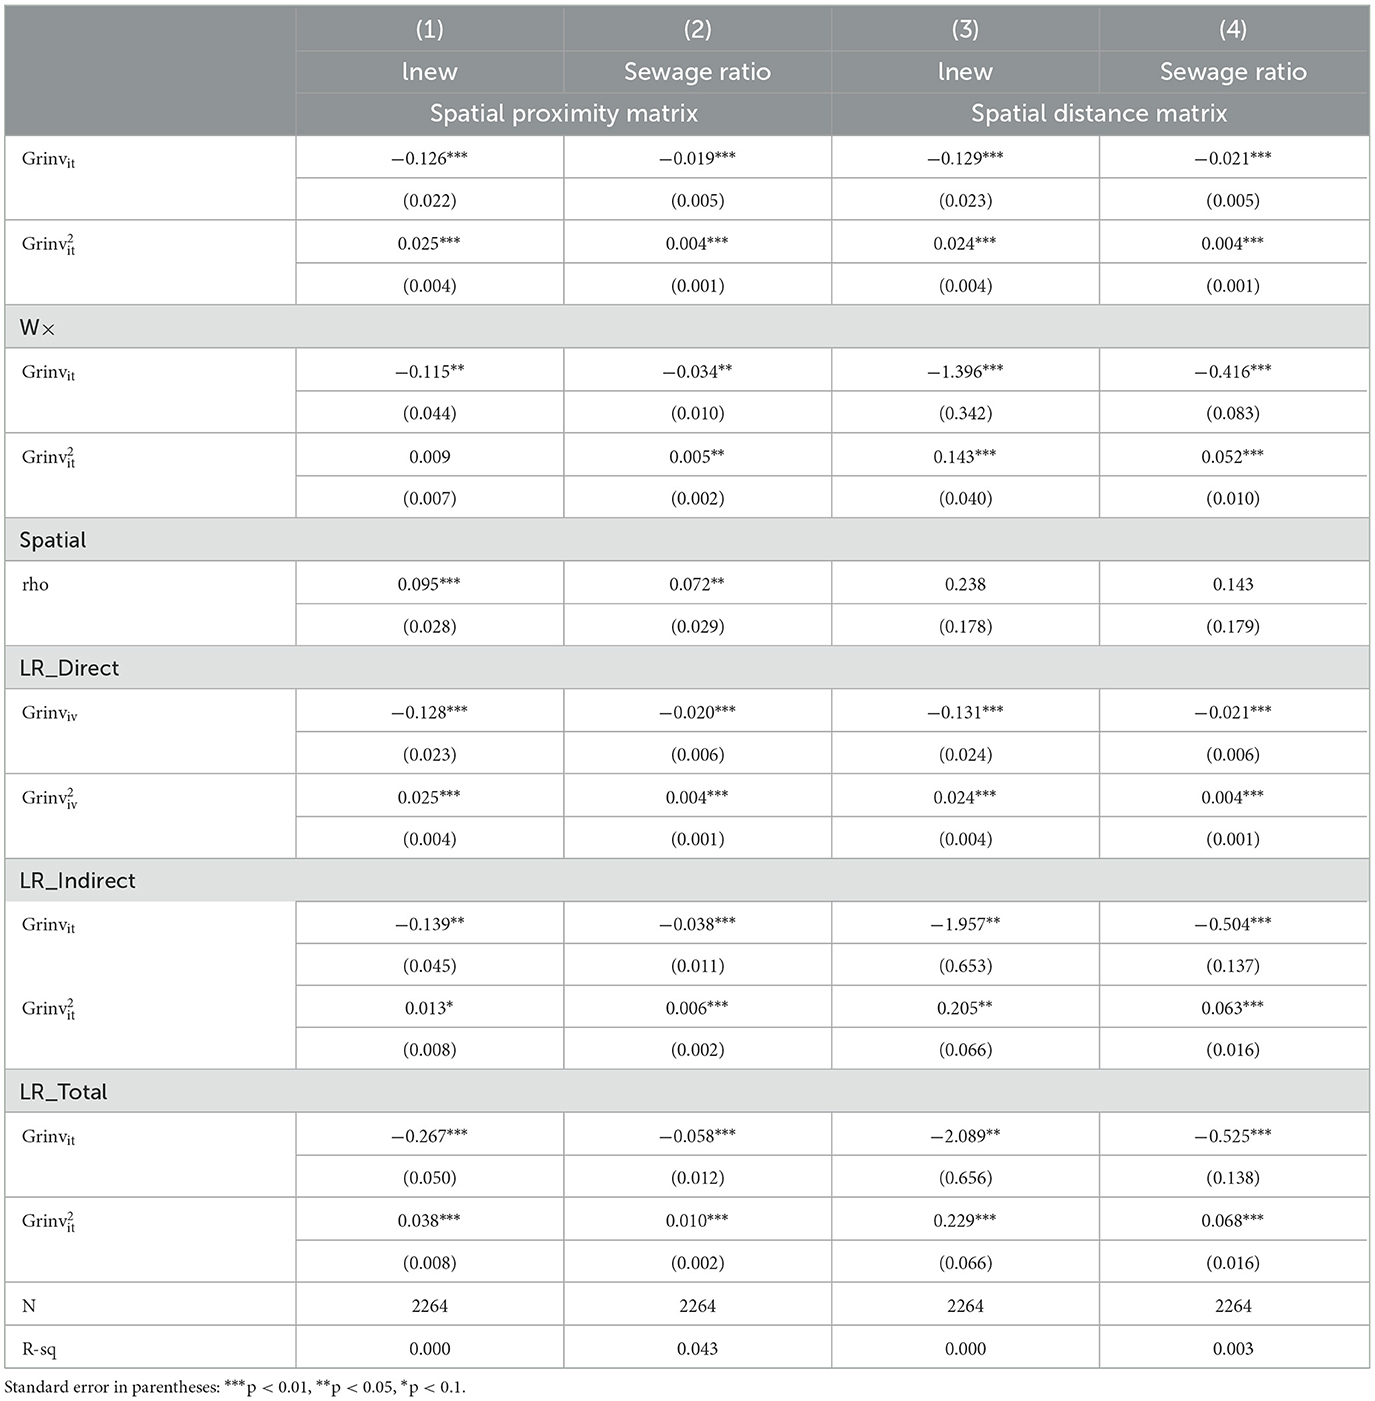
Table 5. Pollution reduction and spatial spillover.
When industrial wastewater is the dependent variable, in the spatial proximity matrix analysis, both the linear and quadratic terms of local green technology innovation are significantly negative in terms of indirect effects. In the spatial distance matrix analysis, both the linear and quadratic terms of green innovation are significant, similar to direct effects, both showing a U-shaped curve. When the ratio of unprocessed sewage is the dependent variable, both indirect and direct effects show a U-shaped relationship between green technology innovation and the centralized untreated rate of sewage using both the spatial distance matrix and spatial proximity matrix. Comparing the results of spatial rho in the spatial proximity and spatial distance matrix, the spatial rho of the spatial distance matrix is not significant, reflecting that compared to city distance, the spatial spillover effect of industrial wastewater discharge volume and centralized untreated rate of sewage between adjacent cities is stronger. In both spatial matrices, local green technology innovation has an effective spillover effect on reducing industrial wastewater in neighboring areas, indicating that this conclusion is robust. This reflects that local industrial wastewater discharge volume and untreated sewage rate are influenced by the level of green innovation development in neighboring cities.
4.4 Robust checks
Considering that the improvement of green technology innovation may have a long-term impact on pollutant reduction, we further conduct the following tests using the lagged one and two terms of all explanatory variables. The results in Tables 6, 7 show that in the direct effects of local lagged one and two green innovation levels on local industrial wastewater emissions and the ratio of unprocessed sewage, the relationship between green technology innovation level and industrial wastewater emissions and the ratio of unprocessed sewage is U-shaped. This result is rather robust.
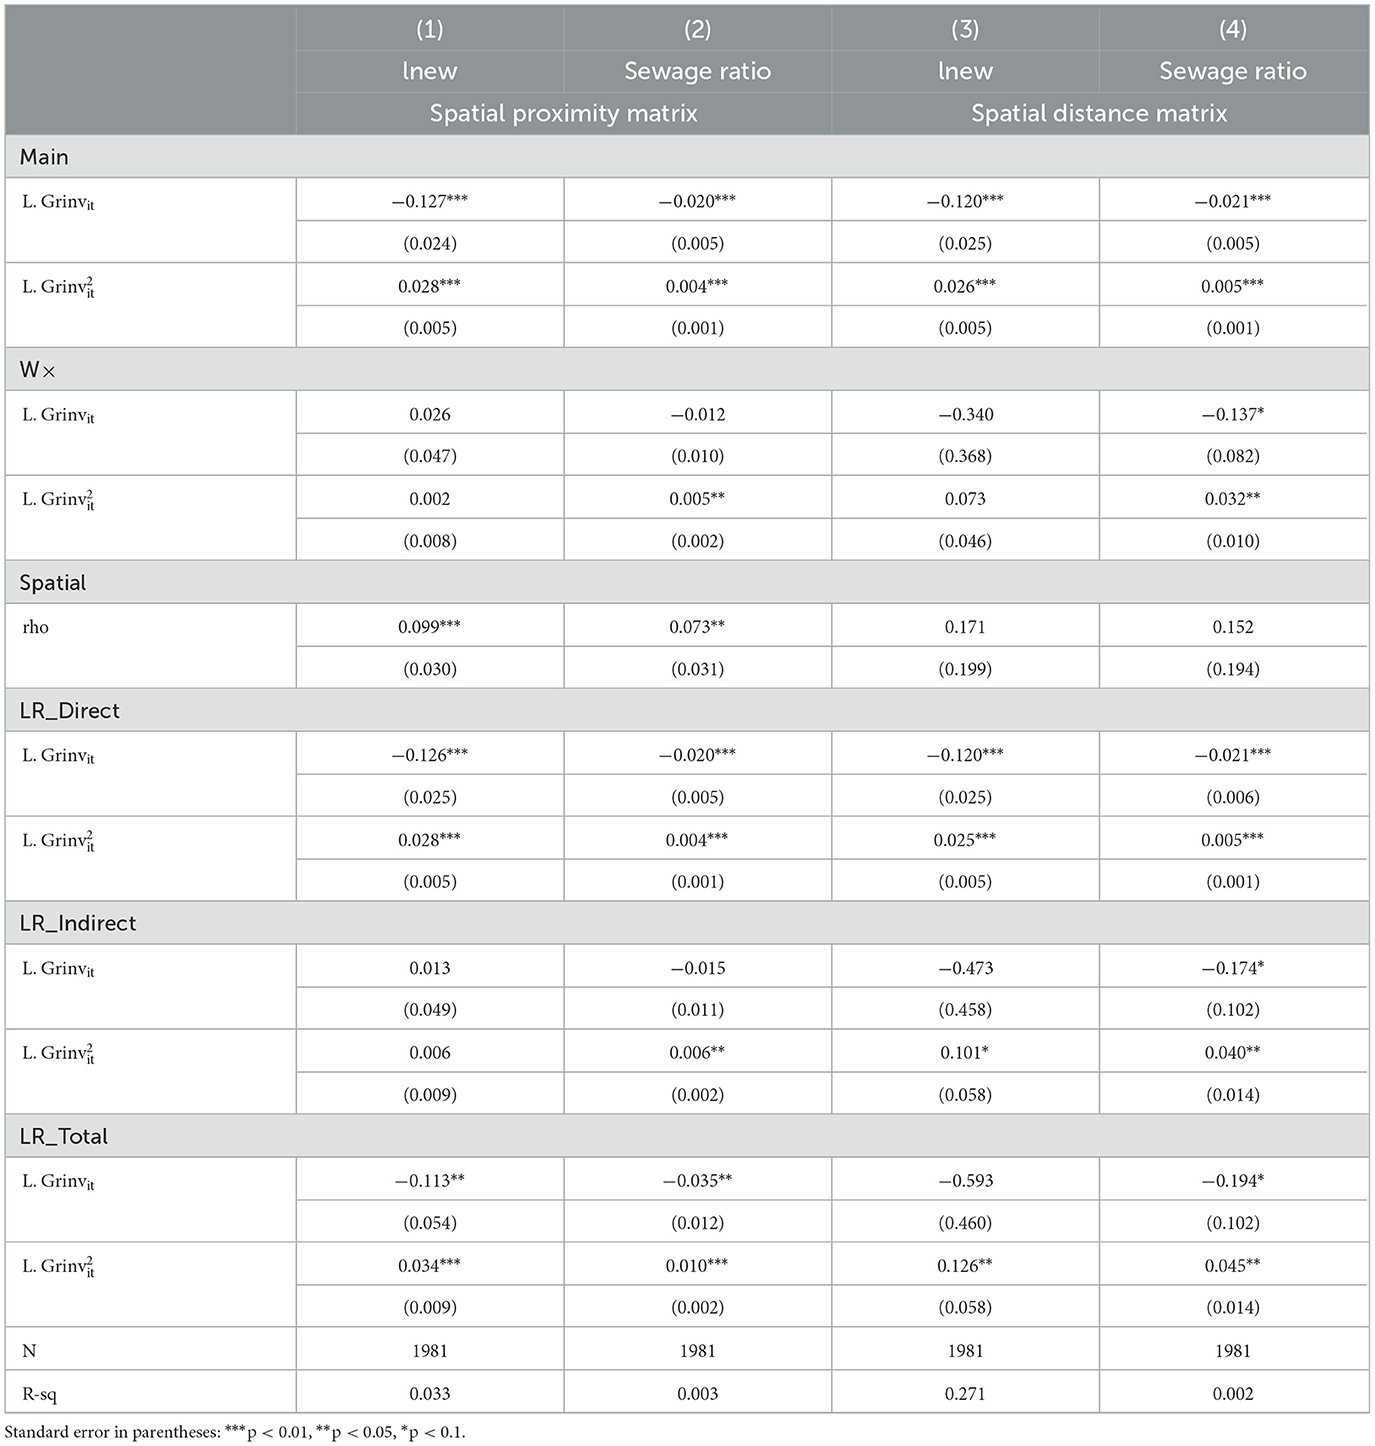
Table 6. Robust Check—Using the independent variable lagged one term.

Table 7. Robust Check—Using the independent variable lagged two terms.
From the perspective of indirect effects, the quadratic terms of green innovation lagged by one and two periods in both the spatial proximity and spatial distance matrixes are significantly positive for the ratio of unprocessed sewage, which is similar to the analysis results in Table 5. This shows that after a certain time and reaching a certain level, the level of green innovation in neighboring cities has a negative impact on the ratio of unprocessed sewage. This also indicates that once municipal sewage collection capabilities and supporting facilities are improved, they are not easily affected by time changes.
However, the local green innovation level lagged by one or two periods is not significant with the industrial wastewater in neighboring areas. This reflects that the longer the time, the beneficial spillover of green technology innovation in neighboring areas to industrial wastewater reduction is not significant. A possible explanation is that, with the influence of time or policy changes, local areas become more willing to carry out green innovation to reduce pollutant emissions, while the beneficial spillover effect of green innovation in neighboring areas on industrial wastewater reduction in the early stage is weakened.
5 Further analysis
5.1 The effect of digital economic development
The previous results demonstrate a U-shaped relationship between technology innovation and water pollution, in terms of both industrial wastewater and the ratio of unprocessed sewage. Moreover, this effect has a spatial spillover effect on neighboring areas under certain conditions. Next, we analyze whether this relationship is related to the level of digital economic development in cities.
The larger value of the digital economic development proxy variable indicates a higher level of development. In Model (3), the interaction term is the main research focus. After adding the digital economic development level index, in the analysis of the spatial proximity and distance matrix, the U-shaped relationship between green innovation level and sulfur dioxide emissions remains significant.
Based on the calculation of the full sample mean of digitalit, the overall effect of green innovation level on water pollution should be the sum of the first-order green innovation level and the coefficient of multiplied by the mean value of digitalit (see Table 1). For green innovation's effect on industrial wastewater, spatial proximity matrix analysis, as shown in column (1) of Table 8, after adding, the green innovation level's estimator changes from −0.126 to −0.081 and the U-shaped bottom point was postponed from 2.520 to 2.696. Meanwhile, in the spatial distance matrix analysis column (3) of Table 8, the green innovation changes from −0.129 to −0.080, while the U-shaped bottom point increases from 2.688 to 3.076. The postponed inflection point means that digital economic development enhances green innovation's negative regulatory effect on industrial wastewater. This shows that when a city's digital economic development improves along with urbanization, it makes resource-intensive industries, such as papermaking and oil processing, relocate to other cities with lower levels of digital economic development. In addition, digital technology development brought about by improved digital economic development can in turn empower traditional industries to optimize resource allocation. This would limit large-scale emissions that need to be physically treated and increase biochemical green technology's contribution to reducing industrial wastewater. However, regarding the ratio of unprocessed sewage, i.e., the city's capability of collecting and treating sewage, the development of digital economics does not impose a significant impact.
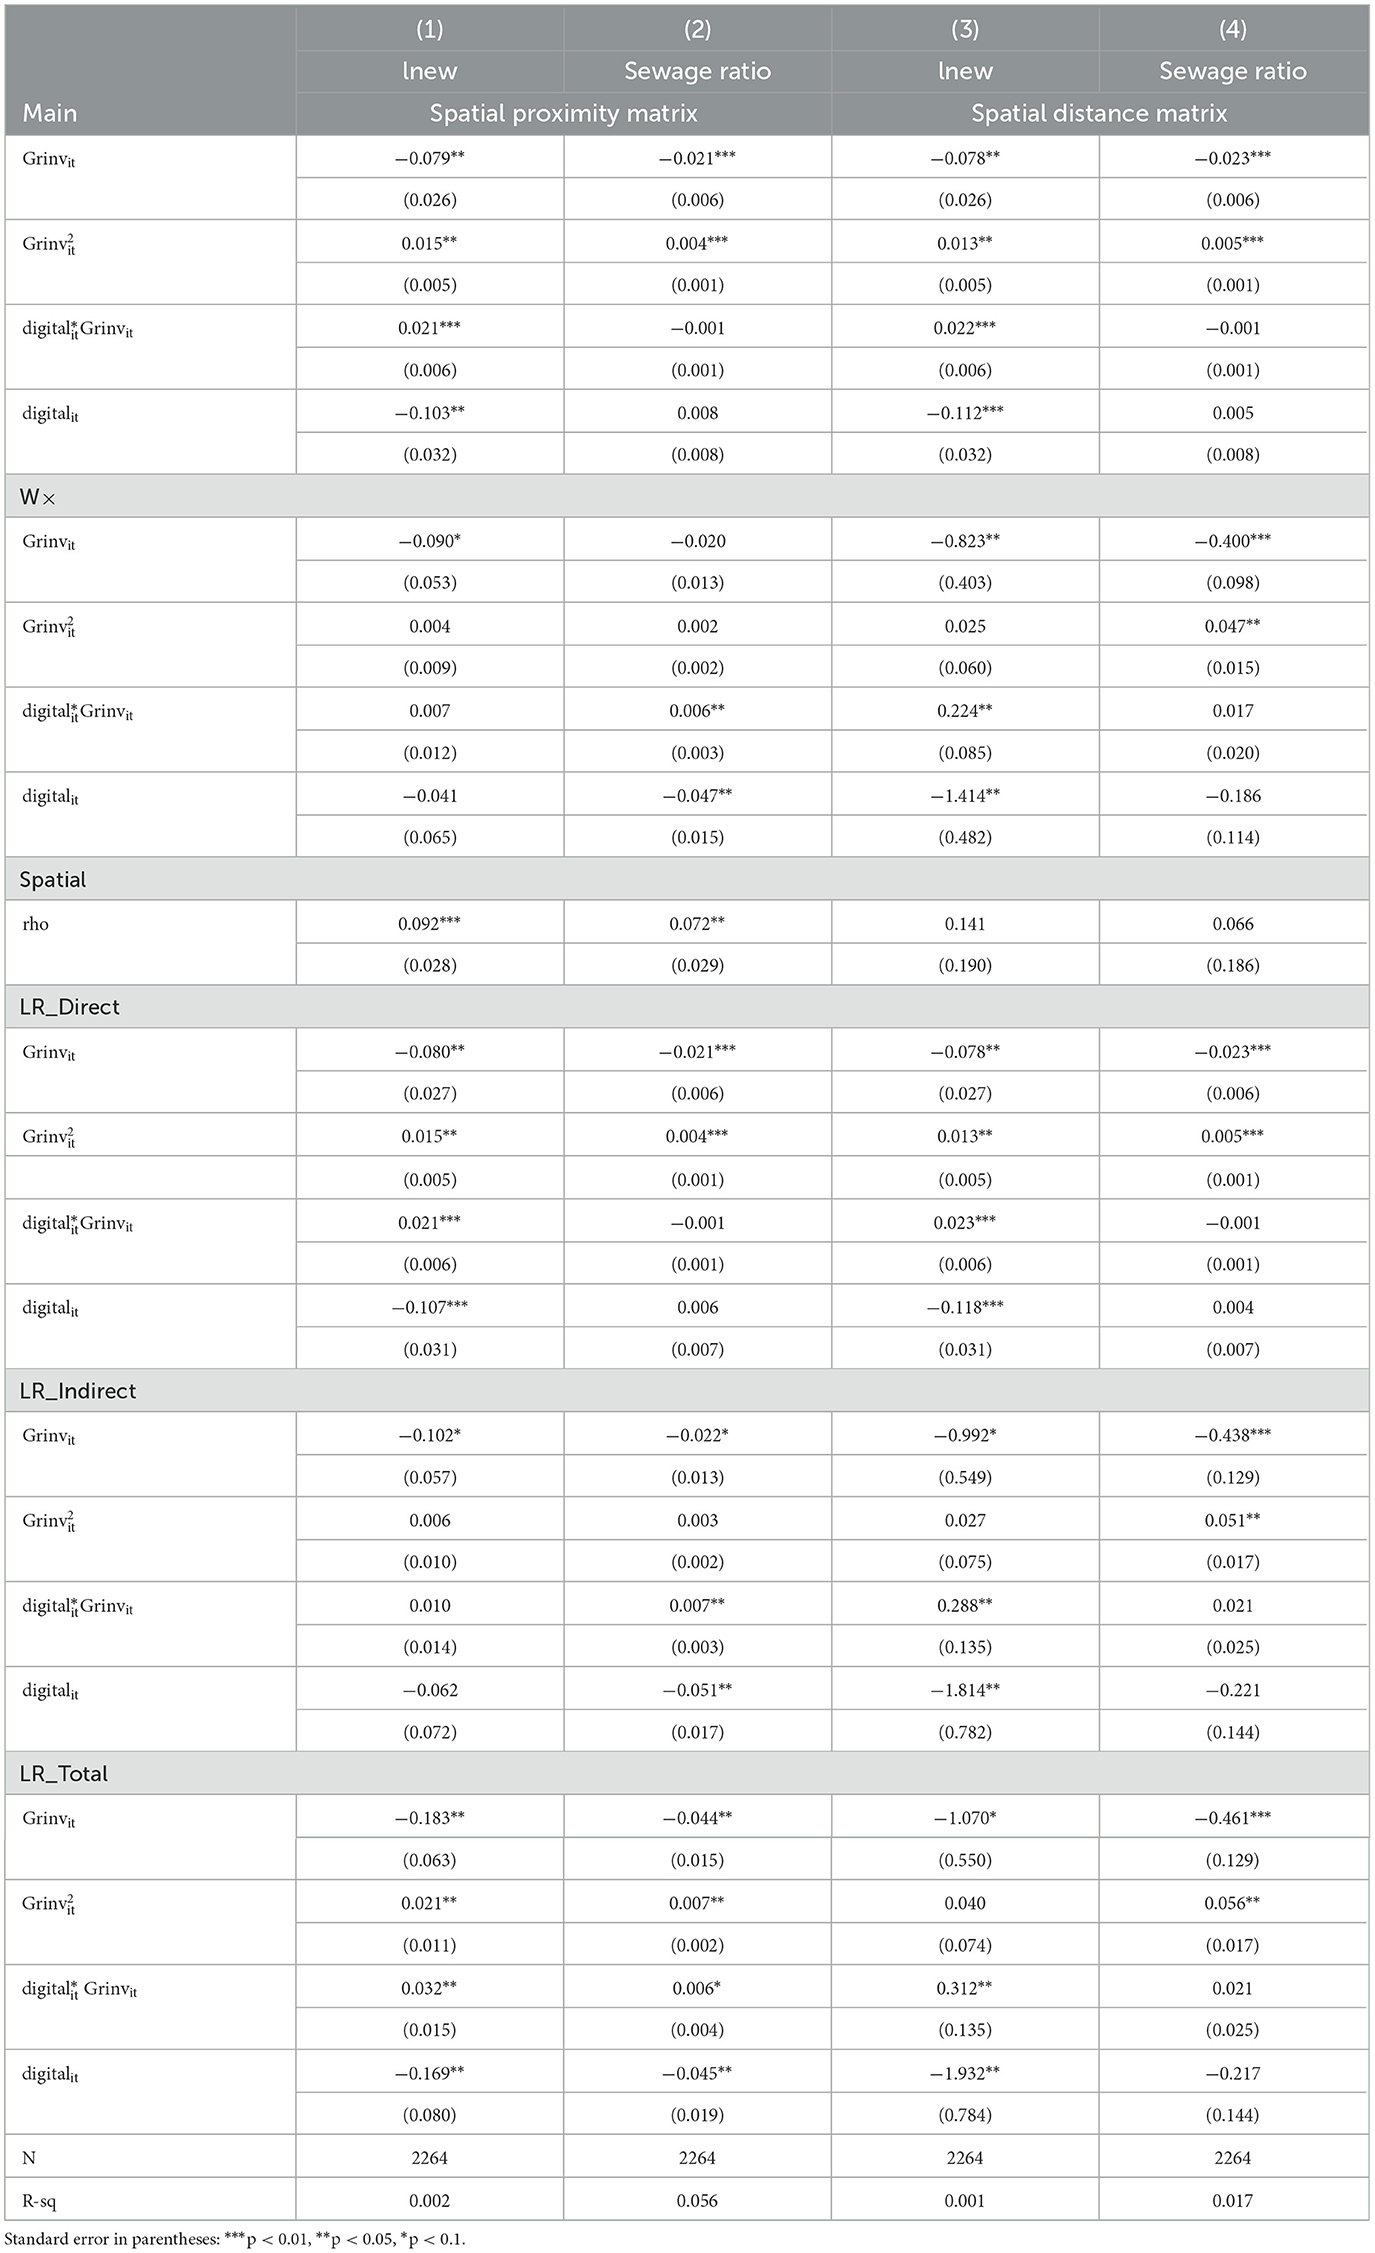
Table 8. Mechanisms—digital economy.
Next, whether the digital economic development has a spatial spillover effect on green technology innovation's impact on pollutant reduction is analyzed. Grinvit, , digitalit and the interaction are significant when industrial wastewater is used as a dependent variable in spatial distance matrix analysis. It shows that in spatial distance matrix analysis for industrial wastewater, the city's digital economic development has a beneficial spatial spillover effect on green innovation's impact. However, since industrial wastewater is mainly concentrated along coastal areas, this benign effect is more significant using a spatial distance matrix.
5.2 Geographical heterogeneity
The impact of green technology innovation on water pollution may have spatial heterogeneity. This paper uses spatial proximity weights and divides the analysis into eastern, central and western regions to analyze the impact of geographical heterogeneity. Table 9 shows the regression results for the eastern region. First, there is a U-shaped relationship between green technology innovation and industrial wastewater emissions. After adding the digitalit (the mean value of digitalit in the eastern region is 0.451), the interaction remains statistically significant. The total effect of green technology innovation on industrial wastewater emissions changed from −0.237 to −0.175, and the bottom point of U-shaped innovation changed from 4.740 to 5.462. The postponed U-shaped inflection point indicates that the digital economy helps mitigate the negative effect of green technology innovation on industrial wastewater emissions after reaching a certain technological level. Furthermore, as the industrial wastewater is concentrated in the Eastern areas, it requires a higher technology level to achieve the national average processing rate.
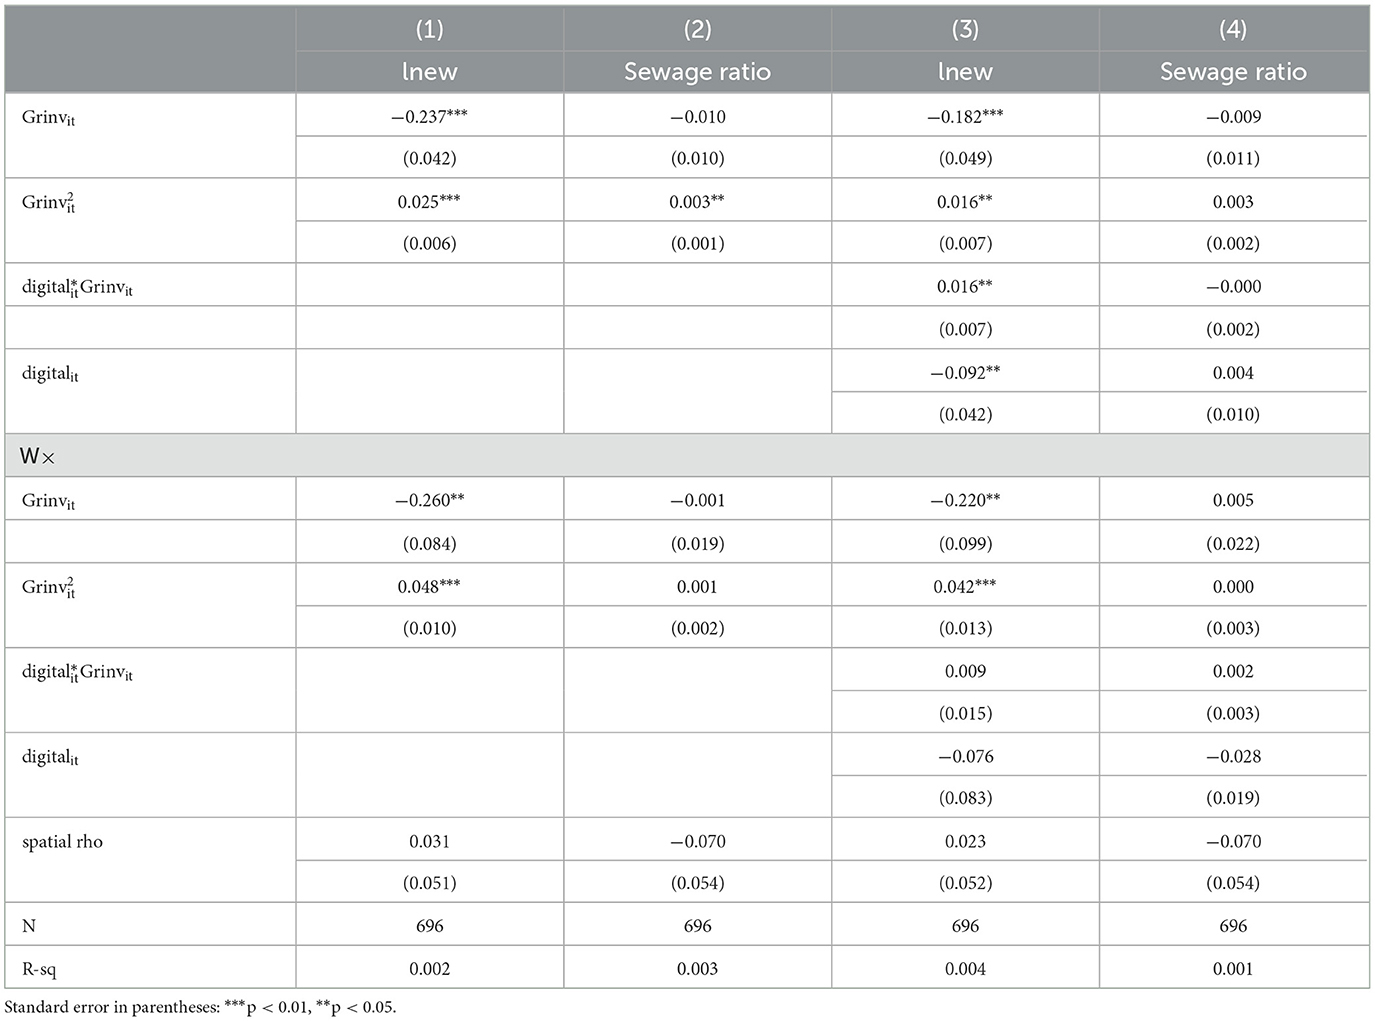
Table 9. Heterogeneity analysis—eastern.
Regarding indirect effects, in eastern cities, for industrial wastewater, both direct and indirect effects are similar and show a U-shaped relationship reflecting that green technology innovation's effect on first inhibiting and then increasing industrial wastewater emissions has a spatial spillover effect. This is because industrial wastewater is mainly concentrated in the eastern coastal areas, where the direct effect of green innovation level on local industrial wastewater and the indirect effect of neighboring cities on local industrial wastewater are more pronounced. However, in the eastern group, the digital economy does not have a significant spatial spillover effect on the emission reduction of green innovation, which may be due to the higher level of economic development and more matured digital economy in the eastern coastal cities. In addition, the impact of the level of green innovation is not significant on the ratio of unprocessed sewage.
For the central region, the direct effects of green technology innovation on industrial wastewater still show a significant U-shaped relationship [Table 10, column (1)]. Compared to the U-shaped turning point of 4.740 in the eastern region, while that in the central region is 1.538, reflecting that the level of green technology innovation in the central region is significantly lower than that in the eastern region. The green technology innovation has a significant promoting effect on the centralized treatment rate of sewage [Table 10, column (2)]. From the perspective of indirect effects, there is no significant spatial spillover effect in the U-shaped relationship between the level of green technology innovation and industrial wastewater discharge and the centralized treatment rate of sewage treatment plants.
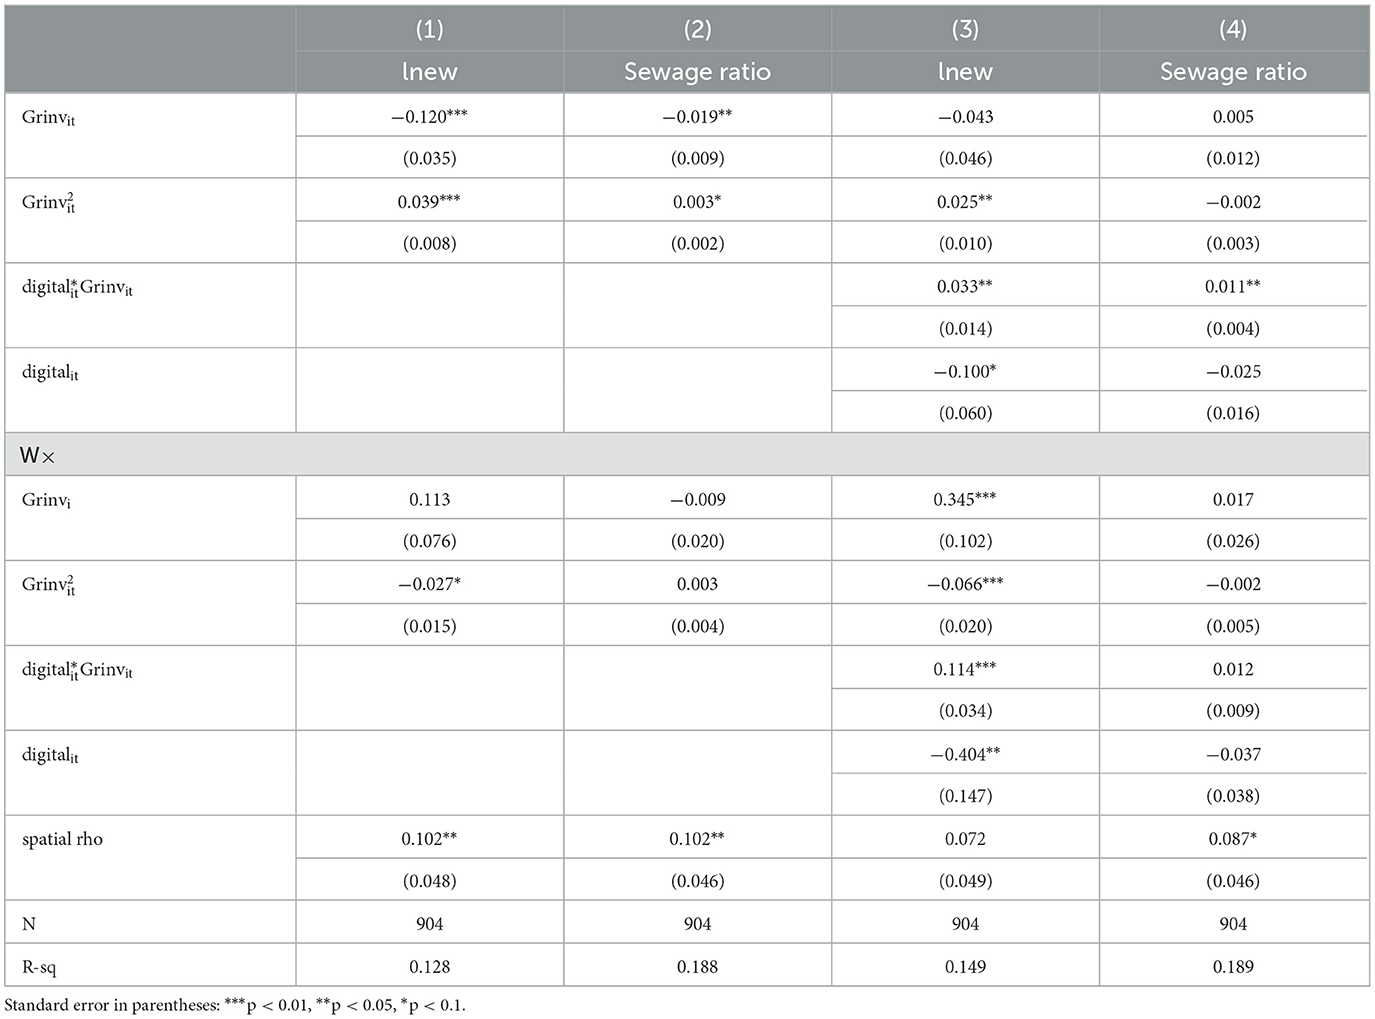
Table 10. Heterogeneity analysis–central.
Regarding the role of digital economic development on green technology innovation's pollutant reduction effect, the interaction is only significant in the analysis of industrial wastewater emissions [Table 10, column (3)]. After adding variable digitalit(mean value is −0.388), green innovation's effect on industrial wastewater emissions' U-shaped bottom points changed from 1.538 to 1.132. This may be because industries with higher industrial wastewater migrate from the eastern to the central region. Accompanied by the development of the digital economy, infrastructure construction in the central region is also expanding, leading to a rapid increase in industrial wastewater. Given the lower level of green innovation in the central region, this accelerates the arrival of the U-shaped turning point. In the analysis of the central region, the indirect effect becomes an inverted U-shaped relationship. This indicates that cities with a better-developed digital economy in the central region are more likely to transfer industrial wastewater pollution to neighboring cities, leading to a significant increase in surrounding wastewater emissions. For the centralized treatment rate of sewage, both the linear and quadratic terms of green innovation level in the analysis of the digital economy, are not significant in direct and indirect effects [Table 10, column (4)], making it difficult to confirm the impact of the digital economy on the centralized treatment rate of sewage treatment plants in the central region.
As shown in column (1) of Table 11, we cannot find a U-shaped direct effect between green innovation and industrial wastewater. However, the U-shaped relationship between green innovation and the ratio of unprocessed sewage is more pronounced than in the eastern and central regions [Table 11, columns (2, 4)]. On the other hand, from the perspective of indirect effects, the western region, similar to the eastern region, exhibits a U-shaped curve when compared to the central region. In contrast to the eastern region, the spatial spillover effects of green technology innovation on industrial wastewater and wastewater treatment are weaker in the western region. A possible explanation could be the lower level of green technology innovation in the western region compared to the eastern. Simultaneously, constrained by the economic development level in the western region and the distance from eastern cities, fewer high-polluting industries relocate from the east to the west than to the central region. This leads to a smaller increase in wastewater levels in western cities compared to those in the central region. Another possible reason for the region heterogeneity may lie in the water distribution characteristics. Caused by the long distance from the ocean and the fewer rivers, the western region experiences a much drier climate than the central and eastern regions. Therefore, water pollution in the western part may not spread as easily as air pollutants, resulting in a weaker spillover effect of the industrial wastewater.
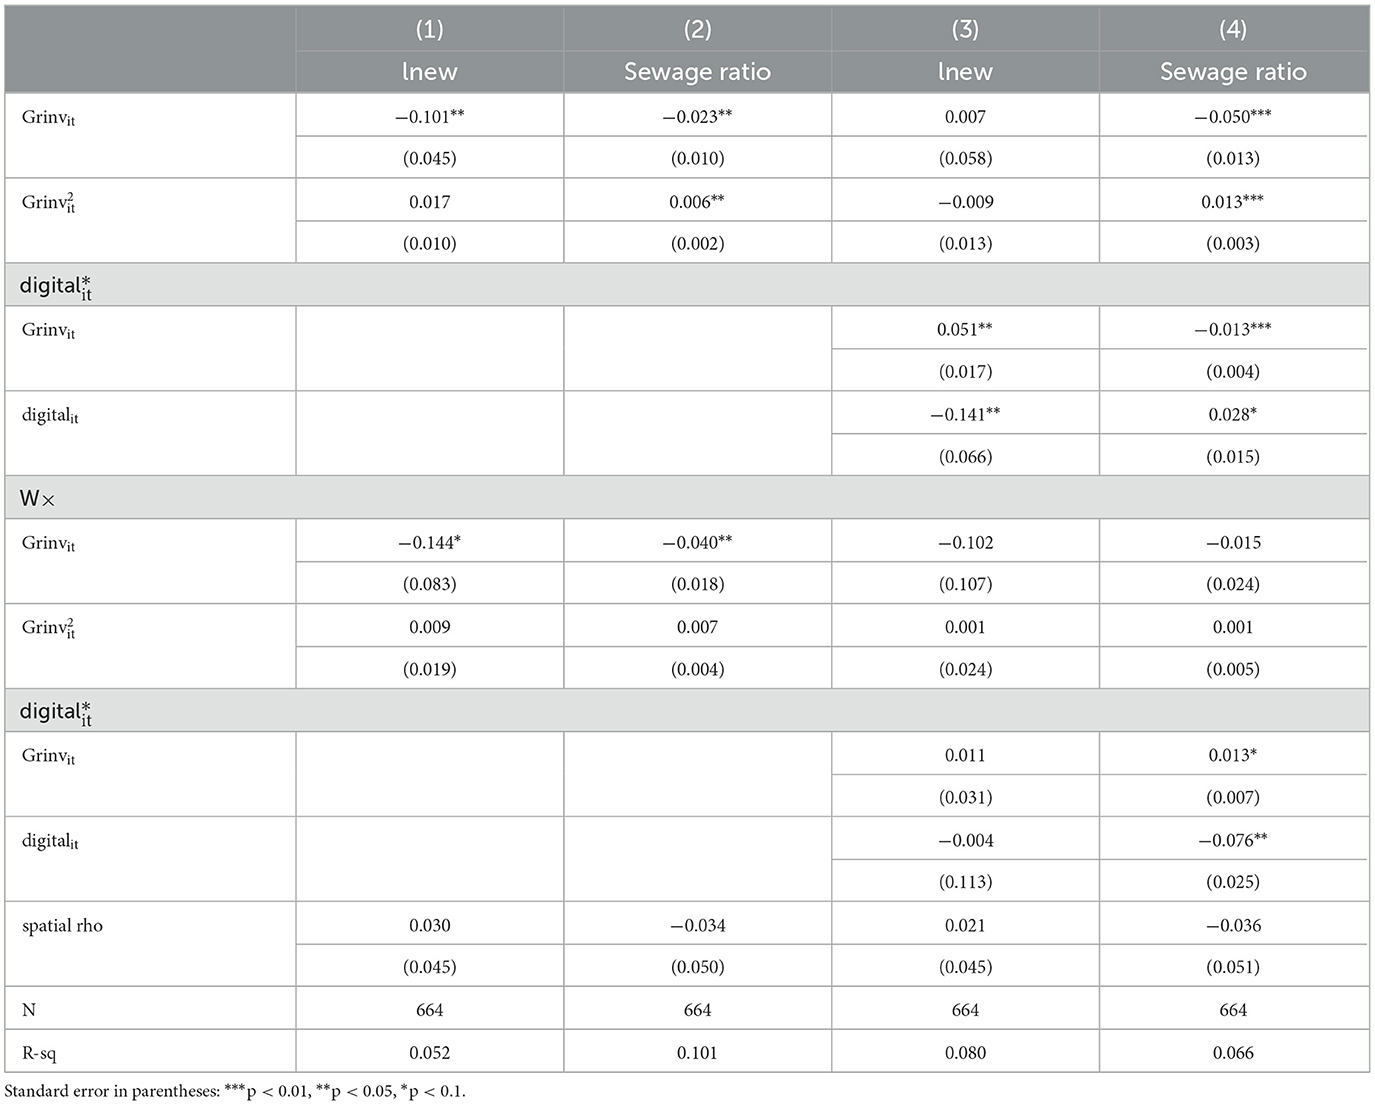
Table 11. Heterogeneity analysis—western.
Regarding the impact of the digital economy on water pollution, column 3 in Table 11 indicates the interaction term produces a significant result while the linear and quadratic terms of green innovation show an insignificant inverted U-shaped relationship. It means that due to the lower level of the digital economy in western regions compared to eastern and central regions, during the rapid development process of the digital economy in western regions, infrastructure increase will increase industrial wastewater. Meanwhile, due to lower levels of green innovation in Western regions compared to Eastern regions, existing green technologies in Western regions are insufficient to support industrial wastewater reduction. For the impact of the digital economy on the relationship between green innovation level and municipal sewage processing capabilities, green technology innovation hastened the U-shaped inflection point (from 1.92 to 1.80). This reflects that in the western region, the adverse effects of increased wastewater resulting from the development of the digital economy may outweigh the positive spillover effects. Therefore, in the western region, there is still a need to expedite the integration of digital technology into green technology innovation and improve municipal sewage collection capabilities and supporting facilities.
6 Conclusion
Since the reform and opening up, the traditional economic development model of high energy consumption, high pollution, and high emissions has led to excessive consumption of resources and intensified environmental pollution in China. Technological progress has always been regarded as an important means to alleviate environmental pollution, especially the technological progress in clean energy, pre-treatment or/and final treatment of sewage, which is commonly adapted to achieving the goal of reducing environmental pollution. Among them, for wastewater treatment, technological progress has a certain promoting effect on wastewater and municipal wastewater collection and treatment capabilities. However, green technology innovation is more difficult to get and may cost more research funding than traditional innovation. Based on the ECK theory, this paper aims to explore the non-linear relationship between green technology innovation and water pollution reduction. Employing the city-level data from 2011 to 2018 in China and the spatial Durbin model with time and space fixed effects, we first estimate the impact of the level of green innovation development on industrial wastewater and municipal wastewater treatment capabilities and their spatial spillover effects. Then, we analyze whether the development of the digital economy can have a positive effect on the relationship between green technology progress and environmental pollutant emissions and municipal wastewater treatment capabilities. Finally, it analyzes whether there is spatial heterogeneity in the effect of improving the level of green technology innovation on pollutant emissions and municipal wastewater treatment.
The contribution of this paper lies in focusing on a pollutant with regional characteristics–industrial wastewater. Although the effect of green technology innovation on air pollutants and carbon emissions is widely confirmed by recent research, few studies have addressed water pollution and wastewater management, particularly in China. Unlike air pollution, which is clustered in all major regions, industrial wastewater is highly concentrated in China's coastal areas. However, there is a trend of shifting from the east to the central and western parts of the country as the economy develops. In this paper, we concentrate on the discharge and treatment of sewage, examining the impact of the overall level of green innovation in cities on sewage and the resulting spatial spillover effects. The main conclusions are as follows: First, the effect of green technology innovation on industrial wastewater discharge volume shows a decrease first and then an increase. This effect is most pronounced in the eastern region, which is closely related to the concentration of industrial wastewater discharge in developed coastal areas in the east. This effect not only affects local cities but also has a spatial spillover effect on neighboring cities. Second, for central regions, with the development of the digital economy bringing large-scale infrastructure construction, accelerated industrialization process, deepened urbanization degree, and some industries that produce a large amount of wastewater pollution transferred from eastern regions to central regions, the development of the digital economy may bring negative regulation to the emission reduction effect of green technology progress. Thirdly, in eastern regions where the digital economy is highly developed, the development of the digital economy has a positive effect on the relationship between green technology progress and industrial wastewater discharge. Finally, in the western region, where the digital economy and the level of green technology innovation are most underdeveloped, it is crucial to further strengthen the influence of green innovations on urban wastewater treatment capacity and supporting facilities. Despite the fact that the increase in water pollution has not been as pronounced as in the central region, the relatively low levels of digital and green technology innovation necessitate ongoing efforts to enhance their impact on wastewater treatment infrastructure.
From the conclusions of this paper, we can get the following policy tips: First, in economically developed coastal areas, more digital technologies could be organically combined with existing green technologies and applied to more scenarios. For instance, digital technologies may be employed more to expand markets, narrow technological gaps with non-green technology innovation, reduce costs for research and development and industrialization of green technologies and motivate enterprises in eastern cities to develop green technologies actively, thereby accelerating improvement in green technology innovation levels and achieving goals for reducing industrial wastewater emissions. Second, central and western cities should actively use green technology innovations to improve municipal wastewater collection and treatment capabilities. Thirdly, during accelerating economic construction in central and western regions, we should pay more attention to optimizing industrial structure, formulating relevant environmental regulations and improving efficiency in environmental governance. Especially when introducing industries from eastern regions, more effort should be paid to green technologies and attract more enterprises focusing on high-quality development to avoid increasing pollution and technological gaps, leading to worsening environmental pollution in central and western regions.
This study is constrained by the availability of data, and several areas could be further explored in future research. Firstly, the primary independent variable, the level of green technology innovation, is represented by the natural logarithm of the quantity of a city's green invention patents. However, the lack of a specific International Patent Classification (IPC) for each patent hinders the identification of the precise mechanism through which green technology innovation impacts water pollution reduction. Secondly, the SDGs and the Paris Agreement have been increasingly addressed in recent years, and numerous countries, including China, have implemented more stringent environmental protection regulations. These regulations and policies also contribute to the reduction of industrial pollution, in conjunction with green technology innovations. However, this study, which only encompasses city-level data from 2011 to 2018 in China, does not fully consider the intensive effect of policies implemented after 2018. Furthermore, while this study attempts to incorporate more regional distribution characteristics, it pays less attention to the natural endowment of water resources. Unlike atmospheric pollutants, which are dispersed by air circulation, wastewater spillover is dependent on rivers and lakes. Regrettably, data on geographical and climate characteristics are not available in this study. Although the heterogeneity analysis aims to address this issue to a certain extent, future research on the spatial distribution of water pollution should pay more attention to these factors.
Data availability statement
The data analyzed in this study is subject to the following licenses/restrictions: The dataset in this paper consists of several commercial data, and is available on request. Requests to access these datasets should be directed to cnVhbi55dWxpbmdAYzJjLmFjLmpw.
Author contributions
YR: Data curation, Investigation, Methodology, Software, Validation, Visualization, Writing – original draft. AZ: Formal analysis, Funding acquisition, Investigation, Project administration, Supervision, Writing – review & editing.
Funding
The author(s) declare that no financial support was received for the research, authorship, and/or publication of this article.
Conflict of interest
The authors declare that the research was conducted in the absence of any commercial or financial relationships that could be construed as a potential conflict of interest.
Publisher's note
All claims expressed in this article are solely those of the authors and do not necessarily represent those of their affiliated organizations, or those of the publisher, the editors and the reviewers. Any product that may be evaluated in this article, or claim that may be made by its manufacturer, is not guaranteed or endorsed by the publisher.
References
Acemoglu, D., Akcigit, U., Hanley, D., and Kerr, W. (2016). Transition to clean technology. J. Polit. Econ. 124, 52–104. doi: 10.1086/684511
Allard, A., Takman, J., Uddin, G. S., and Ahmed, A. (2018). The N-shaped environmental Kuznets curve: an empirical evaluation using a panel quantile regression approach. Environ. Sci. Pollut. Res. 25, 5848–5861. doi: 10.1007/s11356-017-0907-0
Angelidou, M. (2017). The role of smart city characteristics in the plans of fifteen cities. J. Urban Technol. 24, 3–28. doi: 10.1080/10630732.2017.1348880
Brookes, L. G. (1978). The energy price fallacy and the role of nuclear energy in the UK. Energ. Policy 16, 94–196. doi: 10.1016/0301-4215(78)90031-9
Brookes, L. G. (1990). The greenhouse effect: the fallacies in the energy efficiency solution. Energ. Policy 18, 199–201. doi: 10.1016/0301-4215(90)90145-T
Chang, K., Liu, L., Luo, D., and Xing, K. (2023). The impact of green technology innovation on carbon dioxide emissions: The role of local environmental regulations. J. Environ. Manage. 340:117990. doi: 10.1016/j.jenvman.2023.117990
Copeland, B. R., and Taylor, M. S. (2004). Trade, growth, and the environment. J. Econ. Lit. 42, 7–71. doi: 10.1257/.42.1.7
Dangelico, R. M., and Pujari, D. (2010). Mainstreaming green product innovation: why and how companies integrate environmental sustainability. J. Bus. Ethics 95, 471–486. doi: 10.1007/s10551-010-0434-0
Dasgupta, S., Laplante, B., Wand, H., and David, W. (2002). Confronting the environmental Kuznets curve. The J. Econ. Persp. 16, 147–168. doi: 10.1257/0895330027157
Deng, R., and Zhang, A. (2022). Research on the impact of urban digital economy development on environmental pollution and its mechanism. South China J. Econ., 18–37. doi: 10.19592/j.cnki.scje.390724
Ehrlich, P. R., and Holdren, J. P. (1971). Impact of population growth. Science 171, 1212–1217. doi: 10.1126/science.171.3977.1212
Grossman, G. M., and Krueger, A. B. (1995). Economic growth and the environment. Q. J. Econ. 110, 353–377. doi: 10.2307/2118443
Hampton, S. E., Strasser, C. A., Tewksbury, J. J., Gram, W. K., Budden, A. E., Batcheller, A. L., et al. (2013). Big data and the future of ecology. Front. Ecol. Environ. 11, 156–162. doi: 10.1890/120103
Han, Z., Li, X., Yan, Z., and Zhong, K. (2022). Interaction and spatial effects of green technology innovation and financial agglomeration: empirical evidence from China under the goal of “double carbon”. Front. Environ. Sci. 10:984815. doi: 10.3389/fenvs.2022.984815
Hecker, L. P., Wätzold, F., and Markwardt, G. (2020). Spotlight on spatial spillovers: an econometric analysis of wastewater treatment in mexican municipalities. Ecol. Econ. 175:106693. doi: 10.1016/j.ecolecon.2020.106693
Huang, J., Huang, Y., Pontius, R. G., and Zhang, Z. (2015). Geographically weighted regression to measure spatial variations in correlations between water pollution versus land use in a coastal watershed. Ocean and Coastal Manage. 103, 14–24. doi: 10.1016/j.ocecoaman.2014.10.007
Kaika, D., and Zervas, E. (2013). The environmental Kuznets curve (EKC) theory—part a: concept, causes and the CO2 emissions case. Energy Policy 62, 1392–1402. doi: 10.1016/j.enpol.2013.07.131
Keller, W., and Levinson, A. (2002). Pollution abatement costs and foreign direct investment inflows to US states. Rev. Econ. Stat. 84, 691–703. doi: 10.1162/003465302760556503
Khazzoom, J. D. (1980). Economic implications of mandated efficiency in standards for household appliances. The Energ. J. 1, 21–40. doi: 10.5547/ISSN0195-6574-EJ-Vol1-No4-2
Lange, S., Pohl, J., and Santarius, T. (2020). Digitalization and energy consumption. Does ICT reduce energy demand? Ecol. Econ. 176:106760. doi: 10.1016/j.ecolecon.2020.106760
Lee, C. C., He, Z. W., and Xiao, F. (2022). How does information and communication technology affect renewable energy technology innovation? International evidence. Renew. Energ. 200, 546–557. doi: 10.1016/j.renene.2022.10.015
Levinson, A. (2009). Technology, International Trade, and Pollution from US Manufacturing. Am. Econ. Rev. 99, 2177–2192. doi: 10.1257/aer.99.5.2177
Li, W., Xu, X., Huang, S., Cheng, T., Liu, M., and Zhang, C. (2023). Assessment of green technology innovation on energy-environmental efficiency in China under the influence of environmental regulation considering spatial effects. Sci. Rep. 13:20789. doi: 10.1038/s41598-023-47786-2
Liu, Y., Zhou, Y., and Wu, W. (2015). Assessing the impact of population, income and technology on energy consumption and industrial pollutant emissions in China. Sustainability 155, 905–917. doi: 10.1016/j.apenergy.2015.06.051
Ma, Y. R., Ji, Q., and Fan, Y. (2016). Spatial linkage analysis of the impact of regional economic activities on PM2.5 pollution in China. J. Clean Prod. 139, 1157–1167. doi: 10.1016/j.jclepro.2016.08.152
Moyer, J. D., and Hughes, B. B. (2012). ICTs: Do they contribute to increased carbon emissions? Technol. Forecast. Soc. Change 79, 919–931. doi: 10.1016/j.techfore.2011.12.005
Özokcu, S., and Özdemir, Ö. (2017). Economic growth, energy, and environmental Kuznets curve. Renew. Sust. Energ. Rev. 72, 639–647. doi: 10.1016/j.rser.2017.01.059
Park, S., and Lee, Y. (2011). Regional model of EKC for air pollution: evidence from the Republic of Korea. Energy Policy 39, 5840–5849. doi: 10.1016/j.enpol.2011.06.028
Ren, S., Hao, Y., Xu, L., Wu, H., and Ba, N. (2021). Digitalization and energy: How does internet development affect China's energy consumption? Energ. Econ. 98:105220. doi: 10.1016/j.eneco.2021.105220
Shao, Q. (2020). Nonlinear effects of marine economic growth and technological innovation on marine pollution: Panel threshold analysis for China's 11 coastal regions. Marine Policy 121:104110. doi: 10.1016/j.marpol.2020.104110
Shen, K., Jin, G., and Fang, X. (2017). Does environmental regulation cause pollution to transfer nearby?–Evidence from Chinese cities. Econ. Res. J. 52, 44–59.
Shen, Y., and Zhang, X. (2023). Intelligent manufacturing, green technological innovation and environmental pollution. J. Innov. Knowledge 8:100384. doi: 10.1016/j.jik.2023.100384
Sirag, A., Matemilola, B. T., Law, S. H., and Bany-Ariffin, A. N. (2018). Does environmental Kuznets curve hypothesis exist? Evidence from dynamic panel threshold. J. Environ. Econ. Policy 7, 145–165. doi: 10.1080/21606544.2017.1382395
Song, Y., Zhu, J., Yue, Q., Zhang, M., and Wang, L. (2023). Industrial agglomeration, technological innovation and air pollution: empirical evidence from 277 prefecture-level cities in China. Struct. Change Econ. Dyn. 66, 240–252. doi: 10.1016/j.strueco.2023.05.003
Stern, D. I. (2017). The environmental Kuznets curve after 25 years. J. Bioecon. 19, 7–28. doi: 10.1007/s10818-017-9243-1
Tang, C., Xue, Y., Wu, H., Irfan, M., and Hao, Y. (2022). How does telecommunications infrastructure affect eco-efficiency? Evidence from a quasi-natural experiment in China. Technol. Soc. 69:101963. doi: 10.1016/j.techsoc.2022.101963
Tian, Y., Zhang, Y., Zhang, T., and Zhu, Y. (2024). Co-agglomeration, technological innovation and haze pollution: an empirical research based on the middle reaches of the Yangtze River urban agglomeration. Ecol. Indic. 158:111492. doi: 10.1016/j.ecolind.2023.111492
Wang, J., Ye, X., and Wei, Y. (2019). Effects of agglomeration, environmental regulations, and technology on pollutant emissions in China: integrating spatial, social, and economic network analyses. Sustainability 11:363. doi: 10.3390/su11020363
Wang, L., Jiang, S., and Xu, H. (2021). Reexamining the impact of industrial structure on haze pollution based on the Yangtze river delta. Atmosphere 12:613. doi: 10.3390/atmos12050613
Xu, K., and Zhang, Y. (2021). Can green technology innovation bring ‘lucid waters and lush mountains'? China Pop. Res. Environ. 31, 141–151.
Xu, W., Zhou, J., and Liu, C. (2022). The impact of digital economy on urban carbon emissions: Based on the analysis of spatial effects. Geograph. Res. 41, 111–129.
Yang, J., Wang, Y., Tang, C., and Zhang, Z. (2023). Can digitalization reduce industrial pollution? Roles of environmental investment and green innovation. Environ. Res. 22:117442. doi: 10.1016/j.envres.2023.117442
Yi, M., Wang, Y. Q., Sheng, M. Y., Sharp, B., and Zhang, Y. (2020). Effects of heterogeneous technological progress on haze pollution: Evidence from China. Ecol. Econ. 169:106533. doi: 10.1016/j.ecolecon.2019.106533
Yu, L., and Zhang, B. (2024). How does urban innovation affect haze pollution? Evidence from 270 cities in China. Environ. Dev. Sust. 26, 7595–7614. doi: 10.1007/s10668-023-03023-4
Zhang, X., and Xu, F. (2023). (2023) Environmental regulation and spatial spillover effect of green technology innovation: an empirical study on the spatial durbin model. Sustainability 15:14133. doi: 10.3390/su151914133
Zhang, Y., Liu, M., and Fu, B. (2024). Can digital technology application promote energy saving and emission reduction practices in enterprise? An empirical study based on the awareness-motivation-capability perspective. Energy 286:129636. doi: 10.1016/j.energy.2023.129636
Zhao, T., Zhang, Z., and Liang, S. (2020). Digital economy, entrepreneurship, and high-quality economic development: empirical evidence from urban China. J. Manage. World 36, 65–76. doi: 10.19744/j.cnki.11-1235/f.2020.0154
Keywords: green technical innovation, water polllution, spatial spillover, environmental Kuznets Curve, China
Citation: Ruan Y and Zhang A (2024) The spatial spillover effect of green technology innovation on water pollution–evidence from 283 Chinese cities. Front. Environ. Econ. 3:1393583. doi: 10.3389/frevc.2024.1393583
Received: 29 February 2024; Accepted: 17 April 2024;
Published: 28 May 2024.
Edited by:
Madhu Verma, Iora Ecological Solutions, IndiaReviewed by:
Oluwasola Omoju, National Institute for Legislative and Democratic Studies, NigeriaFengtao Guang, China University of Geosciences Wuhan, China
Copyright © 2024 Ruan and Zhang. This is an open-access article distributed under the terms of the Creative Commons Attribution License (CC BY). The use, distribution or reproduction in other forums is permitted, provided the original author(s) and the copyright owner(s) are credited and that the original publication in this journal is cited, in accordance with accepted academic practice. No use, distribution or reproduction is permitted which does not comply with these terms.
*Correspondence: Anqi Zhang, YW5xaS56aGFuZy5lY29uQG91dGxvb2suY29t