 David Atinga
 Joseph Agebase Awuni2
- 1Graduate School of Agricultural and Life Sciences, The University of Tokyo, Bunkyo City, Tokyo, Japan
- 2School of Economics, University for Development Studies, Tamale, Ghana
Introduction: In Ghana and comparable developing countries, advancing farm investments and adopting innovative rice farming techniques encounters obstacles because of climate change. Smallholder farming households, affected by climate events, confront substantial risks that affect both agricultural returns and investment decisions.
Methods: This research evaluates the enduring impact of fluctuating weather patterns in a single-cropping agroecological region on rice yields, examining the consequent influence on the utilization of inorganic fertilizers and agricultural input investment among rain-fed households, investigating disparities, reasons, and underlying mechanisms. The research used panel data from 60 communities, employing regression analysis and probability models. It integrated monthly cropping season weather data across the study zone's grid cells for community-level time series analysis.
Results and discussion: The results suggest that while weather shocks have a minimal impact on farmers abandoning inorganic fertilizers altogether, they do significantly decrease the overall amount of fertilizer used, agricultural investments, and rice crop yields. Floods and severe shocks exert a more pronounced influence compared to droughts and moderate shocks. Off-farm employment aids households in recovering from these shocks and maintaining agricultural investments. Climate shocks impact agricultural investment by reducing farm household income via altering crop yield and revenue. Consequently, this disrupts their ability to save, resulting in financial constraints. Encouraging and sustaining farm investments in vulnerable agrosystems involves diversifying income sources through combined crop and livestock farming, supplemented by off-farm activities. This strategy is fortified by climate-resilient farming practices, including resilient crop varieties supported by irrigation, weather insurance, and risk-oriented credit.
1 Introduction
Increasing worries regarding climate change and weather-related disruptions are major risks to worldwide agriculture and staple food output. In Sub-Saharan Africa (SSA), achieving Sustainable Development Goals (SDGs) in the face of climate change relies heavily on improving production. Understanding climate change impact on agriculture is crucial for creating resilient farming systems that can feed regions sustainably and contribute to global development goals. Climate change ongoing effects on African farming, especially in SSA, hinder the sustainable cultivation and production of essential crops like rice, posing a threat to achieving critical SDGs.
In recent years, the vulnerability of African agricultural systems to the adverse effects of climate change has become more evident. Smallholder farmers, who form the backbone of agricultural production in many African countries, often face heightened risks due to their reliance on rain-fed agriculture and limited access to resources and technology. This is partly because of the regions reliance on agricultural sector, the lack of accessible weather-contingent insurance securities and inadequate risk-mitigation strategies, such as limited credit and insurance markets, contribute to significant uninsurable risks in rainfed-dependent crop production (Hill and Viceisza, 2012; Newman and Tarp, 2020).
Rice, a staple crop providing vital nourishment and energy globally, holds immense significance for food security, sustainability, and livelihoods (He et al., 2021; do Nascimento et al., 2022; Xinkang et al., 2023). Rice cultivation supports global food systems significantly (Arouna et al., 2017; Sun et al., 2022). In Sub-Saharan Africa (SSA), where rice plays a crucial role in feeding impoverished communities, its demand is expected to rise by 3% to 4% annually (Adjao and Staatz, 2015; Arouna et al., 2021; OECD/FAO, 2021). However, SSA struggles to meet this growing demand due to lagging production and yields that do not align with global standards (Figure 1).
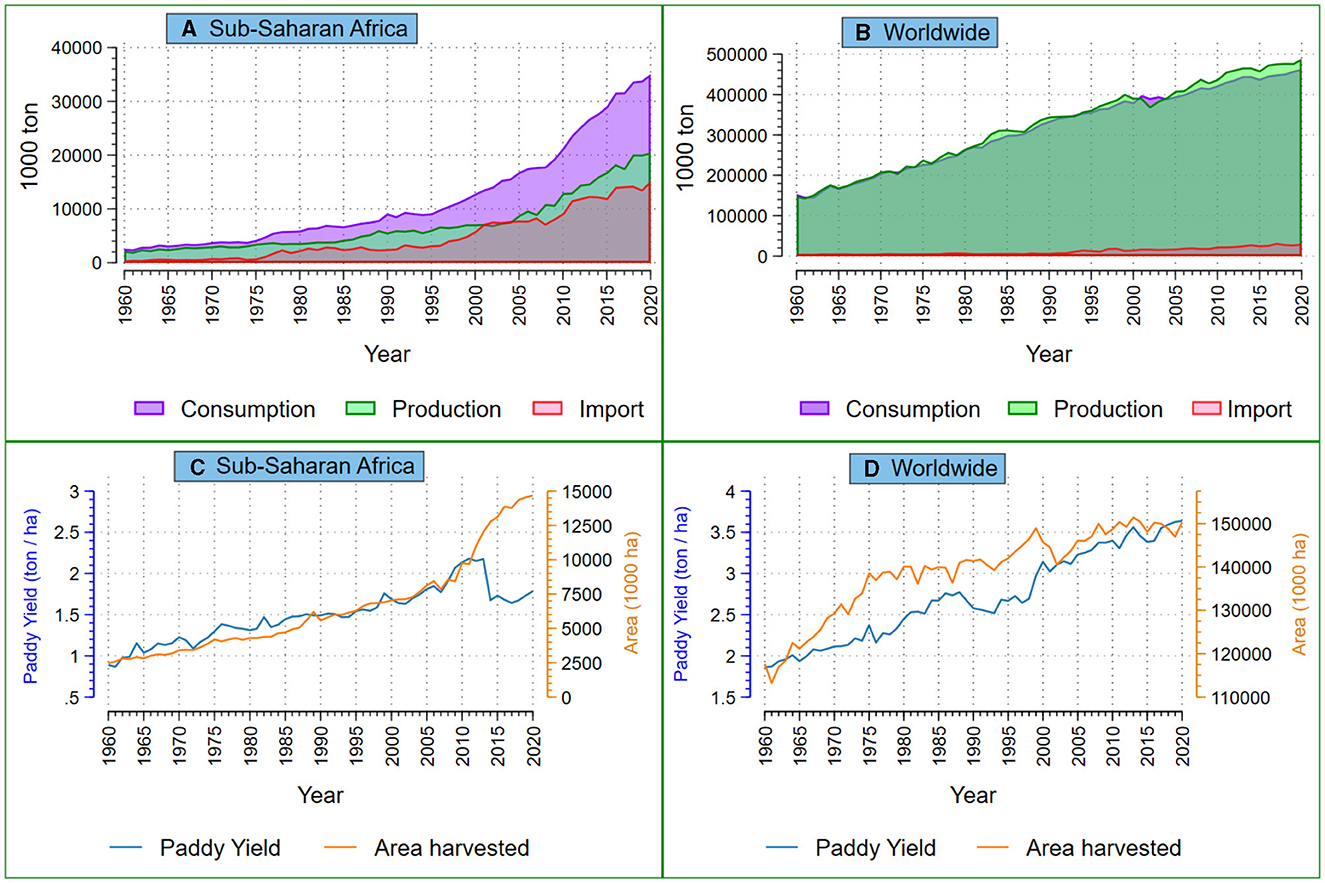
Figure 1. Production, consumption, import of rice (milled bases), paddy yield and area harvested of rice in SSA and the rest of the world. SSA captures data (annual rice consumption, production, importation, area harvested and yield from 1960 to 2021) on 37 SSA countries and Worldwide captures data from 138 countries. Source: Authors construct based on data from USDA: PSD Online November 2023 (https://apps.fas.usda.gov/psdonline/app/index.html#/app/downloads). Over the last three decades (1990–2020), rice consumption in Sub-Saharan Africa (SSA) has surged compared to global trends (A, B). Although rice production initially rose in response to meet the growing demand, particularly after 2000, this increase could not match thewidening gap between production and consumption (A). The growth in production, as shown in the figure, mainly arose from expanded harvested areas rather than improvements in paddy yield (C). However, the current paddy yield levels in SSA remain notably lower compared to global averages in the 1980s. SSA's average paddy yield ranged from around 1 to 2 t/ha (with maximum yields ranging 3–6.5 t/ha), while the rest of the world's yield surpassed 2 to 3.5 t/ha (with maximum yields ranging 5.5–10 t/ha) from 1970 to 2020 (C, D), (USDA, 2023). This persistent low yield, combined with escalating demand leading to increased rice imports between 1995 through 2010 to 2020 has contributed to the widening gap between consumption and production (A).
1.1 The Ghanaian context
In Ghana, rice stands as the second most important grain, witnessing significant consumption growth over the last 20 years. It plays a pivotal role in sustaining both livelihoods and income for Ghanaian farmers.
However, local production struggles to keep up with the increasing demand for rice in the country (Figure 2). In the last 30 years, Ghana has experienced a fourfold surge in rice consumption, reaching 51.63 kg per capita annually, posing a threat to food security (MoFA, 2019; Ouédraogo et al., 2021). Reliance on imports due to inadequate local production leaves Ghana only 50 percent self-sufficient in rice (FAO, 2015, 2022; MoFA, 2021; OECD/FAO, 2021). Despite efforts to introduce better growing methods, Ghana struggles to adopt these advancements, resulting in low rice yields (3 t/ha) compared to its potential (6.5+ t/ha), largely due to dependence on rainfall, low farm investments and underutilization of improved production techniques by farmers (Abel et al., 2014; Ragasa and Chapoto, 2017; MoFA, 2021).
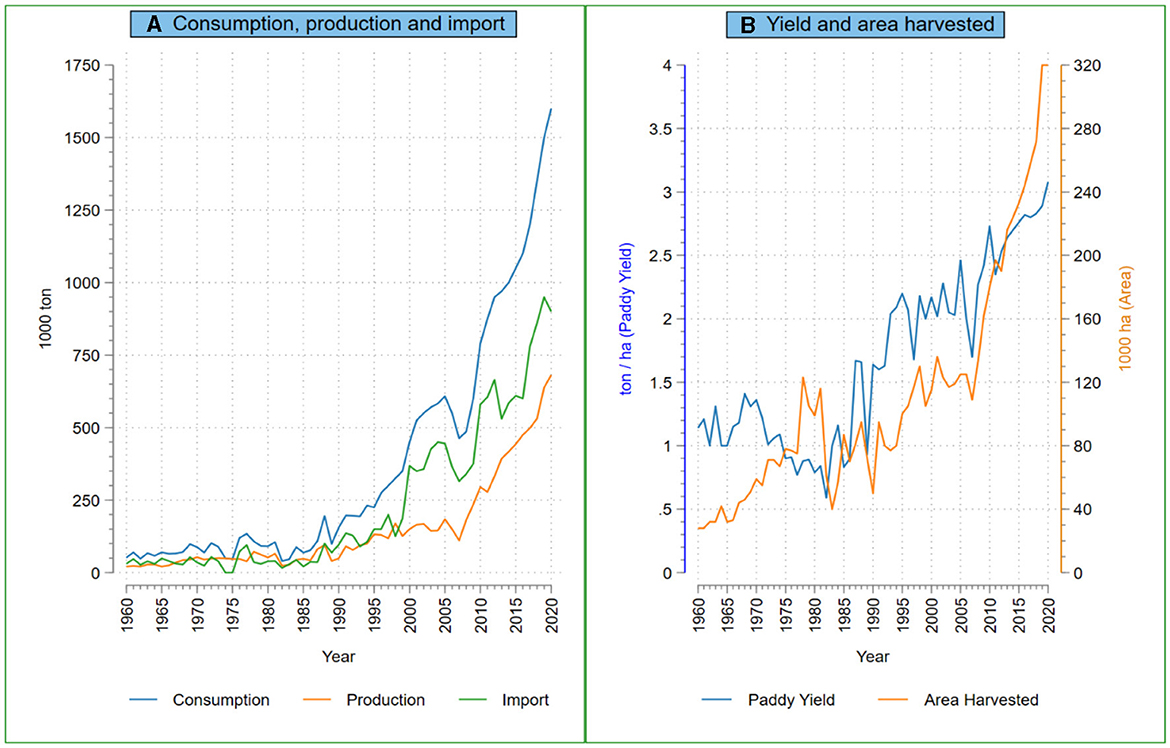
Figure 2. Production, consumption, import of rice (milled bases) and paddy yield, area harvested of rice in Ghana, 1960–2020. Data Source: USDA: PSD Online November 2023 (https://apps.fas.usda.gov/psdonline/app/index.html#/app/downloads). Over the past 30 years (1990–2020), rice consumption in Ghana has been growing at a faster annual rate of 31.1% compared to maize (first most important staple cereal), which increased at a rate of 13.3% (USDA, 2023). In response to rising demand, rice production in initially increased by 12.1% annually from 1990 to 2006 and later by 23.6% from 2006 to 2020, but the gap between production and consumption widened over time (A). The growth in production, as depicted in (B), is primarily driven by an expansion of the harvested area (at 9, 10, and 18% annually) rather than improvements in paddy yield (at 1.3, 3.6, and 3%), over the specified time periods (1990–2006, 2006–2020, and 1990–2020 respectively) (USDA, 2023). Yield in Ghana has consistently fallen short of its potential (6 t/ha), ranging from 1.6 to 3.1 t/ha. The persistent low paddy yield has led to a significant annual increase of 28% in rice imports from 1990 to 2020, resulting in a widening consumption-production gap (A).
Rice production in Ghana comprises three ecosystems: irrigated, rain-fed lowland, and rain-fed upland. Approximately 90% of production occurs in rain-fed areas, contributing 77% of domestic production and significantly impacted by weather conditions (Abel et al., 2014; Ragasa and Chapoto, 2017; MoFA, 2019, 2021). Rain-fed regions yield about < 3 tons per hectare, whereas irrigated areas produce twice that amount (6 t/ha), (MoFA, 2021). The system heavily depends on rainfall and is susceptible to climate change, causing yield variations. Small-scale farmers, averaging < 2 hectares, primarily manage this system (Issahaku and Abdulai, 2020).
Agricultural weather conditions in Ghana have undergone significant changes per decade due to climate change.1 Forecasts indicate a potential increase in temperatures by up to +3°C, with more prolonged dry periods and heightened heat exceeding 35 degrees Celsius. Both minimum and maximum daily temperatures have been on the rise, consistent with the anticipated trends (Fahad et al., 2019; World Bank Group, 2023). This may result in a situation where farmers either reduce or divert their intended farm investments due to the uncertainties and challenges posed by these climate shifts strategies (Sesmero et al., 2018; Bharwani et al., 2020). The weather data2 from the study zone aligns with the predicted trends. The prevailing situation in the savanna agroecological zone in Northern Ghana requires specific attention due to its unique environmental conditions3 and vital role as a major food provider, raising considerable economic concerns.
1.2 Literature and contribution
Prior research (Alem et al., 2010; Arslan et al., 2017; Marenya et al., 2020; Zakaria et al., 2020; McCarthy et al., 2021; Bora, 2022; Gelo, 2022) has primarily focused on adopting technology, specifically within System of Rice Intensification (SRI) and Climate Smart Agricultural Technologies (CSAT), to handle production risks in agricultural production. In rice farming, there is limited study on how climate impacts the move away from advanced techniques and investment in farming inputs in at-risk agricultural environments.
In relation to the use of fertilizers and agricultural investments, variations in weather patterns have led to a decline in the application of chemical fertilizers because of their discouraging impact (Alem et al., 2010; Anik et al., 2022; Gelo, 2022). Climate-related disruptions have affected farmers' investment choices, resulting in decreased expenditures on machinery, seeds, and pesticides (Zhou et al., 2022). Similarly, fluctuations in weather conditions influence agricultural assets such as land, livestock, and farming equipment (Newman and Tarp, 2020). Weather-related disturbances also have adverse effects on rice yield (Mall and Aggarwal, 2002; Lobell et al., 2008; Stuecker et al., 2018; van Oort and Zwart, 2018). Specifically, variations in rainfall patterns influence the uptake of climate-smart technologies, with excessive rainfall leading to diminished rice yields (Tossou and Arouna, 2023). Similarly, rising monthly and annual temperatures, as indicated by Lachaud et al. (2022) notably diminish agricultural output, dampening enthusiasm for investing in farm resources.
Recent and prior research (Lobell et al., 2008; Alem et al., 2010; Stuecker et al., 2018; Anik et al., 2022; Gelo, 2022; Tossou and Arouna, 2023) uses various statistical measures such as means, standard deviations, and coefficients of variation to gauge weather variability elements from temperature and rainfall. Many of these studies overlook comprehensive methodologies that combine key weather elements to define the desired weather target parameter. They collect data over variable periods, from short-term to < 2 decades, with only a few researchers extensively examining longer periods, particularly focusing on rainfall vulnerability and its standard deviations (Anik et al., 2022; Tossou and Arouna, 2023).
Single-time surveys heavily depend on memory, while limited use of panel data with a 2 to 3-year gap between initial and final surveys is commonly used for tracking. Additionally, there's a lack of research on how weather shocks impact continued disuse, especially regarding vital components like inorganic fertilizers in rice green revolution technology (deGraft-Johnson et al., 2014). Research on how weather shocks affect rice production lacks examination of the mutual impact on fertilizer usage, including both the choice to completely cease the use of inorganic fertilizers (fertilizer disadoption) and the decrease in the quantity of fertilizers applied (fertilizer application amounts), and examining how these changes impact investments in farm input expenses.
This study investigates the short-term and long-term impact of weather shocks on agricultural outcomes, analyzing their influence on fertilizer utilization, input expenses and yield at the household and village scales. The study categorizes weather shocks by type and severity and analyzes variations in off-farm employment. Provides qualitative insights into the reasons for non-adoption and disadoption, highlighting the mechanisms and the importance of off-farm income for farm households to invest in farming inputs, embrace better technologies, and recover from unexpected setbacks. It underscores how off-farm income enables agricultural households to enhance their farming practices despite challenges. This study enhances the existing literature on climate change and agriculture in SSA by utilizing a robust method to evaluate long-term weather disturbances on small-scale rice farming households in a rainfed single season cropping agroecosystem.
The rest of the paper is structured as follows: study area and data, empirical approach, estimation strategy, results and discussion, and conclusion.
2 Study area and data
This research focuses on the northern region in Ghana's savanna agroecological zone to address the research question.
2.1 Study area
The Guinea savanna in northern Ghana, covering 60% of suitable rice land, used to contribute 65% to domestic rice production, but now it has dropped to under 40% (AGRA, 2020; MoFA, 2021). Output in northern Ghana has witnessed a decline since 2011, attributed to adverse weather conditions (Ragasa and Chapoto, 2017). This area, marked by rainfed ecosystems and impoverished smallholder households, relies on rainfed agriculture for survival rather than economic growth, especially in the more impoverished Northern part compared to the South (GSS, 2019) and characterized by low input use (AGRA, 2020). The zone is characterized with one rainy season and higher daily temperatures but less annual rainfall, interventions have not led any administrative district in northern Ghana to rank among the top 10 for rice crop yield. Only two districts slightly exceed the national average of about 3 t/ha, despite development efforts (MoFA, 2019, 2021). Small-scale farming mainly sustains livelihoods, focusing on growing cereals, legumes, and vegetables, while livestock ownership varies based on available resources (Michalscheck et al., 2018). Family-operated farms, managed by different household members, consist of multiple semi-independent production units known as “own fields” is common. Residents often live in family compounds, which is more common in rural than urban areas.
2.2 Data
The study utilized spatial weather information in combination with panel data from rice-producing households.
2.2.1 Household panel data
The research draws upon panel data sourced from a survey involving 481 households engaged in rice farming across 60 villages situated within eight administrative districts known for rice cultivation in Ghana's Guinea savanna agroecological zone. This data was collected by a collaborative effort between the Japan International Cooperation Agency Research Institute (JICA-RI), the University of Tokyo, Ghana's University for Development Studies (UDS), and the Savanna Agricultural Research Institute (SARI) during the period from 2010 to 2022. This study utilized (i) the baseline survey conducted in year 2010 and covered 60 villages, 20 of which were randomly selected from 58 where Lowland Rice Development Project (LRDP4) was implemented, while the remaining 40 villages were chosen around these LRDP sites from topographic sheets at a 1/50,000 scale. The sampling process was proportional to the size with 5–8 villages selected per district leading to a total of 60 villages. In total, a maximum of 10 rice producing farm households were randomly sampled per village. The survey gathered data on a broad range of socioeconomic variables, farming practices, institutional factors, input use and rice production, and the history of technology adoption regarding the periods when the farmers first adopted an improved technology, whether they discontinued its use and if so whether they readopted after disadoption given their exposure and potential technology diffusion path. (ii) A follow up survey on farm households in these 60 communities was conducted in May 2022 which also captured detail information on their adoption history. Refer to Figure 3 for map of study area and Appendix5 for detailed description.

Figure 3. Map of Ghana showing study zone and sampled districts. Source: Authors construct.
2.2.2 Spatial weather data
To evaluate how fluctuating weather patterns impact the utilization of inorganic fertilizers and investments in farm inputs over the long run, we integrated survey data with localized weather information for rice cropping seasons using village-based geo-referencing. This research employed NASA Giovanni's monthly satellite gridded weather data across various spatial resolutions (0.1°, and 0.5° × 0.625°) spanning from 1982 to 2021, encompassing 60 study communities (see details in Table 1).
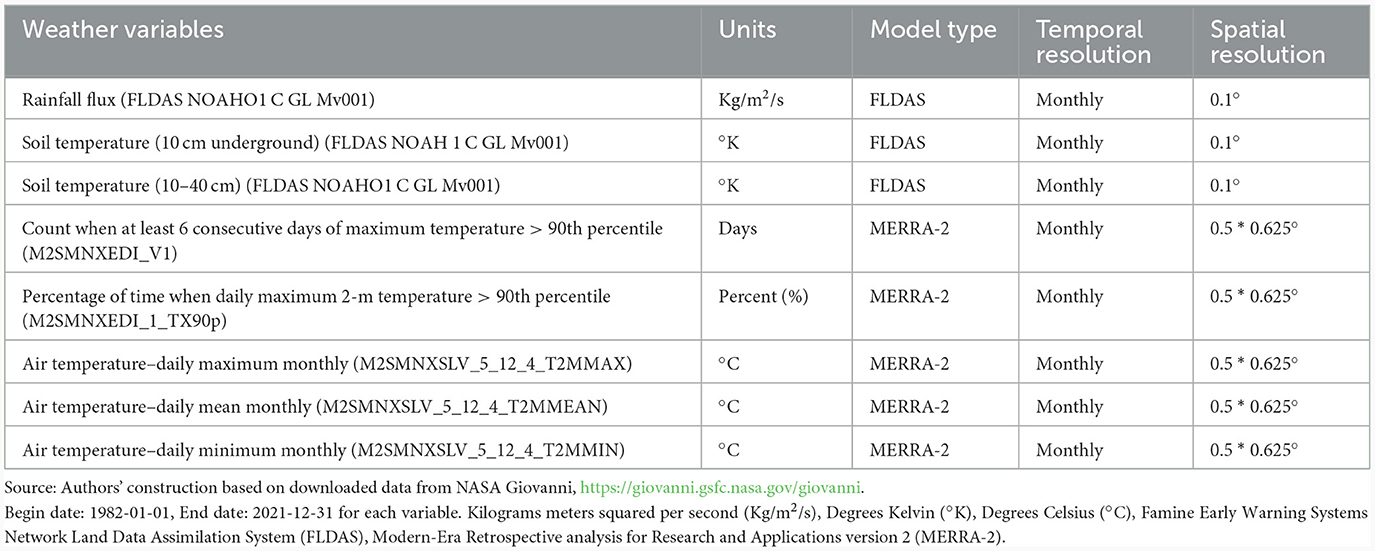
Table 1. Details of weather parameters.
2.2.3 SPEI computation and categorization
The study employed the Standardized Precipitation Evapotranspiration Index (SPEI), (Vicente-Serrano and Beguería, 2016; Beguería and Vicente-Serrano, 2024) in conjunction with specific indicators to identify weather disturbances. This process involved five key steps (Figure 4): (i) assessing satellite data for weather insights, (ii) computing Potential Evapotranspiration (PET), (iii) determining the Climatic Water Balance, (iv) calculating the SPEI, and (v) categorizing weather disturbances/shocks using SPEI indices. Figure 4 illustrates the flowchart depicting the SPEI methodology, while Table 2 presents classifications based on SPEI values, where negative values signify dry conditions and positive values indicate wet conditions (Vicente-Serrano et al., 2010; Vicente-Serrano and Beguería, 2016; Beguería and Vicente-Serrano, 2024). For a more comprehensive understanding of the methodology, please refer to Appendix.6
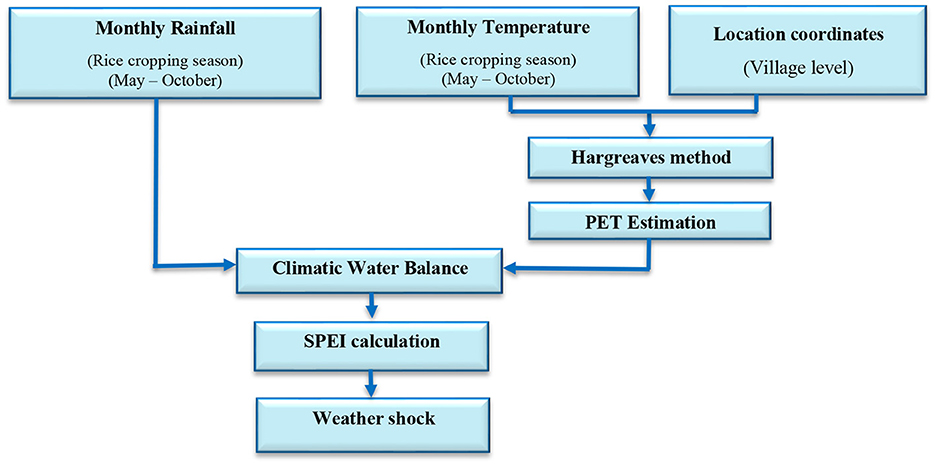
Figure 4. SPEI methodological procedure. Source: Authors construct.
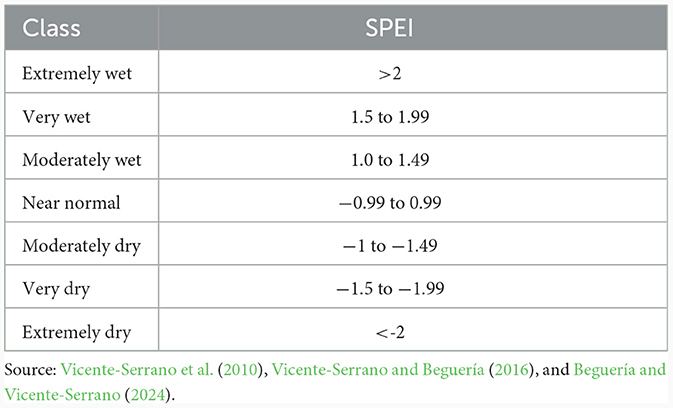
Table 2. SPEI index classification.
2.2.4 Outcome variables
This study focuses on the following outcome indicators: Disadoption of inorganic fertilizer. Disadoption in this study refers to if a farmer ever adopted inorganic fertilizer (chemical fertilizer) and discontinued the use of it (abandoned it or stopped using). Fertilizer application quantity, the average quantity of fertilizer in kilogram per hectare, farm input investments measured as the total cost (in Ghana cedis “GHC”) of farm input per hectare and rice yield, measured as tons per hectare (t/ha).
3 Empirical and estimation approach
3.1 Empirical approach
3.1.1 Farm household model assumption
This section utilizes a small farm household model to offer microeconomic insights, which serve as a framework for contextualizing and structuring our analysis. The foundation of the farm household model is built upon the assumption that rice production follows the subsequent function (Equation 1).
where, Q = Rice quantity produced, v = Rice seed variety indicator superscript (l = non-improved, local rice variety, m = improved, modern rice variety), T = Complementary input or technology use and the intensity of technology use, T0 = Agronomically optimal input use rate (e.g., Optimal fertilizer application rate), θ = Multiplicative shock term, where E(θ) = 1, and λv and ηv = Returns to rice seed variety and returns to complementary inputs respectively.
3.1.2 Net returns (less input cost)
When a farmer dedicates H hectares of land to rice cultivation, the selection of a particular rice variety (v) for planting and the subsequent supplementation of the seeds with additional inputs, management practices, or technologies (T) can allow for the calculation of the resulting net income (Y) in the following manner (Equation 2).
Where, Y = Net income from rice, p = Price of rice (selling price), kv = Per hectare cost of seed for variety (v), either non-improved or improved seed, gT = Per hectare cost of adopting complementary inputs, farm practices, labor, technologies, etc. Please be aware that the benefits gained from selecting specific seed varieties and complementary technologies can fluctuate based on factors such as seasonal weather during crop cultivation, the proficiency of farmers, and the characteristics of the soil, etc. (Tjernström, 2017; Laajaj and Macours, 2023). Note, for simplicity, emphasis is placed on fertilizer as a complementary input or technology in characterizing returns and cost implication in the subsequent section.
3.1.3 Characterization of chemical fertilizer use in rice production (returns and cost implications)
Assuming fertilizer is the complementary technology denoted as T in Equation 2 where T = 1 is fertilizer adoption and usage and T = 0 otherwise. Failure to use fertilizer (non-adoption or disadoption), (kv and gT = 0) verses fertilizer use (kv and gT = 1): Utilizing or sowing rice seed variety (v) without chemical fertilizer application (T = 0) results in lower per-hectare cost compared to using fertilizer . The immediate returns from investments (yield) from planting rice seeds without chemical fertilizer (T = 0) tends to be lower when compared to using a seed variety combined with chemical fertilizer application (T = 1), assuming all other factors remain constant. Moreover, resource poor agricultural households might use significantly less fertilizer than the recommended optimal rate T0 (Agronomically optimal fertilizer application rate) per area, or they may decrease the rate of fertilizer application compared to their usual practices.
3.1.4 Fertilizer adoption and disadoption
In aligning the concept to the design, decision to adopt inorganic (chemical) fertilizer is modeled using the general framework of utility maximization (Hassen, 2015). A farm household decides to adopt fertilizer (Equation 3) only when the utility gained from adopting is significantly greater than the utility gained without using it, which can be formulated as follows. A farm household will switch from not using (non-adoption) to using (adoption) fertilizer (f) if,
The farmer will not adopt (Equation 4) f if,
where,
represents the benefit attained in the non-adoption state (n) of fertilizer (f ), while
signifies the benefit achieved upon adopting (a) fertilizer (f ).
= denotes underlying net benefit of choosing to adopt or not adopt fertilizer (f ).
Stage 1: Involves deciding to adopt fertilizer. Stage 2: Involves deciding whether to stop or keep using it after adoption.
The process of adopting and abandoning fertilizer can be described through two hidden Equations (5 and 6) involving latent variables and , representing (1) the likelihood of transitioning from non-adoption to adoption and (2) from adoption to disadoption, respectively, thereby influencing the decision-making process for fertilizer adoption and abandonment (disadoption). Therefore, the concealed choices to adopt or abandon are influenced by,
Where the latent variables and depend on vector of the household's observed characteristics Xf1 and Xf2 respectively. (fertilizer disadoption decision) is not observed if or . It is only possible to observe if a household ever adopted fertilizer and later discontinue its use . Since only a subset of original sample adopts fertilizer (Equation 6), disadoption (abandonment) is observed only for those who ever adopt fertilizer in rice farming.
3.2 Estimation strategy
To assess the influence of random weather exposure, we can estimate the impact (average treatment effect [ATT]) by comparing control and treated groups at follow-up using analysis of covariance regression. The study mainly utilizes ANCOVA regression as a method to enhance the accuracy and precision of its estimates, McKenzie (2012) and linear probability model (LPM). The variable of interest, D, is an indicator for weather shocks, equal to 1 for households in affected villages and 0 for others. The outcome for farm input investments (chemical fertilizer application quantity and farm input cost) (Equation 7), using ANCOVA. To address variations (heterogeneity) in impact caused by different weather shock types, Equation 8 modifies the ANCOVA estimation to incorporate both flood and drought.
The study enhances the analysis by assessing the influence of weather shocks in the current year on rice yield (Equation 9), contributing to the understanding of the mechanisms of dis-adoption. Additionally, sub-sample analysis was estimated for the outcome variables as part of robustness analysis. In the yield and cost outcome specification for the main analysis, we winsorize the data (i.e., replace values above the 95th percentile with the 95th percentile) and replicate the regression analysis.
Where, i = household, j = village. Zij, 0 and Zij, 1 = Baseline and endline outcomes for fertilizer Disadoption (Yes/No), fertilizer application quantity (kg/ha) and farm input cost (GHC/ha). Yij, 0 and Yij, 1 = Baseline and endline outcomes for rice yield (t/ha). and = Dummy for previous year (PY) shock and number of shocks (NB) after baseline. and = Dummy for previous year's flood shock and drought shock respectively. and = Dummy for current year flood shock and drought shock respectively. Xij, 0 and Xij, 1 = Vector of baseline and endline covariates respectively. ωij, 1 = error term.
4 Results and discussion
The study begins with descriptive statistics (Section 4.1) and presents findings (Section 4.2) using ANCOVA and LPM regression methods to estimate treatment effects, considering outcomes with or without covariate adjustments. It explores variations with different SPEI weather shock thresholds (moderate “cut 1.25” and severe “cut 1.50”). Additionally, it delves into diverse impacts based on flood and drought shocks (Section 4.2.4) and examines impact mechanisms (Section 4.2.6).
4.1 Descriptive results
4.1.1 Annual and monthly rice cropping season rainfall
Figure 5 depict irregular rainfall patterns during the rice cropping season (May to October), notably more erratic from 2010 to 2021. There was a substantial decline in rainfall between 2010 and 2013, dropping to below 800 mm. Afterward, annual rainfall consistently fell below the long-term average. The rainy season spans about 6 months, starting in May and ending in October, with rice planting occurring from late May to early July. For detailed monthly rainfall and temperature distributions in 2020 and 2021, refer to Figures A1–A3.
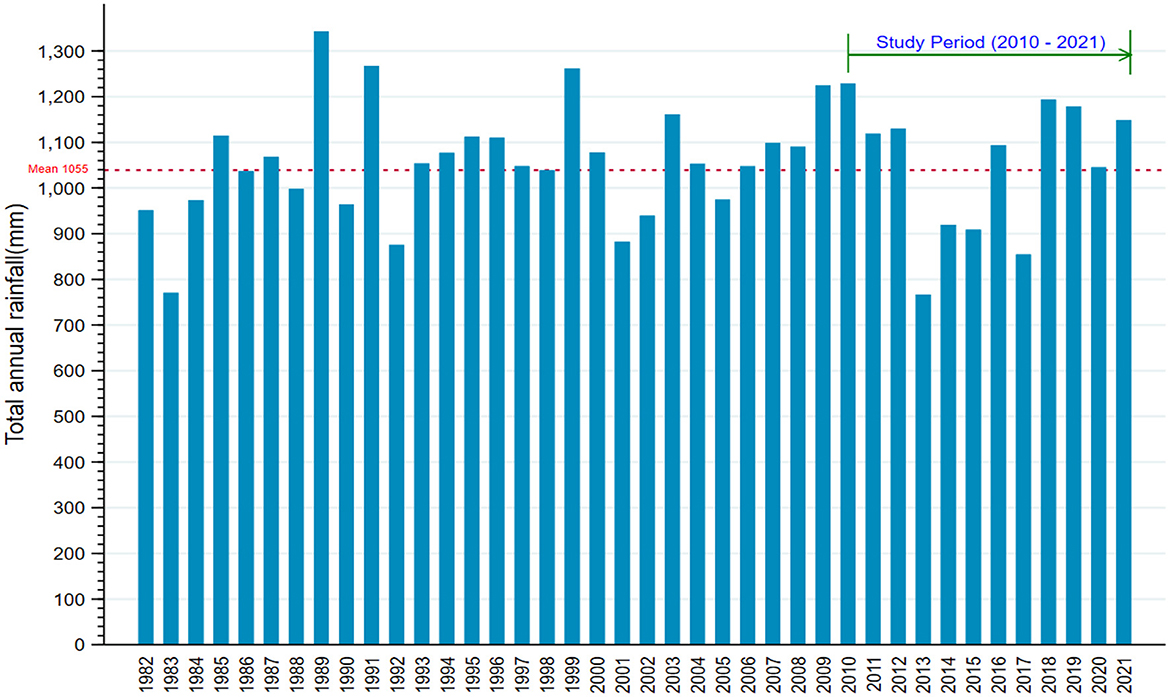
Figure 5. Total annual cropping season rainfall. Source: Authors' construction based on data from NASA Giovanni.
4.1.2 Cropping season rainfall and temperature distribution over time
Figure 6 illustrates shifts in rice cropping season rainfall patterns. Over the past four decades, the distribution has shown a shift from a normal distribution with two peaks pre-2010 to a more skewed, bimodal distribution post-2010. Rainfall frequencies have shifted, with more occurrences of lower rainfall amounts (800mm−950 mm) and higher amounts (1,000 mm to 1,250 mm) during the cropping season. This indicates a recent trend of non-uniform and leftward-skewed rainfall patterns. Concurrently, temperature trends have displayed a consistent warming trend, with increased minimum and maximum temperatures especially evident after 2010 and in the last 30 years.
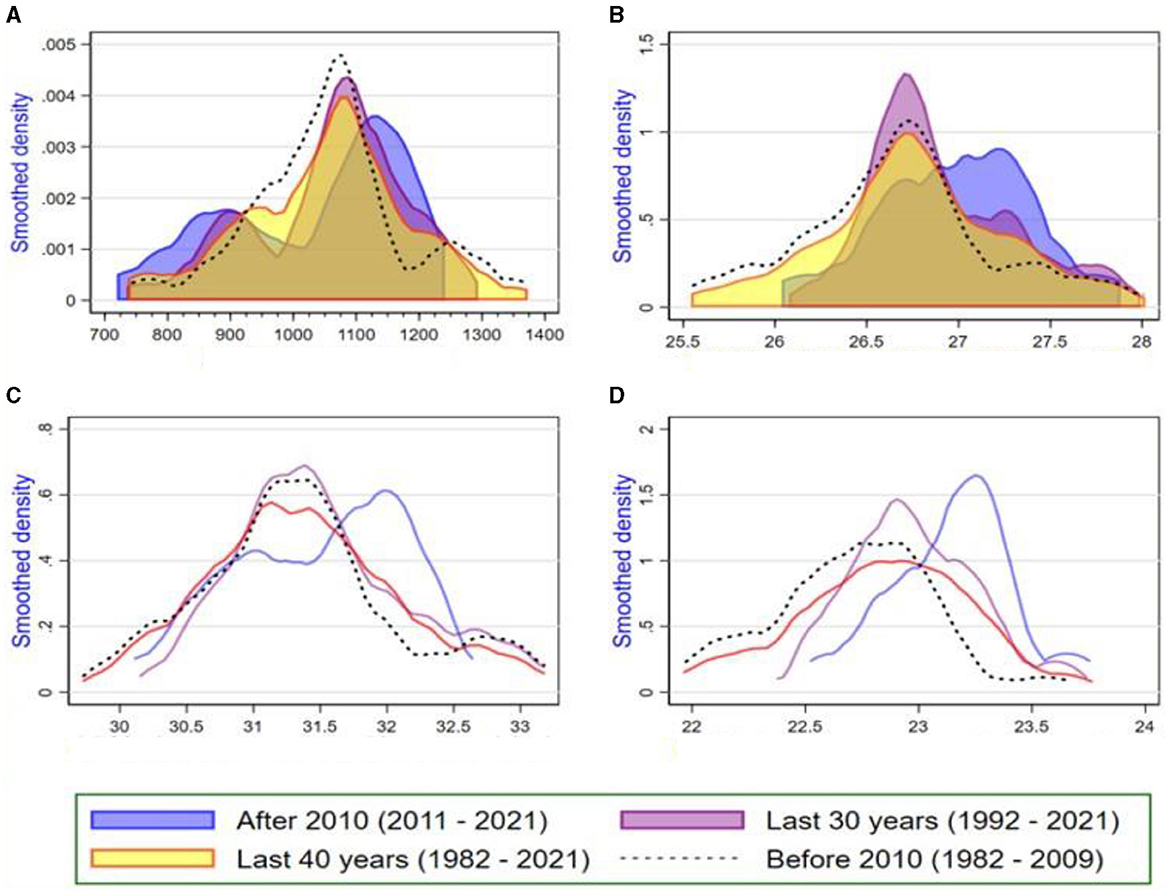
Figure 6. Cropping season rainfall and temperature distribution. Source: Authors' construction based on downloaded data from NASA Giovanni (1982–2021). (A) Total rainfall (mm). (B) Mean temperature (degrees celsius). (C) Maximum temperature (degrees celsius). (D) Minimum temperature (degrees celsius).
4.1.3 SPEI index by community (2020 and 2021)
Figure 7 displays the SPEI weather shock index, where negative values signify below-average rainfall and positive values indicate above-average rainfall compared to the long-term average. The index categorizes weather shocks as moderate (1.0–1.49), severe (1.5–1.99), and extreme (2.0 and higher). Positive values represent floods, while negative values signify droughts. Using thresholds of ±1.25 and ±1.5 for analysis, the study noted floods impacting about 6 and 4 communities in 2020 and 2021, respectively. Additionally, drought affected 12 and 10 communities during the same period. The research emphasizes more frequent severe droughts compared to floods, reflecting erratic rainfall patterns with increased occurrences of both lower and higher rainfall events in recent years.
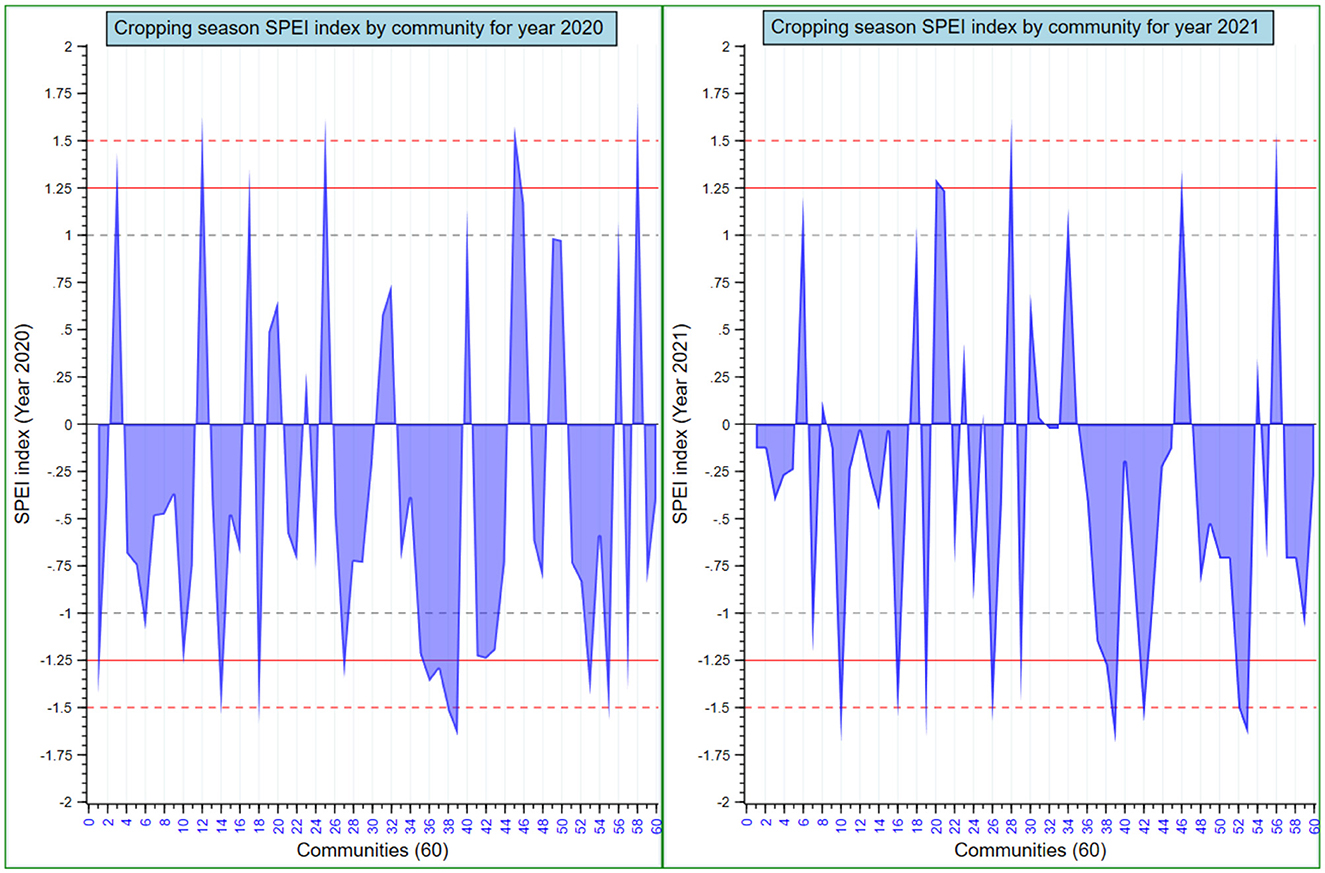
Figure 7. Cropping season SPEI index by community. Source: Authors' construction based on data from NASA Giovanni.
4.1.4 Summary statistics (fertilizer use over time, outcomes, and weather indicators)
Farm households who adopt chemical fertilizer on their rice farms were low (25 percent) at baseline compared with high adoption rates (68 percent) at endline (Table 3). However, fertilizer disadoption rates were generally low at both baseline and endline. Farmers' decisions to not adopt or abandon technologies were mainly due to financial, economic, and environmental factors, with input-intensive methods like chemical fertilizers being discontinued due to environmental concerns stemming from adverse weather conditions and soil infertility (Refer to Appendix A7). Table 4 displays the descriptive statistics of the dependent variables and SPEI weather shock indicators for 2020, 2021 and between 2010 to 2021 as well as weather controls at community level. Over time, fertilizer use per hectare rose by 34%, reaching 100 kg/ha by the end of the survey, up from an average of 66 kg/ha in 2010. Despite this increase, the application rate remains well below the recommended level for the Guinea savanna agroecological zone, which is 350 kg/ha or more (MoFA, 2021). Input costs for rice farming increased from GHC 609 to GHC 718 per hectare between baseline and endline. The farmers studied showed significant variation in input costs per hectare, ranging from GHC 60 to GHC 4,000. Smaller farms generally incurred higher input costs compared to larger ones. Despite the anticipation of improvement over time in farm performance due to experience and exposure, rice yields declined from 2.14 t/ha to 1.65 t/ha at endline, potentially influenced by changing weather conditions, disadoption of some practices, and high input expenses. Detailed descriptive statistics for additional control variables, including household, plot, and adoption controls, presented in Table A2.

Table 3. Use of chemical fertilizer over time.
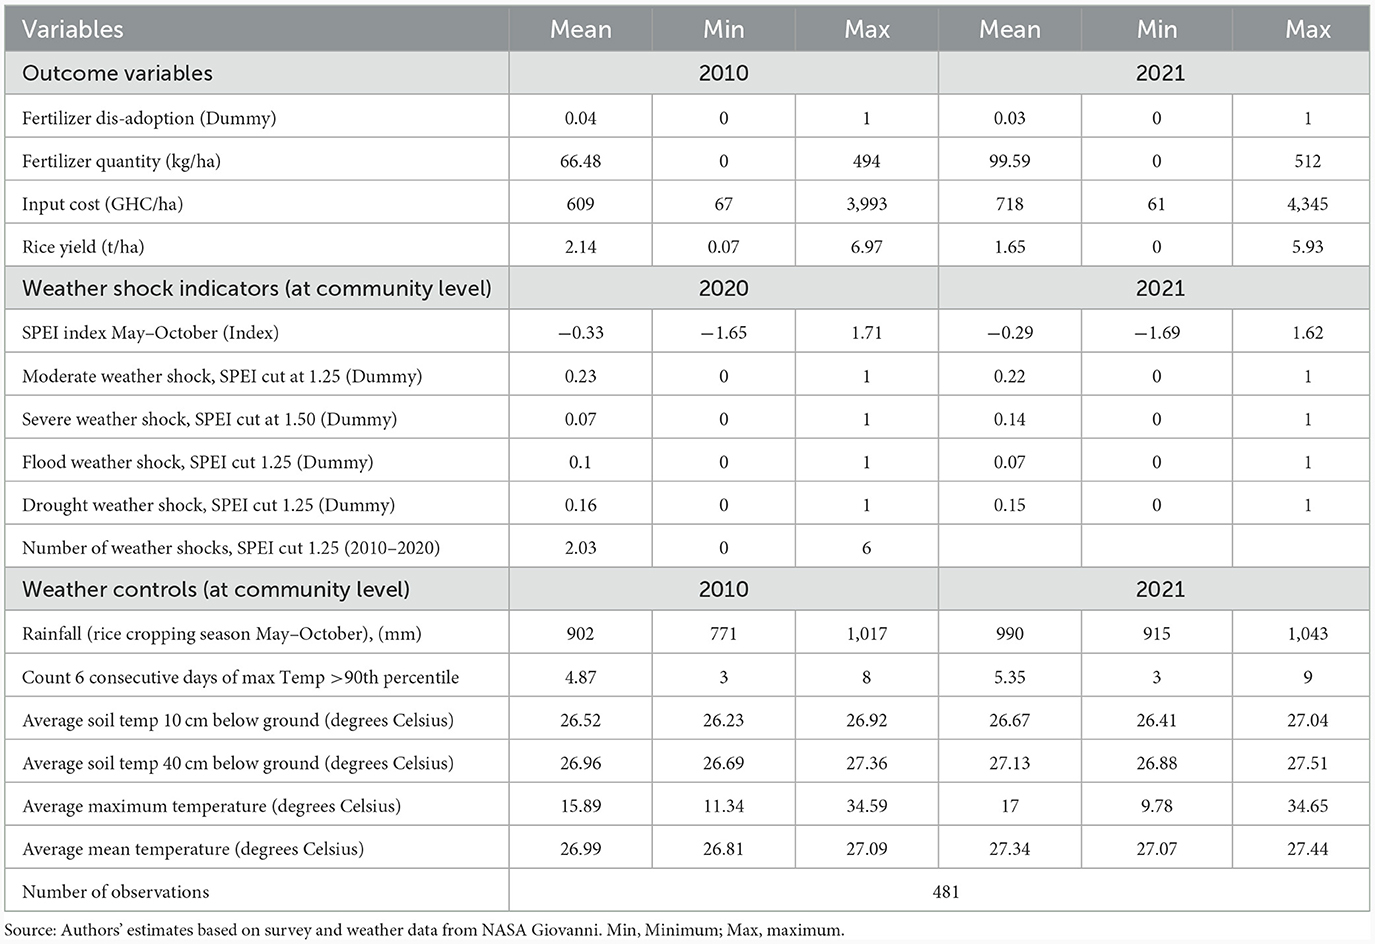
Table 4. Summary statistics of outcome variables, weather shock indicators and controls.
4.2 Econometric results
4.2.1 Impact on fertilizer application
Worth noting from Table 5 (panel A) is that the impact of weather shocks on disadoption of fertilizer records a very low percent effect (below 3 percent) on fertilizer disadoption. Also, while the severe weather shock at the upper limit (1.50) was not vastly different from the moderate shock, it was fairly significance at 10 percent. The LPM findings indicate a meaningful positive impact of weather shocks (at cut 1.25) on disadopting fertilizer for over 2 years, albeit with a diminished effect. The immediate findings called for questions. Are farm households who are exposed to weather shocks not necessarily discontinuing the use of chemical fertilizers but probably reducing the intensity (quantity) of their application?
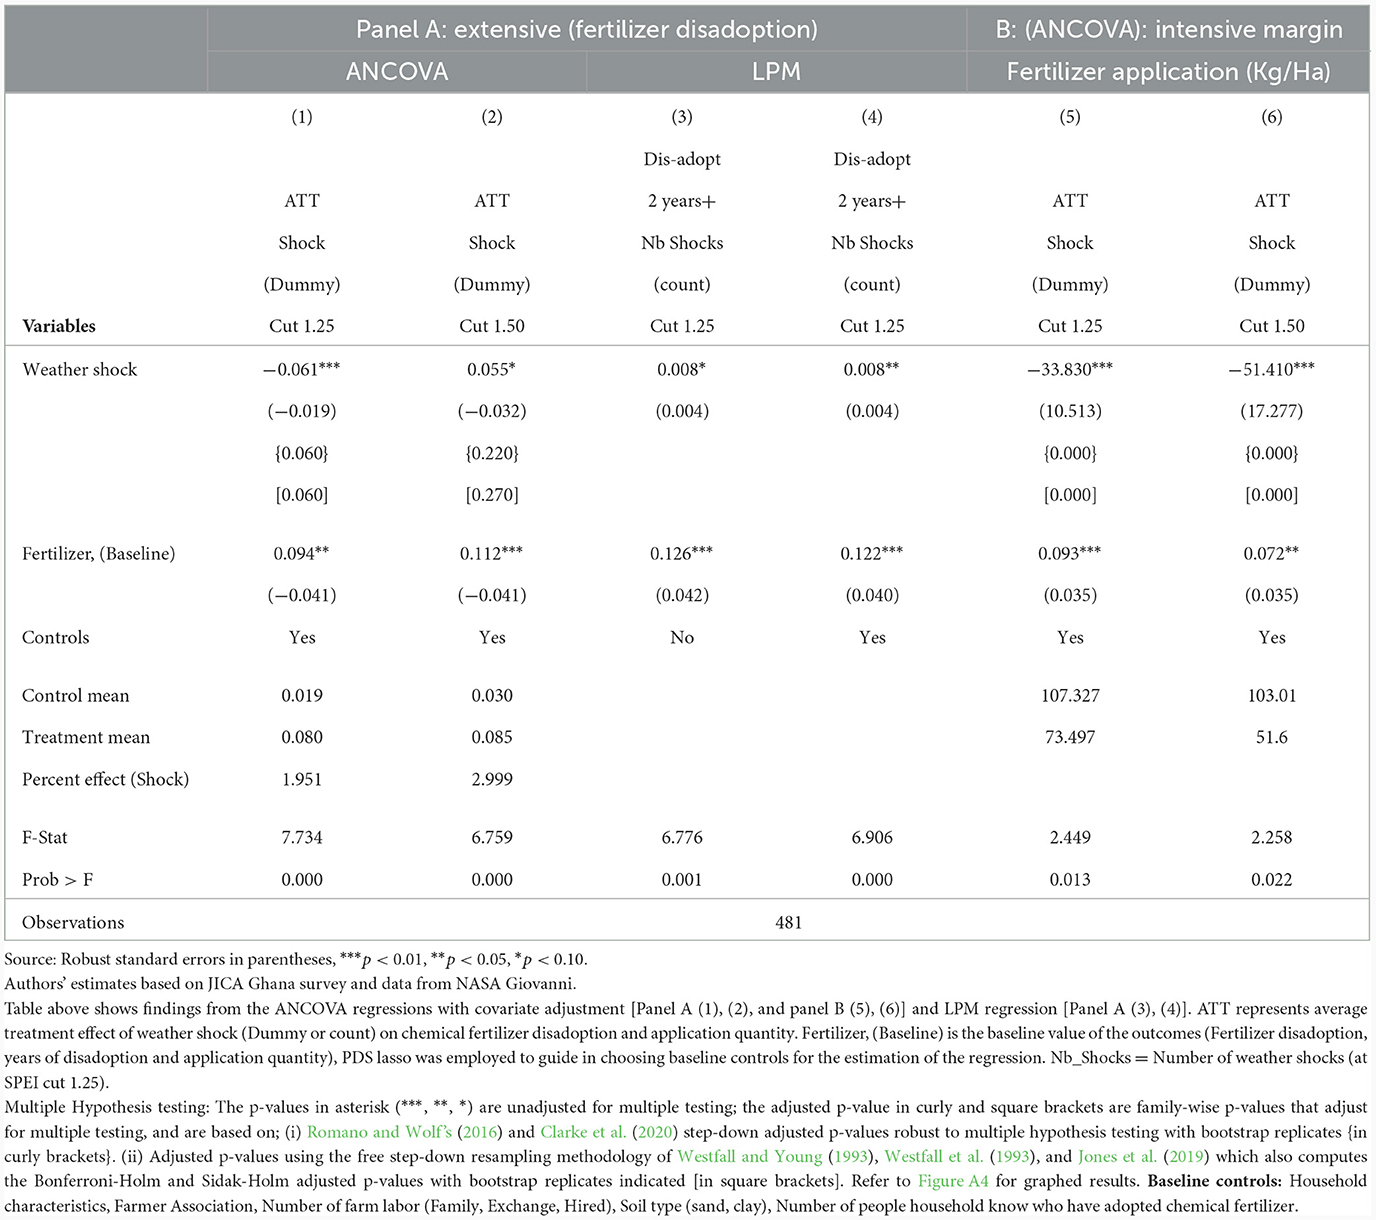
Table 5. Impact of weather shocks on chemical fertilizer disadoption and application quantity.
We delve further from the extensive to the intensive margin by estimating the impact of weather shock on application quantity (intensity) of chemical fertilizer used per hectare. The ANCOVA regression findings (detailed in Table 5, panel B) reveal a statistically significant impact of weather shocks on fertilizer application. These shocks have a notable negative effect, reducing fertilizer application intensity. Specifically, moderate, and severe weather shocks lead to a decrease in fertilizer use by 34 and 51 kilograms per hectare, respectively. Considering the typical average fertilizer application rate per hectare in the study area stands at 100 kilograms, these weather shocks result in a reduction of fertilizer application by 34 to 51 percent. This exacerbates the existing disparity between the already low average fertilizer application rate in the study zone and the recommended8 rate (ranging from 350 to 450 kilograms per hectare) for rice cultivation in the Guinea savanna zone.
4.2.2 Impact on rice input cost
In the ANCOVA findings presented in Table 6 (column 1 & 2), it is evident that weather shocks exert a statistically significant and adverse influence on investments in rice production inputs, affecting both household and village levels. Specifically, moderate, and severe weather shocks were observed to reduce farm input expenditure by approximately 156 and 173, and 153 and 184 Ghana cedis correspondingly, showcasing a notably greater impact of severe weather shocks on diminishing investments in farm inputs. Furthermore, there exists a wider disparity in the average farm input costs between different treatment groups compared to within treatment groups, underscoring the significance of external weather factors in influencing these investments at both household and village levels. Notably, while the impact of moderate weather shocks (at a 1.25 threshold) is more pronounced at the household level than at the village level, the opposite holds true for the impact of severe weather shocks (at a 1.50 threshold) on farm input costs. The prevailing weather uncertainty and shifts in climate patterns are seen to act as deterrents, discouraging farmers from making substantial investments in farm inputs, a stance supported by existing studies (Newman and Tarp, 2020; Zhou et al., 2022). These findings shed light on how farmers respond to the costs associated with farm inputs amidst weather-related uncertainties and changing climatic conditions.
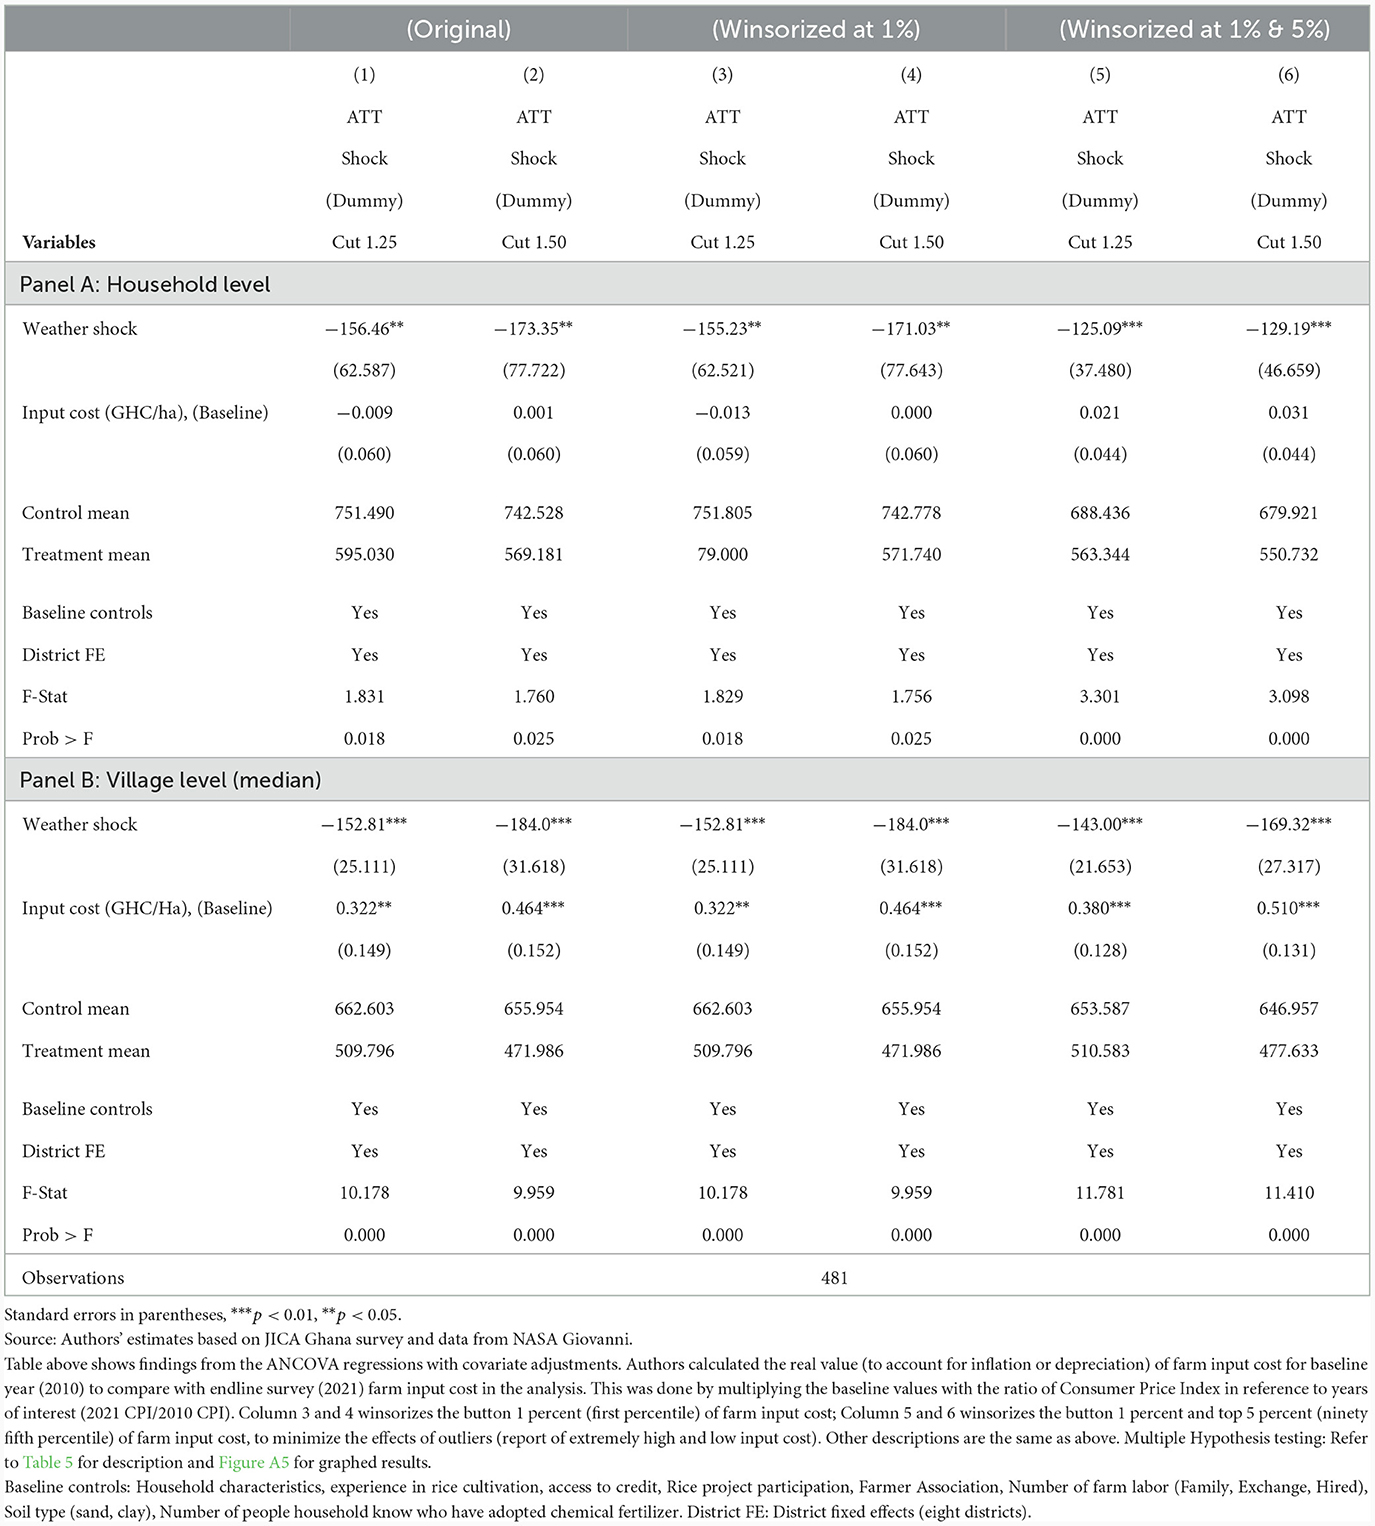
Table 6. Impact of weather shocks on rice farm input cost.
The regression outcomes in columns 3, 4, 5, and 6 of Table 6 display the impact of weather shocks on farm input costs using a combination of household and village-level data. The data underwent winsorization at the bottom 1% (first percentile) and both the bottom 1% and top 5% (ninety-fifth percentile) of observations within treatment and survey year, respectively. Even after the winsorization process (which addresses extreme outliers in reported input costs), the analysis revealed a consistently significant and negative relationship between weather shocks and farm input costs. Severe weather shocks notably amplified the adverse impact on farm input costs. This adjustment did not compromise the strength of the statistical significance, nor did it alter the direction and magnitude of the outcome coefficient.
4.2.3 Impact on rice yield
Weather shocks' influence on yield was predominantly modeled on the current year's impact, yet past shocks might indirectly affect present yield by altering the use of improved technologies. Table 7 displays the ANCOVA regression coefficients, showcasing the impact of the 2021 weather shock on rice yield.
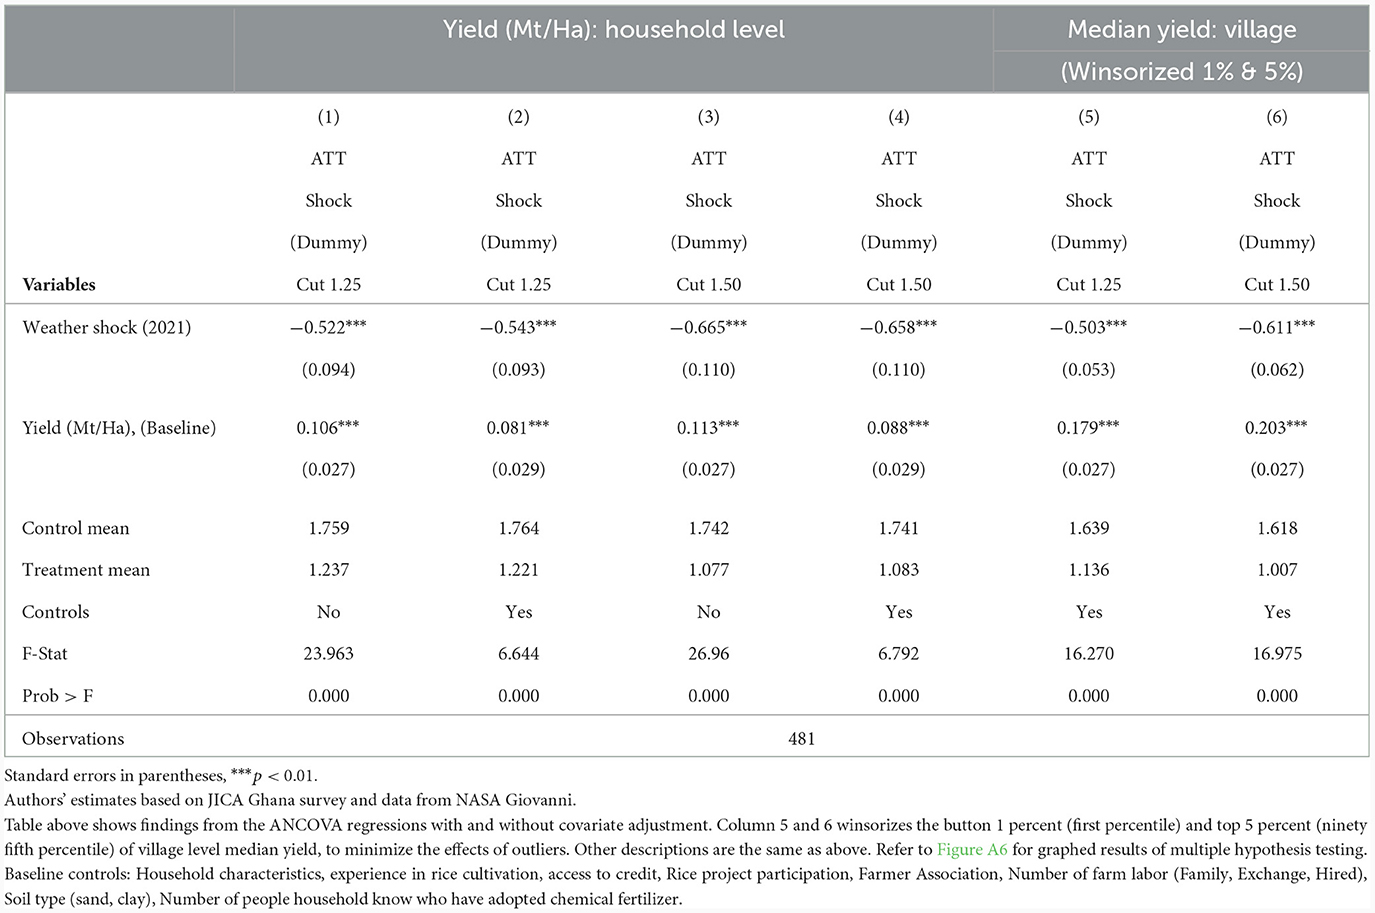
Table 7. Impact of weather shocks on rice yield.
The findings demonstrate a significant impact of this year's unexpected environmental events on rice production. The analysis revealed a clear statistical significance at the 1 percent level, indicating a notable negative effect on rice yield. Specifically, the adverse weather conditions in the current year resulted in a reduction of rice yield by 0.54 (t/ha) and 0.66 (t/ha) at the household level, and 0.50 (t/ha) and 0.61 (t/ha) at the village level for moderate and severe shocks, respectively. These findings align with existing research that underscores the detrimental influence of weather-related factors on rice output (Tossou and Arouna, 2023). When considering an average yield of approximately 1.65 (t/ha) for the sampled households, it becomes evident that weather shocks led to a significant decrease in rice yield by about 33% and 40% for moderate and severe shocks, respectively.
Notably, the average rice yield in communities subjected to these shocks (around 1.2 t/ha) was markedly lower compared to control communities (1.7 t/ha). This disparity highlights the substantial impact of weather shocks on rice production in affected areas.
4.2.4 Impact based on shock heterogeneity
We report and discuss heterogeneous impacts based on shock type (flood and drought) from the estimation of average treatment effects analysis. We estimate the impact of flood and drought for each of the outcome indicators of interest to ascertain the weight and effect posed by different weather shocks.
Figure 8 (column 3) displays the outcomes concerning the influence of flood and drought on various aspects including chemical fertilizer disadoption, application quantity, input cost, and rice yield. The impact of a flood event demonstrated notably significant effects, registering strong statistical significance at both 1% and 5% levels. It resulted in considerably larger coefficient effects in comparison to the impact of drought. Notably, the flood shock had a statistically significant and negative effect on input cost, while only the current year's drought exhibited a more substantial negative impact on rice yield, reducing it by approximately 0.63 and 0.38 tons per hectare, respectively. The findings indicate that different weather shocks lead to varying impacts on these outcomes. For a detailed breakdown, the ANCOVA table results are presented in Table A3.
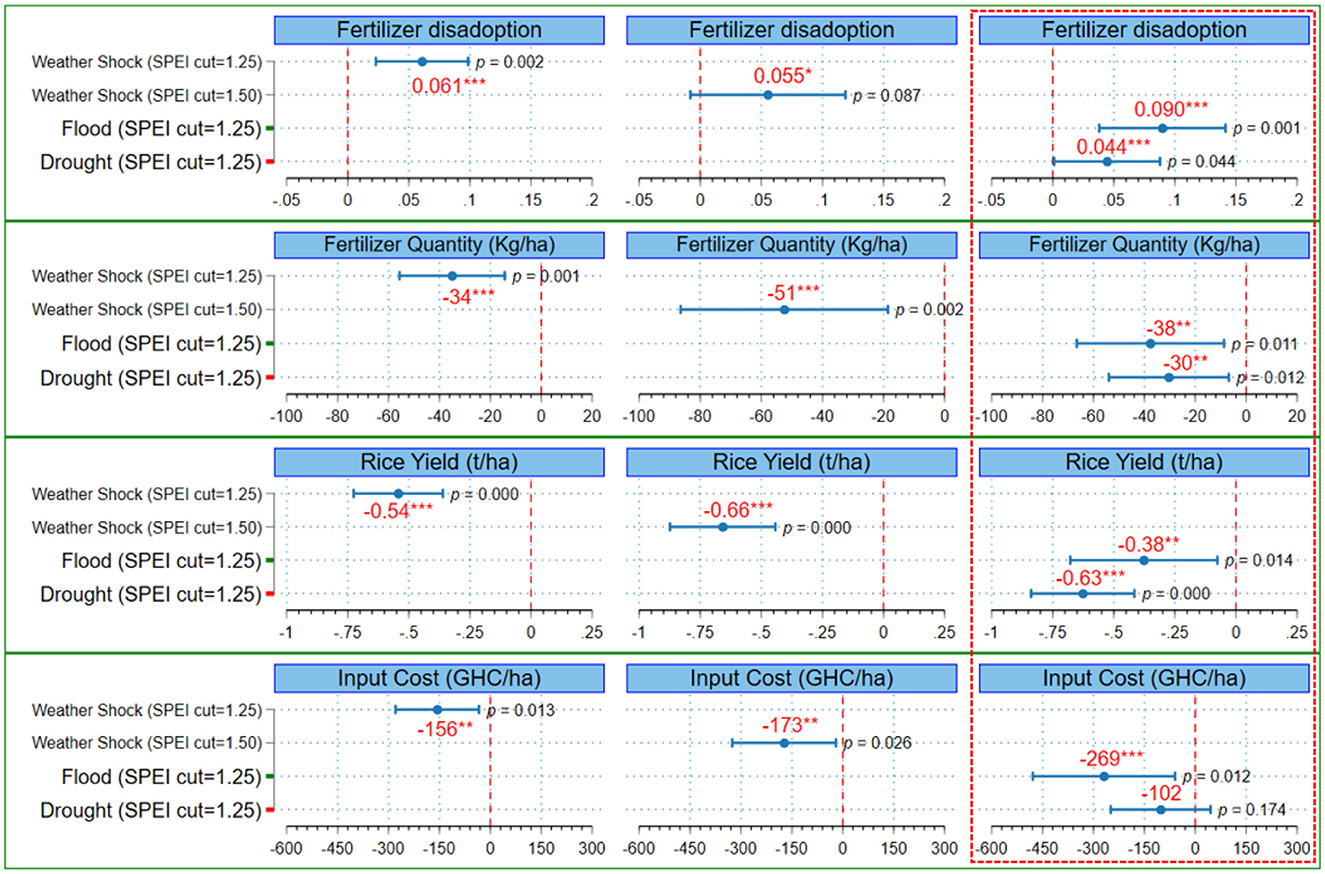
Figure 8. Impact based on shock heterogeneity. Source: Stata coefficient plot from ANCOVA regression estimates. Standard errors in parentheses, ***p < 0.01, **p < 0.05, *p < 0.1.
4.2.5 Robustness checks and heterogeneity analysis
Robustness assessments were conducted by employing a sub-sample analysis utilizing ANCOVA, specifically focusing on households with SPEI cut 1.0 (below the lowest threshold of “cut 1.25” used in the primary analysis). The results derived from this sub-sample analysis consistently maintained strong statistical significance across various outcomes (please refer to Table A4). The importance of considering diversity is underscored in studies (Makate et al., 2018; Abegunde et al., 2019) investigating agricultural investment decisions. Heterogeneity analyses were performed based on the engagement of farm households in off-farm employment (refer to Table A5). The impact of adverse weather conditions in the previous year on fertilizer disadoption and application quantity was found to be statistically significant solely for households not involved in off-farm employment. This outcome is likely attributable to the greater resilience of farm households engaged in off-farm work, as they can more readily recover from agricultural shocks due to the additional income from off-farm employment opportunities.
4.2.6 Impact mechanism
The outcomes stemming from the impact mechanism (outlined in Table C2) align closely with the empirical approach that centers on input costs and returns (yield and revenue) linked to investments. As farm investments in chemical fertilizers increase, both input costs and returns also rise. Consequently, the effect of a weather shock on investments and returns becomes more pronounced for farm households that have embraced chemical fertilizers. The disparity in yield and revenue per hectare between households exposed to weather shocks and those unexposed widens with the adoption of fertilizer. Moreover, the individuals who adopted fertilizer and faced weather shock experienced significantly lower returns. The rationale behind climate shocks diminishing agricultural investment lies in their impact on households through income fluctuations caused by variations in crop yield and revenue post-investments in rice farming. For a more detailed explanation, please refer to the Appendix.9
5 Conclusion and implications
This research examines how external weather shocks significantly increase risks for smallholder rainfed rice farmers, leading to reduced farm input usage and lower investment enthusiasm. Results highlight rising temperatures, declining rainfall, and erratic rainfall patterns in the study region in northern Ghana.
Weather shocks diminish fertilizer application, farm input costs, and rice yields. Despite this, farm households tend to scale back the intensity rather than completely cease technological investments on their farms.
Floods and severe shocks significantly affect fertilizer use and input costs more than droughts and moderate shocks do. Conversely, regarding rice yield, the impact of weather is the opposite. Also, involvement in off-farm jobs can help farm households bounce back from agricultural shocks and sustain their investments in farming. Qualitative insights with regards to understanding the reasons constraining farm investments were centered on finance, environmental and economic, with input intensive technologies like fertilizer being driven mainly by bad weather conditions (heavy rainfall, flood, drought). In agriculture, though efficient farming techniques greatly enhance output, external elements like climate and weather, beyond farmers' control, can hinder their effectiveness, potentially reducing investments and crop yields. This emphasizes the need for agricultural stakeholders to account for these factors amidst evolving environmental changes.
The engagement of farmers in off-farm employment significantly impacts their ability to maintain investments in fertilizers. Even in the face of unpredictable weather conditions, households involved in off-farm work tend to persist in using fertilizers. This underscores the importance of integrating diverse income sources, such as livestock (often overlooked in comparison to crop-focused policies in Ghana) and off-farm activities, alongside crop production in areas with a single growing season. This integrated approach offers a sustainable method for preserving farm investments during times when returns from crops alone are inadequate to support production.
Initiatives like subsidized weather insurance10 linked to specific indices and credit plans based on risk can assist farmers in managing and recovering from unexpected external shocks. These interventions not only stimulate farm investments11 but also create opportunities for sustaining the use of fertilizers. Furthermore, strategies like early warning systems, optimizing rice cultivation schedules and methods, and expanding public initiatives12 such as irrigation in areas prone to weather-related challenges can act as effective measures to moderate the impact of weather shocks. Encouraging the adoption of innovative technologies,13 particularly those aligned with climate-smart agriculture, through targeted research aimed at developing resilient crop varieties capable of withstanding climate-related stresses, can further contribute to mitigating risks associated with adverse weather conditions.
5.1 Limitation of this study
It is also worth noting that interpretation of the findings is subject to certain limitations. The results focus on rainfed smallholder rice farm households in unimodal rainfall agroecologies in the guinea savanna region of Ghana, therefore the findings do not provide a comprehensive picture of the impact on a broader region (Ghana, SSA). It is important to recognize that the choices to stop or reduce fertilizer application and farm investment are context-specific and depending on the nature of technology or farm inputs and type of climatic factors and vulnerabilities, the relationship between climatic factors and fertilizer use and farm investments may not be same.
Data availability statement
The original contributions presented in the study are included in the article/Supplementary material, further inquiries can be directed to the corresponding author.
Author contributions
DA: Conceptualization, Data curation, Formal analysis, Investigation, Methodology, Software, Supervision, Validation, Visualization, Writing—original draft, Writing—review & editing. JAA: Conceptualization, Investigation, Methodology, Project administration, Supervision, Validation, Writing—original draft, Writing—review & editing. TS: Conceptualization, Data curation, Formal analysis, Investigation, Methodology, Project administration, Resources, Software, Supervision, Validation, Visualization, Writing—original draft, Writing—review & editing.
Funding
The author(s) declare that no financial support was received for the research, authorship, and/or publication of this article.
Conflict of interest
The authors declare that the research was conducted in the absence of any commercial or financial relationships that could be construed as a potential conflict of interest.
Publisher's note
All claims expressed in this article are solely those of the authors and do not necessarily represent those of their affiliated organizations, or those of the publisher, the editors and the reviewers. Any product that may be evaluated in this article, or claim that may be made by its manufacturer, is not guaranteed or endorsed by the publisher.
Supplementary material
The Supplementary Material for this article can be found online at: https://www.frontiersin.org/articles/10.3389/frevc.2024.1360513/full#supplementary-material
Footnotes
1. ^Refer to World Bank Group (2023): Moreover, there has been a 13 percent increase in the average number of hot days, and the wet season is expected to bring more erratic and intense rainfall in the coming decades, accompanied by reduced overall precipitation levels (Fahad et al., 2019; World Bank Group, 2023), for details on “climate change in Ghana (1950–2020)”. Changes in distribution of precipitation, mean temperature, annual precipitation and mean temperature trend per decade, maximum number of consecutive dry days and days with heat index above 35 degrees Celsius per decade, minimum and maximum temperature trends per decade. Climate risk country profile, Ghana, https://climateknowledgeportal.worldbank.org/country/ghana/trends-variability-historical (accessed May 2023).
2. ^Rainfall during the rice cropping season has decreased and become more uneven and temperatures are increasing in trend in the recent decade compared to the last 30 and 40 years. Refer to Figures 5, 6 for details on climate change in study area (1982–2021): Total annual cropping season rainfall (Figure 5) and cropping season rainfall and temperature distribution (Figure 6).
3. ^The Savanna agroecological zone of Ghana is part of the food basket hub of Ghana and known to be highly vulnerable to climate and ecological changes due to their semi-arid climate and physical characteristics. The limited availability of water and nutrients makes the zone highly fragile and prone to poverty (Aniah et al., 2019).
4. ^LRDP was implemented in Northern Ghana. The project, spanned from 1998 to 2003, was funded by the Agence Francaise de Development (AFD) of France in collaboration with the Ministry of Food and Agriculture (MOFA) of Ghana. The objective of the project was to enhance rice production through the adoption of improved rice production innovations. Promoted the adoption of modern seed varieties and chemical fertilizer application, water, and soil management practices such as bunding and leveling, sowing by planting in line and dibbling for efficient use of seeds and also facilitates easy weed control.
5. ^Appendix C: 2. Description of household panel data.
6. ^Appendix C: SPEI computation and categorization.
7. ^Table A1 reasons for non-adoption and disadoption of technologies.
8. ^Fertilizer recommendation and new fertilizer blends for agroecological zones in Ghana by the Ministry of Food and Agriculture, Ghana (for details: https://mofa.gov.gh/site/media-centre/agricultural-articles/324-new-fertilizer-blends-the-way-for-ghana-2) and by Ragasa et al. (2013).
9. ^Appendix C: 3. Mechanism
10. ^The challenges of implementing agricultural insurance, considering both supply-side and demand-side constraints, should not be overlooked but acknowledged with caution. Challenges of creating agricultural insurance products that are both economically viable and environmentally sustainable is emphasized in studies (Cole et al., 2013; Carter et al., 2017).
11. ^Insurance provision to risk averse farmers results in substantial increases in agricultural investments (Hill and Viceisza, 2012; Karlan et al., 2014; Jensen et al., 2017).
12. ^Public production investment acts as a buffer against climate shocks for farmer agricultural production investment by mitigating their negative effects on yield and farm investment (Zhou et al., 2022).
13. ^The adoption of a new weather-risk-reducing technology leads to changes in input choices among rice farmers, resulting in increased productivity (Emerick et al., 2016).
References
Abegunde, V. O., Sibanda, M., and Obi, A. (2019). The dynamics of climate change adaptation in sub-Saharan Africa: a review of climate-smart agriculture among small-scale farmers. Climate 7, 11. doi: 10.3390/cli7110132
Abel, K. K. B., Samuel, A. D., and Michael, A. (2014). Improved rice variety adoption and its effects on farmers output in Ghana. J. Dev. Agric. Econ. 6, 242–248. doi: 10.5897/JDAE2013.0544
Adjao, R. T., and Staatz, J. M. (2015). Asian rice economy changes and implications for sub-Saharan Africa. Global Food Secur. 5, 50–55. doi: 10.1016/j.gfs.2014.11.002
AGRA (2020). Opportunity to Influence and Impact Policy on Mechanisation, and Infrastructure Delivery for Rice Production. Ghana: AGRA.
Alem, Y., Bezabih, M., Kassie, M., and Zikhali, P. (2010). Does fertilizer use respond to rainfall variability? Panel data evidence from Ethiopia. Agricult. Econ. 41, 165–175. doi: 10.1111/j.1574-0862.2009.00436.x
Aniah, P., Kaunza-Nu-Dem, M. K., and Ayembilla, J. A. (2019). Smallholder farmers' livelihood adaptation to climate variability and ecological changes in the savanna agro ecological zone of Ghana. Heliyon 5, e01492. doi: 10.1016/j.heliyon.2019.e01492
Anik, A. R., Begho, T., Sharna, S. C., Eory, V., and Md. Rahman, M. (2022). Toward improving nitrogen use efficiency in rice production: the socio-economic, climatic and technological determinants of briquette urea adoption. Renew. Agricult. Food Syst. 37, 417–428. doi: 10.1017/S1742170522000060
Arouna, A., Fatognon, I. A., Saito, K., and Futakuchi, K. (2021). Moving toward rice self-sufficiency in sub-Saharan Africa by 2030: lessons learned from 10 years of the Coalition for African Rice Development. World Dev Perspect. 21, 100291. doi: 10.1016/j.wdp.2021.100291
Arouna, A., Lokossou, J. C., Wopereis, M. C. S., Bruce-Oliver, S., and Roy-Macauley, H. (2017). Contribution of improved rice varieties to poverty reduction and food security in sub-Saharan Africa. Global Food Secur. 14, 54–60. doi: 10.1016/j.gfs.2017.03.001
Arslan, A., Belotti, F., and Lipper, L. (2017). Smallholder productivity and weather shocks: Adoption and impact of widely promoted agricultural practices in Tanzania. Food Policy. 69, 68–81. doi: 10.1016/j.foodpol.2017.03.005
Beguería, S., and Vicente-Serrano, S. M. (2024). Calculation of the Standardized Precipitation-Evapotranspiration IndexPackage 'SPEI.' Available online at: https://spei.csic.es, https://github.com/sbegueria/SPEI (accessed January 27, 2024).
Bharwani, S., Bithell, M., Downing, T. E., New, M., Washington, R., and Ziervogel, G. (2020). Farmer forecasts: impacts of seasonal rainfall expectations on agricultural decision-making in Sub-Saharan Africa. Clim. Risk Manag. 30, 100247. doi: 10.1016/j.crm.2020.100247
Bora, K. (2022). Rainfall shocks and fertilizer use: a district level study of India. Environ. Dev. Econ. 27, 556–577. doi: 10.1017/S1355770X21000413
Carter, M., de Janvry, A., Sadoulet, E., and Sarris, A. (2017). Index insurance for developing country agriculture: a reassessment. Annu. Rev. Resour. Econ. 9, 421–438. doi: 10.1146/annurev-resource-100516-053352
Clarke, D., Romano, J. P., and Wolf, M. (2020). The Romano–Wolf multiple-hypothesis correction in Stata. The Stata J. 20, 812–843. doi: 10.1177/1536867X20976314
Cole, S., Giné, X, Tobacman, J., Topalova, P., Townsend, R., and Vickery, J. (2013). Barriers to household risk management: evidence from India. Am. Econ. J. Appl. Econ. 5, 104–135. doi: 10.1257/app.5.1.104
deGraft-Johnson, M., Suzuki, A., Sakurai, T., and Otsuka, K. (2014). On the transferability of the Asian rice green revolution to rainfed areas in sub-Saharan Africa: An assessment of technology intervention in Northern Ghana. Agricult. Econ. (United Kingdom). 45, 555–570. doi: 10.1111/agec.12106
do Nascimento, L. A., Abhilasha, A., Singh, J., Elias, M. C., and Colussi, R. (2022). Rice germination and its impact on technological and nutritional properties: a review. Rice Sci. 29, 201–215. doi: 10.1016/j.rsci.2022.01.009
Emerick, K., De Janvry, A., Sadoulet, E., and Dar, M. H. (2016). Technological innovations, downside risk, and the modernization of agriculture. Am. Econ. Rev. 106, 1537–1561. doi: 10.1257/aer.20150474
Fahad, S., Adnan, M., Noor, M., Arif, M., Alam, M., Khan, I., et al. (2019). Major constraints for global rice production. Adv. Rice Res. Abiotic Stress Toler. 2019, 1–22. doi: 10.1016/B978-0-12-814332-2.00001-0
FAO (2015). FAO Statistical Pocketbook 2015 : World Food and Agriculture. Rome: Food and Agriculture Organization (FAO).
Gelo, D. (2022). Rainfall variability and alternative technology adoption: evidence from Ethiopia. Agrekon 61, 3. doi: 10.1080/03031853.2022.2073242
GSS (2019). Rebased 2013-2018 Annual Gross Domestic Product. Accra: GSS. Available online at: www.statsghana.gov.gh (accessed January 27, 2024).
Hassen, S. (2015). “Disadoption, substitutability, and complementarity of agricultural technologies: a random effects multivariate probit analysis,” in Environment for Development Discussion Paper-Resources for the Future (RFF) 2015 No.15-26. Available online at: https://media.rff.org/documents/EfD-DP-15-26.pdf (accessed January 27, 2024).
He, W., Wang, L., Lin, Q., and Yu, F. (2021). Rice seed storage proteins: biosynthetic pathways and the effects of environmental factors. J. Integr. Plant Biol. 63, 1999–2019. doi: 10.1111/jipb.13176
Hill, R. V., and Viceisza, A. (2012). A field experiment on the impact of weather shocks and insurance on risky investment. Exp Econ. 15, 341–371. doi: 10.1007/s10683-011-9303-7
Issahaku, G., and Abdulai, A. (2020). Adoption of climate-smart practices and its impact on farm performance and risk exposure among smallholder farmers in Ghana. Aust. J. Agricult. Res. Econ. 64, 396–420. doi: 10.1111/1467-8489.12357
Jensen, N. D., Barrett, C. B., and Mude, A. G. (2017). Cash transfers and index insurance: a comparative impact analysis from northern Kenya. J. Dev. Econ. 129, 14–28. doi: 10.1016/j.jdeveco.2017.08.002
Jones, D., Molitor, D., and Reif, J. (2019). What do workplace wellness programs do? evidence from the Illinois workplace wellness study. Quart. J. Econ. 134, 1747–1791. doi: 10.1093/qje/qjz023
Karlan, D., Osei, R., Osei-Akoto, I., and Udry, C. (2014). Agricultural decisions after relaxing credit and risk constraints. Quart. J. Econ. 129, 2, doi: 10.1093/qje/qju002
Laajaj, R., and Macours, K. (2023). Measuring skills in developing countries. J. Human Resourc. 56, 1254–1295. doi: 10.3368/jhr.56.4.1018-9805R1
Lachaud, M. A., Bravo-Ureta, B. E., and Ludena, C. E. (2022). Economic effects of climate change on agricultural production and productivity in Latin America and the Caribbean (LAC). Agricult. Econ. (United Kingdom). 53, 321–332. doi: 10.1111/agec.12682
Lobell, D. B., Burke, M. B., Tebaldi, C., Mastrandrea, M. D., Falcon, W. P., and Naylor, R. L. (2008). Prioritizing climate change adaptation needs for food security in 2030. Science 319, 607–610. doi: 10.1126/science.1152339
Makate, C., Makate, M., and Mango, N. (2018). Farm household typology and adoption of climate-smart agriculture practices in smallholder farming systems of southern Africa. Afric. J. Sci. Technol. Innovat. Dev. 10, 4. doi: 10.1080/20421338.2018.1471027
Mall, R. K., and Aggarwal, P. K. (2002). Climate change and rice yields in diverse agro-environments of India. I. Evaluation of impact assessment models. Clim. Change 52, 315–330. doi: 10.1023/A:1013702105870
Marenya, P. P., Gebremariam, G., Jaleta, M., and Rahut, D. B. (2020). Sustainable intensification among smallholder maize farmers in Ethiopia: adoption and impacts under rainfall and unobserved heterogeneity. Food Policy 95, 101941. doi: 10.1016/j.foodpol.2020.101941
McCarthy, N., Kilic, T., Brubaker, J., Murray, S., and De La Fuente, A. (2021). Droughts and floods in Malawi: impacts on crop production and the performance of sustainable land management practices under weather extremes. Environ. Dev. Econ. 26, 432–449. doi: 10.1017/S1355770X20000455
McKenzie, D. (2012). Beyond baseline and follow-up: The case for more T in experiments. J. Dev. Econ. 99, 2, doi: 10.1016/j.jdeveco.2012.01.002
Michalscheck, M., Groot, C. J. J., Kotu, B., Hoeschle-Zeledon, I., Kuivanen, K., Descheemaeker, K., et al. (2018). Model results versus farmer realities. Operationalizing diversity within and among smallholder farm systems for a nuanced impact assessment of technology packages. Agric. Syst. 162, 64–178. doi: 10.1016/j.agsy.2018.01.028
Newman, C., and Tarp, F. (2020). Shocks and agricultural investment decisions. Food Policy. 94, 101810. doi: 10.1016/j.foodpol.2019.101810
OECD/FAO (2021). “OECD-FAO Agricultural Outlook 2021-2030,” in OECD-FAO Agricultural Outlook. Paris: OECD Publishing.
Ouédraogo, S. A., Bockel, L., Abedi, A., Arouna, A., and Gopal, P. (2021). Rice Value Chain in Ghana – Prospective Analysis and Strategies for Sustainable and Pro-Poor Growth. Accra: Food and Agricultural Organization of United Nations
Ragasa, C., and Chapoto, A. (2017). Limits to green revolution in rice in Africa: the case of Ghana. Land Use Policy 66, 304–321. doi: 10.1016/j.landusepol.2017.04.052
Ragasa, C., Dankyi, A., Acheampong, P., Wiredu, A. N., Chapoto, A., Asamoah, M., et al. (2013). Patterns of Adoption of Improved Rice Technologies in Ghana. Int. Food Policy Res. Instit. Work. Paper 35, 6–35.
Romano, J. P., and Wolf, M. (2016). Efficient computation of adjusted p-values for resampling-based stepdown multiple testing. Stat. Probab. Lett. 113, 38–40. doi: 10.1016/j.spl.2016.02.012
Sesmero, J., Ricker-Gilbert, J., and Cook, A. (2018). How do african farm households respond to changes in current and past weather patterns? A structural panel data analysis from Malawi. Am. J. Agric. Econ. 100, 1. doi: 10.1093/ajae/aax068
Stuecker, M. F., Tigchelaar, M., and Kantar, M. B. (2018). Climate variability impacts on rice production in the Philippines. PLoS ONE 13, e0201426. doi: 10.1371/journal.pone.0201426
Sun, Q., Zhao, Y., Zhang, Y., Chen, S., Ying, Q., Lv, Z., et al. (2022). Heat stress may cause a significant reduction of rice yield in China under future climate scenarios. Sci. Total Environm. 818, 151746. doi: 10.1016/j.scitotenv.2021.151746
Tjernström, E. (2017). Learning from Others in Heterogeneous Environments. Available online at: https://api.semanticscholar.org/CorpusID:53489813 (accessed January 27, 2024).
Tossou, D. A., and Arouna, A. (2023). Dynamic (dis)adoption of smallholder climate-smart agriculture in Sub-Saharan Africa: case study of the Smart-Valley rice technology in Benin. Soc. Sci. Res. Netw. 2023, 1–76. doi: 10.2139/ssrn.4446496
USDA (2023). United States Department of Agriculture (USDA). USDA, PSD. Available online at: https://apps.fas.usda.gov/psdonline/app/index.html#/app/downloads (accessed November 10, 2023).
van Oort, P. A. J., and Zwart, S. J. (2018). Impacts of climate change on rice production in Africa and causes of simulated yield changes. Glob. Chang. Biol. 24, 1029–1045. doi: 10.1111/gcb.13967
Vicente-Serrano, S. M., and Beguería, S. (2016). Comment on ‘Candidate distributions for climatological drought indices (SPI and SPEI)' by James H. Stagge et al. Int. J. Climatol. 36, 2120–2131. doi: 10.1002/joc.4474
Vicente-Serrano, S. M., Beguería, S., and López-Moreno, J. I. (2010). A multiscalar drought index sensitive to global warming: the standardized precipitation evapotranspiration index. J Clim. 23, 1696–1718. doi: 10.1175/2009JCLI2909.1
Westfall, P. H., and Young, S. S. (1993). Resampling-based multiple testing: Examples and methods for p-value adjustment. New York: John Wiley and Sons, INC, 279.
Westfall, P. H., Young, S. S., and Wright, S. P. (1993). On adjusting P-values for multiplicity. Biometrics 49, 941. doi: 10.2307/2532216
World Bank Group (2023). Ghana - Trends and Variability - Historical | Climate Change Knowledge Portal. Washington, D.C.: World Bank Group. Available online at: https://climateknowledgeportal.worldbank.org/country/ghana/trends-variability-historical (accessed June 14, 2023).
Xinkang, L., Chunmin, G., Lin, W., Liting, J., Xiangjin, F., Qinlu, L., et al. (2023). Rice storage proteins: focus on composition, distribution, genetic improvement and effects on rice quality. Rice Sci. 30, 207–221. doi: 10.1016/j.rsci.2023.03.005
Zakaria, A., Alhassan, S. I., Kuwornu, J. K. M., Azumah, S. B., and Derkyi, M. A. A. (2020). Factors influencing the adoption of climate-smart agricultural technologies among rice farmers in Northern Ghana. Earth Syst. Environm. 4, 257–271. doi: 10.1007/s41748-020-00146-w
Keywords: impact, weather shocks, fertilizer usage, farm input investment, rice yield, northern Ghana
Citation: Atinga D, Awuni JA and Sakurai T (2024) Analyzing the effect of severe weather on farmers' fertilizer usage and input investment amidst decreasing productivity in single-season agroecosystems. Front. Environ. Econ. 3:1360513. doi: 10.3389/frevc.2024.1360513
Received: 23 December 2023; Accepted: 17 January 2024;
Published: 09 February 2024.
Edited by:
Michele Moretti, University of Pisa, ItalyReviewed by:
Oybek Norboev, University of Pisa, ItalyVictor Manyong, International Institute of Tropical Agriculture, Tanzania
Copyright © 2024 Atinga, Awuni and Sakurai. This is an open-access article distributed under the terms of the Creative Commons Attribution License (CC BY). The use, distribution or reproduction in other forums is permitted, provided the original author(s) and the copyright owner(s) are credited and that the original publication in this journal is cited, in accordance with accepted academic practice. No use, distribution or reproduction is permitted which does not comply with these terms.
*Correspondence: David Atinga, YXRpbmdhZEBnbWFpbC5jb20=