- 1School of Economics and Research laboratory on Socio-Economic and Environmental Sustainability (ReSEES), Athens University of Economics and Business, Athens, Greece
- 2Department of Technology, Management and Economics, Denmark Technical University (DTU), Kongens Lyngby, Denmark
- 3Sustainable Development Unit, Athena Research Center, Marousi, Greece
- 4Academia Europea, London, United Kingdom
- 5Department of Economics, University of Thessaly, Volos, Greece
- 6Research laboratory on Socio-Economic and Environmental Sustainability (ReSEES), Athens University of Economics and Business, Athens, Greece
- 7Visiting Faculty, India Institute of Management Rohtak, Rohtak, India
- 8Department of Economics, University of Piraeus, Piraeus, Greece
- 9Department of Economic and Regional Growth, Panteion University of Social and Political Sciences, Athens, Greece
- 10Department of Economics and Business, University of Ferrara, Ferrara, Italy
This paper refers to the valuation of European, Marine and Fresh Water Ecosystem Services. Using a meta-regression approach, we estimate the Annual Willingness to Pay (WTP) for several classifications of the ecosystem services and various biogeographical and marine regions across all 27 EU markets. Moreover, we explore the correlation between WTP and the national level of achievement of the 17 SDGs, with particular focus on SDG 14—Life Below Water. Results indicate that regulating services of marine and freshwater ecosystems are ranked high and that in almost 63% of the European countries, the WTP for the improvement of the marine and freshwater ecosystem is high and exceeds estimates for terrestrial ecosystems. Valuing ecosystem services and link them to the Sustainable Development Goals, we find that marine ecosystems are mainly positively correlated to SDGs 2, 12, 13, 14, and 17, while a high MWTP value is assigned to specific SDG14 individual indicators like fish caught from overexploited or collapsed stocks and fish caught that are then discarded. Overall, results indicate that societies attributing greater value to ecosystem services mark greater progress toward the implementation of SDGs and SDG 14 in particular.
Introduction
The significance of natural capital is an indisputable fact. Natural capital can be considered as a stock in nature that provides a flow of benefits for people and the economy. The goods and services that natural capital give, such as food, water, shelter, or climate regulation, are called ecosystem services and they underpin healthy lives and economic activity (HM Treasury, 2020). However, increasing pressures from climate change and biodiversity loss cause serious degradation in the provision of these services placing considerable challenges and risks for humans and businesses. This interaction between human, produced and natural capital is depicted in Figure 1. The figure underlines that natural capital, which is often neglected in economic analyses, serves as a catalyst for production as well as human capital through the provision, regulation, and preservation of ecosystem services.
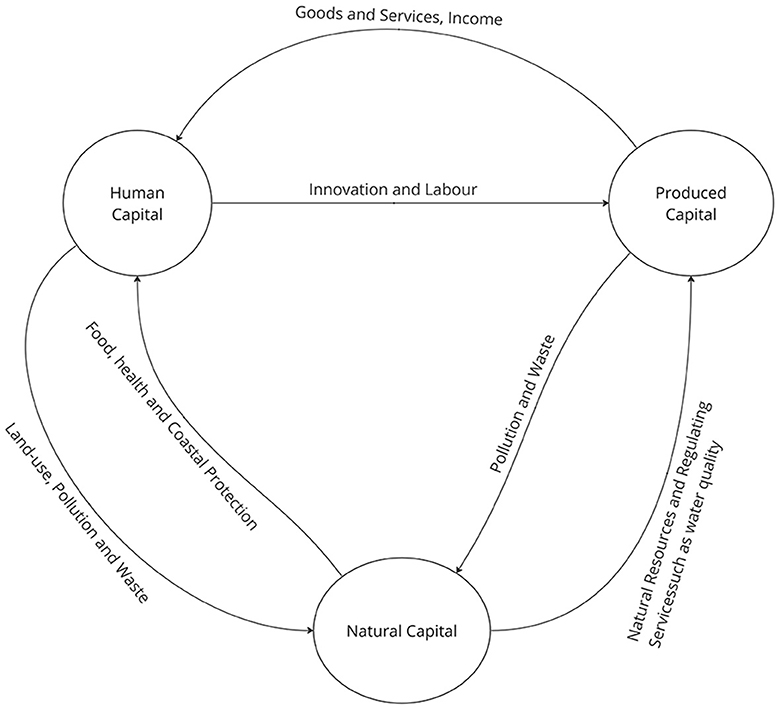
Figure 1. The relationship between different types of capital. Source: Dasgupta (2021).
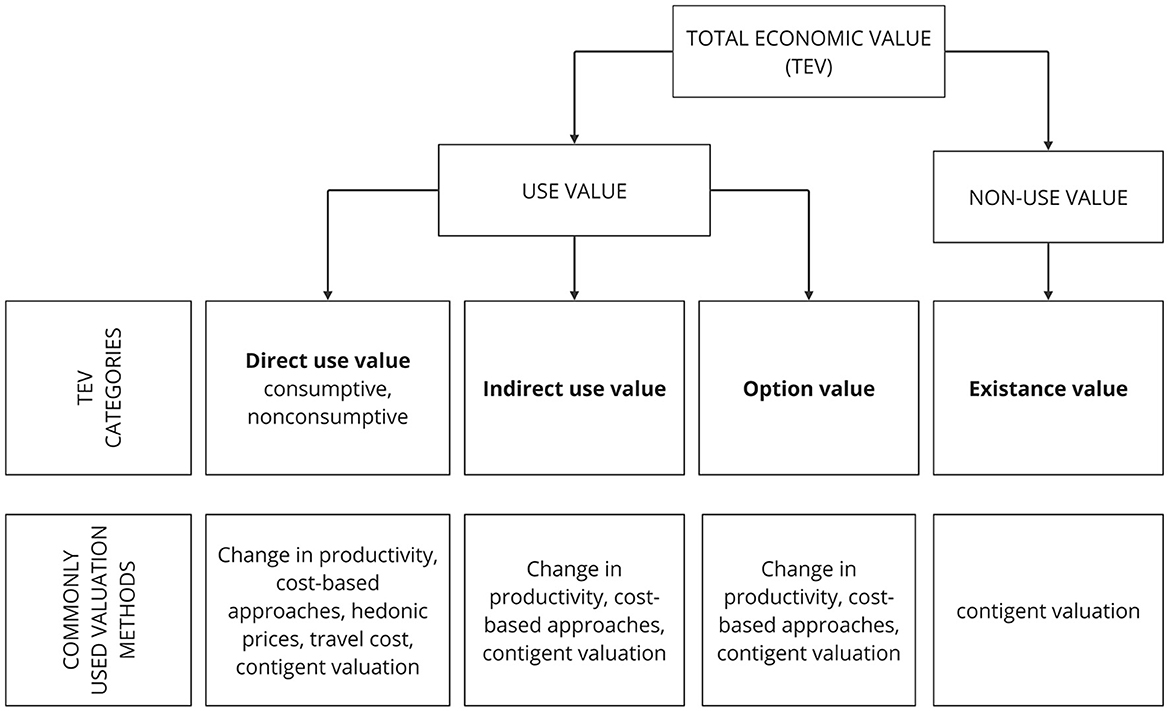
People derive economic value from natural resources and the environment, which may not be revealed in the markets. Total Economic Value (TEV) is composed of the use and non-use value. A resource's use value might be either a market value, such as minerals, wood, water and other goods, or a non-market value, such as outdoor recreation, landscape amenity, and many others. An example of non-use values can be the importance people attach to specific habitats or species. Despite the obvious importance of ecosystem service values, policy makers often ignore the value of environmental goods and services and their economic and social benefits due to the so-called market failures. And since many ecosystem services are not traded in the markets, they do not have a price. TEV represents the total benefit in wellbeing from a policy, which is the sum of the people's willingness to pay (WTP) and their willingness to accept the policy (WTA).
Thus, it is important to value ecosystem services because it helps people (and, more importantly policymakers) make informed decisions. Valuing ecosystem services ensures that policy decisions consider the costs and benefits of the natural environment and the implications for human wellbeing while helping policymakers pursue alternative policies. Indeed, the term “ecosystem services” indicates the link between natural capital and the economy, which corresponds to the utility people derive from exploiting ecosystems.
So far, metrics like the Gross Domestic Product (GDP) or even the UN Human Development Index (HDI) measure only economic progress and human wellbeing in the case of HDI, failing to corroborate benefits, such as pollination, regulation, and nature's ability to mitigate disasters. This incapability to account for the total economic value of ecosystems jointly with the vicious cycle of overproduction and overexploitation, has significantly influenced ecosystem services degradation, jeopardizing the present and the future possibility of growth and prosperity. Consequently, incorporating the economic value of ecosystem services in the mainstream public and private decision-making is pivotal to invert ecosystems degradation.
The main objective of this paper is to identify the relationship between ecosystem services and the progress of SDGs for EU countries. In this line, we estimate Marginal Willingness to Pay for an array of Ecosystem Services using Meta-regression analytical techniques using an up-to-date database covering empirical studies from 2012 to 2022. The results are summarized and allocated by country of reference and are cross-referenced with SDG metrics from the UN SDSN database. This process allows us to map out correlations between the valuation of ecosystem services and the progress toward the SDGs for each EU economy. The exercise is carried out both for the broad 17 SDG indicators as well as for the sub-indicators of SDG 14 (Life below water). The main research question is whether societies that attribute greater value to ecosystem services show greater compliance with the Agenda 2030 through the implementation of the SDGs and to identify which of these goals are closely related to a pronounced valuation of ecosystem services.
Theoretical background
Ecosystem services
The productivity of natural capital derives from its quality and quantity, in other words, its biodiversity. Therefore, maintaining the stock of this capital constant allows the provision of flows of ecosystem services which depends on human present and future prosperity (TEEB, 2010).
Ecosystem services (ES) are final products or results that directly and indirectly affect human wellbeing, and these factors can work well with an economic strategy. According to Daily (1997), ES are “The conditions and processes through which natural ecosystems, and the species that make them up, sustain and fulfill human life,” whereas Costanza et al. (1997) postulate that they are “Benefits human populations derive, directly or indirectly, from ecosystem functions.”
The main reason for valuing ecosystem services is that it will help people make informed decisions. It will make sure that policy decisions consider the costs and benefits of the natural environment and the implications for human wellbeing while giving policymakers new ideas. Indeed, the term “ecosystem services” indicates the link between natural capital and the economy, which corresponds to the utility people derive from exploiting ecosystems.
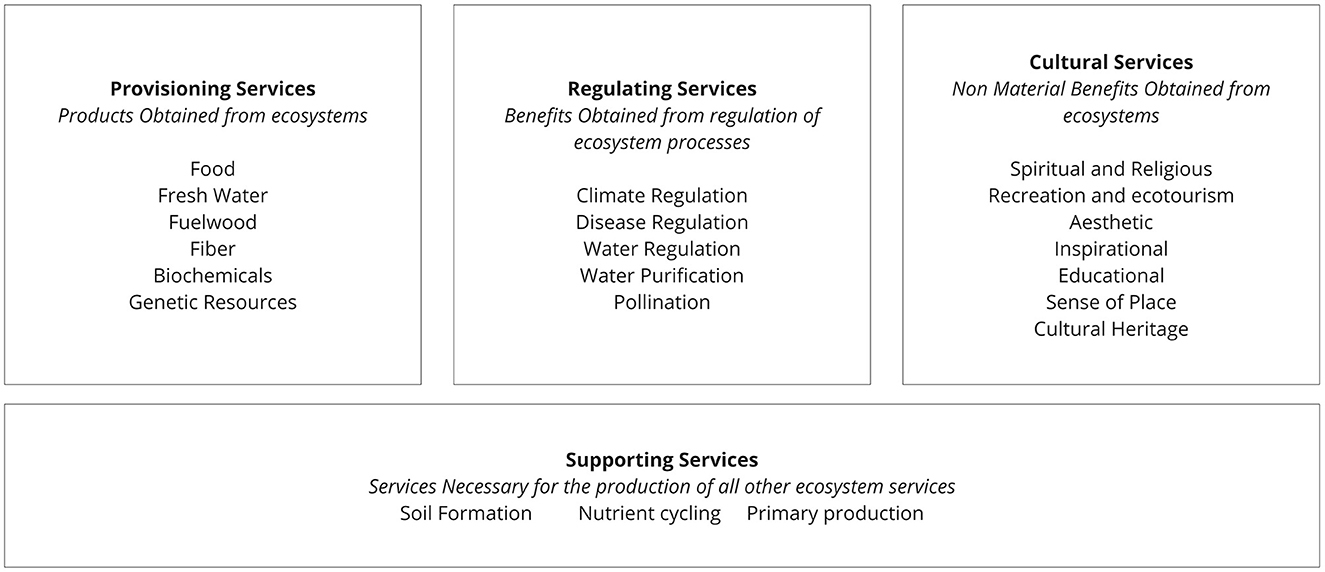
The Millennium Ecosystem Assessment (MA, 2005)1 has recognized four categories of ecosystem services. Figure 2 outlines these categories and the respective sub-categories:
• Provisioning services: products obtained from ecosystems, e.g., water, food, and fiber.
• Regulating services: benefits guaranteed by the regulation of ecosystem processes, e.g., climate regulation, water regulation, and pollination.
• Cultural services: non-material benefits derived from ecosystems, e.g., recreation, aesthetic, spiritual and religious, and cultural heritage.
• Supporting services: services needed to produce all the other ecosystem services, e.g., nutrient cycling, soil formation, and primary production.
In the context of ecosystem services of water and marine resources, which are closely related to the progress on Sustainable Development Goal 14 (henceforth SDG14), ecosystem services include climate regulation; disturbance prevention (storm protection and flood prevention); water regulation (e.g., land cover, regulation of runoff, river discharge); water supply; waste treatment; aesthetic features; recreational uses; cultural, artistic, spiritual, historic, scientific, and educational values.
So far, only a tiny fraction of products offered by nature are considered in current metrics that measure economic progress (GDP) and human wellbeing (Human Development Index), as highlighted by Dasgupta (2021). Moreover, other benefits, such as pollination, regulation, and nature's ability to mitigate disasters, have failed to be captured. This incapability to account for the total economic values of ecosystems and biodiversity, jointly with the intense pace of economic activity, has significantly influenced their degradation.
Valuation of ecosystem services
Assigning a value on ecosystem services is the last step in a long and often detailed study of how a policy change will affect them. Based on the type of ecosystem service and the amount and quality of data that can be used to value it, the suitable valuation method will be chosen. Ecosystem Services are of grave importance, primarily because they create value for humans. Total Economic Value (TEV) encompasses all channels through which ES contribute to tangible and intangible benefits and enhance wellbeing. Figure 3 presents the broader value categories, considering both the use and non-use values that people and society gain or lose from small changes in ecosystem services. Because many ecosystem services are not traded in markets, they do not have a price. So, to figure out how much these goods or services are worth, you need to use non-market valuation methods. Use value arises from the direct exploitation of ES for human wellbeing and includes: (i) direct use value, whereby humans deliberately use the ecosystem, for example, for nutrition, irrigation, timber etc. (ii) indirect use value, whereby the benefits accrue to humans without the immediate use of environmental resources, as is the case water regulation and (iii) option value, which describes the knowledge that humans are able to extract a direct or indirect use value in the future, hence it is the value attributed to preserving environmental resources. Finally, non-use value is based on the premise that acknowledging the existence of ES is of value to human beings.
The concept of TEV was introduced to ecological economics literature by Pearce and Turner (1991) and has been gaining traction ever since. Turner et al. (2003) underscore the importance of eliciting economic value of environmental resources in order to shape and implement sound economic policies that consider sustainability repercussions. It is important, according to the authors, to evaluate the marginal effect of a shift in ecosystem services as a trade-off with economic variables that people value. Having said that, they underscore the limitations of the TEV approach as they recognize that it is marginal values rather than “stock” values of ecosystem services that matter for policy decisions. In addition they note the potential problems that arise from spatial transfer of site-specific study results, the possibility of double counting ecosystem sites and differences in the time preferences of stakeholders (short-term vs. long-term benefits of an increase in TEV). The concept of TEV and the advancements in valuation over the past 25 years have contributed significantly to the scientific community and the policy discussions, as it has been successful in bridging the gap between economics and ecology (Costanza et al., 2017). Nonetheless, it is of pivotal importance to understand the complex interrelationships between natural capital and traditional inputs to assess the value of ecosystem services in metrics beyond GDP (Costanza et al., 2014). In one of the efforts to develop all-encompassing measures of wellbeing, Ouyang et al. (2020) have introduced the gross ecosystem product (GEP). The metric incorporates the value of ecosystem services in monetary terms and “uses market prices and surrogates for market prices to calculate the accounting value of ecosystem services and aggregate them into a measure of the contribution of ecosystems to the economy” (p. 14,593–14,594). The authors base their methodology for valuing ecosystem services on market values where applicable and on a suite of non-market methods to calculate Willingness to Pay (WTP) for non-market transactions.
TEV represents the total benefit in wellbeing from a policy, which is the sum of the people's willingness to pay (WTP) and their willingness to accept the policy (WTA). We are attempting to capture the overall value of a marginal change in the underlying ecosystem services (DEFRA, 2007).
The concept of economic valuation of ES is focused on the estimation of the impacts of changes in ecosystem services on the welfare of individuals. Benefits and costs are approximated using pecuniary values (payments or compensations), which are based on the two basic concepts of willingness to pay (WTP) and willingness to accept (WTA). The services provided by the natural environment directly affect human utility and societal welfare in multiple ways, but lack of economic valuation results in their absence of policy dialogues and policymakers' priorities. Economic Valuation using the appropriate techniques is of utmost importance as it underscores the fact that although the environment is “free”, it is far from invaluable. It is common to use non-market valuation techniques to assign a monetary value to ecosystem goods and services, since they are not traded in markets. These methods, in turn, require the conceptualization and measurement of the link between changes in the quantity or quality of the resources and changes in the stated or observed behavior of individuals. Among these non-market valuation techniques, the most widely used in the relevant empirical literature are the revealed preference and stated preference methods. Stated preference techniques usually refer to contingent valuation and choice modeling. The main revealed-preference methods that have been used to value ecosystem services are travel-cost, random utility modeling hedonic pricing, and production function models.
Critique on valuation
The process of valuation of ecosystem services through the lens of economic theory as a means for policy action toward sustainable development has been criticized mainly on two grounds. Firstly, scholars from the fields of ecology and environmental studies strongly oppose the economic definition of value for environmental resources and raise ethical concerns on the limits of the economic science, nature's commodification, and the purpose of the policy. According to Farber et al. (2002) “value” is a term that most ecologists and other natural scientists would prefer not to use at all, as environmental scientists view nature holistically as a system where natural processes are operating. Instead of assigning pecuniary value to the diverse ecosystem services, they consider the efficiency with which each aspect of the system contributes to the natural processes. Hence, most ecologists or environmental scientists do not recognize the merit in the economic valuation of environmental resources and ecosystem services. In addition, ES valuation procedures have been the subject of criticism due to methodological issues and, hence, the validity of their results. All proposed valuation methods pose significant challenges both in terms of design as well as implementation, which has let opponents question the values attributed to environmental resources following these methods. According to Chan et al. (2012) all valuation methods fail to fully capture the values associated with ecosystem services due to the conflation of services, values and benefits inherent in the environmental procedures and the sheer difficulty to encompass intangible values (such as cultural values) in a consistent manner which would shape sound environmental policy. In addition, whereas a single definition of ecosystem services is important for calculation of coherent metrics and for driving sound policies, this task is far from straight forward and fails to conceptualize the complex interactions between environmental resources (Fisher et al., 2009). The valuation of ecosystems services should acknowledge the different social contexts within which ecosystems are valued and distinguish between intermediate and final goods in order to avoid “double counting” (Boyd and Banzhaf, 2007; Fisher et al., 2009). Boyd and Banzhaf (2007) underscore the importance of measuring final ecosystem services for the enhancement of GDP to create a more inclusive metric of economic and social progress.
Having said that, there is merit in the economic valuation of ecosystem services as long as this considers the multifaceted nature of environmental resources and the complexities arising from natural processes. Measuring ES is crucial for their management and shaping economic and environmental policy, especially when this is mostly undertaken by governments and regions running on tight fiscal budgets. Economic valuation, albeit challenging, can help raise awareness regarding environmental issues and prioritize environmental projects through a cost-benefit approach. Furthermore, dismissing the whole valuation discourse would imply an a priori zero value on ecosystem services and that can be detrimental for policies to tackle climate change and environmental degradation. Recent advances in data science and data availability can be of pivotal importance to improve valuation techniques that embed aspects from different scientific disciplines and attempts to adequately map human behavior. According to Daily et al. (2009) “The biophysical sciences are central to elucidating the link between actions and ecosystems, and that between ecosystems and services (biophysical models of ‘ecological production functions'). The social sciences are central to measuring the value of services to people (‘economic and cultural models'). Because this value is multidimensional, it makes sense to characterize it as fully and systematically as possible, in ways that will be meaningful to many different audiences.”
Valuation and marine ecosystems
Coastal and marine ecosystems provide a variety of ecological functions and economic services to society. However, they are significantly affected and threatened by widespread and increasing pressures such as overfishing, water contamination and pollution, coastal habitat destruction, and general loss of biodiversity. Marine ecosystems are of utmost importance as oceans and seas play a critical role in climate regulation, absorbing almost a third of the carbon dioxide emitted annually. Furthermore, marine and coastal ecosystems are home to numerous plant and animal species, which all produce a bevy of useful services for humans. Consequently, valuing marine ecosystem services and quantifying the benefits provided to people is crucial as it can be combined with other sources of value to society. UNEP-WCMC (2011) reviews some of the most commonly used methods for economic valuation of marine and coastal ecosystem services providing considerable policy implications for decision making and communication. Koundouri and Giannouli (2015) and Koundouri et al. (2019) present the ecosystem services approach with regards to the marine ecosystem and propose economic methods that capture the marine ecosystem's total economic value in relation to the opportunity cost of marine space. Remoundou et al. (2009), focusing on the marine and coastal ecosystems of the Mediterranean and the Black Sea, examine information from valuation studies in the area in order to draw important conclusions and provide suggestions in effectively managing coastal and marine environments, stopping the adverse effects of the generally poor current state of marine ecosystems in the region. In general, the total value of the services produced by marine and coastal ecosystems is valued at $29.5 trillion per year, more than the USA's gross national product in 2015 (Ocean and Climate Platform).2
In their recent study, Fonseca et al. (2023) introduced a novel survey to measure valuation of ocean and marine services, which could in turn help in the provision of sound economic and environmental policies. According to the authors “understanding people's views about climate change impacts on marine and coastal systems and potential responses, alongside other threats and societal challenges is critical because it can influence decision-making and steer future actions” (p. 3). In that context, the survey was conducted to grasp public perceptions on the repercussions of climate change and the dire consequences of degrading ocean and marine ecosystems. Harding et al. (2022) use a household survey and semi-structured interviews to gauge the pecuniary and non-pecuniary value of selected marine resources in Kadavu province, Fiji in 2019. Their results indicate that the total annual gross value of marine resources both sold in markets and unsold reached $7.61 million USD, whereas sharing fish that do not enter the market is still a significant contributor to the Fijian social fabric with important valuation to local communities. Logar et al. (2019) estimate that the share of the government budget allocated by the Swiss government to restore river ecosystems is insufficient to cover the costs of local restorations, however including local actors' willingness to pay outweighs the monetary costs. The sum of individual WTP based on the Contingent Valuation method is in line with other European experiments and underscores a significant increase in societal benefit from river restoration which is not to be ignored when designing environmental policy at the national and local level.
However, it is urgent to assess the level of protection and the ecosystems' resilience in order to avoid further degradation and the loss of services. The framework of Sustainable Development Goals (SDGs) facilitates the achievement of sustainable development by providing a holistic set up of specific general targets. SDGs were adopted by the United Nations in 2015 to call for actions to end poverty, reduce inequalities, protect the planet, and ensure that all people have equitable access to a prosperous and peaceful life. More precisely, SDG 14 is about conserving and sustainably using the oceans, seas and marine resources, highlighting that healthy oceans and seas are essential to human existence and life on Earth. As marine ecosystems constitute the 70% of the planet and provide food, energy and water while absorbing around one third of the world's annual carbon dioxide (CO2) emissions, they are established as the largest ecosystem in planet on one hand, and on the other, as the most critical contributors in mitigating climate change and alleviating its impacts.
In the global context of environmental degradation and the multiple risks stemming from climate change, the dichotomy between sustainable economic development and environmental protection is outdated. One cannot inspire in achieving substantial progress on the SDG front without tackling the issues of environmental debasement, biodiversity loss and climate change (Vörösmarty et al., 2018). Johnson et al. (2019) argue that addressing the challenges set by the SDG framework warrants a complex socio-economic approach whereby ecosystem service valuation and management are at the epicenter. Furthermore, the authors underscore that, apart from encouraging better management practices of environmental resources to support SDG 14 and SDG 15, interdisciplinary methods for ecosystem service valuation shed light to the interlinkages between environmental SDGs and goals associated with wellbeing (e.g., SDG2 and SDG 3).
Specifically, in the case of SDG 14 regarding the conservation and sustainable use of the oceans, seas, and marine resources, attributing value to water and marine ecosystem services cannot be disentangled from the progress in the respective targets within this goal. Marine ecosystems and water resources in general provide services in the form of clean water supplies, water for farming and irrigation as well as indirect benefits including building resilience to climate risks like flooding. Their non-use values are intangible, nonetheless of great importance to humankind. Addressing these issues with adequately designed tools based on environmental economics, cross-fertilized with knowledge embedded in other disciplines (behavioral economics, psychology, sociology, and ecology) is pivotal in understanding the value of water-related ecosystems and implementing sound policies toward the achievement of SDG14. The achievement of all SDGs will require sizable funding from the international community, national governments, and private actors. Furthermore, green infrastructure represents a high share of the projects to be undertaken in the process. In this context and given tight government budgets and crisis-hit private enterprises, ecosystem services valuation stemming from scientific methods will be a prerequisite to mobilize scarce resources.
Pertaining to SDG14, the need to improve the sustainable use of marine natural capital necessitates the inclusion of ecosystem valuation in marine management decision models. And although ecosystem services valuation has advanced significantly in the last years, still their results remain untapped for marine management and policy decisions. Vassilopoulos and Koundouri (2017) point to this fact by extensively discussing and justify the objectives of marine ecosystem services valuation.
Data and methodology
For the economic valuation, a meta-regression analysis has been conducted using the publicly accessible database EVRI (Environmental Valuation Reference Inventory, 2022). Primary literature3 related to ecosystem services valuation from 2012 to 2022 has been selected. Studies have been determined according to the ecosystem typology, the ecosystem services valued, and the geographical area in which the study was conducted.
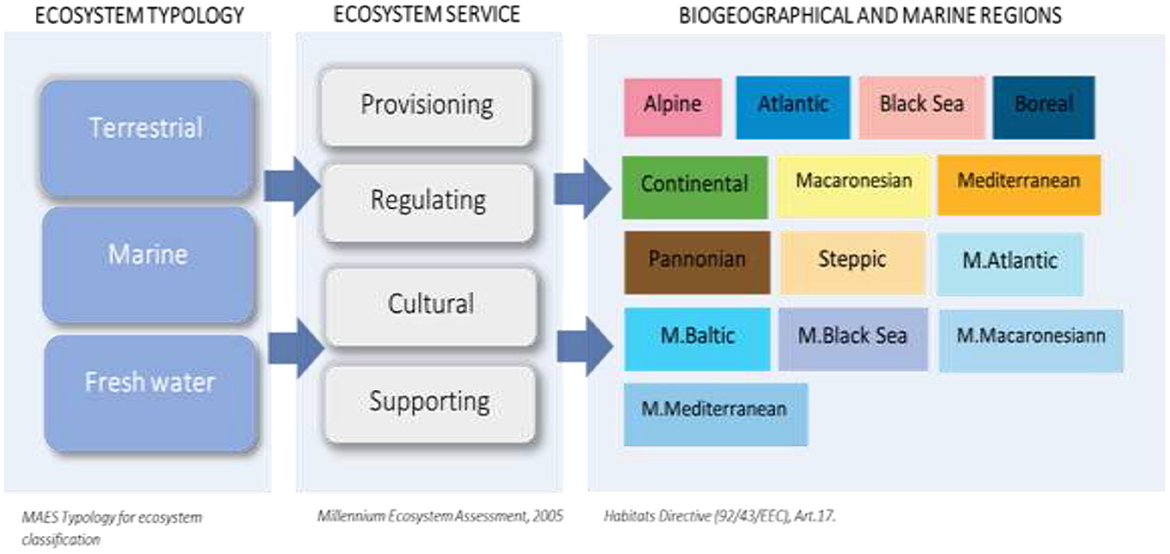
Mapping and Assessment of Ecosystems and their Services (MAES) Typology for ecosystem classification (European ecosystem assessment-concept, data and implementation, EEA Technical Report, no 6/2015) has been followed to identify the typology of ecosystems. This includes three main groups (1) Terrestrial ecosystems: urban, cropland, grassland, forest, heathland, and shrub, sparse vegetated land, and inland wetlands; (2) Marine ecosystems: marine inlets and transitional water, coastal, shelf and open oceans; (3) Freshwater ecosystems: rivers and lakes.
On the other hand, ecosystem services have been distinguished between provisioning, regulating, cultural, and supporting services in compliance with the aforementioned MA classification. Finally, since ecosystem typologies vary across regions, the geographical area of the study has been defined according to Habitats Directive (92/43/EEC) and for the EMERALD Network set up under the Convention on the Conservation of European Wildlife and Natural Habitats (Bern Convention). This last distinguishes nine EU biogeographical regions, i.e., Alpine, Atlantic, Black Sea, Boreal, Continental, Macaronesian, Mediterranean, Pannonian and Steppic and 5 EU marine regions, i.e., Marine Atlantic, Marine Baltic, Marine Black Sea, Marine Macaronesian, and Marine Mediterranean. Figure 4 presents the three main categories of the MAES Ecosystem Typology (MAES, 2015), along with the aforementioned classes of ecosystem services and the defined biogeographical and marine regions.
Meta-regression analysis function transfer
To summarize and synthesize the empirical findings of various studies, in our research, we rely on the meta-regression analysis function transfer using the summary statistics provided. Our purpose is to statistically explain the variation found in the studies under consideration due to identifiable characteristics among the considered studies like the valuation method, geographic location, study-specific factors, survey mode, and other relevant determinants and demographic elements. The meta-analysis model is presented as follows:
where i corresponds to each observation gathered from the studies under consideration, Y denoted the dependent variable in our case, Willingness to Pay (WTP), γ is the intercept, and β are parameters to be estimated as slopes of the specifications, X is a matrix containing the rest of explanatory variables and ε is the error term with the usual properties.
Specifically, Willingness to pay refers to the annual mean willingness to pay (in euros) for ecosystem services. A battery of explanatory variables were considered to explain the variation mentioned above, as, predominantly s, a categorical variable referring to the type of the type of the ecosystem following the MAES categorization, namely Forest, Cropland, Heathland and Shrub, Sparsely Vegetated Land, Inland Wetlands, Rivers and Lakes, Urban, Grassland and Marine ecosystems. The estimations also include a categorical variable distinguishing for the valuation method which can consist of Contingent valuation, Choice experiment, Actual Market price, Count data model, Hedonic Price Method, Hedonic Property, Meta-analysis, Replacement costs, and the Travel cost method. We also include indicator variables to control for Cultural, Provisioning, Regulating, Supporting ecosystem services based on the MA Reporting categories. In addition, we consider socioeconomic variables, such as age and income of the subsample population, a gender indicator variable and measures of educational levels. The final dataset consists of 212 papers collected from the Environmental Valuation Reference Inventory (EVRI),4 where 165 were used for estimation.5
Our approach follows the “weak structural utility theoretic” (Bergstrom and Taylor, 2006) and limitations can be identified to possible Commodity Consistency related problems, such as the consistency of the primary studies' values, e.g., differences between the objects of values expressed in WTP estimates (Woodward and Wui, 2001). Moreover, methodological differences could result to valuing separate welfare measures (Stapler and Johnston, 2009). Finally, the largest challenge in the benefit transfer literature refers to the spatial aspects of valuation. Small changes in assumptions regarding the spatial patterns associated with the transfer of value estimates have potentially enormous consequences for the reported values (Loomis, 1996, 2000).
In the final part of the empirical exercise, we deploy a correlation analysis (Pearson correlation coefficient) to underscore the relationship between the 17 SDG s and the ecosystem services valuation stemming from the MWTP values estimated in the first part. The theoretical premise is that a high positive correlation indicates an interconnection between the value that individuals attribute to ecosystem services and the overall country progress on the goals of sustainable development as defined and by the Paris Agreement and Agenda 2030. To this end we use metrics of valuation for regulating, provisioning and supporting ecosystem services. A rational hypothesis is that a high measured valuation of ecosystem services indicates society's realization on the quality of environmental resources and the need to encompass metrics complementary to monetary measures like GDP in the evaluation of wellbeing. Hence, we would expect a positive correlation with the measures of SDG progress, especially environmentally related goals (SDG12-SDG15). Having said that, the correlation analysis does not imply any causal relationship among the underlying variables.
Empirical results and conclusions
Willingness to pay by ecosystem type and country
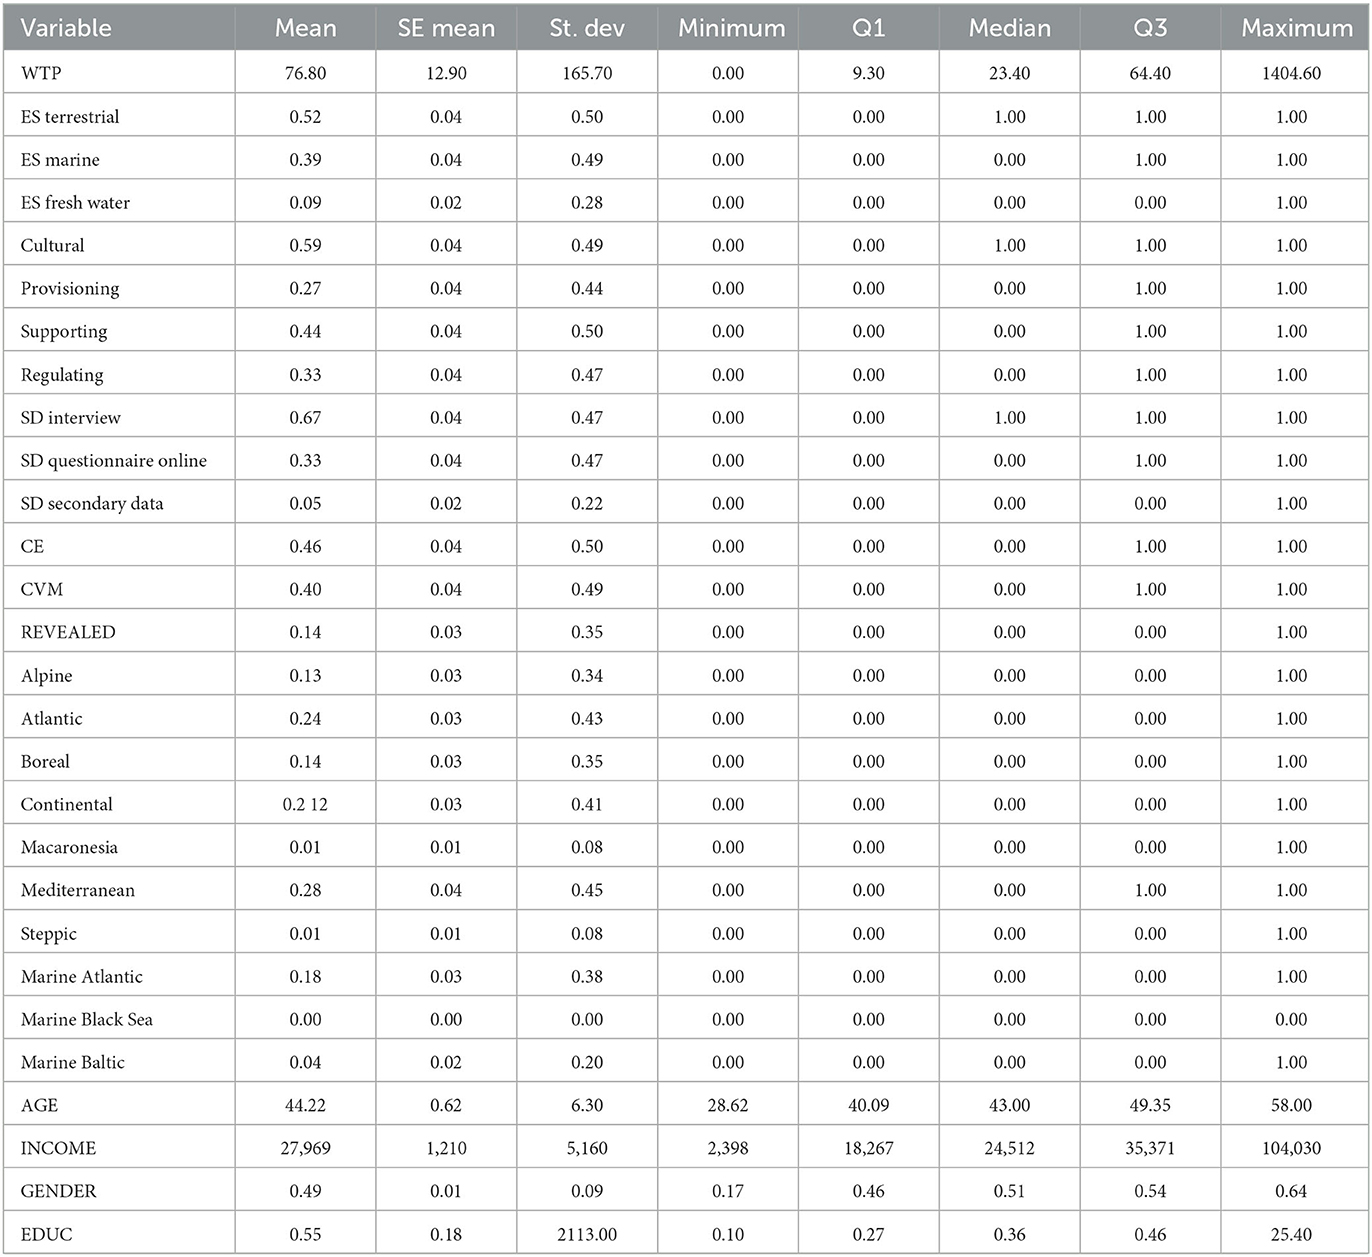
Table 1 provides the descriptive statistics of all the variables used in the analysis.
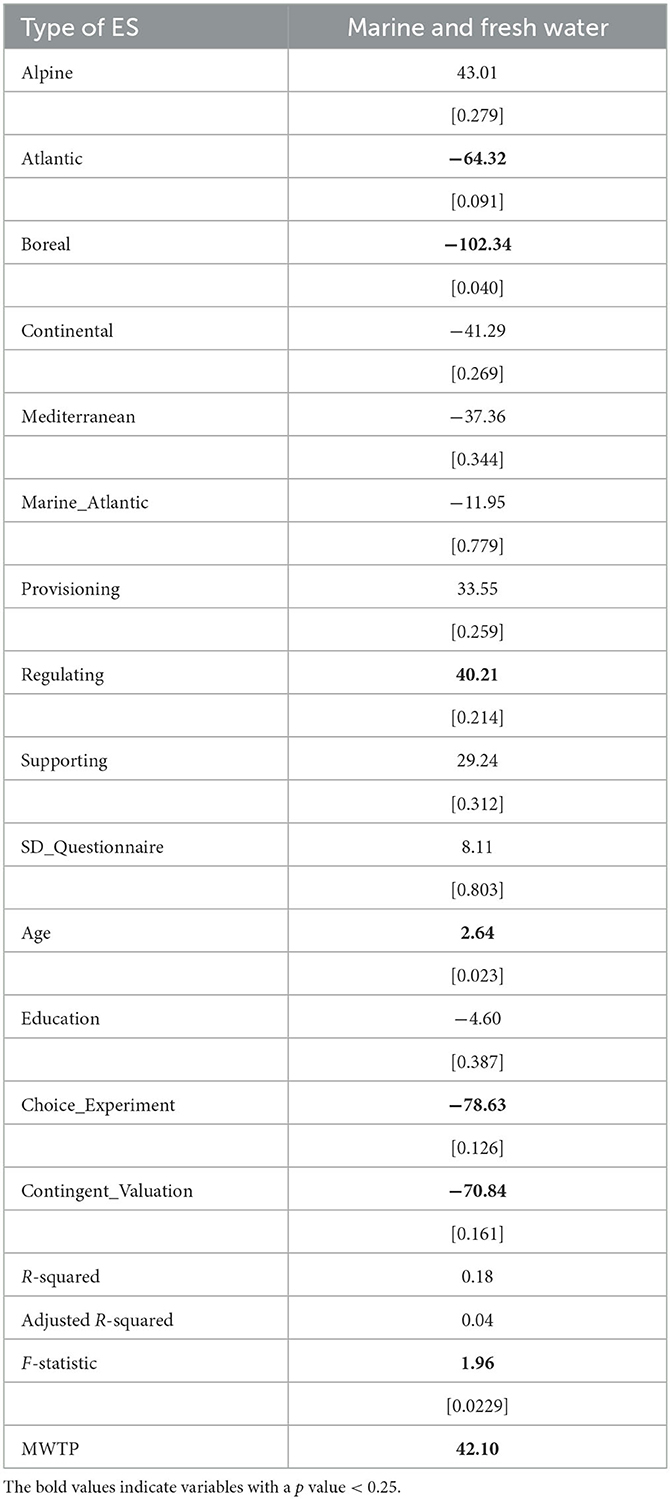
Next, we perform various stepwise specifications of the variables considered slightly elastic in the individual statistical significance of the explanatory variables (using Newey-West heteroskedasticity and autocorrelation Robust standard errors). Apart from the standard levels (of α = 0.01, α = 0.05 and α = 0.1), we have considered (in such analysis) p-values < 0.25. BIC criterion was used for the model selection. The 1% extreme WTP observations were excluded from the analysis. Table 2 provides the meta-regression estimates and benefit transfer functions for a model including Marine and Freshwater ecosystem.6 P-values for the Newey West HAC standard errors are reported in brackets.
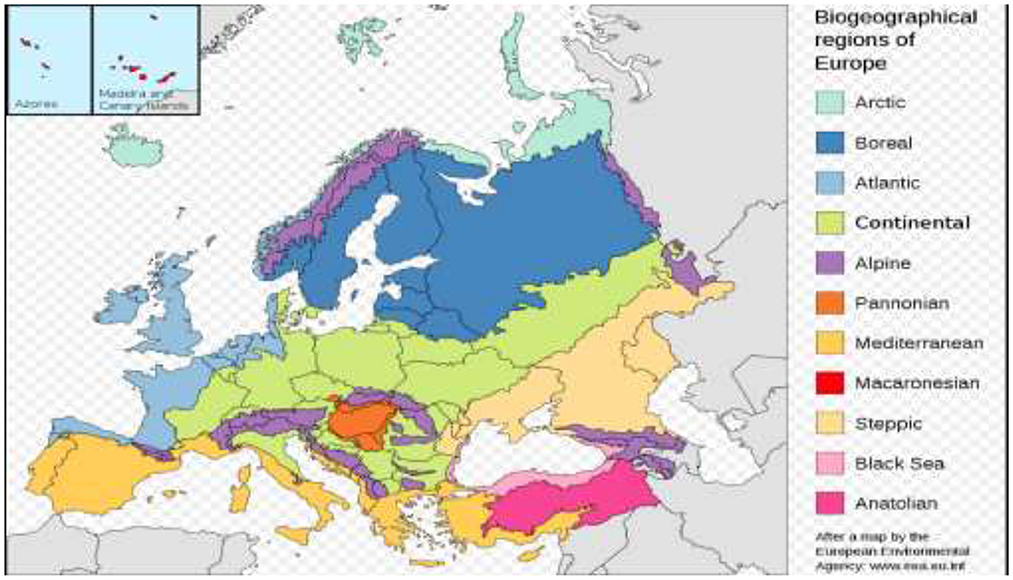
Figures 5, 6 present the Annual Marginal WTP (MWTP) per household, by Marine and Freshwater Ecosystem Service and By Bio-Geographical Region. Figure 7 provides a map of the European Biogeographical Regions. Using the whole sample, we note that individuals assign greater value to the Regulating Services of marine and freshwater ecosystems with an average WTP of more than 40 euros per household. Moreover, the Alpine regions somewhat surprisingly attribute greater value to marine and freshwater ES, followed by Atlantic and Mediterranean regions.
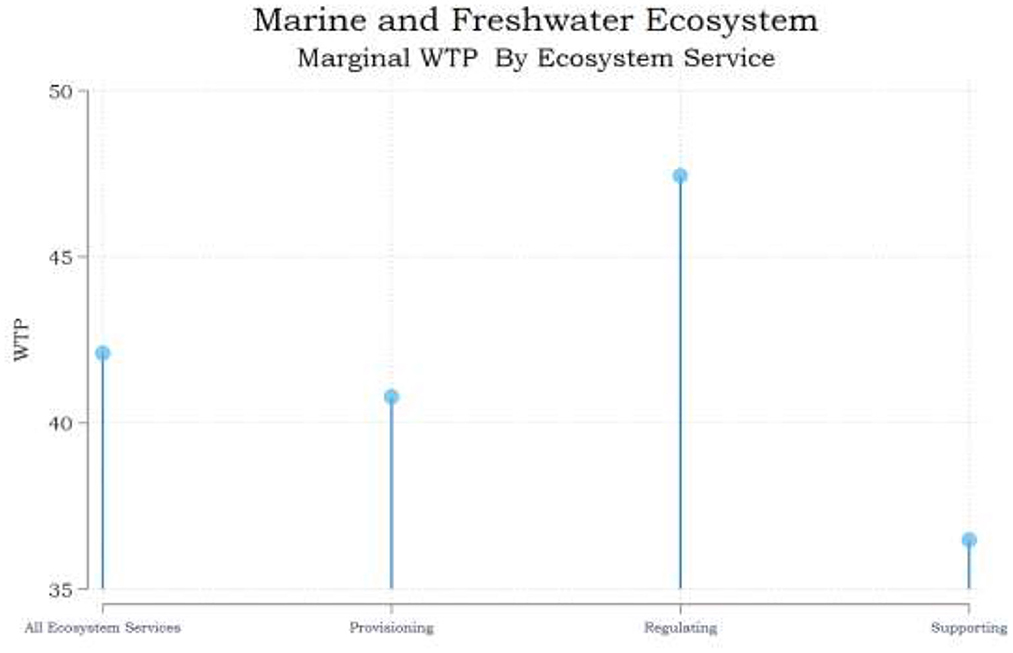
Figure 5. Marine and freshwater ecosystem—Annual Marginal WTP by ecosystem service. Source: authors' calculations.
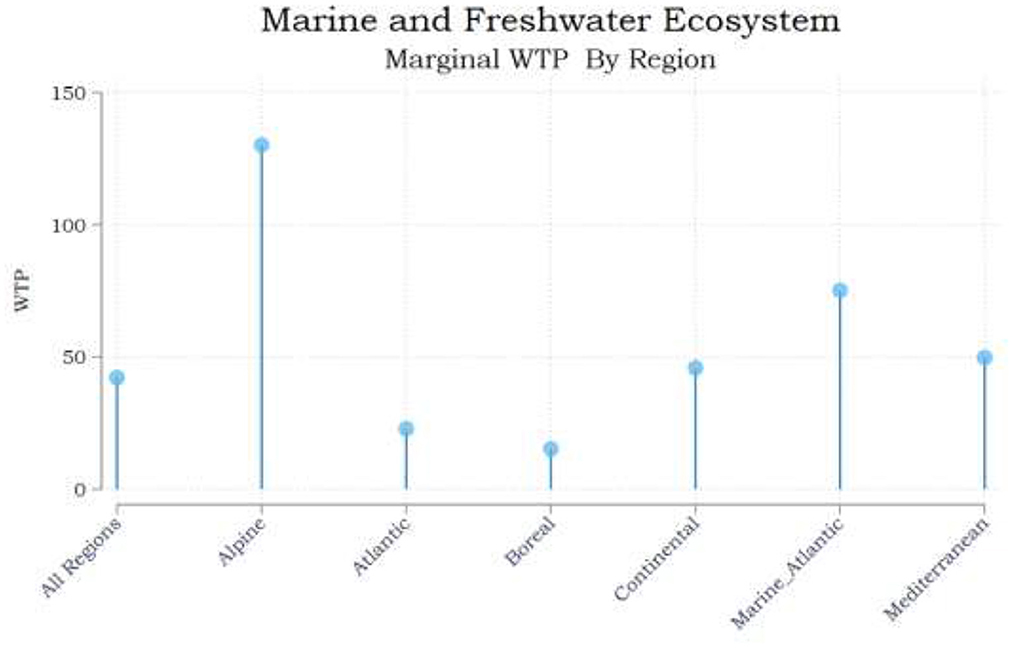
Figure 6. Marine and freshwater ecosystem—Annual Marginal WTP by biogeographical region. Source: authors' calculations.
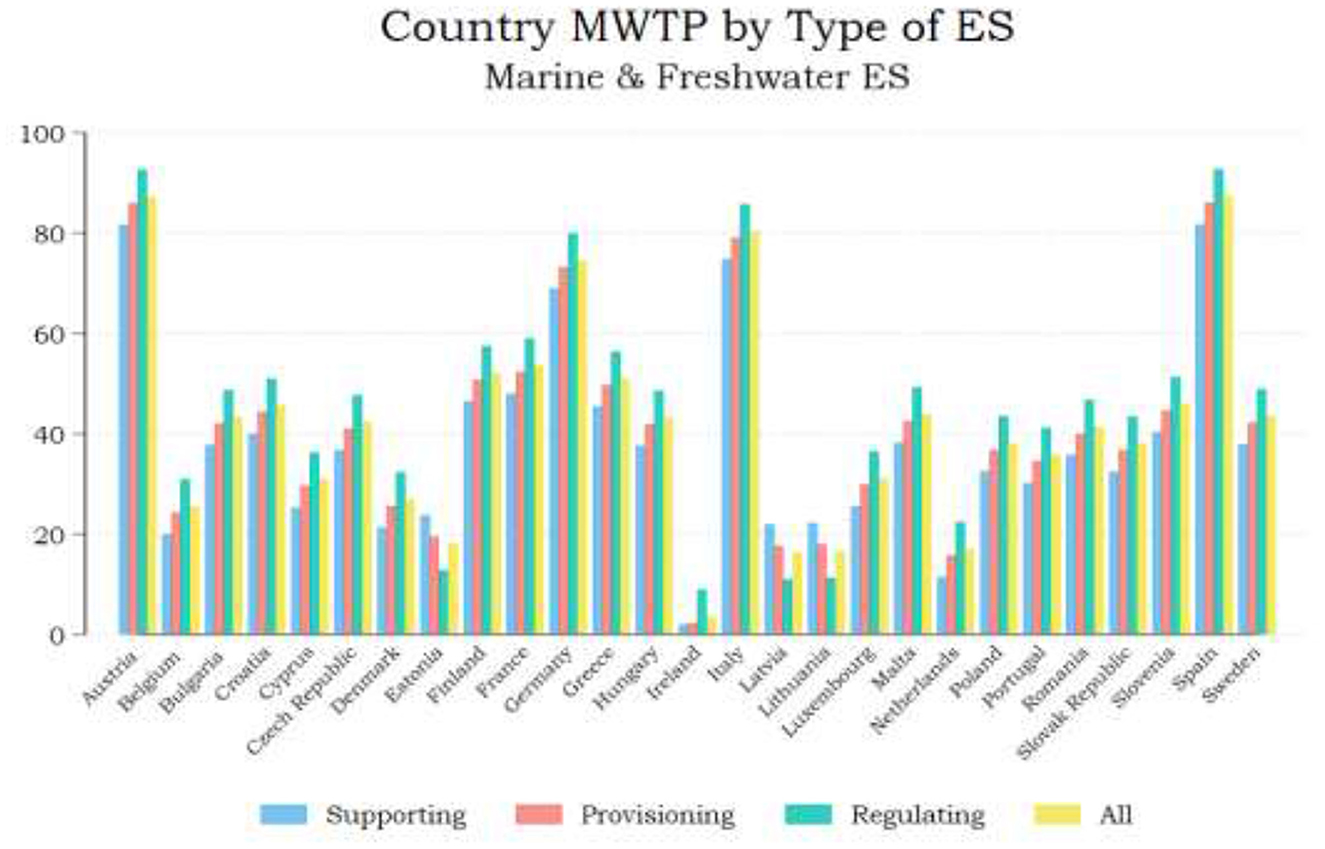
Figure 8 presents the Marginal Willingness to pay for Marine and Freshwater Ecosystem at the national level disaggregated into three ecosystem services (Provisioning, Regulating, and Supporting). For the socioeconomic variables of the benefit transfer function (age and education), data for the year 2020 for all countries were collected from Statista (2020) and OECD (Share of people with tertiary education in OECD countries 2020). The classification of countries into Bio Geographical Regions follows the definitions by the European Environmental Agency. For all countries that mainly refer to a region not included in our model,7 we normalize all the relevant dummy variables to add to 1.
A quick conclusion that can be drawn from observing Figure 8 is that in almost 63% of European countries (17 out of 27), the willingness to pay for the improvement of the marine and freshwater ecosystem is high and exceeds estimates for terrestrial ecosystems (Sachs et al., 2022).
The reason why this is happening needs further investigation, which is beyond the scope of this paper. However, one possible explanation, may be that the citizens of these countries recognize that marine and aquatic ecosystems are at greater risk of collapse than terrestrial ecosystems, so they are willing to spend part of their income on the restoration of aquatic ecosystems. Another possible explanation is that the citizens of these countries are dependent on the marine or aquatic ecosystem, e.g., due to fishery production, tourism, etc., to a greater extent than terrestrial, and are willing to bear the cost of maintaining these ecosystems in good condition.
For most of the EU28 Countries the Regulating ecosystem services are valued higher (46.15 euro on average) than Provisioning or Supporting, while Provisioning is valued higher than Supporting (40.97 and 37.77 euro on average, respectively).
Valuing ecosystem services and sustainable development
Finding a balance between socioeconomic development and ecosystem services is a crucial challenge for sustainable development (McCartney et al., 2014). In this subsection we examine the correlation between willingness to pay and the level of achievement of 17 SDGs overall, for the 27 countries of the European Union.
For the calculation of correlation coefficient, we used the scores per SDG of each country from the UNSDSN Sustainable Development Report Europe 2021,8 and the MWTP per country calculated in the previous section.
In each of the following figures, the first entry with the label “SDG Index Score” refers to the aggregated Score for all 17 goals, while in the following entries refer to the cross-sectional (27 countries) correlation between WTP estimates and 17 SDG Score(s).
A positive correlation means that a high level of MWTP is associated with a high level of achievement of a specific SDG. The closer the correlation coefficient is to the value of 1, the stronger the association. Conversely, a negative correlation means that a high (or low) level of MWTP is associated with a low (or high) level of achievement of a specific SDG. Again, the correlation coefficient approaching the value of −1, the stronger the (negative) association.
Figure 9 presents the cross-sectional correlation coefficients between national MWTP estimates and SDG Index Scores and the Scores for all the 17 Underlying goals for all ecosystems and the three ecosystem services categories, respectively. Interestingly, the most pronounced positive correlation for the MWTP—SDG relationship is recorded in the areas of SDG 12 (Responsible Consumption and Production) and SDG 17 (Cooperation of the Goals) Data for the SDG Scores were obtained from Sachs et al. (2021). Figure 10 presents the SDG Scores for all countries, by SDG.
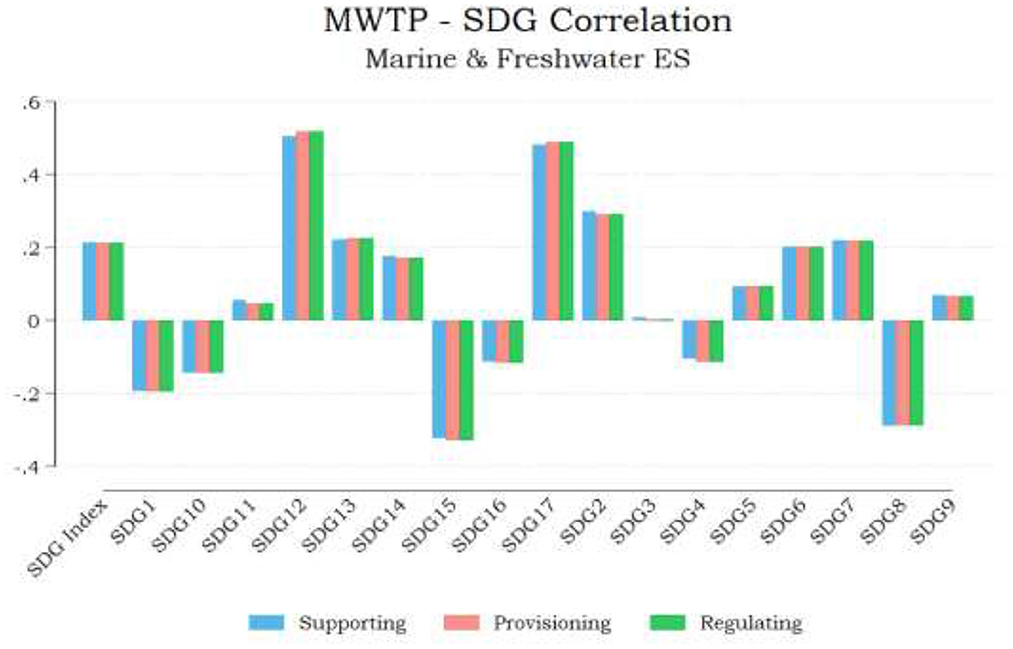
Figure 9. Cross sectional correlation of UNSDSN Index Scores and ecosystem service's MWTP, by SDG. Source: authors' calculations.
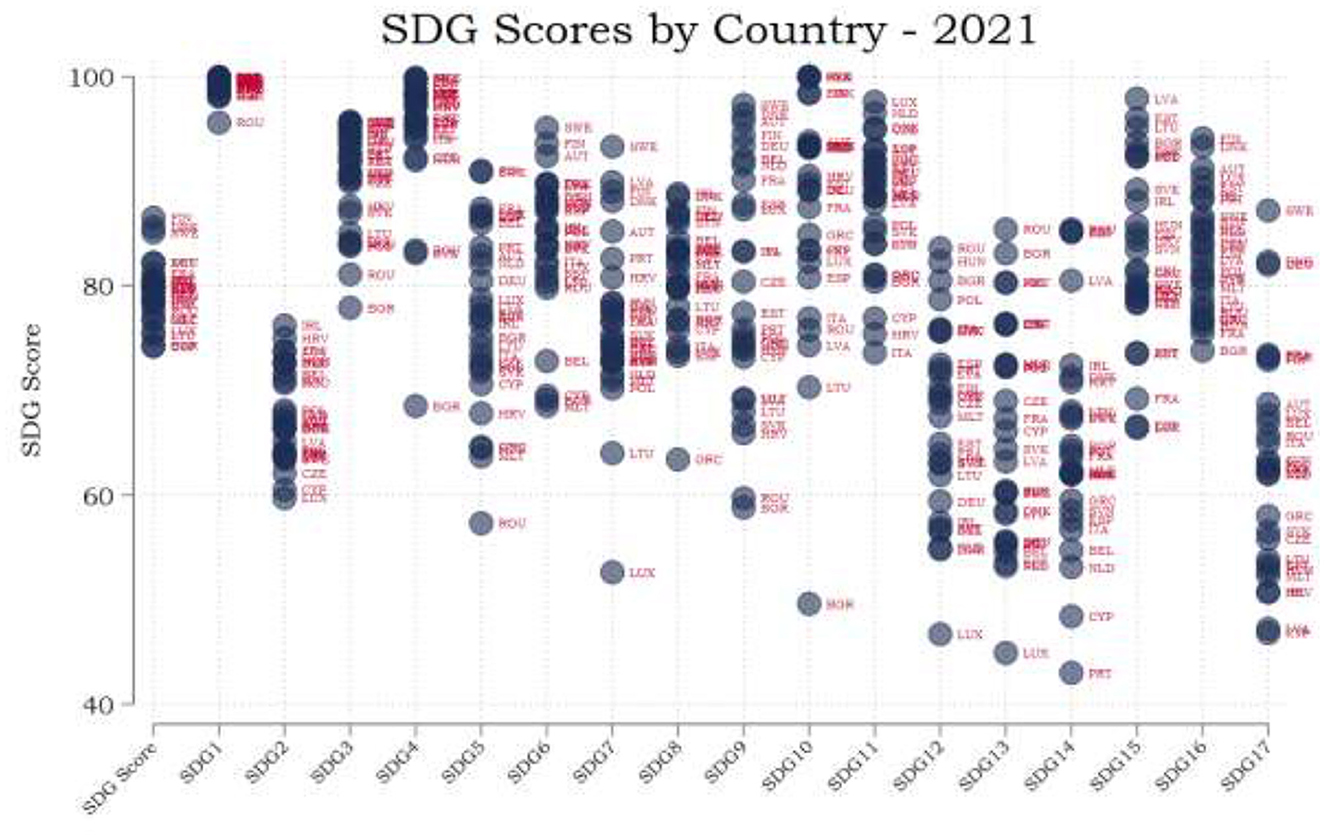
Figure 10. UNSDSN Index Scores by SDG. Source: Sachs et al. (2021) and authors' calculations.
Results indicate that Marine and Freshwater Ecosystems are mainly positively correlated to SDGs 2, 12, 13, and 17 and negatively correlated to 8 and 15. The positive correlation reported with SDG 14 is non-negligible, however < 0.2 (Figure 9). A positive correlation implies that the WTP is high for a transformation that is needed. Goals 12, 13, and 14 are closely intertwined, underscoring the global efforts toward a model of economic growth which does not accelerate the deterioration of environmental resources. The positive association with the ES valuation enshrined in the WTP metrics, albeit indicative at this level of analysis, underscores the relationship between ecosystems valuation and action toward SDG implementation. A plausible explanation is that, in societies where ecosystems are considered more valuable and where ES are appreciated by the public, resources are mobilized toward making progress on SDG targets. Keeping in mind that promoting and monitoring policies associated with sustainable development is a participatory process, societal attitudes vis-à-vis environmental resources and their provisions is of material importance.
Focusing on SDG 14, we perform the same analysis by breaking down the SDG scores into the correlations with the individual indicators, that is:
• Mean area that is protected in marine sites important to biodiversity (%).9
• Ocean Health Index: Clean Waters score (worst 0–100 best).10
• Fish caught from overexploited or collapsed stocks (% of total catch).11
• Fish caught by trawling or dredging (%).12
• Fish caught that are then discarded (%).13
• Marine biodiversity threats embodied in imports (per million population).14
Figure 11 presents the correlations between the Marine and Freshwater Ecosystem Service's Annual Marginal Willingness to pay estimates and the SDG Scores for all the individual SDG14 indicators. Interestingly the positive correlation corresponds mainly to fish caught from overexploited or collapsed stocks and Fish caught that are then discarded (%) indicators, whereas a negative correlation coefficient is revealed for the relationship between MWTP and the sub-indicators referring to fish caught by trawling or dredging, and marine biodiversity threats embodied in imports.
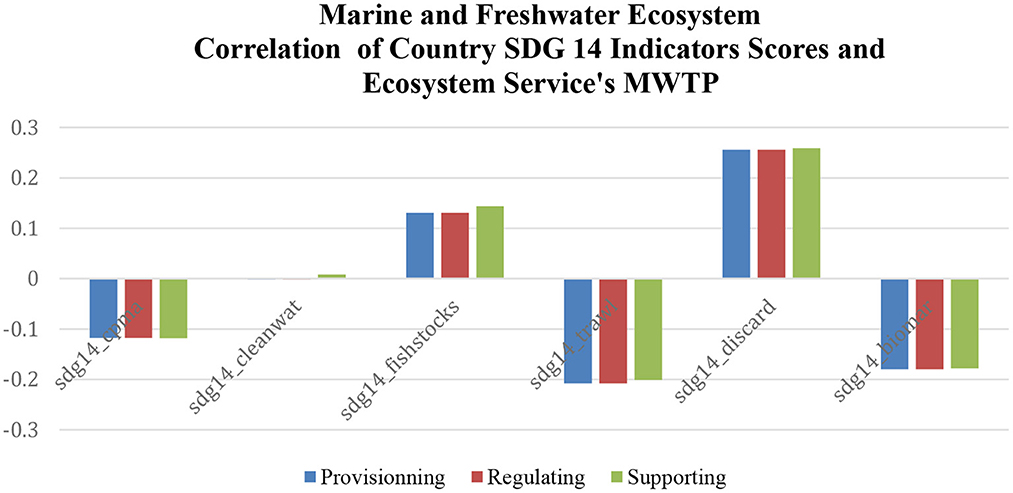
Figure 11. Cross sectional correlation of UNSDSN SDG14 indicators scores and ecosystem service's MWTP.
Conclusion
This study refers to the valuation of European Ecosystems and Ecosystem Services stemming from Marine and Freshwater ecosystems, as well as three types of Ecosystem Services, that is Regulating, Supporting and Provisioning respectively, with a special focus to the relationship between valuation of Marine and Freshwater Ecosystems and progress on SDG 14. Ecosystem Services valuation based on scientific knowledge and through an interdisciplinary approach is materially linked to the progress on SDGs as per the Agenda 2030. Attribution of value to marine and freshwater ecosystems matters for designing, implementing, and monitoring policies toward improving life underwater as envisioned by SDG 14.
Results based on meta-regression analysis of 212 empirical papers from the EVRI database indicate that Mean Willingness to Pay (MWTP) per household is ranked high for the regulating services of marine and freshwater ecosystem while in terms of biogeographical regions, we find that in the Alpine region, the MWTP is greater than the other regions. Another important conclusion is that in almost 63% of European countries (17 out of 27), the willingness to pay for the improvement of the marine and freshwater ecosystems is high and exceeds estimates for terrestrial ecosystems. Across the EU there are signs of relatively high valuation of marine and freshwater resources.
In terms of valuing ecosystem services and link them to the Sustainable Development Goals, we find that marine and freshwater ecosystems are mainly positively correlated to SDGs 2, 12, 13, and 17 and negatively correlated to 8 and 15. A modest positive association is revealed between ES valuation and SDG 14. The results combined indicate that societies with higher documented ES valuation (as expressed by their WTP) perform better in the environmental-related SDGs. Breaking further to specific SDG14 individual indicators, we uncover a higher MWTP for fish caught from overexploited or collapsed stocks and fish caught that are then discarded (%) indicators.
These results provide fodder for policy design in EU economies that aspire to abide by the UN Agenda 2030 and the promotion of SDGs. Given that higher valuation of ecosystem services is associated with better performance in the environmental-centered SDGs, investment in the information of the public regarding the market and non-market services of environmental resources is of material importance. To our knowledge, no other study has attempted to link ecosystem valuation with SDG progress using a comprehensive dataset of environmental studies based on a battery of valuation approaches that capture market and non-market ecosystem services. Moreover, identification of the valuation of ecosystem services needs to be embedded in the educational system from early levels, in an effort to shape people's understanding and attitudes toward environmental resources. Investment in human capital is also crucial, in order for the application of up-to-date scientific methods in the valuation of ecosystem services to materialize and increase public awareness. In the sense that a better understanding of the advantages and trade-offs associated with ecosystem services acts as a catalyst for the promotion of SDGs, measuring and disseminating the true value of ecosystem services needs to become a policy priority. In order to further address possible limitations of the approach we followed; future studies should attempt to use spatial coordinates of the sites included in the analysis (e.g., distance from sea), and expand the framework to include breakdowns of the ecosystem services classifications we used. Finally, meta-regression could also be expanded to regions other than Europe.
Data availability statement
The raw data supporting the conclusions of this article will be made available by the authors, without undue reservation.
Author contributions
All authors listed have made a substantial, direct, and intellectual contribution to the work and approved it for publication.
Funding
The paper has received funding from the project: Horizon 2020 IMPETUS: “Dynamic Information Management Approach for the Implementation of Climate Resilient Adaptation Packages in European Regions”. The IMPETUS project receives funding from Horizon 2020, the European Union's Framework Programme for Research and Innovation (H2020), under Grant Agreement No. 883286.
Acknowledgments
Some of the content included within the manuscript has previously appeared within the following report: https://resources.unsdsn.org/financing-the-joint-implementation-of-agenda-2030-and-the-european-green-deal. The authors confirm that they have obtained/retained the rights for reusing the material.
Conflict of interest
The authors declare that the research was conducted in the absence of any commercial or financial relationships that could be construed as a potential conflict of interest.
Publisher's note
All claims expressed in this article are solely those of the authors and do not necessarily represent those of their affiliated organizations, or those of the publisher, the editors and the reviewers. Any product that may be evaluated in this article, or claim that may be made by its manufacturer, is not guaranteed or endorsed by the publisher.
Supplementary material
The Supplementary Material for this article can be found online at: https://www.frontiersin.org/articles/10.3389/frevc.2023.1160118/full#supplementary-material
Footnotes
1. ^The Millennium Ecological Assessment (MEA) was a 4-year multinational work program aiming to provide scientific knowledge on the relationships between ecosystem change and human wellbeing to decision-makers. Millenium Ecosystem Assessment looked at the effects that changes in the ecosystem have on human wellbeing. From 2001 to 2005, more than 1,360 experts from all over the world worked on the MA. Scientifically, their findings show how ecosystems and the services they provide are in a state of flux around the world. They also show how to protect and use them in a way that is healthy for the planet and for people.
2. ^https://ocean-climate.org/en/marine-and-coastal-ecosystem-services/
3. ^A complete list of studies used in the meta-regressions are available upon request.
4. ^Accessed at https://evri.ca/en.
5. ^In total 47 studies have been omitted. In general, these studies present net present values, total economic values and monetary values that are hardly compatible with the type of values expressed in the studies under review. In addition, a small number of cases were omitted because the values were too high and thus represented outliers in the database.
6. ^Fresh water ecosystem was covered only by 14 studies in our sample, so it was grouped together with the marine ecosystem.
7. ^For example, for Hungary, which is classified as Pannonian, we set all the biogeographical dummy variables included in our model equal to 0.2.
8. ^https://eu-dashboards.sdgindex.org/profiles
9. ^Sdg14_cpma.
10. ^Sdg14_cleanwat.
11. ^Sdg14_fishstocks.
12. ^Sdg14_trawl.
13. ^Sdg14_discard.
14. ^Sdg14_biomar.
References
Bergstrom, J. C., and Taylor, L. O. (2006). Using meta-analysis for benefits transfer: theory and practice. Ecol. Econ. 60, 351–360. doi: 10.1016/j.ecolecon.2006.06.015
Boyd, J., and Banzhaf, S. (2007). What are ecosystem services? The need for standardized environmental accounting units. Ecol. Econ. 63, 616–626. doi: 10.1016/j.ecolecon.2007.01.002
Chan, K. M., Satterfield, T., and Goldstein, J. (2012). Rethinking ecosystem services to better address and navigate cultural values. Ecol. Econ. 74, 8–18. doi: 10.1016/j.ecolecon.2011.11.011
Costanza, R., d'Arge, R., de Groot, R., Farber, S., Grasso, M., Hannon, B., et al. (1997). The value of the world's ecosystem services and natural capital. Nature 387, 253–260. doi: 10.1038/387253a0
Costanza, R., De Groot, R., Braat, L., Kubiszewski, I., Fioramonti, L., Sutton, P., et al. (2017). Twenty years of ecosystem services: how far have we come and how far do we still need to go? Ecosyst. Serv. 28, 1–16. doi: 10.1016/j.ecoser.2017.09.008
Costanza, R., De Groot, R., Sutton, P., Van der Ploeg, S., Anderson, S. J., Kubiszewski, I., et al. (2014). Changes in the global value of ecosystem services. Glob. Environ. Change 26, 152–158. doi: 10.1016/j.gloenvcha.2014.04.002
Daily, G. C. (1997). “Introduction: what are ecosystem services?,” in Nature's Services: Societal Dependence on Natural Ecosystems, ed G. C. Daily (Washington, DC: Island Press), 1–10.
Daily, G. C., Polasky, S., Goldstein, J., Kareiva, P. M., Mooney, H. A., Pejchar, L., et al. (2009). Ecosystem services in decision making: time to deliver. Front. Ecol. Environ. 7, 21–28. doi: 10.1890/080025
Dasgupta, P. (2021). The Economics of Biodiversity: The Dasgupta Review. Abridged Version. London: HM Treasury.
DEFRA (2007). An Introductory Guide to Valuing Ecosystem Services. Available online at: https://ec.europa.eu/environment/nature/biodiversity/economics/pdf/valuing_ecosystems.pdf (accessed December 23, 2022).
Environmental Valuation Reference Inventory (2022). Available online at: https://evri.ca/en (accessed September 22, 2022).
Farber, S. C., Costanza, R., and Wilson, M. A. (2002). Economic and ecological concepts for valuing ecosystem services. Ecol. Econ. 41, 375–392. doi: 10.1016/S0921-8009(02)00088-5
Fisher, B., Turner, R. K., and Morling, P. (2009). Defining and classifying ecosystem services for decision making. Ecol. Econ. 68, 643–653. doi: 10.1016/j.ecolecon.2008.09.014
Fonseca, C., Wood, L. E., Andriamahefazafy, M., Casal, G., Chaigneau, T., Cornet, C. C., et al. (2023). Survey data of public awareness on climate change and the value of marine and coastal ecosystems. Data Brief 47, 108924. doi: 10.1016/j.dib.2023.108924
Harding, S., Marama, K., Breckwoldt, A., Matairakula, U., and Fache, E. (2022). Marine resources and their value in Kadavu, Fiji. Ambio 51, 2414–2430. doi: 10.1007/s13280-022-01794-0
HM Treasury (2020). Final Report of the 2020 Green Book Review, 25 November 2020, ISBN 978-1-5286-2229-5. PU3051. London: HM Treasury.
Johnson, J. A., Jones, S. K., Wood, S. L. R., Chaplin-Kramer, R., Hawthorne, P. L., Mulligan, M., et al. (2019). Mapping ecosystem services to human well-being: a toolkit to support integrated landscape management for the SDGs. Ecol. Appl. 29, 1985. doi: 10.1002/eap.1985
Koundouri, P., Apostolaki, S., Akinsete, E., and Samartzis, P. (2019). Freshwater: The Importance of Freshwater for Providing Ecosystem Services, DEOS Working Papers 1905. Athens: University of Economics and Business.
Koundouri, P., and Giannouli, A. (2015). Blue growth and economics. Front. Mar. Sci. 2, 94. doi: 10.3389/fmars.2015.00094
Logar I. Brouwer R. and A. Paillex (2019). Do the societal benefits of river restoration outweigh their costs? A cost-benefit analysis. J. Environ. Manag. 232, 1075–1085. doi: 10.1016/j.jenvman.2018.11.098
Loomis, J. B. (1996). How large is the extent of the market for public goods: evidence from a nationwide contingent valuation survey. Appl. Econ. 28, 779–782. doi: 10.1080/000368496328209
Loomis, J. B. (2000). Vertically summing public good demand curves: an empirical comparison of economic versus political jurisdictions. Land Econ. 76, 312–321. doi: 10.2307/3147231
MA (2005). Millennium Ecosystem Assessment (Program), Ecosystems and Human Well-being. Washington, DC: Island Press.
MAES (2015). Typology for Ecosystem Classification (European Ecosystem Assessment-Concept, Data and Implementation, EEA Technical Report. No 6/2015). Copenhagen: EEA Publication.
McCartney, M., Finlayson, M., de Silva, S., Amerasinghe, P., and Smakhtin, V. (2014). “Sustainable development and ecosystem services,” in On Target for People and Planet: Setting and Achieving Water-Related Sustainable Development Goals, eds J. van der Bliek, P. McCornick, J. Clarke (Colombo: International Water Management Institute (IWMI)). pp. 29–32. doi: 10.22004/ag.econ.208754
Ouyang, Z., Song, C., Zheng, H., Polasky, S., and Daily, G. C. (2020). Using gross ecosystem product (GEP) to value nature in decision making. Proc. Natl. Acad. Sci. U. S. A. 117, 201911439. doi: 10.1073/pnas.1911439117
Pearce, D. W., and Turner, R. K. (1991). Economics of Natural Resources and the Environment. Baltimore, MD: The Johns Hopkins University Press.
Remoundou, K., Koundouri, P., Kontogianni, A., Nunes, P. A., and Skourtos, M. (2009). Valuation of natural marine ecosystems: an economic perspective. Environ. Sci. Policy 12, 1040–1051. doi: 10.1016/j.envsci.2009.06.006
Sachs, J., Koundouri, P., Becchetti, L., Brunnhuber, S., Chioatto, E., Cordella, M., et al. (2022). Financing the Joint Implementation of Agenda 2030 and the European Green Deal. Report of the UN Sustainable Development Solutions Network. Available online at: https://resources.unsdsn.org/financing-the-joint-implementation-of-agenda-2030-and-the-european-green-deal (accessed December 23, 2022).
Sachs, J., Traub-Schmidt, G., Kroll, C., Lafortune, G., and Fuller, G. (2021). The Decade of Action for the Sustainable Development Goals. Sustainable Development Report 2021. Cambridge: Cambridge University Press. doi: 10.1017/9781009106559
Stapler, R. W., and Johnston, R. J. (2009). Meta-analysis, benefit transfer, and methodological covariates: implications for transfer error. Environ. Resour. Econ. 42, 227–246. doi: 10.1007/s10640-008-9230-z
Statista (2020). Projected Global Median Age From 1950 to 2100. StatistaResearch Department. Available online at: https://www.statista.com/statistics/672669/projected-global-median-age/
TEEB (2010). The Economics of Ecosystems and Biodiversity: Mainstreaming the Economics of Nature: A Synthesis of the Approach, Conclusions and Recommendations of TEEB. London: TEEB.
Turner, R. K., Paavola, J., Cooper, P., Farber, S., Jessamy, V., and Georgiou, S. (2003). Valuing nature: lessons learned and future research directions. Ecol. Econ. 46, 493–510. doi: 10.1016/S.0921-8009(03)00189-7
UNEP-WCMC (2011). Marine and Coastal Ecosystem Services - Valuation Methods and Their Practical Application, Biodiversity Series No. 33. Cambridge: UNEP-WCMC.
Vassilopoulos, A., and Koundouri, P. (2017). Valuation of Marine Ecosystems. Oxford: Oxford Research Encyclopedia of Environmental Science.
Vörösmarty, C. J., Osuna, V. R., Cak, A. D., Bhaduri, A., Bunn, S. E., Corsi, F., et al. (2018). Ecosystem-based water security and the Sustainable Development Goals (SDGs). Ecohydrol. Hydrobiol. 18, 317–333. doi: 10.1016/j.ecohyd.2018.07.004
Keywords: valuation, Sustainable Development Goals, ecosystem services, meta-regression, marine, freshwater
Citation: Koundouri P, Halkos G, Landis C, Dellis K, Stratopoulou A, Plataniotis A and Chioatto E (2023) Valuation of marine ecosystems and Sustainable Development Goals. Front. Environ. Econ. 2:1160118. doi: 10.3389/frevc.2023.1160118
Received: 06 February 2023; Accepted: 02 June 2023;
Published: 26 July 2023.
Edited by:
Helena Vieira, University of Aveiro, PortugalReviewed by:
Casper Boongaling Agaton, University of the Philippines Los Baños, PhilippinesEleni Sardianou, Harokopio University, Greece
Kerry Turner, University of East Anglia, United Kingdom
Copyright © 2023 Koundouri, Halkos, Landis, Dellis, Stratopoulou, Plataniotis and Chioatto. This is an open-access article distributed under the terms of the Creative Commons Attribution License (CC BY). The use, distribution or reproduction in other forums is permitted, provided the original author(s) and the copyright owner(s) are credited and that the original publication in this journal is cited, in accordance with accepted academic practice. No use, distribution or reproduction is permitted which does not comply with these terms.
*Correspondence: Phoebe Koundouri, cGhvdW5kb3VyaUBhdWViLmdy
 Phoebe Koundouri
 George Halkos5
 Conrad Landis
 Artemis Stratopoulou