 Agness Mzyece1†
 John N. Ng'ombe
- 1College of the Arts, Humanities and Social Sciences, California State University Stanislaus, Turlock, CA, United States
- 2Department of Agricultural Economics, Kansas State University, Manhattan, KS, United States
- 3Department of Agribusiness, Applied Economics and Agriscience Education, North Carolina Agricultural and Technical State University, Greensboro, NC, United States
Introduction: While crop diversification indices are relatively simple and useful for quantifying the extent of crop diversification, they may not account for the potential differences in the types of crops grown. This study shows the need to complement crop diversification indices with an enterprise structure approach to improve index-based crop portfolio decision making.
Methods: The study uses linear regression models and nationally representative farm survey data from 7,934 farmers in Zambia. The study compares the enterprise approach and the Simpson index of diversification which is commonly used in crop diversification studies.
Results and discussion: We find that complementing the enterprise structure approach with the Simpson index of diversification can increase profitability by as high as 77.89% for farmers. The cassava enterprise structure had the most returns for farmers. It had a gross margin of ZMW 3,887 per hectare and was trailed by the maize/groundnuts/cotton/rice enterprise structure with a gross margin of ZMW3,681 per hectare. These results suggest that the use of aggregation crop diversification indices, without an additional enterprise structure analysis, may obscure the necessary insights needed to practically help farmers.
1. Introduction
Crop diversification indices are used to measure the number and evenness of crop species or varieties in a farm's crop portfolio (Mzyece and Ng'ombe, 2020, 2021). Due to their relative simplicity and usefulness as a comparison method, diversification indices have become popular for quantifying the extent of crop diversification. However, given their focus on the number and proportion of crops in a portfolio, crop diversification indices may not account for the potential differences in the types of crops grown. That is, a farmer growing crops A and B would be considered to have the same degree of diversification as another farmer growing crops C and D if the proportion of the two crops in their portfolios are the same (Mzyece, 2020). The failure to account for differences in the types of crops involved in diversification suggests that the indices cannot capture the effects of economies of scope among crops in a portfolio.
Economies of scope imply that the joint cost of producing two or more crops in a given portfolio is less than the sum of the costs of producing each crop by itself (Nayyar, 1993). For example, economies of scope for a smallholder farmer producing two crops such as maize and groundnuts exists when the cost of producing maize and groundnuts together (i.e., in one field/plot) is lower than the cost of producing the two crops separately (on different fields/plots). This is because the farmer may cost save by using the same inputs for both crops. For example, one weeding would apply to two crops, whereas if the two crops were produced separately, weeding costs would double as each crop would require its own weeding. In general, cost savings (or economies of scope) arise when two enterprises or crops share some unique factor of production (Ansoff, 1965; Rumelt, 1974; Teece, D. J., 1980; Chavas and Kim, 2010).
The failure of diversification indices to capture such economies of scope implies that indices cannot be insightful in helping farmers identify superior diversification strategies (Mzyece, 2020; Maggio and Sitko, 2021). The numerical focus of diversification indices also makes it difficult to translate the results of their effects into practical recommendations for practitioners. For example, if the crop diversification index is found to have a positive (negative) significant effect on farm performance, a follow-up recommendation may be to encourage farmers to grow more (less) of the crops in the portfolio. But the index does not suggest which crops should be included or excluded in a recommended production portfolio leaving farmers with the responsibility of choosing which crops to add or remove. Thus, giving production recommendations based on a diversification index is analogous to a medical doctor issuing a prescription without specifying the dosage.
Fortunately, a complementary approach to crop diversification indices called the enterprise structure approach has recently been introduced by Mzyece (2020). The enterprise structure approach is touted to override some of the limitations of diversification indices. Mzyece (2020) defines an enterprise structure as a farmer's chosen combination of crops and cropping systems. For example, a farmer growing maize on one field and soybean on another would have a maize/soybean enterprise structure, which would be different from that of a farmer growing maize and soybean in the same field as a mixed crop. Also, the maize/soybean enterprise structure would be different from that of a farmer growing sunflower and cassava on different plots even though the proportion of sunflower and cassava was the same as that of maize and soybean in these respective portfolios. The enterprise structure approach also recognizes farmers specializing in different crops as using different enterprise structures.
Compared to the diversification index, the enterprise structure approach accounts for heterogeneity in different crop portfolios and provides clearer and more detailed information on which specific crop portfolios are associated with identified performance indicators. Thus, the enterprise structure approach can facilitate the provision of useful recommendations to improve desired outcomes from index-based crop diversification decisions. That is, once a diversification index has been used to assess whether growing more or fewer crops is more beneficial for farmers, the enterprise structure approach can then be used to guide the construction of crop portfolios that produce desired objectives.
The objective of this study is to expound on how the two approaches are complementary for evaluating diversification decisions. Specifically, we show that a diversification index (in this case the Simpson index) and the enterprise approach play complementary roles by increasing profitability for farmers when used together. While there are many diversification indices, we use the Simpson diversity index (Simpson, 1949) because it is one of mostly commonly used diversification indices in agricultural and applied economics (e.g., Jarvis et al., 2008; Rajendran et al., 2017; Deng et al., 2018; Muthini et al., 2020; Mzyece and Ng'ombe, 2020, 2021; Ecker and Hatzenbuehler, 2022; Momeni and Antipova, 2022; and many others). Other diversification indices that have been used in the applied literature are summarized in Table 1. In Table 1, the variable Ai is defined as the land area allocated to crop Ai or the income contributed by crop i, and S is the number of crops. Table 1 shows that a common characteristic of diversification indices is that they only take into account the number and the relative proportion of crops in a portfolio (Tabner, 2007). Our study can help practitioners and researchers understand the forgone benefits they should consider when evaluating crop diversification decisions using crop diversification indices alone in lieu of complementing the diversification indices with an enterprise structure approach.
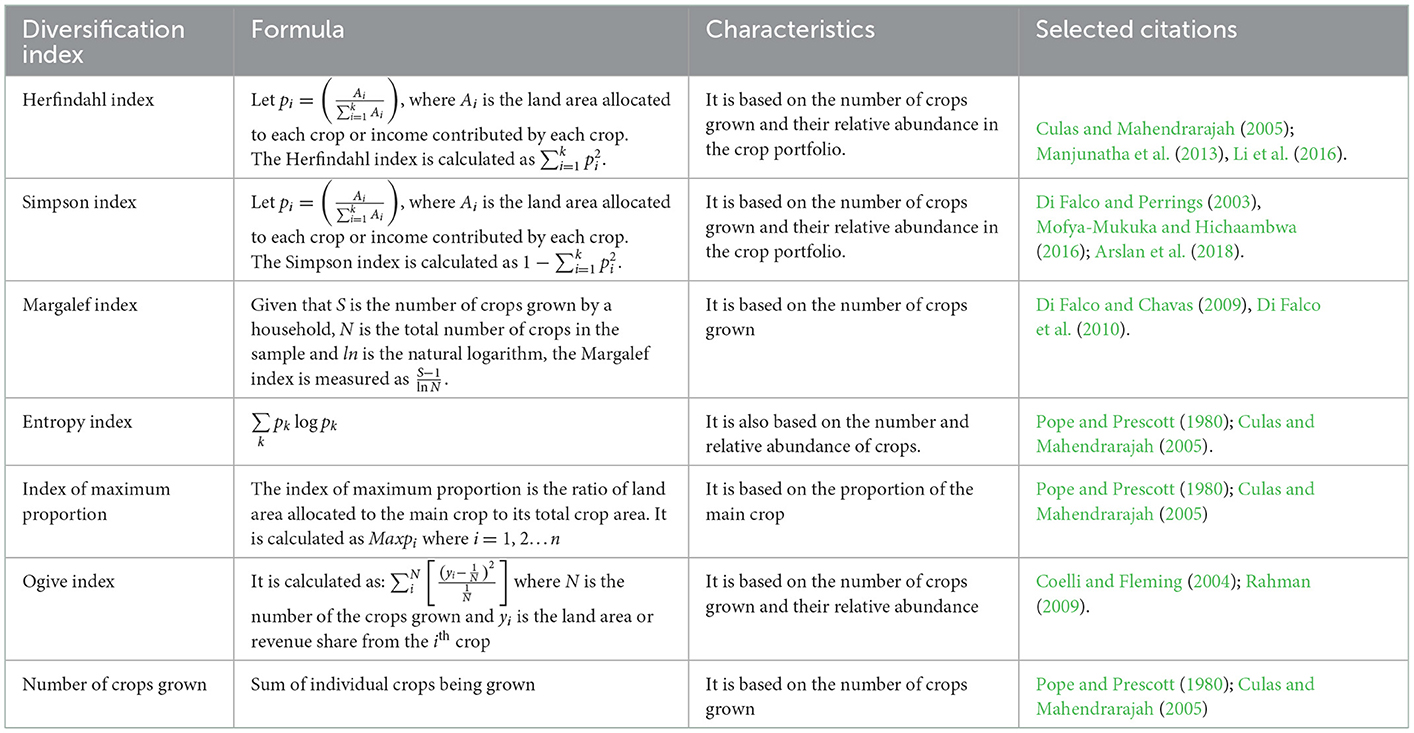
Table 1. List of common diversification indices.
2. Literature review
In principle, crop diversification is considered as a sustainable agricultural strategy because of its potential ecological benefits (Lin, 2011) that translate into cost savings (Rahman, 2009; Arslan et al., 2018) and increased incomes (Guvele, 2001; Makate et al., 2016). Given its potential implications on farmer welfare, several governments and international development agencies/organizations [e.g., US Agency for International Development, the Food and Agricultural Organization (FAO), World Bank (WB), and the Intergovernmental Panel on Climate Change (IPCC)] have continuously increased their support for crop diversification (Mzyece, 2020). Given this increased support, many empirical papers have evaluated impacts of crop diversification on various outcomes using diversification indices (e.g., Llewelyn and Williams, 1996; Coelli and Fleming, 2004; Haji, J., 2007; Rahman, 2009; Di Falco et al., 2010; Maggio et al., 2018, and Arslan et al., 2018; Mzyece and Ng'ombe, 2020, 2021 and others).
In evaluating diversity decisions by economic agents, Diversification indices have become useful because of their simplicity and aggregation advantages. Prominent diversification indices include the Herfindahl index (Herfindahl, 1950), the Simpson index (Simpson, 1949), and the Margaleaf index (Margalef, 1958). These indices have been adopted to study the effects of crop diversification on farm performance by many researchers (e.g., Llewelyn and Williams, 1996; Coelli and Fleming, 2004; Haji, J., 2007; Rahman, 2009; Di Falco et al., 2010; Arslan et al., 2018; Maggio et al., 2018). In addition to diversification and performance, others have used indices to explain the role of diversification in risk management (Just and Candler, 1985; Smale et al., 1998; Di Falco and Chavas, 2009; Arslan et al., 2018; Maggio et al., 2018).
Diversification indices are however limited in providing useful insights about diversification decisions. Herfindahl (1950), the pioneer of the Herfindahl index cautioned that his index would to some extent, misrepresent situations whose outcome was actually dependent on many other factors. Adelman, M. A. (1969) also consented that two different portfolios would have the same index and therefore the index could mask the real structure of the portfolio. Green (1979) and Ludwig and Reynolds (1988) also criticized diversification indices as approaches that over-simply highly complex systems into simple measures.
Maggio et al. (2018) attempted to improve upon the diversification indices by using an approach that considered combinations of crops from different crop groups (legumes, staples, cereal, cash crops) as being different forms of diversification. They examined the determinants and impacts of the following diversification portfolios: (i) a maize-only portfolio; (2) a maize/legume portfolio; (3) a maize/staples portfolio; (4) a maize/cash crop portfolio; (5) a maize/legume staples portfolio; (6) a maize/legume/cash crop portfolio; and (7) a maize/legume/staples portfolio. Their results showed that portfolios that had legumes resulted in better outcomes.
The approach by Maggio et al. (2018) is an improvement upon the diverfication index approach in that it accounts for heterogeneity in crop groups. However, it does not account for differences in crops within a crop group because it assumes that all crops in a particular crop group are similar. That is, their approach would consider growing maize and groundnuts on different fields to be the same diversification strategy as growing maize and soybeans on different or on the same field because both groundnuts and soybeans are legumes. However, based on market characteristics, profitability from a maize/groundnuts portfolio may be very different from that of a maize/soybean portfolio. Therefore, for a more complete understanding of the effects of crop diversification, a more detailed dissaggregation of crops is required.
The enterprise structure approach provides this required depth of disagregation by considering each unique crop, crop combination and cropping system used, to result in different diversification strategies. This approach complements the index approach as well as the approach by Maggio et al. (2018), by facilitating more specific recommendations regarding which crops to diversify into or out of. This paper aims to shed light on the benefits of complementing the index approach with the enterprise structure approach. We hypothesize that the profitability is higher for farmers when diversification recommendations are based on both the enterprise structure approach and the index approach compared to when recommendations are based on the index approach alone.
3. Methods and materials
3.1. Theoretical framework
This study is based on the theory of economies of scope (Panzar and Willig, 1981). Suppose a profit-maximizing farm operator is producing m outputs using n inputs. Let yi and pi be the output and price of good i, respectively and let xj and wj be the quantity and price of input j, respectively. Y is a vector of outputs (y1, yi⋯ym) and X is a vector of inputs (x1, xj⋯xn). A farm operator is faced with the following optimization problem:
By solving this optimization problem, we can find the optimal input levels which can then be used to determine the cost function, c(yi, pi) for a firm producing one output and the cost function, c(Y, P) for a firm producing m outputs.
Economies of scope exist if:
or if:
A sufficient condition for a multiproduct cost function to exhibit overall economies of scope is the existence of cost complementarities (synergies) among the different outputs being produced (Baumol et al., 1982). If crop portfolios differ in their extent of cost complementarity, then different crop portfolios may be expected to differ in scope economies and, therefore, in profitability even if the portfolios have the same number of crops. Therefore, in the context of this study, economies of scope advantages in a given portfolio would show up as cost savings and therefore as higher profitability. The underlying assumption in the enterprise structure empirical analysis is, therefore, that crop portfolios with stronger scope economies are more profitable than those with weak scope economies.
3.2. Data and procedures
This study uses secondary data from Zambia's 2015 Rural Agricultural Livelihoods Surveys (RALS). The RALS is a nationally-representative survey designed and implemented by the Indaba Agricultural Policy Research Institute (IAPRI), the Central Statistical Office and the Ministry of Agriculture in Zambia. The goal of the survey was to study alternatives for improving crop production, marketing and food consumption among smallholder farmers in Zambia. The sample of the survey focused on households cultivating less than 20 hectares.
The 2015 RALS had a sample size of 7,934 households randomly sampled using a two-stage stratified sample design. The first stage involved identifying the Primary Sampling Unit (PSU) based on Zambia's 2010 population census sampling frame. A PSU is defined as one or more Standard Enumeration Areas (SEAs) with a minimum of 30 agricultural households. The second stage involved identifying agricultural households from a list of all households in the PSU. Thereafter, systematic sampling was used to select 20 agricultural households in each PSU. A total of 476 PSUs across all the 10 provinces of Zambia were covered during sampling. We preferred to use the RALS dataset because of its national representation, wide crop coverage, and high quality of data.
Table 2 shows that, on average, farmers realized a gross margin per hectare of ZMW 2,485.09/ha, equivalent to about $388.3/ha. About 76% were male-headed households with an average age of 48 years and formal education years of 5.8 years, all of which compare well with Zambia's 2013–2014 Post Harvest Survey. The production characteristics of farmers in the sample show that the average quantity of fertilizer applied was 111.81 kg/ha. This is close to the national average fertilizer application rate of between 100.7 and 120.7 kg/ha as reported by Chapoto and Chisanga (2016). To account for variability among households who used improved seed, we computed the proportion of area planted on which households used improved seed. Table 2 shows that, on average, households used improved seed on 56% of the land area planted. With respect to crop rotation, 48% of households reported rotating cereals with nitrogen fixing crops between the 2013 and 2014 agricultural seasons.

Table 2. Sample summary statistics (N = 7,393).
Table 2 shows farmers' location by their agro-ecological zone (AEZ). Zambia has heterogenous environmental and climatic conditions that vary by four AEZs (FAO, 1973; Ng'ombe, 2017). These include AEZ I, AEZ IIa, AEZ IIb, and AEZ III. AEZ I is steep and flat by topography and has river valleys in both the east and south. It has an annual rainfall distribution of up to 700 millimeters (mm) (FAO, 1973; Ng'ombe, 2017). AEZ IIa has annual rainfall distribution of between 800 and 1,000 mm and has haplic lixisol soils with central plateaus while AEZ IIb has ferrallic arenosols soils on western plateaus with rainfall of around 1,000 mm. annually. AEZ III is characterized by acidic haplic acrisols soils and covers most of Zambia's north and north-western parts. In terms of rainfall, AEZ III receives annual rainfall of at least 1,000 mm (FAO, 1973).
Table 2 indicates that majority of farmers were located in AEZ IIa and III, with 40% and 43% of the farmers in the sample being located in these zones, respectively. This could be attributed to the large surface areas of regions AEZ IIa and III [42% and 46% of the country's surface area, respectively (Zamseed, 2019)] which allow them to accommodate more households. AEZ I and IIb, on the other hand, individually account for only 8% of the sample each.
The variables of interest in this study are the Simpson index of diversification (SID), the enterprise structure (EP), and profitability (gross margin per hectare). To construct the enterprise structure that each household was using, we used plot-level data from RALS to identify what crop or crops were grown in each plot and the cropping pattern being used in the plot. A plot with a single crop grown was categorized as a monocrop plot. A plot with a mixture or intercrop of more than one crop was categorized as a plot with mixed cropping. The collection of all monocrop and/or mixed crop plots formed the enterprise structure of the firm. There were thousands of unique enterprise structures in the data because each crop portfolio would result in a unique enterprise structure when a different cropping system was used on either all plots or just some of the plots.
The 33 EPs that were analyzed in this study are presented in Table 3. Table 3 shows that the most popular EP was the maize (Mz) EP which was used by 19.47% of the households. This EP represents farmers who are specializing in producing maize only. In the context of Zambia, the country's policy direction on crop diversification is to encourage farmers who are specialized in producing maize to diversify into other crops for purposes of managing climate change risks (Government of the Republic of Zambia, 2010). In estimating the effects of EPs on profitability, therefore, the Mz EP is the base variable against which other crop portfolios are compared. Besides the Mz EP, the cassava (Cs) EP is the only other EP that involves specialization in this study. Among the rest of the 30 Eps, 12 involve diversification with two crops, another 12 involve diversification with three crops, five involve diversification with four crops while only two involve diversification with five crops. Table 3 further shows that, of the 33 EPs, 30 include maize in the crop portfolio suggesting that Zambia is a maize-centric country. Table 3 also shows the average gross margin associated with each EP. These descriptive statistics show that Cs is the most profitable EP with a gross margin per hectare of ZMW 3,887.22 followed by Mz/Gn/Ct/R which has a gross margin per hectare of ZMW 3,681.31. The high gross margin per hectare associated with the Cs EP should be interpreted with caution because it was measured as the total amount of mature cassava produced, both harvested and unharvested. The least profitable EP is Mz/Ml with a gross margin per hectare of ZMW 1,350.54 followed by Mz/Sf with a gross margin per hectare of ZMW 1,780.73.
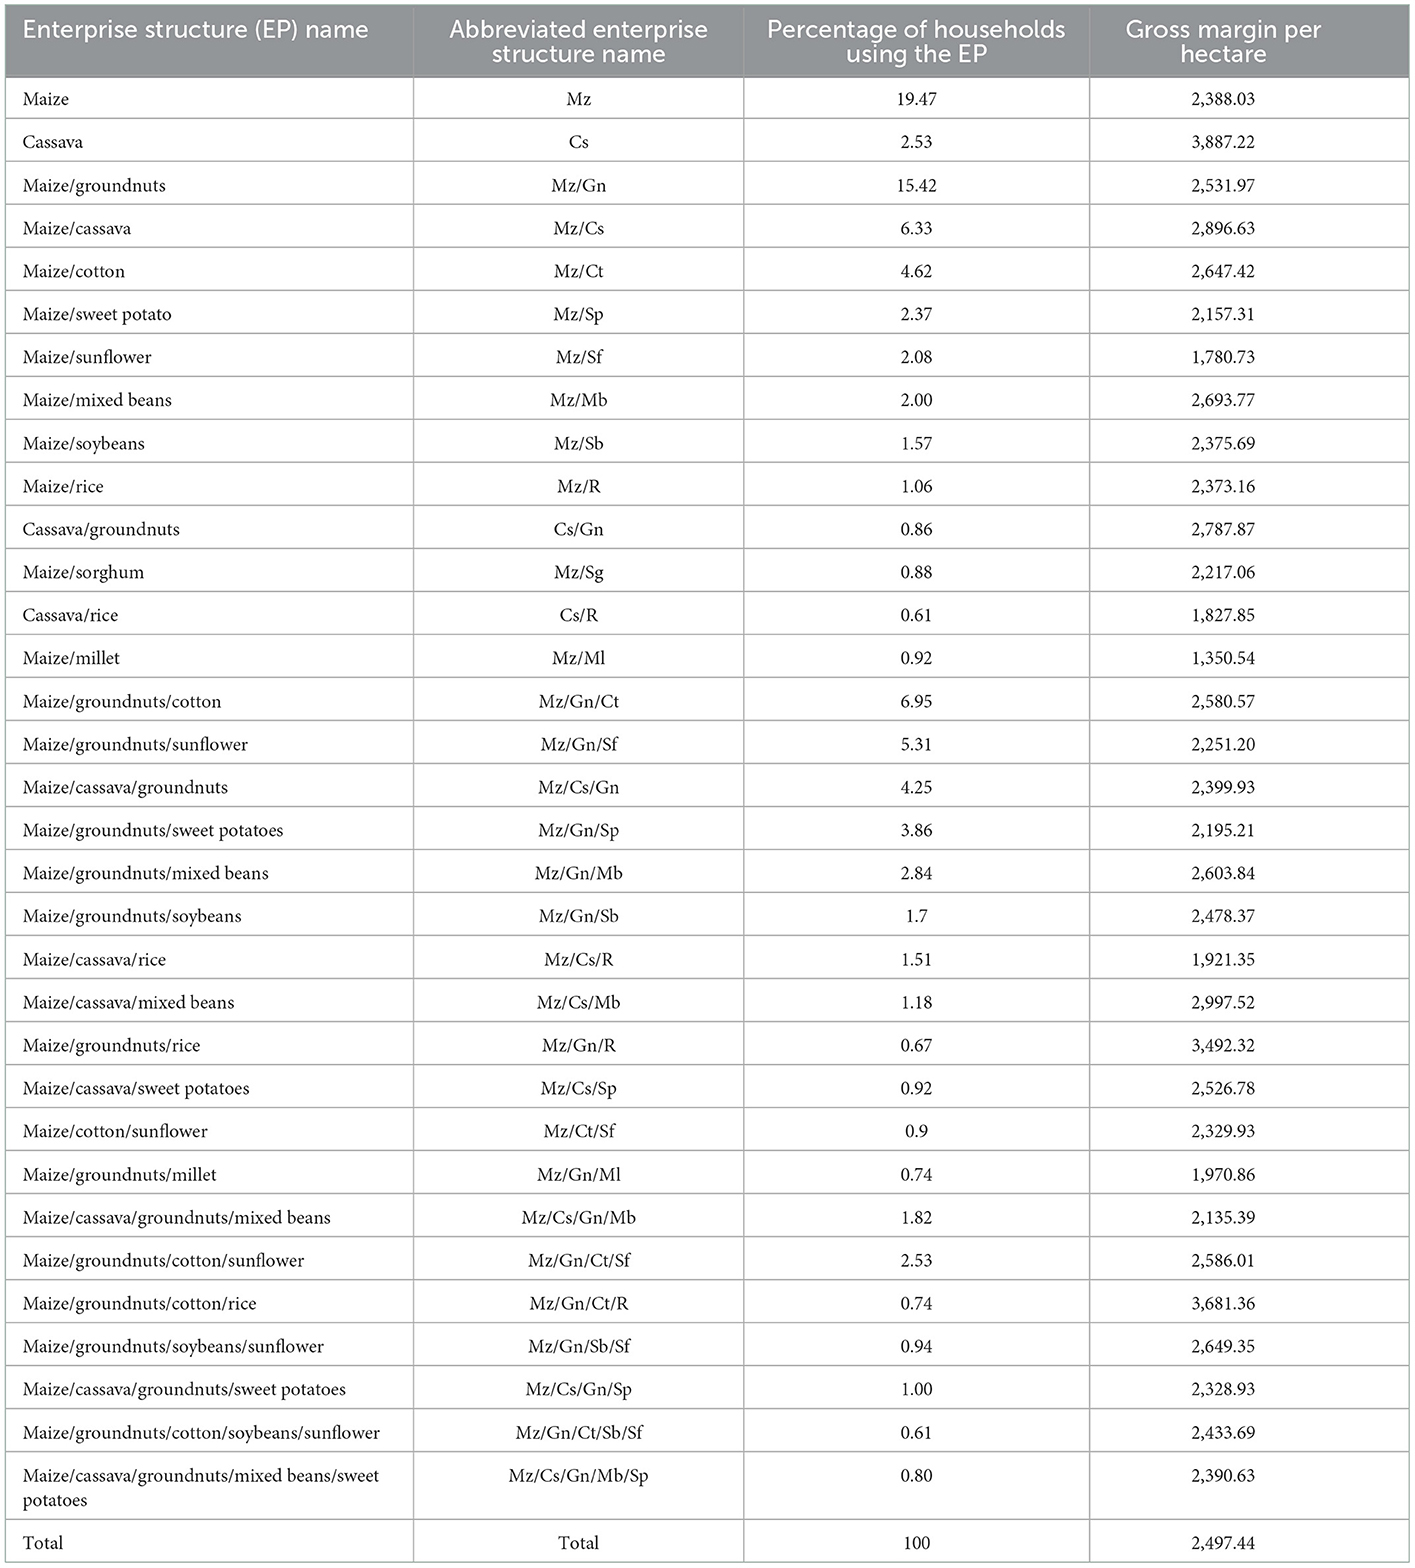
Table 3. Names of enterprise structures and percentage of households using them.
3.3. Empirical framework
To estimate the change in profitability associated with a crop diversification index and enterprise structure, we compare results from three models that examine the effect of crop diversification on profitability. The first model measures crop diversification using the Simpson index of diversification structured as a continuous variable, the second model measures crop diversification using the Simpson index structured as a dichotomous variable [Specialized (0 ≤ SID ≤ 0.5) and Diversified (0.5 ≤ SID ≤ 1)]. The third model measures crop diversification using the enterprise structure. The dependent variable in this study is crop profitability, defined as gross margin per hectare. For all three model, we estimate linear models using Ordinary Least Squares (OLS) after testing and correcting for all classical linear assumptions except for potential endogeneity. Testing for endogeneity would require collapsing the enterprise structure variable (a dummy variable with 33 categories in this study) into an index for which an instrumental variable can be identified. Since the goal of the study is to compare the results of the index approach alone to the results of complementing the index with an enterprise structure, we proceed to estimate the models without accounting for endogeneity. In the presence of endogeneity, this study would only provide suggestive results (Michler and Josephson, 2017) and would provide a springboard for future studies considering the enterprise structure framework.
The dependent variable, gross margin per hectare is calculated as gross margin divided by hectares planted. Gross margin is calculated as crop revenue (based on harvested output) less total variable costs. Calculating crop revenue based on harvested output eliminates the need to separate home consumption from the analysis. Production cost is determined using only purchased inputs: fertilizer; hired labor; and transportation. Seed and herbicide costs were unavailable and were, thus, not included. The two independent variables of interest are the SID and EP. The formula for the SID is as shown in Table 1, where 0 ≤ SID ≤ 1, in which 0 means no diversification and 1 means maximum diversification. The EP is a unique crop portfolio constructed as the combination of the different crops that a household grew. It is expected that the number of potential EPs in this study would be large making it difficult to compare each EP to a base category. However, to be able to draw statistical inferences, we focus on the EPs that were adopted by at least 30 farm households because a sample size of at least 30 often increases the confidence interval for the respective parameters in statistical inference (Hogg et al., 2015). This limits our empirical analysis to 33 EPs and reduces our sample size from 7,393 to 4,895. The list of these 33 EPs are presented in Table 3.
Given that π is gross margin per hectare, SID is the Simpson index, EP is the enterprise structure, βi and αi are the parameters being estimated, xi are the control variables while u and e are IID normally distributed error terms with zero mean and constant variance, the models estimated are as follows:
From Model 1, if β1 is positive and significant, then as farmers become more diversified, their gross margin per hectare increases significantly. A policy recommendation from such a result would be to encourage farmers to grow more crops, without specifying which crops those should be. Likewise, if β1 is negative and significant, then gross margin per hectare may be increased by growing fewer crops. In Model 2, the Simpson index has been dichotomized into a categorical variable (Specialized and Diversified) by creating a threshold in which an index of between 0 and 0.5 implies specialization while an index of between 0.5 and 1 implies diversification. If α1 is positive and significant in this model, it would imply that being diversified is associated with higher profitability than being specialized, and vice versa if α1 is negative. From Model 3, EPj is a categorical variable of the different crop portfolios. Therefore, δj represents a series of parameters which compare the effect on gross margin per hectare of each crop portfolio to a base category. We estimate profitability/loss from diversifying on the basis of recommendations from an index by examining the size of δj that would be foregone if farmers diversified on the basis of an aggregate effect (β1).
The control variables included in this study include: gender, age, household size, asset value, access to input subsidy, and farm size. Gender represents differences in production choices between male and female farmers because of their differences in access to institutional services and opportunities (The World Bank, 2008; Addai et al., 2022) while age of the household head, has been shown to positively affect profitability (Purdy et al., 1997; Mishra et al., 1999). Household size is a proxy for the production and consumption situation facing each household while education of the household head is included as it has been shown to influence productivity and management ability among farmers (Randela et al., 2008). Asset value is used as a proxy for wealth and access to subsidy is considered as it can reduce the out-of-pocket expenditure on production. We use farm size to control for differences in economies of scale (Poon and Weersink, 2011). Following Ng'ombe et al. (2017) and Lu et al. (2021), we also control for fertilizer use, improved seeds and crop rotation which affect crop yields.
To account for the effect of weather and soil conditions on the profitability of different crop portfolios and of the Simpson index, we refrain from simply controlling for agro-ecological location. Instead, we estimate Models 1, 2 and 3 in each AEZ so that the results of the study are applicable to farmers in those locations.
The enterprise structure does not show how differences in proportions of crops in a portfolio would affect profitability. To shed light on how the proportions of individual crops affect profitability, we explore the effects of portfolio rebalancing (changing the proportions of crops in a portfolio) on its profitability. We do this by regressing the proportions of individual crops in an EP on the gross margin per hectare of the EP while controlling for other explanatory variables.
4. Results
4.1. How enterprise structures and the Simpson index of diversification relate with profitability and crop revenue
Table 3 showed the average profitable associated with each EP. Besides differences in demographic, socio-economic, production, and environmental characteristics, the differences in profitability of the EPs are also due to differences in cost complementarities among crops in the respective portfolios. This study examines the effects of EPs on profitability, but does not examine the sources of potential cost complementarities among crops in the different EPs.
The empirical results of how SID and EP relate to farm profitability in AEZ I are presented in Table 4. The results show that SID has no statistically significant relationship with profitability in AEZ I, whether SID is measured as a continuous or categorical variable. The coefficient on SID_Diversified is not statistically significant in the second model showing that there is no statistical difference in gross margin per hectare between farmers who are diversified and those who are not. Based on the EP model, the results show that two out of the three EPs in AEZ I have a statistically significant relationship with gross margin per hectare. From among the three EPs (Mz/Ct, Mz/Gn and Mz/Gn/Ct) in AEZ I that were compared to the Mz EP (base category), the results show that profitability from the Mz/ct and Mz/Gn/Ct EPs was statistically different from that of the Mz EP at 5% and 10% significance levels, respectively. On the other hand, the results for the Mz/Gn EP were not statistically different from the Mz EP at 10% significance level. The results show that, relative to the Mz EP, using the Mz/Ct EP significantly resulted in increased GM/ha by 63.23% in AEZ I at 5% significance level, holding all else constant. Further, relative to the Mz EP, using the Mz/Gn/Ct EP significantly led to an increase in GM/ha by 48.88% in AEZ I at 10% significance level, holding all else constant.
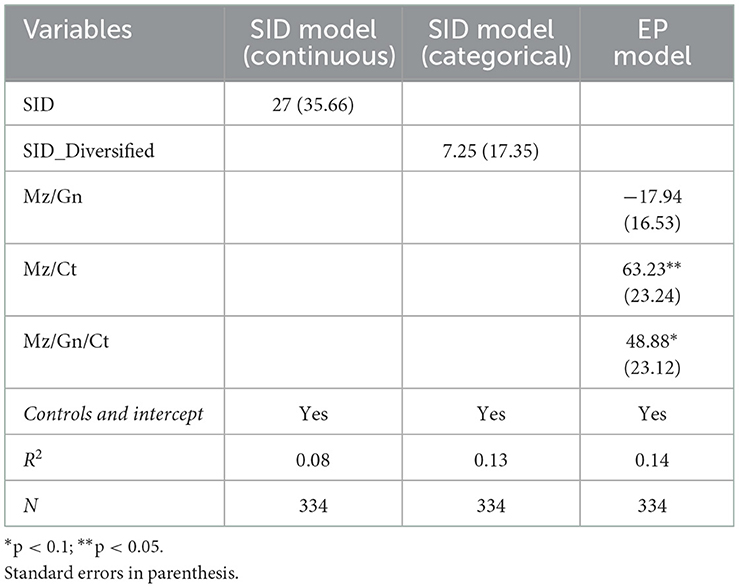
Table 4. Marginal effects (%) of the effects of the Simpson index and enterprise structure on gross margin per hectare in agro-ecological zone I.
The results of the relationship between SID, EP and gross margin per hectare in AEZ IIa are presented in Table 5. The results show that SID has a positive and statistically significant relationship with profitability in AEZ IIa. Specifically, a one-unit increase in SID is significantly associated with a 43.62% increase in profitability in AEZ IIa (p < 0.001). When SID is categorized in the second model, the results also show that farmers who are diversified have 13.88% more profitability than those who are specialized in AEZ IIa at 1% significance level. Based on the EP approach, among the 14 EPs analyzed in AEZ IIa, the results for seven EPs were statistically significant at 10% significance level. For example, the results in Table 5 show that relative to the Mz EP, using the Mz/Gn/Ct/Sf EP significantly leads to a 54.34% increase in profitability in AEZ IIa at 1% significance level, holding all things constant. Other EPs that significantly lead to an increase in GM/ha (at 10% significance level) relative to the Mz EP in AEZ IIa are Mz/Gn/Ct, Mz/Ct, Mz/Gn/Sb, Mz/Ct/Sf as well as Mz/Gn. In line with the SID model results, these portfolios that are statistically more profitable than Mz involve a minimum of two crops. The results of the EP model show that other diversified portfolios in AEZ IIa have a gross margin per hectare that is not statistically different from that of the Mz EP. These EPs include Mz/Sp, Mz/Sf, Mz/Sb, Mz/Gn/Sf, Mz/Gn/Sp, Mz/Gn/Mb, and the Mz/Gn/Sb/Sf.
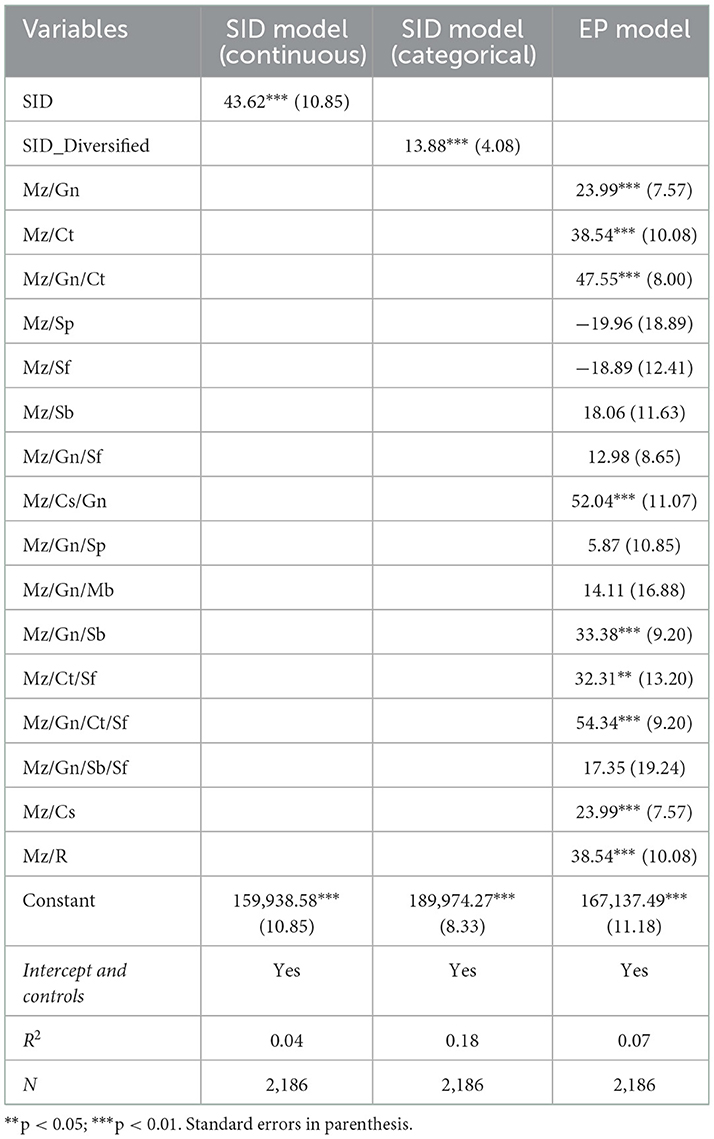
Table 5. Marginal effects (%) of the effects of the Simpson index and enterprise structure on gross margin per hectare in agro-ecological zone IIa.
For AEZ IIb, the results in Table 6 show that the SID has no statistically significant association with profitability. Based on the model in which SID is categorized, the results show that farmers who are diversified have 31% less profitability than those who are specialized. In this regard, the dichotomous SID model shows slightly different results from the continuous SID model. Using the EP approach, the results show that four EPs have a positive significant relationship with gross margin per hectare, relative to the Mz EP. Using the Mz/Cs EP or Mz/Cs/Gn EP results in increased profitability by 40.07 and 42.33%, respectively, both with p < 0.1. On the other hand, profitability from using the Mz/Cs/R EP is not statistically different from that of the Mz EP.
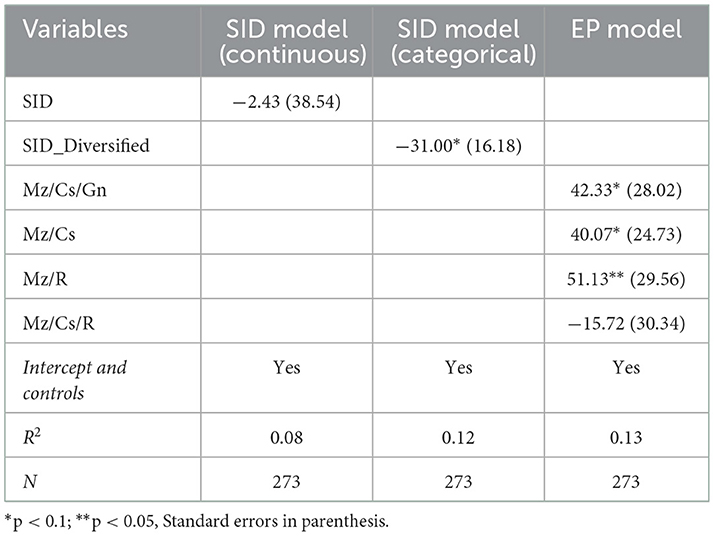
Table 6. Marginal effects (%) of the effects of the Simpson index and enterprise structure on gross margin per hectare in agro-ecological zone IIb.
From Table 7, the results of the SID model suggest that the extent of crop diversification has no relationship with profitability, both using the continuous SID variable and the dichotomous SID variable in AEZ III. By accounting for heterogeneity in crop portfolios using the EP approach, the results show that specializing in Cs results in statistically higher profitability than specializing in Mz. The results show that relative to the Mz EP, using the Cs EP significantly leads to increased GM/ha by 77.89% in AEZ III at 1% significance level, holding all things constant. The EP model also shows that Mz-only farmers may increase their profitability by 16.42% by diversifying into the Mz/Cs EP.
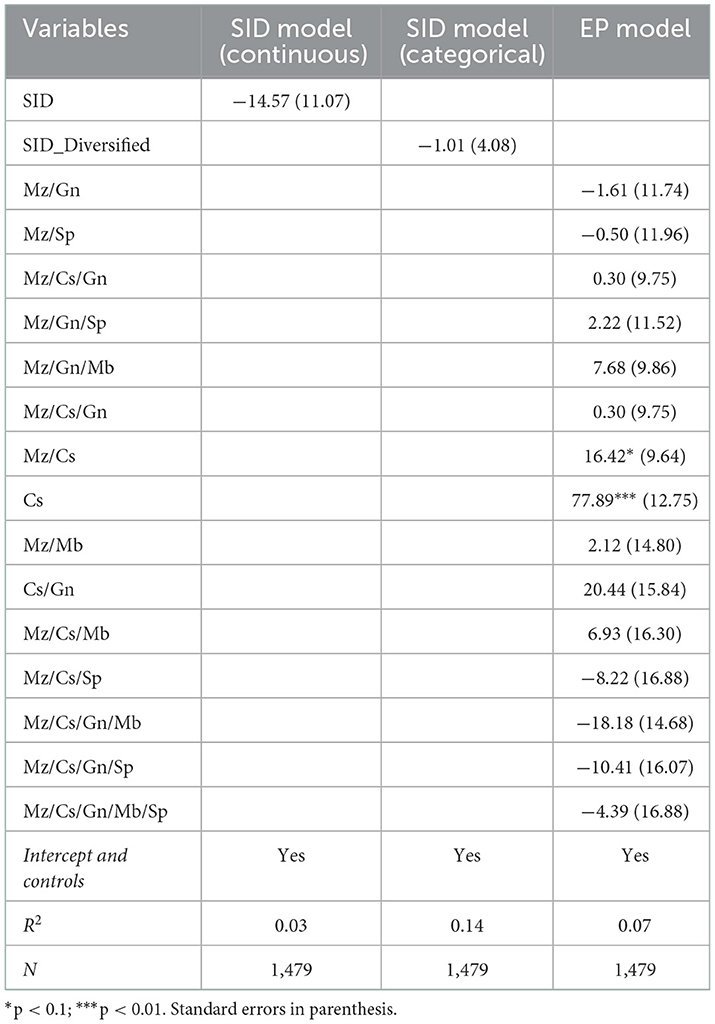
Table 7. Marginal effects of the effects of the Simpson index and enterprise structure on gross margin per hectare in agro-ecological zone III.
4.2. Portfolio rebalancing of the enterprise structure
Clearly, one of the shortcomings of the EP approach is that it does not account for differences in the proportion of crops grown in each EP. A necessary step in using enterprise structures is to explore portfolio rebalancing. Portfolio rebalancing is the process of adjusting the proportions of assets (in this case, crops) in a portfolio to achieve a certain desired level of asset allocation (Willenbrock, 2011).
In our portfolio rebalancing analysis, we checked for statistical differences in profitability across farmers with different proportions of crops in the same EP. Because of the small number of farmers who were using the exact same proportions of crops in a given EP, we categorized farmers into four groups based on the proportion of a given crop in the EP. These four groups were: (1) farmers with <25% of a given crop in the EP; (2) farmers with more than 25% but <50% of a given crop in the EP; (3) farmers with more than 50% but <75% of a given crop in the EP; and (4) farmers with more than 75% of a given crop in the EP. The proportions were calculated based on the contribution of individual crops to the revenue of the EP. For example, for farmers using the Mz/Sb EP in AEZ I, we compared the profitability of farmers with <25% of maize in the portfolio to those with more than 25% but <50% of maize, to those with more than 50% but <75% of maize and to those with more than 75% of maize revenue in their portfolio. In the context of this study, portfolio rebalancing implies that, in the next growing season, farmers may choose the same EP but may adjust the proportion of crops in the EP. The change in the proportion of crops in the EP could be due to various reasons such as responding to changes in prices or weather. A rebalanced portfolio may lead to an incremental return if well-done (Willenbrock, 2011). The portfolio rebalancing analysis attempts to predict potential effects on profitability of changing the proportion of crops in the same EP.
Table 8 shows the OLS results for the effect on profitability of different maize proportions in each EP in AEZ I. The results show that changes in the proportion of maize or groundnuts have no statistically significant relationship with the profitability of the Mz/Gn EP at 10% significance level. That is, maize and groundnuts have similar profitability profiles, such that a Mz/Gn EP with more maize and less groundnuts or vice versa would have similar relationships with profitability. Similarly, in the Mz/Ct EP, the profitability of Mz/Ct EPs with different proportions of maize and cotton are not statistically different at 10% significance level. The Mz/Gn/Ct EP also shows that the proportions of maize, groundnuts and cotton have no statistically significant effect on profitability of the EP at 10% significance level. This suggests that, for the Mz/Gn EP, Mz/Ct EP, and Mz/Gn/Ct EP in AEZ I, the size of contributions of the individual crops to the profitability of the EP are similar such that changing the proportion of crops in the EP does not statistically affect the profitability of the EP.
Table 8. Effect of crop proportions on enterprise structure profitability in agro-ecological zone I.
The OLS results for the effect of crop proportions on the profitability of EPs in AEZ IIa are presented in Tables 9, 10. Table 9 presents results for EPs that consist only of two crops while Table 10 presents results for EPs that consist of more than 2 crops. Like in AEZ I, Table 9 shows that the effects on profitability of the proportions of individual crops in AEZ IIa are not statistically significant except in the case of the Mz/Sp EP. In the Mz/Sp EP, the contribution of maize is statistically higher than that of sweet potato suggesting that farmers who adopt the Mz/Sp EP in AEZ IIa may increase their profitability by increasing the proportion of maize (and reducing the proportion of sweet potato) in the EP.
Table 9. Effect of crop proportions on enterprise structure profitability in agro-ecological zone IIa.
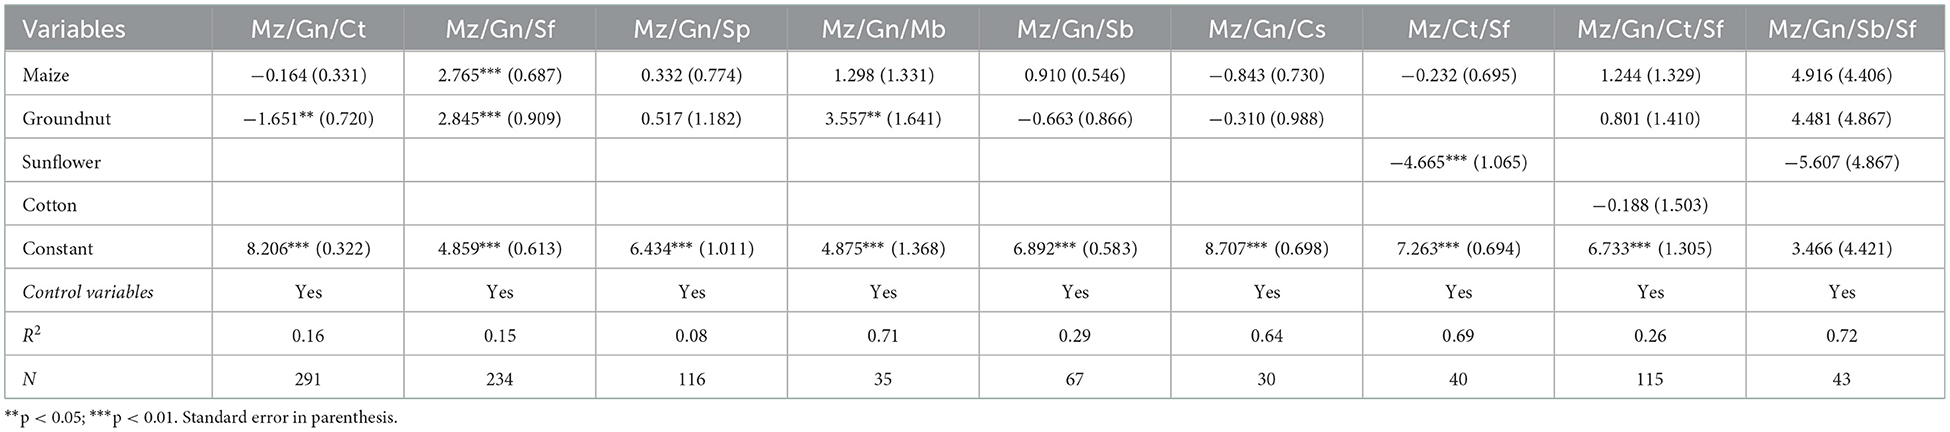
Table 10. Effect of crop proportions on enterprise structure profitability in agro-ecological zone IIa.
Table 10 shows that, increasing the proportion of cotton and reducing the proportion of groundnuts in the Mz/Gn/Ct EP may increase the profitability of this EP in AEZ IIa. Table 10 also shows that increasing the proportion of maize and groundnuts and reducing the proportion of sunflower in the Mz/Gn/Sf EP positively affects profitability of this EP at 1% significance level. Further, increasing the proportion of groundnuts and reducing the proportion of mixed beans in the Mz/Gn/Mb EP significantly increases profitability of this EP in AEZ IIa. The results therefore suggest that rebalancing crop portfolios in the Mz/SP, Mz/Gn/Ct, Mz/Gn/Sf, and Mz/Gn/Mb in AEZ IIa may result in higher profitability.
The results in Table 11 show that, in AEZ IIb, the proportion of crops in most EP does not have a statistically significant effect on the profitability of EPs at 10% significance level, except in the case of the Mz/Cs EP. An increase in the proportion of cassava and a reduction in the proportion of maize in the Mz/Cs EP in AEZ IIb has a positive association with profitability of this EP. A similar result is found in AEZ III, in which increasing the proportion of cassava and reducing the proportion of maize in the Mz/Cs EP also significantly leads to increased profitability of the EP.
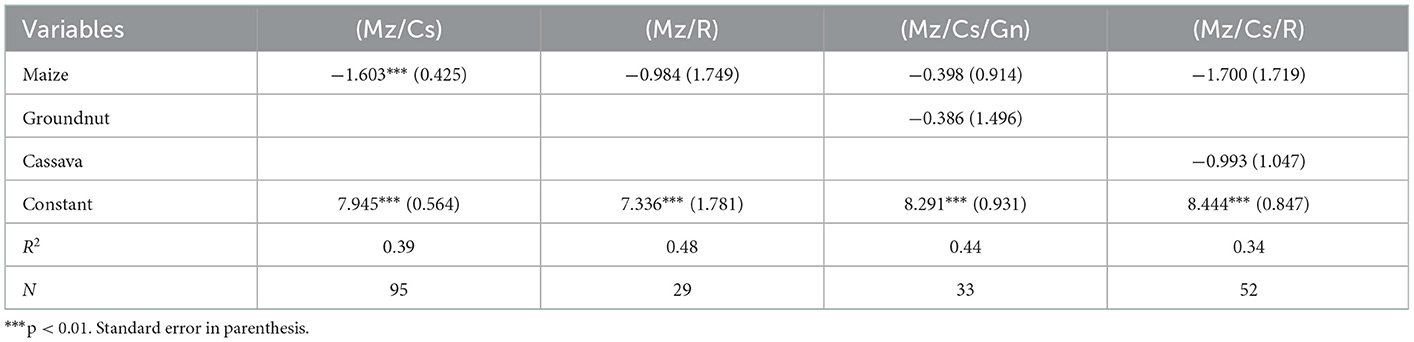
Table 11. Effect of crop proportions on enterprise structure profitability in agro-ecological zone IIb.
Likewise, increasing the proportion of cassava relative to other crops in the Cs/Gn, Mz/Cs/Mb and Mz/Cs/Sp also positively and significantly affects profitability in AEZ III. For other EPs, such as the Mz/Cs/Gn/Mb and the Mz/Cs/Gn/Sp, the proportion of crops has no significant effect on the profitability of the EP. The effects of crop proportions on EP profitability in AEZ III are presented in Tables 12, 13. The results suggest that because proportions are important, the EP approach to analyzing crop diversification needs to be accompanied with a portfolio rebalancing analysis to better determine the contributions of individual crops to profitability.
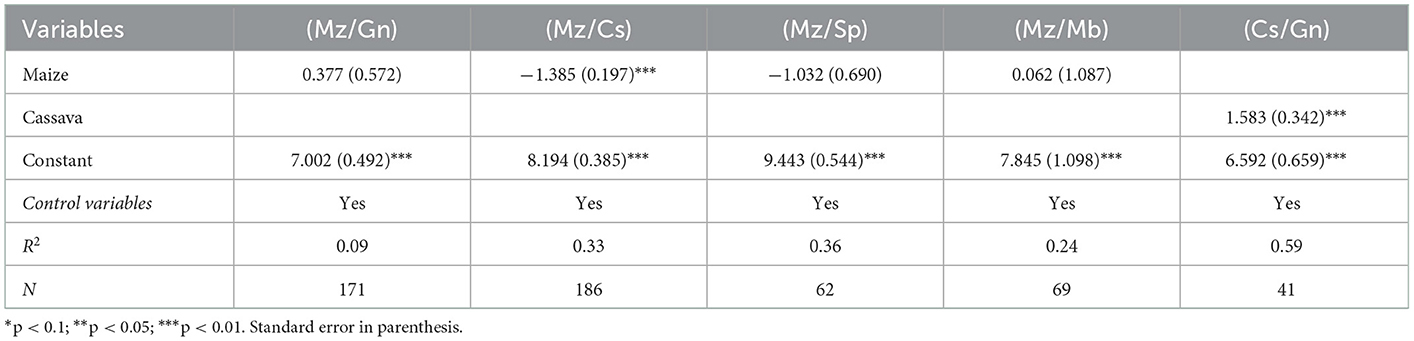
Table 12. Effect of crop proportions on enterprise structure profitability in agro-ecological zone III.
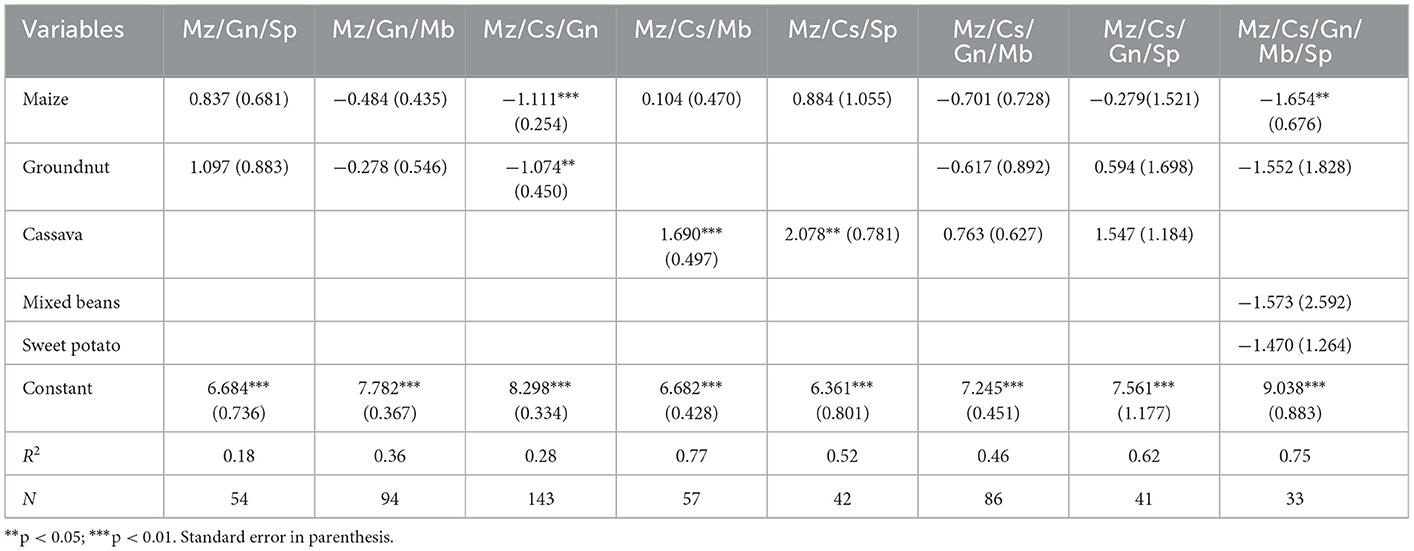
Table 13. Effect of crop proportions on enterprise structure profitability in agro-ecological zone III.
5. Discussion
On average, we found that the Cs enterprise structure has the most returns for farmers in Zambia with a gross margin of ZMW 3,887.22 per hectare followed by the Mz/Gn/Ct/R enterprise structure with a gross margin per hectare of ZMW 3,681.31. It is plausible that the Cs enterprise stands out because it may be less costly to produce to produce than other enterprise structures for farmers. This result is consistent with Barratt et al. (2006) and Poole et al. (2013) who found that cassava is financially most profitable for smallholder farmers as it requires no purchased inputs and has more flexible planting and harvesting calendar seasons that befit labor requirements and other obligations more than other crops.
The results of the effect of the Simpson index on profitability imply that, holding all else constant, the extent of diversification as measured by the index does not statistically influence profitability in AEZ I. This suggests that in AEZ I, growing more or fewer crops does not affect profitability. Based on this result, a follow-up recommendation for practitioners would be that growing more or fewer crops would not be expected to influence their profitability. Results from the EP approach however show that the Mz/Ct EP and the Mz/Gn/Ct EP increase gross margin per hectare by 63.23 and 48.88% respectively, compared to the Mz EP. This implies that recommendations on the basis of the SID only would result in foregone profitability increases, a result which is consistent with Maggio et al. (2018) and Maggio and Sitko (2021). Recommendations based on the EP approach would prevent such potential losses by clearly recommending the Mz/Ct and the Mz/Gn/Ct EPs as the crop portfolios associated with the highest profitability in AEZ I. Therefore, guidance on portfolio selection from the enterprise structure approach would supplement index-based recommendations in improving crop portfolio decision-making.
In AEZ IIa, the results from the Simpson index models, suggest that adding crops to a farmer's portfolio increases gross margin per hectare, regardless of which crop is added. On the other hand, results from the EP model suggest that the Mz/Gn/Ct, Mz/Ct, Mz/Gn/Sb, Mz/Ct/Sf as well as Mz/Gn statistically increase gross margin per hectare relative to the Mz EP. This could be due to the increased ecological benefits from leguminous crops such as groundnuts or higher prices associated with cotton, or soybeans which have the potential to alleviate farmers' exposure to price fluctuations effecting a single commodity (Hahn et al., 2009; Lin, 2011; Mulwa et al., 2017; Maggio and Sitko, 2021). Additionally, the Mz/Sp, Mz/Sf, Mz/Sb, Mz/Gn/Sf, Mz/Gn/Sp, Mz/Gn/Mb, and the Mz/Gn/Sb/Sf EPs do not statistically offer higher profitability than specializing in Mz which could be due to biological and economic attributes of the crops and their combinations (Tilman et al., 2005). Rather than just recommending that farmers grow more crops on the basis of the SID, the EP helps to offer more specific guidance on which portfolios to select. In AEZ IIb, the SID models suggest that growing fewer or more has a negative or no significant influence on gross margin per hectare.
A follow-up recommendation from this result would either be that the number of crops grown has no impact on profitability or that farmers can increase profitability by growing fewer crops. Again, the EP approach is more specific in showing exactly which crop portfolios would result in higher profitability. The EP model shows that the Mz/Cs EP and the Mz/Cs/Gn EP increase profitability by 40.07% and 42.33% relative to the Mz EP while the Mz/Cs/R EP is not statistically different from that of the Mz EP. This further provides empirical evidence that recommendations based on the EP model may increase crop profitability for farmers.
For AEZ III, the results of the SID model suggest that the extent of crop diversification has no effect on profitability whereas, the results of the EP model show that specializing in Cs results in statistically higher profitability than specializing in Mz. By not specifying the crop portfolios into which to diversify or specialize, recommendations from the SID model alone could cost Mz-only farmers a foregone profitability increase of 77.89% for not choosing to specialize in Cs. Further, while the SID model suggests that the Mz EP and the Mz/Cs EP would statistically have the same profitability, the EP model shows that Mz-only farmers may increase their profitability by 16.42% by diversifying into the Mz/Cs EP.
Although the EP approach accounts for differences in the type of crops in a portfolio, it does not account for differences in the proportion of crops within a portfolio. The portfolio rebalancing analysis shows that the same EP could be associated with different levels of profitability based on the differences in the proportion of the crops in the portfolio. The results in AEZ I show that a Mz/Gn EP with more maize and less groundnuts or vice versa have the same levels of profitability. Similarly, in the Mz/Ct EP and the Mz/Gn/Ct EP, profitability is not statistically different across farmers who have different proportions of the two crops in the portfolio. This suggests that, for these three EPs in AEZ I, differences in the proportion of crops in the EP does not result in differences in profitability of the EP. For AEZ IIa, the results suggest that increasing the proportion of maize and groundnuts and reducing the proportion of sunflower in the Mz/Gn/Sf EP positively affects profitability of this EP at 1% significance level. Further, increasing the proportion of groundnuts and reducing the proportion of mixed beans in the Mz/Gn/Mb EP significantly increases profitability of this EP in AEZ IIa. The reason could be that AEZ IIA is more favorable for groundnuts and maize production in Zambia (Manda et al., 2017; Ng'ombe, 2017) resulting in more yields and eventual profitability. An increase in the proportion of cassava and a reduction in the proportion of maize in the Mz/Cs EP in AEZ IIb has a positive effect on the profitability of this EP. A similar result is found in AEZ III, in which increasing the proportion of cassava and reducing the proportion of maize in the Mz/Cs EP also significantly increases profitability of the EP. Thus, as in Maggio and Sitko (2021), variations between these AEZs with regard to the region-specific dominant cash crop may contribute to this kind of heterogeneity.
Generally, our results imply that differences in the proportions of crops in a given crop portfolio may be important in crop diversification decisions. Instead of simply telling farmers to grow more or fewer crops based on the index approach, or telling farmers which specific crop portfolios to select, further guidance on how to proportion the crop portfolio may be necessary. Therefore, it would be helpful for policy makers and researchers to understand the profitability characteristics of each crop to be able to guide farmers on proportions of crops in their respective portfolios.
6. Conclusion
This study estimated potential profitability/loss that would result if farmers made diversification decisions on the basis of generic recommendations from diversification indices only. This study was based on an analysis of the influence of a crop diversification index on profitability as opposed to specific recommendations from an analysis of the effects of an enterprise structure on profitability. An enterprise structure is a unique crop portfolio being grown by each farm whereas a crop diversification index is a “numbers” approach which measures diversification on the basis of the number and relative abundance of crops in a portfolio. Using secondary data from the 2015 Rural Agricultural Livelihood Survey in Zambia and a semi-log ordinary least square regression, we show that the diversification index lacks the necessary insight needed for farmers to make diversification decisions and may result in substantial opportunity costs if not augmented with an enterprise structure approach.
Recommendations based on an index approach would be to either increase or decrease the number of crops in a portfolio without clear guidance on what crops can be added or subtracted from the portfolio. This ambiguous recommendation means that farmers would have to decide for themselves which crops to add or subtract which may result in losses (in terms of opportunity cost) for farms who select sub-optimal portfolios. The enterprise structure approach improves upon the shortfalls of the index by providing a better understanding of how different crop portfolios compare to each other in terms of profitability. Therefore, supplementing an index-based analysis with an enterprise structure approach can allow farmers to more effectively select portfolios that best suit their objectives.
For policy makers and practitioners, these results caution against the reliance on oversimplified index-based analyses when making diversification decisions. For researchers, this study provides a sobering result that an abstract analysis of crop diversification may result in substantial losses for farmers if not coupled with a more disaggregated portfolio analysis. Due to their limited insight on diversification decisions for farmers, crop diversification indices may be best used in tandem with enterprise structure analyses. For applied research meant to inform policy or help practitioners, “diversification is in the details” and these details are not adequately captured by an index but by an enterprise structure analysis (Mzyece, 2020; Maggio and Sitko, 2021).
7. Limitations
There are several limitations associated with this study. First, while we used a useful and unique dataset, the data are cross-sectional and could not capture farmers' decisions on EPs overtime and thus, we were unable to account for potential unobserved heterogeneity. Using panel data remains an interesting research area in this aspect. Panel data could capture the dynamic changes in both input and output prices which this study could not. Our approach assumes a static analytical framework assuming perfect knowledge about input and output prices. This may be problematic, especially concerning output prices, as they are generally very variable and unknown when making crop planting decisions. Thus, some enterprise combinations may be identified as most (or least) profitable only because prices were high (or low) the year the survey was conducted. Sometimes there seems to be a lot of inertia in farmers' decisions regarding crop selection. Still, it is well-documented that farmers make decisions with a long perspective (i.e., they know that some years' crops are more profitable than others) and use expected (long-term) prices for crop selection decision-making (Nerlove and Arrow, 1962). While this is an important caveat, our study still provides a valuable launchpad for agricultural and applied economists to be more careful when evaluating crop diversification decisions. Second, potential endogeneity from the absence of certain key variables that influence costs or from self-selection of the enterprise structures is an important caveat that future studies should consider. In this realm, readers should interpret our results with caution.
Third, we assume a farmer's objective is profit maximization. But it is possible that farmers may be producing for other objectives, such as nutrition or social utility maximization. This study did not differentiate these other objectives. Therefore, a recommendation to alter a portfolio may not be practical if profit maximization is not the objective.
Fourth, we were not able to examine the effects of crop diversification on risk management because of the cross-sectional nature of our data. Comparing the effects of the Simpson index of diversification and of the enterprise structure on income variability could inform diversification decisions that are aimed at reducing income and yield variability. Moreover, this study did not examine the sources of complementarities among crops in an enterprise structure. Therefore, future research can examine the sources of complementarities in enterprise structures so that the identification of superior enterprise structures can be easily generalized to other countries or settings.
Data availability statement
The raw data supporting the conclusions of this article can be accessed upon request from the Research Director at Indaba Agricultural Policy Research Institute (IAPRI), Lusaka, Zambia at YW50b255LmNoYXBvdG9AaWFwcmkub3JnLnpt.
Author contributions
AM contributed to conceptualization, investigation, data curation, methodology, writing, editing, and review. VA-B contributed to conceptualization, investigation, methodology, editing, review, and supervision. JN contributed to investigation, methodology, writing, editing, and review. All authors read and approved the final manuscript.
Acknowledgments
The authors would like to express their gratitude to Dr. Aleksan Shanoyan and Dr. Leilei Shen, all from Kansas State University, for their thoughts and input in the initial phases of this research. The authors would also like to thank the Monitoring, Evaluation and Technical Support Services (METSS) program at Kansas State University for providing the intellectual and financial support that made this research possible.
Conflict of interest
The authors declare that the research was conducted in the absence of any commercial or financial relationships that could be construed as a potential conflict of interest.
Publisher's note
All claims expressed in this article are solely those of the authors and do not necessarily represent those of their affiliated organizations, or those of the publisher, the editors and the reviewers. Any product that may be evaluated in this article, or claim that may be made by its manufacturer, is not guaranteed or endorsed by the publisher.
References
Addai, K. N., Ng'ombe, J. N., Temoso, O. (2022). Food poverty, vulnerability, and food consumption inequality among smallholder households in Ghana: A gender-based perspective. Soc. Indicat. Res. 163, 661–689.
Adelman, M. A. (1969). Comment of the ‘H' concentration measure as a numbers equivalent. Rev. Econom. Statist. 51, 99–101.
Arslan, A., Cavatassi, R., Alfani, F., Mccarthy, N., Lipper, L., Kokwe, M. (2018). Diversification under climate variability as part of a CSA strategy in rural Zambia. J. Dev. Stud. 54, 457–480. doi: 10.1080/00220388.2017.1293813
Barratt, N., Chitundu, D., Dover, O., Elsinga, J., Eriksson, S., Guma, L., et al. (2006). Cassava as drought insurance: Food security implications of cassava trials in Central Zambia. Agrekon. 45, 106–123.
Baumol, W. J., Panzar, J. C., Willig, R. D. (1982). Contestable Markets and Industry Structure. New York, NY: Harcourt Brace Jovanovich, Inc.
Chavas, J. P., Kim, K. (2010). Economies of diversification: A generalization and decomposition of economies of scope. Int. J. Prod. Econom. 126, 229–235.
Coelli, T., Fleming, E. (2004). Diversification economies and specialisation efficiencies in a mixed food and coffee smallholder farming system in Papua New Guinea. Agric. Econ. 31, 229–239. doi: 10.1016/j.agecon.2004.09.010
Culas, R., Mahendrarajah, M. (2005). “Causes of diversification in agriculture over time: Evidence from norwegian farming sector,” in European Association of Agricultural Economists. Available online at: https://core.ac.uk/download/pdf/7034548.pdf
Deng, J., Yin, Y., Zhu, W., Zhou, Y. (2018). Variations in soil bacterial community diversity and structures among different revegetation types in the Baishilazi Nature Reserve. Front. Microbiol. 9, 2874.
Di Falco, S., Bezabih, M., Yesuf, M. (2010). Seeds for livelihood: crop biodiversity and food production in Ethiopia. Ecol. Econ. 69, 1695–1702. doi: 10.1016/j.ecolecon.2010.03.024
Di Falco, S., Chavas, J. P. (2009). On crop biodiversity, risk exposure, and food security in the highlands of Ethiopia. Am. J. Agric. Econ. 91, 599–611. doi: 10.1111/j.1467-8276.2009.01265.x
Di Falco, S., Perrings, C. (2003). Crop genetic diversity, productivity and stability of agroecosystems. A theoretical and empirical investigation. Scottish J. Polit. Econom. 50, 207–216.
Ecker, O., Hatzenbuehler, P. L. (2022). Food consumption-production response to agricultural policy and macroeconomic change in Nigeria. Appl. Econom. Perspect. Policy. 44, 982–1002.
FAO (1973). Luangwa Valley Conservation and Development Project: Report on Project Results, Conclusions and Recommendations. FO:DP/ZAM/68/510 Terminal Report. Rome: Food and Agriculture Organization of the United Nations, Rome.
Government of the Republic of Zambia (2010). National Climate Change Response Strategy. Available online at: https://www.adaptation-undp.org/sites/default/files/downloads/zambia-climate_change_response_strategy.pdf (accessed January 05, 2023).
Green, R. H. (1979). Sampling Design and Statistical Methods for Environmental Biologists. New York, NY: John Wiley and Sons.
Guvele, C. A. (2001). Gains from crop diversification in the Sudan Gezira scheme. Agri. Syst. 70, 319–333.
Hahn, M. B., Riederer, A. M., Foster, S. O. (2009). The livelihood vulnerability index: a pragmatic approach to assessing risks from climate variability and change—A case study in Mozambique. Glob. Environ. Change 19, 74–88. doi: 10.1016/j.gloenvcha.2008.11.002
Haji, J. (2007). Production efficiency of smallholders' vegetable-dominated mixed farming system in eastern Ethiopia: A non-parametric approach. J. Afr. Econom. 16, 1–27.
Herfindahl, O. C. (1950). Concentration in the US Steel Industry. New York, NY: Columbia University.
Hogg, R., Elliot, T., Zimmerman, D. (2015). Probability and Statistical Inference, 9th Edn. Pearson Education.
Jarvis, A., Lane, A., Hijmans, R. J. (2008). The effect of climate change on crop wild relatives. Agri. Ecosyst. Environ. 126, 13–23.
Just, R. E., Candler, W. (1985). Production functions and rationality of mixed cropping. Euro. Rev. Agri. Econom. 12, 207–231.
Li, L., Bellotti, B., Komarek, A. M. (2016). Structural change and agricultural diversification since china's reforms. Bio-Based Appl. Econom. 5, 113–30. doi: 10.13128/BAE-16366
Lin, B. B. (2011). Resilience in agriculture through crop diversification: adaptive management for environmental change. BioScience 61, 183–193. doi: 10.1525/bio.2011.61.3.4
Llewelyn, R. V., Williams, J. R. (1996). Nonparametric analysis of technical, pure technical, and scale efficiencies for food crop production in East Java, Indonesia. Agri. Econom. 15, 113–126.
Lu, W., Addai, K. N., Ng'ombe, J. N. (2021). Impact of improved rice varieties on household food security in Northern Ghana: a doubly robust analysis. J. Int. Dev. 33, 342–359. doi: 10.1002/jid.3525
Maggio, G., Sitko, N., Ignaciuk, A. (2018). “Cropping system diversification in Eastern and Southern Africa: Identifying policy options to enhance productivity and build resilience,” in FAO Agricultural Development Economics Working Paper 18-05 (Rome: FAO).
Maggio, G., Sitko, N. J. (2021). Diversification is in the detail: accounting for crop system heterogeneity to inform diversification policies in malawi and zambia. J. Dev. Stud. 57, 264–288. doi: 10.1080/00220388.2020.1769072
Makate, C., Wang, R., Makate, M., Mango, N. (2016). Crop diversification and livelihoods of smallholder farmers in Zimbabwe: Adaptive management for environmental change. SpringerPlus. 5, 1–18.
Manda, J., Khonje, M. G., Alene, A. D., Gondwe, T. (2017). Welfare impacts of improved groundnut varieties in eastern Zambia: A heterogeneous treatment effects approach. Agrekon. 56, 313–329.
Manjunatha, A. V., Anik, A. R., Speelman, S., Nuppenau, E. A. (2013). Impact of land fragmentation, farm size, land ownership and crop diversity on profit and efficiency of irrigated farms in India. Land Use Policy 31, 397–405. doi: 10.1016/j.landusepol.2012.08.005
Michler, J. D., Josephson, A. L. (2017). To specialize or diversify: agricultural diversity and poverty dynamics in Ethiopia. World Dev. 89, 214–226. doi: 10.1016/j.worlddev.2016.08.011
Mishra, A. K., El-Osta, H. S., Steele, C. J. (1999). Factors affecting the profitability of limited resource and other small farms. Agric. Fin. Rev. 59, 77–99.
Mofya-Mukuka, R., Hichaambwa, M. (2016). Factors Influencing Smallholder Crop Diversification in Zambia and the Implications for Policy. Lusaka. Available online at: http://www.iapri.org.zm (accessed October 25, 2020).
Momeni, E., Antipova, A. (2022). A micro-level analysis of commuting and urban land using the Simpson's index and socio-demographic factors. Appl. Geograph. 145, 102755.
Mulwa, C., Marenya, P., Kassie, M. (2017). Response to climate risks among smallholder farmers in Malawi: a multivariate probit assessment of the role of information, household demographics, and farm characteristics. Clim. Risk Manag. 16, 208–221. doi: 10.1016/j.crm.2017.01.002
Muthini, D., Nzuma, J., Nyikal, R. (2020). Farm production diversity and its association with dietary diversity in Kenya. Food Secur. 12, 1107–1120.
Mzyece, A. (2020). The Strategic Value of Crop Diversification in Zambia. Manhattan, KS: Kansas State University. doi: 10.1080/00221546.1968.11776480
Mzyece, A., Ng'ombe, J. N. (2020). Does crop diversification involve a trade-off between technical efficiency and income stability for rural farmers? Evidence from Zambia. Agronomy 10, 1875. doi: 10.3390/agronomy10121875
Mzyece, A., Ng'ombe, J. N. (2021). Crop diversification improves technical efficiency and reduces income variability in Northern Ghana. J. Agric. Food Res. 5, 100162. doi: 10.1016/j.jafr.2021.100162
Nayyar, P. R. (1993). Performance effects of information asymmetry and economies of scope in diversified service firms. Acad. Manag. J. 36, 28–57.
Nerlove, M., Arrow, K. J. (1962). Optimal advertising policy under dynamic conditions. Economica 29, 129–142. doi: 10.2307/2551549
Ng'ombe, J. N. (2017). Technical efficiency of smallholder maize production in Zambia: a stochastic meta-frontier approach. Agrekon 56, 347–365. doi: 10.1080/03031853.2017.1409127
Ng'ombe, J. N., Kalinda, T. H., Tembo, G. (2017). Does adoption of conservation farming practices result in increased crop revenue? Evidence from Zambia. Agrekon 56, 205–221. doi: 10.1080/03031853.2017.1312467
Poole, N. D., Chitundu, M., Msoni, R. (2013). Commercialisation: a meta-approach for agricultural development among smallholder farmers in Africa?. Food Policy 41, 155–165. doi: 10.1016/j.foodpol.2013.05.010
Poon, K., Weersink, A. (2011). Factors affecting variability in farm and off-farm income. Agric. Fin. Rev. 71, 379–397. doi: 10.1108/00021461111177639
Pope, R. D., Prescott, R. (1980). Diversification in relation to farm size and other socioeconomic characteristics. Am. J. Agri. Econom. 62, 554–559.
Purdy, B. M., Langemeier, M. R., Featherstone, A. M. (1997). Financial performance, risk, and specialization. J. Agric. Appl. Econ. 29, 149–161. doi: 10.1017/S107407080000763X
Rahman, S. (2009). Whether Crop diversification is a desired strategy for agricultural growth in Bangladesh? Food Policy 34, 340–349. doi: 10.1016/j.foodpol.2009.02.004
Rajendran, S., Afari-Sefa, V., Shee, A., Bocher, T., Bekunda, M., Lukumay, P. J. (2017). Does crop diversity contribute to dietary diversity? Evidence from integration of vegetables into maize-based farming systems. Agri. Food Secur. 6, 1–13.
Randela, R., Alemu, Z. G., Groenewald, J. A. (2008). Factors enhancing market participation by small-scale cotton farmers. Agrekon 47, 451–469. doi: 10.1080/03031853.2008.9523810
Rumelt, R. P. (1974). Strategy, Structure and Economic Performance. Boston, MA: Harvard University Press.
Smale, M., Hartell, J., Heisey, P. W., Senauer, B. (1998). The contribution of genetic resources and diversity to wheat production in the Punjab of Pakistan. Am. J. Agric. Econ. 80, 482–493. doi: 10.2307/1244551
Tabner, I. (2007). A review of concentration, diversity or entropy metrics in economics, finance, ecology and communication science. Int. J. Interdiscipl. Soc. Sci. Annu. Rev. 2, 53–60. doi: 10.18848/1833-1882/CGP/v02i04/52345
Teece, D. J. (1980). Economies of scope and the scope of the enterprise. J. Econom. Behav. Organ. 1, 223–247.
The World Bank Food Agriculture Organization International Fund for Agricultural Development.. (2008). Gender in Agriculture Sourcebook. Module 5. Washington, DC: The World Bank. Available online at: https://openknowledge.worldbank.org/bitstream/handle/10986/6603/461620PUB0Box3101OFFICIAL0USE0ONLY1.pdf?sequence=1&isAllowed=y
Tilman, D., Polasky, S., Lehman, C. (2005). Diversity, productivity and temporal stability in the economies of humans and nature. J. Environ. Econ. Manag. 49, 405–426. doi: 10.1016/j.jeem.2004.03.008
Willenbrock, S. (2011). Diversification return, portfolio rebalancing, and the commodity return puzzle. Fin. Anal. J. 67, 42–49. doi: 10.2469/faj.v67.n4.1
Zamseed (2019). Agricultural Seed. Available online at: https://www.zamseed.co.zm/index.php/agricultural-seed (accessed April 24, 2020).
Keywords: enterprise structures, Simpson index, crop diversification, diversification index, crop portfolio
Citation: Mzyece A, Amanor-Boadu V and Ng'ombe JN (2023) An enterprise structure approach improves index-based crop portfolio decision-making. Front. Environ. Econ. 2:1074865. doi: 10.3389/frevc.2023.1074865
Received: 20 October 2022; Accepted: 02 January 2023;
Published: 20 January 2023.
Edited by:
Steven Van Passel, University of Antwerp, BelgiumReviewed by:
Mangirdas Morkunas, Vilnius University, LithuaniaIsaac Gershon Kodwo Ansah, University for Development Studies, Ghana
Copyright © 2023 Mzyece, Amanor-Boadu and Ng'ombe. This is an open-access article distributed under the terms of the Creative Commons Attribution License (CC BY). The use, distribution or reproduction in other forums is permitted, provided the original author(s) and the copyright owner(s) are credited and that the original publication in this journal is cited, in accordance with accepted academic practice. No use, distribution or reproduction is permitted which does not comply with these terms.
*Correspondence: John N. Ng'ombe,  am5nb21iZUBuY2F0LmVkdQ==
†These authors have contributed equally to this work