Abstract
Japan is a country committed to complying with the international agreement on mitigating greenhouse gases (GHGs) causing climate change. However, the 2011 Tohoku Earthquake and Tsunami in March 2011 led the country had to modify the energy and environmental policy to global warming. The 15 m of tsunami occurred from an underwater earthquake hit the east coast where the nuclear reactors were located. The coolant system failed and the radioactive materials were spread out into the atmosphere, ocean, and soil. The Japanese government investigated the level of contaminated materials (iodine, cesium, etc.) and reassessed the food safety regulations. Simultaneously, consumers' anxiety about the food system was increasing and their preferences for food consumption were affected by the food safety phenomenon that arose in connection with the nuclear accident after the natural disaster. Japanese consumers avoided agricultural and fish products originating from the land and sea, so the consumption per capita of fish decreased by 11.3% while the beef consumption increased by 13.7% between 2011 and 2020. As reported by the Food and Agriculture Organization (FAO), meat and dairy products are accounted for around 16.5% of global GHGs emissions per year, and there are differences in the emission factors between beef (40.5 kgCO2e/kg) and fish (7.7 kgCO2e/kg). Per capita meat and fish consumption in Japan affected the GHGs emissions and the study employs the Synthetic Control Method (SCM) to estimate the impact of a change in dietary patterns on CO2 emissions from household food consumption. The outcome variable is CO2 emissions from household food consumption and the intervention period is between 1995 and 2019 (pre-intervention: 1995–2010; post-intervention: 2011–2019). Analyzing 32 countries, placebo studies, leave-one-out, and post-/pre-MSPE ratio are performed to make the statistical inferences. The results present that there is a meaningful relationship between the dietary patterns and the increase in CO2 emissions. Unlike the countries in the control group, Japan shows a significant increase in CO2 emissions from household food consumption after the natural disaster. However, the westernization of the diet can be another long-term factor affecting climate change. Therefore, future research can involve analyzing the impact of CO2 emissions from household food consumption in multiple treated countries with multiple interventions.
Introduction
Greenhouse gas (GHG) emissions from agriculture come from both supply (production) and demand (consumption) (Yue et al., 2017). Agriculture was involved with 23% of global anthropogenic GHGs between 2007 and 2016 (Intergovernmental Panel for Climate Change [IPCC], 2021). On the production side, GHG emissions come from land use, manufacturing, and the use of fertilizer and pesticides (Alhashim et al., 2021). For example, the Food and Agricultural Organization (FAO) of the United Nations (2020) reported that agricultural factors contributing to emissions in land use are deforestation (74%), drained organic soils (18%), organic soil fires (5%), and biomass fires (2%). In addition, Grossi et al. (2019) indicated that the most important GHGs from animal agriculture are methane and nitrous oxide. Thus, the demand for animal-sourced products needs to be harmonized with strategies for emission intensity reduction (Gerber et al., 2013; Ritchie, 2019). On the consumption side, a study focused on the end users (Rogissart et al., 2019) found that dietary design influenced climate change; another study found that food consumption accounted for 19% to 29% of the total GHG emissions (Xu and Jain, 2021). Food consumption is connected with various environmental factors, so consumers' food choices, therefore, represent important environmental decisions (Gonzalez et al., 2011; Nemecek et al., 2016). Eating behavior accounts for 10% to 30% of a household's carbon footprint (Center for Sustainable System, 2022), and animal-sourced products show a larger carbon footprint than vegetable-sourced products.
Japan is a country with frequent earthquakes. On March 2011, an earthquake of 9.0 on the Richter scale1 caused a tsunami that hit the main island, resulting in more than 18,000 casualties (BBC, 2021). The tsunami flooded 561 km2 of land along the Pacific coast of Japan, affected 602,200 residents, and killed 3.5% of the local population (Koshimura and Shuto, 2015). In the aftermath of this 15-meter tsunami, the nuclear reactors were disabled by a malfunction of the cooling system (World Nuclear Association, 2018), and radiation materials were released into the atmosphere, water, and soil. After an investigation into the radioactive dispersion, the Japanese government reviewed the food safety regulations. The contaminated materials caused farmers and fishermen not to cultivate or catch agricultural products or fish, since producers and consumers were afraid of unhealthy foods. The natural disaster affected the food environment (Hikichi et al., 2019) since the survivors experienced emotional anxiety and faced unhealthy agricultural and fish products. They consumed more alcoholic drinks and fewer vegetables/fruit.
Augustin-Jean and Poulain (2019) studied consumer anxiety generated after disasters, analyzing the milk powder scandal in China and the nuclear accident in Japan. In the case of the Fukushima nuclear accident in 2011, the study indicated a lack of confidence in the agro-industrial system related to food safety. The Fukushima nuclear accident has triggered much concern about food safety in Japan and across the world (Prand-Stritzko and Steinhauser, 2017). Even though Fukushima prefecture checks the foods against strict safety measures, consumers are still worried about the food products (Bachev, 2021). The figures below indicate the annual expenditure of the average household (Figure 1) and the relative change in non-medical determinants (Figure 2; Food Agriculture Organization of the United Nations, 2013) in Japan. In Japan, the expenditure on fish decreased by 4.3%, while that on meat consumption increased between 1.4 and 8.3% after the natural disaster. The intake of sugar (10.3%), fruit (4.3%), vegetables (2.4%), and calories (1.0%) increased in 2011, and the values are much higher than averaged estimates [Sugar (−1.2%); fruit (−0.3%); vegetable (−1.1%); and calorie (−0.6%)] between 1995 and 2010.
Figure 1
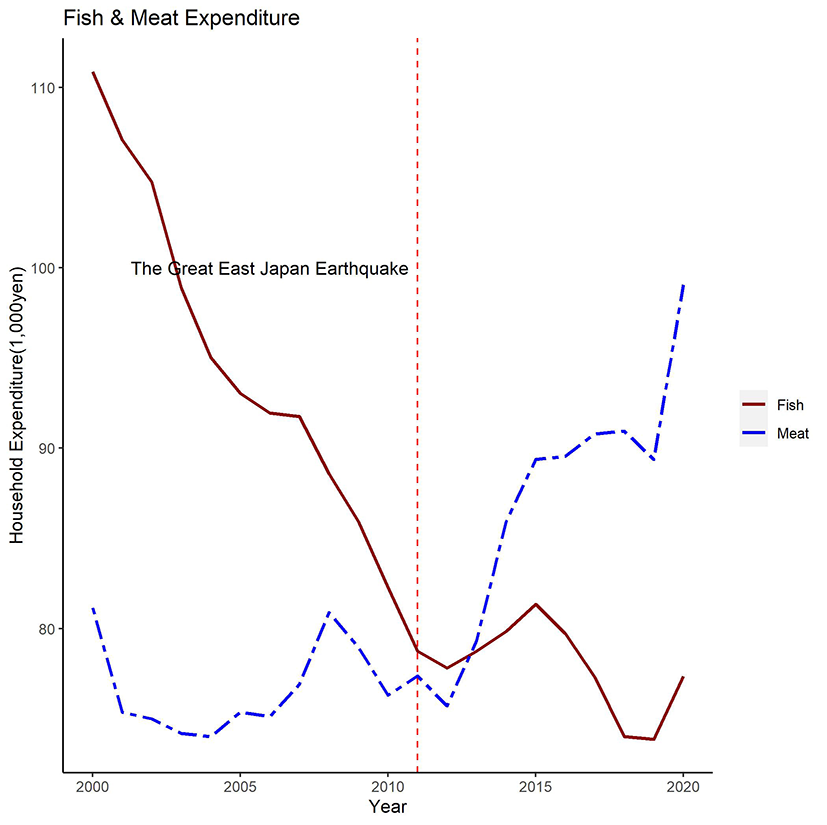
Fish and meat expenditure (1,000 yen/year).
Figure 2
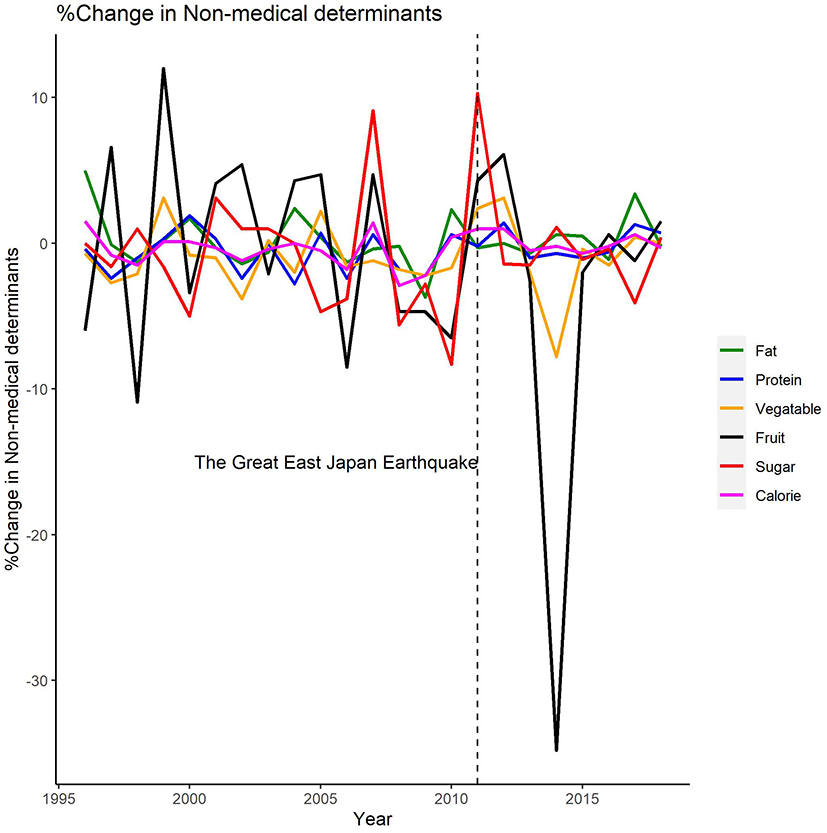
Relative change in non-medical determinants.
Food production is a cause of GHG emissions, and the shift in dietary patterns affects both environment and health (Aleksandrowicz et al., 2016). The food industry creates 20–30% of total GHG emissions and livestock meat production plays a large role in the industry (Sugimoto et al., 2021). Given that meat production is driven by consumer demand, there is a need to change dietary patterns (Lucas and Horton, 2019). To identify how dietary patterns change in Japan, Murakami et al. (2018) studied three dietary patterns: (1) plant food and fish, (2) bread and dairy, and (3) animal food and oil. They examined the national survey data between 2003 and 2015 and found lower consumption of “plant food and fish” and higher “bread and dairy” and “animal food and oil” consumption. After the Great East Japan Earthquake (GEJE), consumers were anxious about purchasing agricultural and fishery products Baek et al. (2018), since water contaminated with cesium-134/-137 reached the sea and entered the food chain (Amagai et al., 2014). Instead, they have consumed more meat products. The objective of this study is to estimate the impact of the change in dietary patterns generated by the contaminated food environment on CO2 emissions from household food consumption in Japan. Hence, this paper studies the relationship between dietary patterns and CO2 emissions and shows the importance of a sustainable environment in climate change.
Method and data
A causal relationship is established by various statistical analyses (Butler and Mayer, 2015; Keele, 2015). The synthetic control method (SCM) has been used to estimate the impact of an event on various research interests: terrorism (Abadie and Gardeazabal, 2003), political action (Bohn et al., 2014), local construction (Ando, 2015), and disasters (Argyriou et al., 2013). The SCM analysis functions with a treated unit (or units) and a control group (Abadie et al., 2012) and involves constructing a synthetic control unit (Fremeth et al., 2013). The synthetic control unit depends on the similarity between the estimates of predictors and the treated unit (Bouttell et al., 2018). Assuming that there are observable units i = 1, …, J and time t = 1, …, T0, T0+ 1, …, T, without the loss of generality, the treated unit is i = 1, and the control unit is i = 2, …, J; the pre-intervention period is t = 1, …, T0, and the post-intervention period is t = T0+ 1, …, T (Abadie et al., 2009, 2010). Let be the outcome with no intervention, and be the outcome with intervention at time t and unit i2. Let Dit be an indicator that takes the value 1 if unit i is exposed to the intervention at time t and the value 0 otherwise; the impact of the intervention is estimated by the minus in Equation (1), that is, in the post-intervention period in Equation (2).
To construct the optimal synthetic control unit, SCM requires four vectors (X0, X1, Z0, and Z1) and two weights (W and V). The four vectors represent the value of predictors (X0) and the outcome's value (Z0) of the control unit, and the predictor's value (X1) and the outcome's value (Z1) of the treated unit. The two weights represent the minimized distance (W) between the predictors and each control unit's weights [Equation (3)], and the minimized distance (V) between the outcomes of the treated unit and the control unit in the pre-intervention period that is used to find optimal predictor values [(Equtaion (4)]. The outer optimization is derived from a minimized mean-squared prediction error (MSPE) of the outcomes of treated and control units. Abadie et al. (2010) showed that the optimization presents asymptotically unbiased estimates of the treated unit. With four vectors, the effect of the intervention in Equation (5) on each control unit is estimated with the optimal weights ().
Data
This study concentrates on the relationship between dietary patterns and CO2 emissions from household food consumption. The study uses six statistical figures known as “non-medical determinants of health” to estimate the impact of dietary pattern changes in Japan after the natural disaster: (1) total fat supply (grams/capita/day), (2) total calorie supply (kilocalories/capita/day), (3) total protein supply (grams/capita/day), (4) sugar supply (kilograms/capita/day), (5) vegetable supply (kilograms/capita/year), and (6) fruit supply (kilograms/capita/year)3. The data on non-medical determinants of health are from OECD.Stat and the predictors are the employment ratio of industrial sectors, population ratio, gross domestic product (GDP) per capita, and GDP growth rate originated from OECD and Eurostat.
In the study, the treated unit is Japan, and the control unit includes 32 countries, consisting of 26 from the OECD, and six from the United Nations Framework Convention on Climate Change (UNFCCC). The type of intervention is the change of dietary patterns after the natural disaster. The response variable is the CO2 emissions from household food consumption (MtCO2e) generated by the Emissions Database of Global Atmospheric Research (EDGAR). The EDGAR is used to assist researchers in understanding the emissions related to the production, distribution, consumption, and disposal of food in the food system (Crippa et al., 2021). When the food is processed in a household, the food products of fisheries have lower CO2 emissions than beef, pork, and poultry (Petsko, 2021; Wolfson et al., 2021). The intervention period is between 1995 and 2019 (pre-intervention: 1995–2010 and post-intervention: 2011–2019). The predictors are employment ratio of industrial sectors, population ratio, gross domestic product (GDP) per capita, GDP growth rate, and non-medical determinants in Table 1 (OECD Statistics, 2016a,b,c).
Table 1
| Variables | Description |
|---|---|
| Dependent variable | CO2 emissions from household food consumption (1995–2019) |
| Treated country | Japan |
| Control units (donor pool) | 32 countries |
| Predictorsa | •GDP per capita (based on PPP, current USD) •GDP growth rate •Population ratio (15–64 years and over 65 years) •Detailed ratios of employmentb •Non-medical determinantsc |
| Intervention year | Year of the Great East Japan Earthquake (Year of 2011) |
Variables description.
Source: OECD, UNFCCC, CDIAC, and department of labor in each countryd.
Averaged value over the pre-intervention period.
Employment sectors include agriculture, mining and quarrying, construction, manufacture, utility, services.
Non-medical determinants include total fat supply, total calorie supply, total protein supply, sugar supply, vegetable supply, and fruit supply.
dThe data is from the Carbon Dioxide Information Analysis Center (CDIAC), the Climate Analysis Indicator Tool (CAIT), and the statistical agencies of each country. Non-medical determinants are from the Food and Agriculture Organization of the United Nations (FAO) and the OECD.
Result
This study defines the CO2 emissions from household food consumption as a response variable and 16 explanatory variables are selected to construct the synthetic control unit. This construction is a step toward building a synthetic Japan that has not been exposed to natural disaster. Then, synthetic Japan is compared with actual Japan. Table 2 presents estimates about the similarity of predictors in the pre-intervention period of Japan and synthetic Japan4. The closer the estimates between Japan and synthetic Japan are, the better the estimation results of the study will be. Table 3 shows the weights/regression weights of each country for constructing the synthetic control unit5. The percentages in the parentheses indicate the contribution to establishing the optimum synthetic unit: Mexico (4.4%), the United States (54.9%), Lithuania (36.0%), and Cyprus (4.7%). This combination of weighted countries contributes to the construction of the optimal synthetic control unit in the pre-intervention period. The regression weights of the linear combination of untreated units bring a synthetic control unit. The graphical results of Figures 3, 4 present how the change in dietary patterns influenced the increase of CO2 emissions from household food consumption after the natural disaster.
Table 2
| Japan | Synthetic Japan | ||
|---|---|---|---|
| CO2 emissions from household food consumption (MtCO2e)a | 35.91 | 35.76 | |
| Employment ratio (%)b | Agriculture and fishery | 4.46 | 7.48 |
| Mining | 0.06 | 0.38 | |
| Manufacture | 18.36 | 13.87 | |
| Utilitiesc | 0.53 | 3.72 | |
| Construction | 9.15 | 8.41 | |
| Servicesd | 66.38 | 66.12 | |
| Non-medical determinantse | Total fat supply (g/capita/day) | 88.61 | 125.27 |
| Total calories supply (kcal/capita/day) | 2,841.44 | 3,476.03 | |
| Total protein supply (g/capita/day) | 93.62 | 109.70 | |
| Sugar supply (kg/capita/year) | 29.29 | 55.28 | |
| Vegetable supply (kg/capita/year) | 108.46 | 112.54 | |
| Fruits supply (kg/capita/year) | 53.79 | 94.78 | |
| Population(%)f | 15–64 years old | 66.89 | 66.59 |
| Over 65 years old | 18.81 | 12.91 | |
| GDP per capita ($1,000) | 28.04 | 28.47 | |
| GDP growth (%)g | 0.89 | 3.35 |
Characteristics in the pre-intervention.
Source: Calculation by the author.
CO2 emission from household food consumption (MtCO2e), average between 1995 and 2010.
Percentage of employed person over total employed population, average between 2002 and 2007.
Utility includes water, gas, and electricity.
Services include entertainment, food and beverage, real estate, technical service, and life-related.
Each item has its own unit (yearly or daily consumption), average between 1995 and 2010.
Percentage of population over total population, average between 1995 and 2010.
Percentage change of GDP (annually), average between 1995 and 2010.
Table 3
| Country | Synthetic control | Regression weight | Country | Synthetic control | Regression weight |
|---|---|---|---|---|---|
| Australia | 0.000 | −0.04 | Slovak Republic | 0.000 | −0.10 |
| Austria | 0.000 | −0.50 | Slovenia | 0.000 | 0.03 |
| Chile | 0.000 | 0.14 | Sweden | 0.000 | 0.33 |
| Czech Republic | 0.000 | −0.21 | Turkey | 0.000 | 0.16 |
| Germany | 0.000 | 0.69 | United Kingdom | 0.000 | 0.07 |
| Greece | 0.000 | −0.19 | United States | 0.549 | −0.03 |
| Hungary | 0.000 | −0.16 | Brazil | 0.000 | −0.02 |
| Iceland | 0.000 | −0.10 | Colombia | 0.000 | −0.30 |
| Israel | 0.000 | −0.31 | Costa Rica | 0.000 | −0.38 |
| Italy | 0.000 | 0.26 | Russia | 0.000 | 0.41 |
| Mexico | 0.044 | 0.52 | Lithuania | 0.360 | 0.21 |
| The Netherlands | 0.000 | 0.19 | Croatia | 0.000 | 0.05 |
| New Zealand | 0.000 | 0.17 | Bulgaria | 0.000 | 0.14 |
| Norway | 0.000 | −0.15 | Cyprus | 0.047 | 0.40 |
| Poland | 0.000 | −0.34 | Romania | 0.000 | −0.08 |
| Portugal | 0.000 | 0.16 | Latvia | 0.000 | 0.00 |
Weight for each control unit.
Source: Computation from the data by SCM.
Figure 3
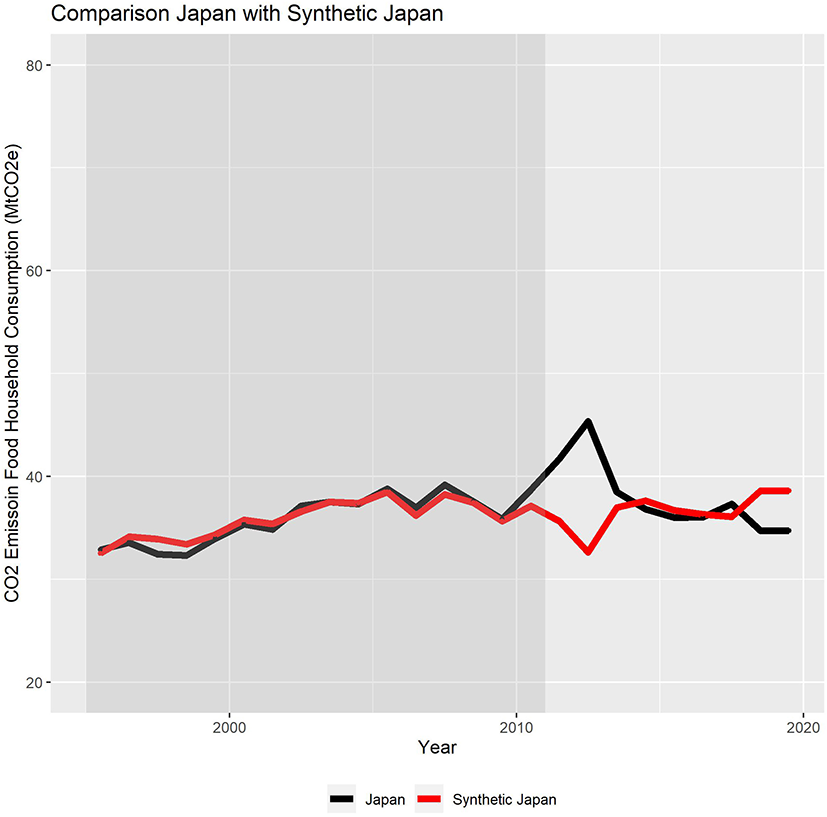
CO2 emissions from household food consumption (Japan and Synthetic Japan).
Figure 4
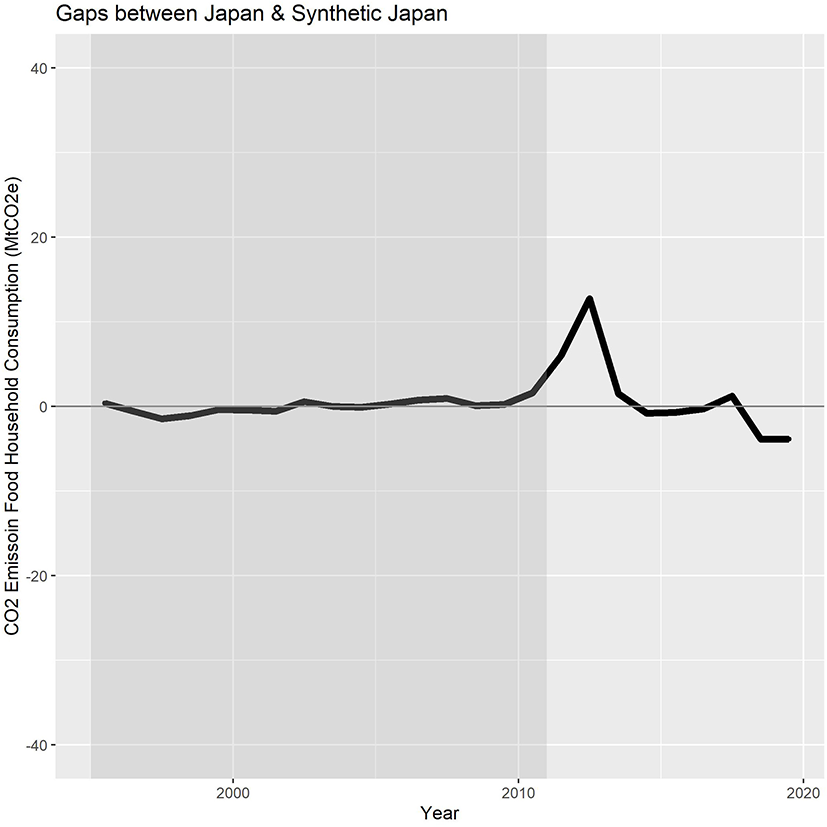
Gaps in CO2 emissions household food consumption of Japan.
Figure 3 indicates CO2 emissions from household food consumption in Japan and synthetic Japan between 1995 and 2019. The trajectory of synthetic Japan's CO2 emissions from household food consumption closely follows Japan's emissions for the pre-intervention period. Thus, the CO2 emissions from household food consumption began to go in different directions in 2011. The nuclear accident triggered consumers' anxiety about food products. Thus, the two trajectory lines were not on the same path in the post-intervention period. The divergence between Japan and synthetic Japan indicates that there was an impact affecting the CO2 emissions from household food consumption after the intervention. Moreover, Figure 3 indicates whether the natural disaster that prompted the intervention impacted the CO2 emissions from household food consumption. Figure 4 presents the gaps in the CO2 emissions from household food consumption between real Japan and synthetic Japan. The gap indicates the impact of the change in the dietary pattern after the natural disaster. The difference in the pre-intervention is between ±1%, but it shows the deviation after the natural disaster.
Placebo studies
For employing the SCM, statistical inference is critical, and Abadie and Gardeazabal (2003) introduced some tests to be applied to evaluate the significance. The placebo studies were performed by employing the SCM in each country in the control unit. The significance of the intervention could not be ensured if the gaps show a distinct magnitude between the tested unit and the synthetic tested unit (Abadie and Gardeazabal, 2003). With all 32 countries in the control unit, the placebo tests were conducted (Figure 5). For CO2 emissions from household food consumption, the test presents a good fit and other tests present the worst fit, indicating a distant MSPE. For example, the United States shows an MSPE of 1,019.51, since the country emitted the highest CO2 emissions from household food consumption in the pre-intervention period. Therefore, in the pre-intervention, synthetic Japan does not show a good fit for CO2 emissions from household food consumption, and it affects CO2 emissions in the post-intervention. Hence, the United States needs to be discarded for a much higher MSPE compared to the rest of the control unit.
Figure 5
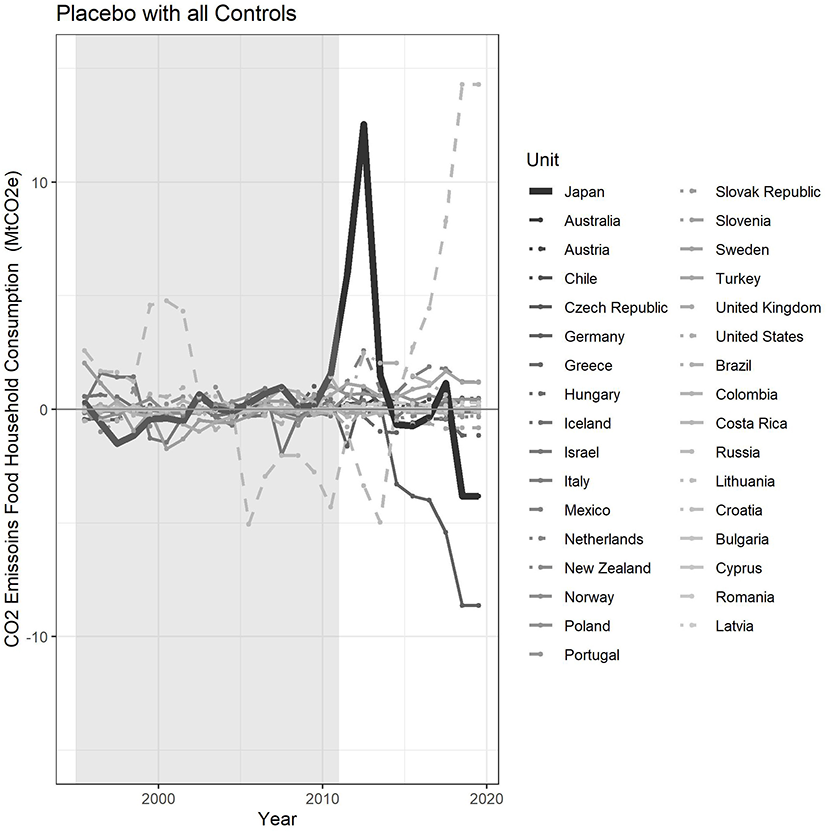
Placebo studies (all control countries).
Figure 6 shows the placebo tests that exclude countries showing an MSPE 20 times higher than that of the treated unit (Japan). The United States is excluded (Figure 6), but there are still substantial deviations from zero. Figures 7, 8 show that one country with five times higher MSPE and two countries with one times higher MSPE discarded. After the exclusion through Figures 6–8, there were 28 unaffected units presenting positive effects on CO2 emissions from household food consumption. Thus, this study reported that the probability of a random permutation of the event is 1/28 = 0.036, which indicates a 96% statistical significance in the analysis.6 Moreover, there is the leave-one-out test (Figure 9) which estimates the sensitivity of the results. The optimal W* from the process is to minimize the distance between Japan and synthetic Japan in the pre-intervention period (Abadie et al., 2012). The test was originally applied with the units being given positive weights. In this study, Mexico, the United States, Lithuania, and Cyprus are tested with synthetic Japan by leaving out each country one at a time.
Figure 6
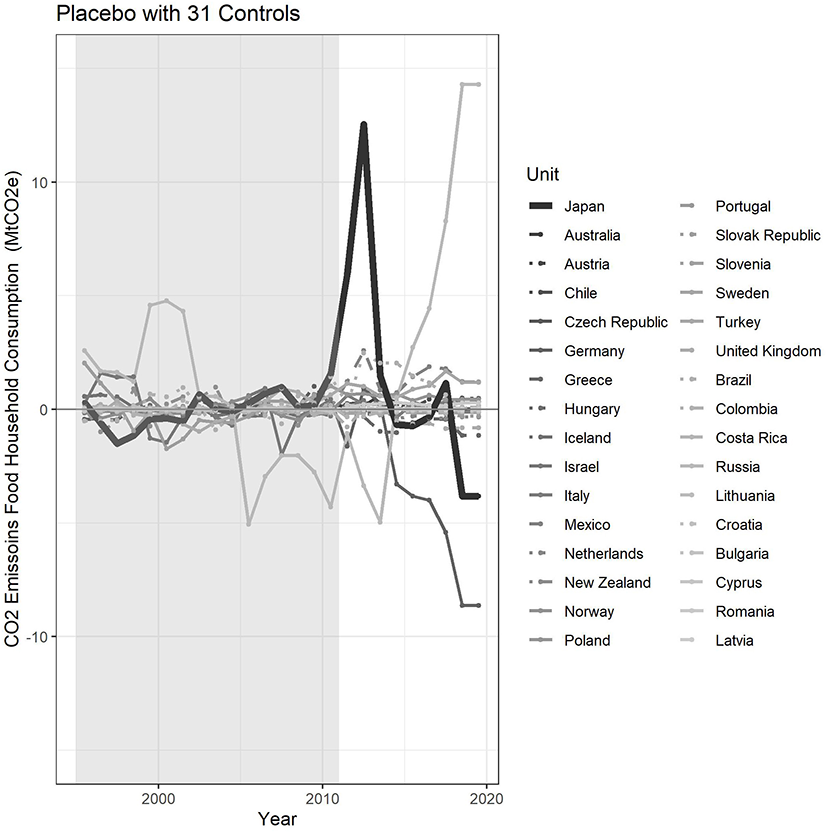
Placebo studies (31 control countries).
Figure 7

Placebo studies (30 control countries).
Figure 8
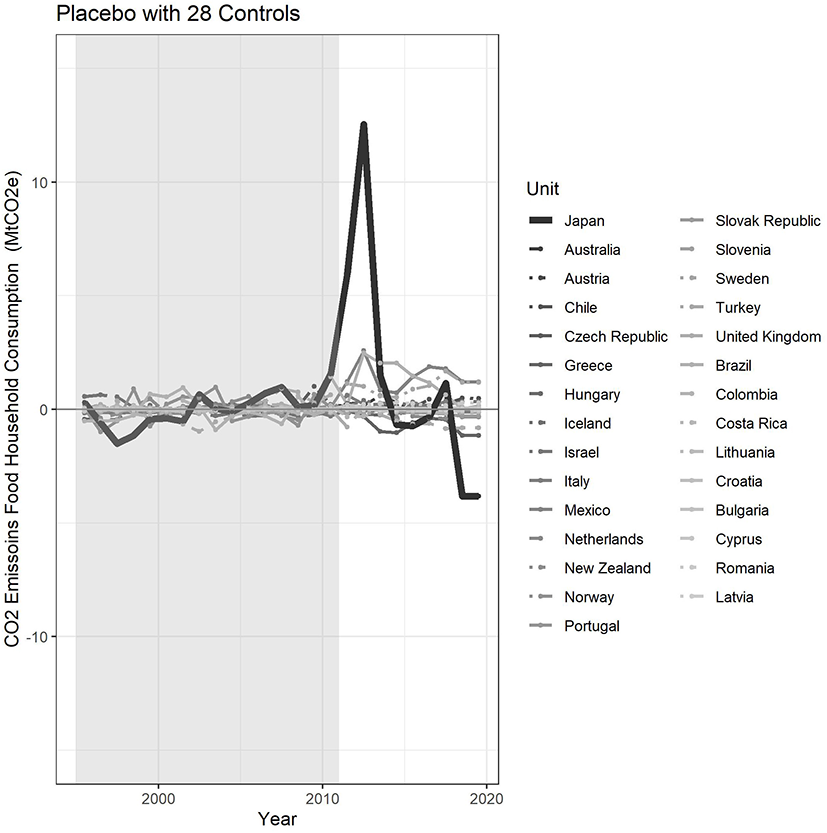
Placebo studies (28 control countries).
Figure 9
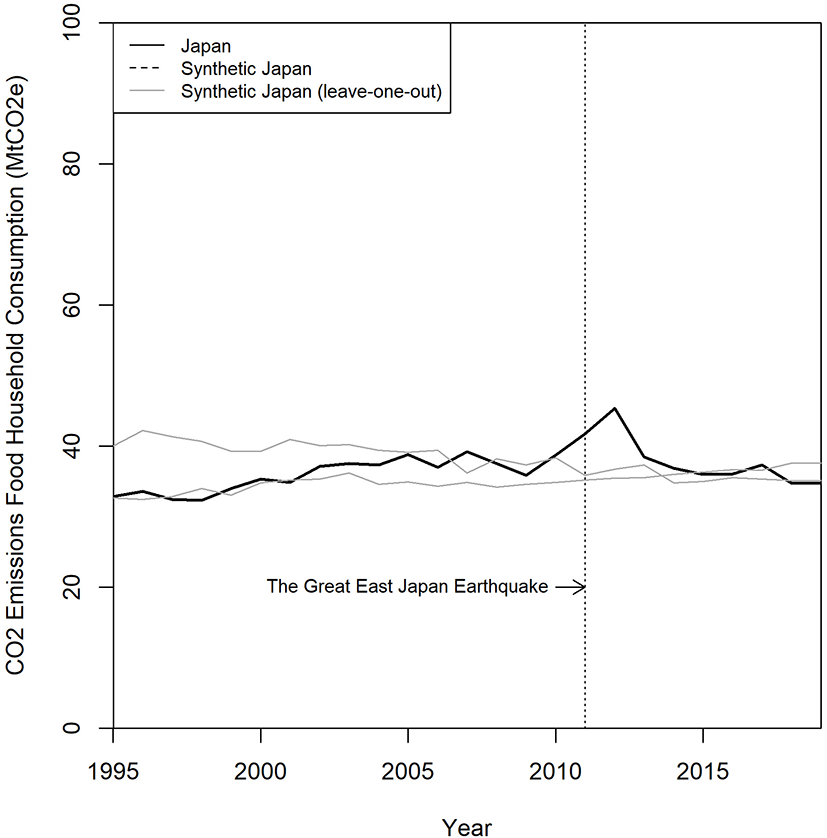
Leave-one-out distribution.
The gray lines of synthetic Japan with one of the four countries left out are reproduced and they are close to each other. There are gaps between actual Japan and eight gray lines, implying that the model is robust to the exclusion of any particular country (Gong and Rao, 2016). Last, the ratio of the post- to pre-intervention period MSPE of all 33 units (1 treated and 32 control units) is presented in Figure 10. The ratio of Japan stands out and the post-natural disaster MSPE is 45.88 times the pre-natural disaster MSPE. The second-highest ratio is 24.07 in Germany, which shows the ratio of Japan to be 191% bigger than that of Germany. The probability of obtaining such a large ratio as Japan is 1/32 = 0.031 (3.1%) when any country randomly experiences the intervention. Table 4 presented the ratio of post- to pre-intervention MSPE and root mean squared prediction error (RMSPE)7. Empirically, the researcher can assess the goodness of fit by estimating MSPE or RMSPE; it is a general principle that the ratio showing the largest value shows that there is an impact of the intervention. Both indicative ratios of Japan are far from the rest of the countries. Therefore, there is a substantial event affecting the CO2 emissions from household food consumption.
Figure 10
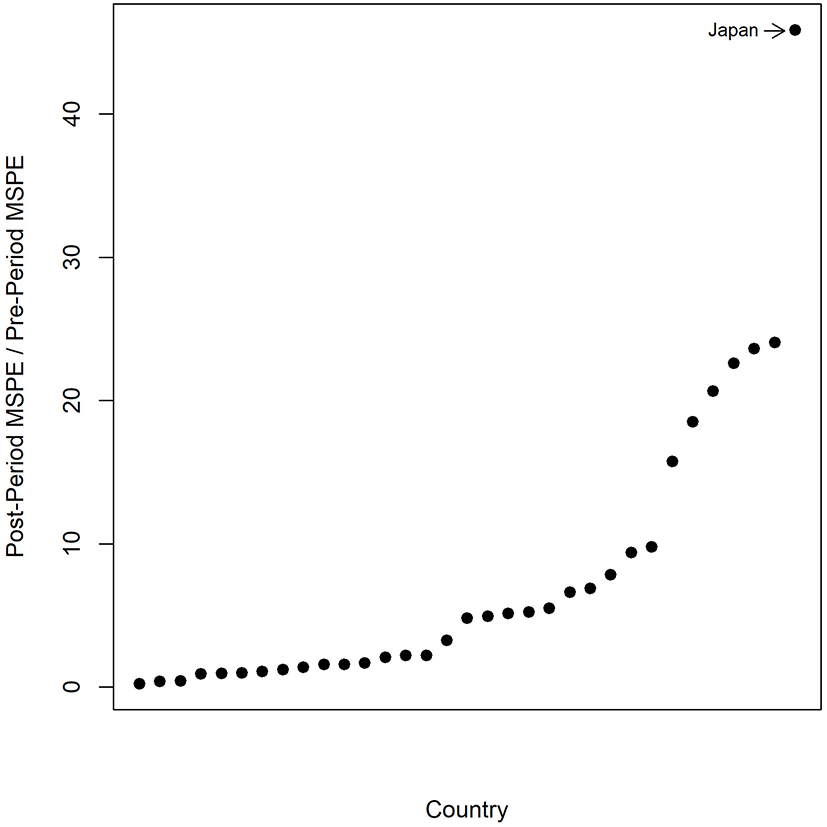
Post-/pre-period MSPE ratio.
Table 4
| Country | MSPE ratio | RMSPE ratio | Country | MSPE ratio | RMSPE ratio |
|---|---|---|---|---|---|
| (post/pre) | (post/pre) | (post/pre) | (post/pre) | ||
| Japan | 45.88 | 6.77 | Sweden | 3.26 | 1.81 |
| Germany | 24.07 | 4.91 | Hungary | 2.22 | 1.49 |
| Romania | 23.62 | 4.86 | Costa Rica | 2.21 | 1.48 |
| Greece | 22.60 | 4.75 | New Zealand | 2.09 | 1.44 |
| United Kingdom | 20.67 | 4.55 | Czech Republic | 1.69 | 1.30 |
| Israel | 18.53 | 4.31 | Austria | 1.58 | 1.26 |
| Chile | 15.75 | 3.97 | Colombia | 1.57 | 1.25 |
| Slovak Republic | 9.79 | 3.13 | Bulgaria | 1.38 | 1.17 |
| The Netherlands | 9.39 | 3.06 | Italy | 1.21 | 1.10 |
| Norway | 7.85 | 2.80 | Iceland | 1.08 | 1.04 |
| Mexico | 6.89 | 2.62 | Slovenia | 0.98 | 0.99 |
| Russia | 6.62 | 2.57 | United States | 0.96 | 1.98 |
| Croatia | 5.49 | 2.34 | Portugal | 0.91 | 0.95 |
| Turkey | 5.24 | 2.29 | Australia | 0.43 | 0.66 |
| Lithuania | 5.13 | 2.27 | Poland | 0.38 | 0.62 |
| Brazil | 4.95 | 2.23 | Cyprus | 0.23 | 0.48 |
| Latvia | 4.81 | 2.19 |
MSPE/RMSPE ratio (post- to pre-intervention).
Source: MSCMT.
Conclusion and discussion
Dietary behaviors can be influenced by various factors from socioeconomic status, culture, demographics, and lifestyle (Czarnocinska et al., 2020), and Grosso et al. (2020) asserted that dietary choices link environmental sustainability and human health. The 2011 Great East Japan Earthquake (GEJE) caused a nuclear meltdown that affected consumers' determinants of dietary intake and behavior in Japan. For example, Tobler et al. (2011) studied how consumers decide to consume more ecological food (environmental decisions). They analyzed how external circumstances and food-related features influenced meat consumption. In the case of Japan, after the natural disaster, consumers were anxious about the safety of food products originating from their seas. The consumption per capita of fish products decreased by 11.3% while beef consumption increased by 13.7% between 2011 and 2020 (Food and Agricultural Organization (FAO) of the United Nations, 2022); therefore, the imports of meat (20.7%), sheep (25.4%), and poultry (49.5%) increased (United Nations [UN] Comtrade Database, 2022). Scarborough et al. (2014) demonstrated that animal-sourced foods present higher energy use and GHG emissions than plant-sourced foods, and even among animal-sourced foods, beef emits higher GHG emissions than fish (Barthelmie, 2022), thus motivating the analysis of the relationship between CO2 emissions per capita and the change in dietary patterns.
The aim of the present study is to determine the relationship between the change in dietary patterns and CO2 emissions from household food consumption in Japan after the GEJE by employing the synthetic control method (SCM). The core of applying the method is to create the synthetic control unit which is constructed from control units. The unit is used to analyze how much impact the change in dietary patterns has on CO2 emissions. By performing the estimation with the treated (Japan) and the control units (32 countries), this study demonstrated that two trajectory lines (Japan and synthetic Japan) are on a similar path and diverged after the time of the event. The gaps between the two trajectory lines also indicate the impact of the change in dietary patterns on the CO2 emissions from household food consumption. SCM is a useful tool for the estimation with limited data; however, it can cause sensitivity and robustness problems8. The selection of predictors is crucial for reliable results. The predictor indicating dissimilarity creates an unexpected shock with an insignificant conclusion. To support statistical inference to the relationship between the change of dietary patterns and CO2 emissions from household food consumption, this study works with placebo studies, a leave-one-out test, and the post- to pre-MSPE ratio. The graphical results presented prove that the divergent trajectory lines are due to the intake and consumption behavior.
The graphical results and statistical inferences presented here demonstrate the connection between the change in dietary patterns and CO2 emissions from household food consumption. With placebo studies, the study eliminates the countries showing a higher MSPE than Japan except the ones presenting positive effects on CO2 emissions. The leave-one-out test shows the sensitivity of the result by reproducing the four countries participating in constructing the synthetic control unit as being exposed to a natural disaster. Then, the post-/pre-MSPE ratio presents that the ratio of Japan is 191% bigger than the second-largest country, which indicates that natural disaster has a bigger impact on Japan than any other country. However, there is also an implication that should be considered. This study aimed to show that the change in dietary patterns caused the increase of CO2 emissions from household food consumption after the natural disaster. However, the westernization of the diet can be another long-term factor affecting climate change. Therefore, future research can involve analyzing the impact of CO2 emissions from household food consumption in multiple treated countries with multiple interventions. This study employed the change of dietary patterns caused by the nuclear accident after the GEJE as an intervention, but there might also be a political action that prohibited the consumption of seafood. Additionally, such future research could estimate the unintended impact of the intervention. South Korea was not directly affected by the natural disaster, but the country was concerned about nuclear reactors. The direct (Japan) and indirect impacts (South Korea) of the natural disaster on CO2 emissions are worth exploring.
Statements
Data availability statement
The original contributions presented in the study are included in the article/supplementary material, further inquiries can be directed to the corresponding author/s.
Author contributions
SE organized the data, performed the statistical analysis, and wrote every sections in the manuscript.
Conflict of interest
The author declares that the research was conducted in the absence of any commercial or financial relationships that could be construed as a potential conflict of interest.
Publisher’s note
All claims expressed in this article are solely those of the authors and do not necessarily represent those of their affiliated organizations, or those of the publisher, the editors and the reviewers. Any product that may be evaluated in this article, or claim that may be made by its manufacturer, is not guaranteed or endorsed by the publisher.
Footnotes
1.^ Japan Meteorological Agency (JMA) named it “The 2011 off the Pacific Coast of Tohoku Earthquake” or “Great East Japan Earthquake (GEJE) Disaster” by Cabinet decision (Zhang et al., 2019).
2.^ The superscript N above Y indicates the outcome is not exposed to the intervention, and the superscript I above Y indicates the outcome is exposed to the intervention.
3.^ The intake of nutrition affects CO2 emissions (fruit: 4.6, vegetable: 2.8, sugar: 0.6, beef: 14.1, oil: 0.8, and drink: 2.2 gCO2e/kcal) (Food and Agricultural Organization (FAO) of the United Nations, 2021).
4.^ There are variables showing differences between Japan and synthetic Japan. This is because Japan's consumptions are moderate relative to the countries in the control unit, and it implies there is no linear combination of countries (Chelwa et al., 2015) that implies synthetic Japan is not perfectly produced.
5.^ The results are from R-Package and the codes are modified in this study (Becker et al., 2016).
6.^ The statistical inference indicates the statistical significance of the proximity of the synthetic control unit to the treated unit. After excluding one times higher MSPE than Japan, Figure 9 shows 28 unaffected units. The proximity of the synthetic control unit to the treated unit has a probability of 1/28 (0.036) and shows a 96% significance of proximity.
7.^ RMSPE is the rooted value of MEPE.
8.^ There is a study applying 13 control units (Gong and Rao, 2016).
References
1
Abadie A. Diamond A. Hainmueller J. (2009). Synthetic Control Methods for Comparative Case Studies Estimating the Effect of California's Tobacco Control Program. NBER Working paper 12831. 10.3386/w12831
2
Abadie A. Diamond A. Hainmueller J. (2010). Synthetic control methods for comparative case studies: estimating the effect of California's tobacco control program. J. Am. Stat. Assoc. 105, 493–505. 10.1198/jasa.2009.ap08746
3
Abadie A. Diamond A. Hainmueller J. (2012). Synth: an R package for synthetic control methods in comparative case studies. J. Stat. Softw. 42, 1–17. 10.18637/jss.v042.i13
4
Abadie A. Gardeazabal J. (2003). The economic costs of conflict: a case study of the Basque country. Am. Econ. Rev. 93, 113–132. 10.1257/000282803321455188
5
Aleksandrowicz L. Green R. Joy E. J. Smith P. Haines A. (2016). The impact of dietary change on greenhouse gas emissions, land use, water use, and health: a systematic review. PLoS ONE. 11, e0165797. 10.1371/journal.pone.0165797
6
Alhashim R. Deepa R. Anandhi A. (2021). Environmental impact assessment of agricultural production using LCA: A review. Climate9, 164. 10.3390/cli9110164
7
Amagai T. Ichimaru S. Tai M. Ejiri Y. Muto A. (2014). Nutrition in the great east Japan earthquake disaster. Nutr Clin Pract. 29, 585–594. 10.1177/0884533614543833
8
Ando M. (2015). Dreams of urbanization: quantitative case studies on the local impacts of nuclear power facilities using the synthetic control method. J. Urban Econ. 85, 68–85. 10.1016/j.jue.2014.10.005
9
Argyriou I. Bae H. Brehm C. Cho S. Gopal S. Ha Y. et al . (2013). International Energy Policy in the Aftermath of the Fukushima Nuclear Disaster: An Analysis of Energy Policies of the U.S., U.K., Germany, France, Japan, China and Korea. Center for Energy and Environment Policy. Center for Energy and Environmental Policy, University of Delaware.
10
Augustin-Jean L. Poulain J. (2019). Risk and Food Safety in China and Japan–Theoretical Perspective and Empirical Insight. London and New York, NY: Routledge Taylor & Francis Group. 10.4324/9781315178813
11
Bachev H. (2021). Agri-Food Impact of Fukushima Nuclear Accident—Lessons Learned 10 Years After Disaster. MPRA Paper No. 108041. 10.2139/ssrn.3856217
12
Baek K. M. Kim S. H. Koo S. M. Gim U. S. (2018). A study on the classification of consumer types based on food safety attitudes: focusing on the Fukushima nuclear accident. Korean J. Agric. Sci. 45, 889–903. 10.7744/kjoas.20180094
13
Barthelmie R. J. (2022). Impact of dietary meat and animal products on GHG footprints: the UK and the US. Climate10, 43. 10.3390/cli10030043
14
BBC (2021). Fukushima Disaster: What Happened at the Nuclear Plant? Available online at: https://www.bbc.com/news/world-asia-56252690035
15
Becker M. Kloßner S. Pfeifer G. (2016). Cross-Validating Synthetic Controls. MPRA Paper No. 83679. Available online at: https://mpra.ub.uni-muenchen.de/83679/
16
Bohn S. Lofstrom M. Raphael S. (2014). Did the 2007 legal arizona workers act reduce the state's unauthorized immigrant population?Rev. Econ. Stat. 96, 258–269. 10.1162/REST_a_00429
17
Bouttell J. Craig P. Lewsey J. Robinson M. Popham F. (2018). Synthetic control methodology as a tool for evaluating population-level health interventions. J. Epidemiol. Commun. Health.72, 673–678. 10.1136/jech-2017-210106
18
Butler A. W. Mayer E. J. (2015). Making Decisions with Data: An Introduction to Causal Inference. Rice University. Available online at: http://dholakia.web.rice.edu/CausalInference.pdf
19
Center for Sustainable System (2022). Carbon Footprint Factsheet. University of Michigan. Pub. No. CSS09-05.
20
Chelwa G. Walbeek C. V. Blecher E. (2015). Evaluating South Africa's Tobacco Control Initiative: A Synthetic Control Approach. ERSA Working Paper 567, National Treasury of South Africa.
21
Crippa M. Solazzo E. Guizzardi D. Monforti-Ferrario F. Tubiello F. N. Leip A. (2021). Food systems are responsible for a third of global anthropogenic GHG emissions. Nat. Food. 10.1038/s43016-021-00225-9
22
Czarnocinska J. Wadolowska L. Lonnie M. Kowalkowska J. Jezewska-Zychowicz M. Babicz-Zielinska E. (2020). Regional and socioeconomic variations in dietary patterns in a representative sample of young polish females: a cross-sectional study. Nutr. J. 19, 26.10.1186/s12937-020-00546-8
23
Food and Agricultural Organization (FAO) of the United Nations (2020). Emissions Due to Agriculture—Global, Reginal and Country Trends 2000–2018. FAOSTAT Analytical Brief, Vol. 18.
24
Food and Agricultural Organization (FAO) of the United Nations (2021). Chapter 6: Meat OECD-FAO Agricultural Outlook 2021–2030.
25
Food Agricultural Organization (FAO) of the United Nations (2022). Meat and Fish Consumption per Capita. Available online at: https://www.fao.org/faostat/en/#home
26
Food Agriculture Organization of the United Nations (2013). Per Capita Food Supply by Country. Available online at: http://faostat3.fao.org/ (accessed August 2, 2022).
27
Fremeth A. R. Holburn G. F. Richter B. K. (2013). Making Causal Inference in Small Samples using Synthetic Control Methodology: Did Chrysler Benefit from Government Assistance?10.5465/ambpp.2013.10343abstract. Available online at: https://ssrn.com/abstract=2135294 (accessed July 23, 2013)
28
Gerber P. J. Steinfeld H. Henderson B. Mottet A. Opio C. Dijkman J. et al . (2013). Tackling Climate Change Through Livestock-A Global Assessment of Emissions and Mitigation Opportunities. Rome: Food and Agriculture Organization of the United Nations (FAO).
29
Gong X. Rao M. (2016). The economic impact of prolonged political instability: a case study of Fiji. Policy Stud.37, 370–386. 10.1080/01442872.2016.1157856
30
Gonzalez A. Frostell B. Carlsson-Kanyama A. (2011). Protein efficiency per unit energy and per unit greenhouse gas emissions: potential contribution of diet choices to climate change mitigation. Food Policy36, 562–570. 10.1016/j.foodpol.2011.07.003
31
Grossi G. Goglio P. Vitali A. Williams A. G. (2019). Livestock and climate change: impact of livestock on climate and mitigation strategies. Anim. Front.9, 69–76. 10.1093/af/vfy034
32
Grosso G. Fresán U. Bes-Rastrollo M. Marventano S. Galvano F. (2020). Environmental impact of dietary choices: role of the Mediterranean and other dietary patterns in an Italian cohort. Int. J. Environ. Res. Public Health. 17, 1468. 10.3390/ijerph17051468
33
Hikichi H. Aida J. Kondo K. Tsuboya T Kawachi I. (2019). Residential relocation and obesity after a natural disaster: a natural experiment from the 2011 Japan Earthquake and Tsunami. Sci. Rep. 9, 374. 10.1038/s41598-018-36906-y
34
Intergovernmental Panel for Climate Change [IPCC] (2021). Climate Change and Land-An IPCC Special Report on Climate Change, Desertification, Land Degradation, Sustainable Land Management, Food Security, and Greenhouse Gas Fluxes in Terrestrial Ecosystems. World Meteorological Organization (WMO) and United Nations Environment Program (UNEP). 10.1017/9781009157988
35
Keele L. (2015). The statistics of causal inference: a view from political methodology. Polit. Anal.23, 313–335. 10.1093/pan/mpv007
36
Koshimura S. Shuto N. (2015). Response to the 2011 great East Japan earthquake and tsunami disaster. Philos. Trans. A Math. Phys. Eng. Sci. 373, 20140373. 10.1098/rsta.2014.0373
37
Lucas T. Horton R. (2019). The 21st-century great food transformation. Lancet. 393, 386–38710.1016/S0140-6736(18)33179-9
38
Murakami K. Livingston M. Sasaki S. (2018). Thirteen-year trends in dietary patterns among Japanese adults in the national health and nutrition survey 2003-2015: continuous westernization of the Japanese diet. Nutrients. 10, 1–15. 10.3390/nu10080994
39
Nemecek T. Jungbluth N. Canals L. M. Schenck R. (2016). Environmental impacts of food consumption and nutrition: where are we and what is next?Int. J. Life Cycle Assess. 21, 607–62010.1007/s11367-016-1071-3
40
OECD Statistics (2016a). GHG Gas Emissions. Available online at: http://stats.oecd.org/ (accessed August 2, 2022).
41
OECD Statistics (2016b). Annual Labor Force Statistics. Available online at: http://stats.oecd.org/ (accessed August 2, 2022).
42
OECD Statistics (2016c). Economic Outlook No. 99. Available online at: http://stats.oecd.org/ (accessed August 2, 2022).
43
Petsko E. (2021). Wild Seafood Has a Lower Carbon Footprint than Red Meat, Cheese, and Chicken, According to Latest Data. Available online at: https://oceana.org/blog/wild-seafood-has-lower-carbon-footprint-red-meat-cheese-and-chicken-according-latest-data/ (accessed November 1, 2022).
44
Prand-Stritzko B. Steinhauser G. (2017). Characteristics of radiocesium contaminations in mushrooms after the Fukushima nuclear accident: evaluation of the food monitoring data from March 2011 to March 2016. Environ. Sci. Pollut Res. 25, 2409–2416. 10.1007/s11356-017-0538-5
45
Ritchie H. (2019). “Food production is responsible for one-quarter of the world's greenhouse gas emissions,” in Our World in Data. Available online at: https://ourworldindata.org/food-ghg-emissions
46
Rogissart L Foucherot C. Bellassen V. (2019). Estimating Greenhouse Gas Emissions from Food Consumption: Methods and Results. Inconnu hal-02119577. Available online at: https://hal.archives-ouvertes.fr/hal-02119577/document
47
Scarborough P. Appleby P. N. Mizdrak A. Briggs A. D. Travis R. C. Bradbury K. E. et al . (2014). Dietary greenhouse gas emissions of meat-eaters, fish-eaters, vegetarians and vegans in the UK.”Clim. Change125, 179–192. 10.1007/s10584-014-1169-1
48
Sugimoto M. Murakami K. Fujiwara A. Asakura K. Masayasu S. Sasaki S. (2021). Association between diet-related greenhouse gas emissions and nutrient intake adequacy among Japanese adults. PLoS ONE. 15, e0240803. 10.1371/journal.pone.0240803
49
Tobler C. Visschers V. Siegrist M. (2011). Eating green. Consumers' willingness to adopt ecological food consumption behaviors. Appetite57, 674–682. 10.1016/j.appet.2011.08.010
50
United Nations [UN] Comtrade Database (2022). Available online at: https://comtrade.un.org/
51
Wolfson J. A. Willits-Smith A. M. Leung C. W. Heller M. C. Rose D. (2021). Cooking at home, fast food, meat consumption, and dietary carbon footprint among US adults. Int. J. Environ. Res. Public Health19, 853. 10.3390/ijerph19020853
52
World Nuclear Association (2018). Fukushima Daiichi Accident. Available online at: https://world-nuclear.org/
53
Xu X. Jain A. (2021). Food Production Generate More Than a Third of Manmade Greenhouse Gas Emissions—A New Framework Tells Us How Much Comes From Crops, Countries and Regions. The Conversation. Available online at: https://theconversation.com/
54
Yue Q. Xu X. Hillier J. Cheng K. Pan G. (2017). Mitigating greenhouse gas emissions in agriculture: from farm production to food consumption. J. Clean. Prod. 149, 1011–1019. 10.1016/j.jclepro.2017.02.172
55
Zhang H. Dolan C. Jing S. M. Uyimleshi J. Dodd P. (2019). Bounce forward: economic recovery in post-disaster Fukushima. Sustainability11, 6736. 10.3390/su11236736
Summary
Keywords
climate change, CO2 emissions from household food consumption, dietary patterns change, natural disaster, nuclear meltdown, synthetic control method
Citation
Eun S (2022) Impact of the change in household dietary patterns on CO2 emissions in Japan. Front. Environ. Econ. 1:1010117. doi: 10.3389/frevc.2022.1010117
Received
02 August 2022
Accepted
11 November 2022
Published
09 December 2022
Volume
1 - 2022
Edited by
Gideon Danso-Abbeam, University for Development Studies, Ghana
Reviewed by
Chukwuma Ume, University of Nigeria, Nigeria; Eliaza Mkuna, Mzumbe University, Tanzania
Updates
Copyright
© 2022 Eun.
This is an open-access article distributed under the terms of the Creative Commons Attribution License (CC BY). The use, distribution or reproduction in other forums is permitted, provided the original author(s) and the copyright owner(s) are credited and that the original publication in this journal is cited, in accordance with accepted academic practice. No use, distribution or reproduction is permitted which does not comply with these terms.
*Correspondence: Sungtae Eun steun99@gmail.com
This article was submitted to Agricultural Economics, a section of the journal Frontiers in Environmental Economics
Disclaimer
All claims expressed in this article are solely those of the authors and do not necessarily represent those of their affiliated organizations, or those of the publisher, the editors and the reviewers. Any product that may be evaluated in this article or claim that may be made by its manufacturer is not guaranteed or endorsed by the publisher.