 Mandana Barghi1†
 Eric Fries1†
 Rahmi Chowdhury1
 Jennifer Provencher2
 Mark L. Mallory3
 Bonnie M. Hamilton4,5
 Roxana Sühring1*
- 1Department of Chemistry and Biology, Toronto Metropolitan University, Toronto, ON, Canada
- 2Environment and Climate Change Canada, Ecotoxicology and Wildlife Health Division, National Wildlife Research Centre, Ottawa, ON, Canada
- 3Biology Department, Acadia University, Wolfville, NS, Canada
- 4Department of Ecology and Evolutionary Biology, University of Toronto, Toronto, ON, Canada
- 5Environment and Climate Change Canada, Air Quality Processes Research Division, Centre for Atmospheric Research Experiments, Egbert, ON, Canada
Organophosphate esters (OPEs) are a diverse group of synthetic organic chemicals used in a variety of plastics as plasticizers, flame retardants, and other application. OPEs were initially considered to pose minimal environmental risk. However, there has been increasing evidence that OPEs can undergo long-range transport into remote areas such as the Canadian Arctic via air, water, or associated to plastic particles. Moreover, Arctic seabirds with high loads of ingested plastics have been found to have elevated concentrations of OPEs, suggesting that plastics containing OPEs might act as sources of OPEs in biota. Further research into OPE mixtures that biota are exposed to is warranted. Yet, existing methods for OPE analysis in biota typically cover fewer than 20 OPEs and few tissue types. Here we present a method for the analysis of 34 OPEs in seabird eggs and liver tissue, as well as fish liver tissue using ultrasound assistant extraction, solid-phase extraction clean-up, and high-performance liquid chromatography coupled with atmospheric pressure chemical ionization high-resolution mass-spectrometry. The validated method showed good linearity (R2 > 0.99), average recoveries for native and isotope-labelled analytes between 70% and 120%, and inter-day precision of between 2.25% and 25.4% (median <15%). The variety of OPEs included in this new method enables the investigation of OPEs with a broad range of physical-chemical properties and applications in biota samples. The detection of highly non-polar OPEs in Arctic biota tissue highlights the need for further investigation of the bioaccumulation potential of these substances. Moreover, the high detected concentrations of up to 147 ng g−1 ww of the OPE metabolite Bis(1,3-dichloro-2-propyl) phosphate (BDCP) in livers of Arctic seabirds show that these animals were exposed to chlorinated OPEs even if they were not detectable in the tissue.
Highlights
• Simultaneous analysis of 34 organophosphate esters.
• Analysis of lipid-rich tissue of Arctic seabirds and fish.
• Detection of BDCP–a metabolite of TDCIPP as one of the main OPEs in seabird livers.
1 Introduction
Contaminants associated with global plastic pollution have become an increasing concern for human and environmental health (MacLeod et al., 2021; Arp et al., 2021; Teuten et al., 2009; Gunaalan et al., 2020; Katsikantami et al., 2016; Environment and Climate Change Canada and Health Canada, 2020). Plastic additives that are used to impart specific physical-chemical properties to a plastic product are of particlar concern, due to the fact that many functional additives (e.g., antioxidants, flame retardants, plasticizers), colorants, fillers, and reinforcement agents are not chemically bound to the polymer (Wiesinger et al., 2021). This means that these compounds can leach out of plastic products or microplastics and enter the surrounding environment or, if ingested, different biological tissues and organs (Arp et al., 2021; Fries and Sühring, 2023).
Although microplastics and plastic additives are transported over long distances to the Canadian Arctic (AMAP, 2021), there is limited information on the extent plastic particles themselves can act as transport vehicles for plastic additives into the Arctic (Fries and Sühring, 2023; Sühring et al., 2022). Moreover, there is little information on whether ingested plastics can expose biota to plastic additives.
In a recent study, we found strong indications that organophosphate ester (OPE) flame retardants and plasticizer concentrations in seabirds from the Canadian Arctic are associated with their ingestion of plastics (Sühring et al., 2022). The results showed that seabirds accumulate plastic debris, as well as OPEs and seem to be exposed through the ingested plastics (Sühring et al., 2022). However, the study was preliminary and only included a small subset of 17 OPEs, which substantially limited the conclusions we were able to draw from the study.
Similarly, other studies on OPEs in biota have typically focussed on a similar set of up to 17 OPEs. For example, Graeves and Letcher (Greaves and Letcher, 2014) studied 16 OPEs in various herring gull tissues and blood and Lippold et al. (2022) analysed 17 OPEs in whales from the Norwegian Arctic.
Overall, when it comes to the environmental analysis of OPEs, there has been a focus on chlorinated OPEs that are comparatively stable, used in high concentrations, and are of concern regarding potential carcinogenicity (Greaves and Letcher, 2017). However, chlorinated-OPEs are relatively polar, which makes them common water contaminants, but limit their bioaccumulation potential (Greaves and Letcher, 2014; Greaves and Letcher, 2017). Congruently, our previous studies showed that non-chlorinated OPEs were the more important contaminants around seabird colonies and within seabird tissue than chlorinated OPEs (Sühring et al., 2022). Likewise, Graeves and Letcher (Greaves and Letcher, 2014) as well as Lippold et al. (2022) reported that non-chlorinated OPEs accounted for the majority of detectable OPEs in biota samples.
To understand the presence of OPEs in Arctic biota the lack of available analytical methods for a comprehensive set of OPEs in biota tissue must be overcome. One of the main challenges for such a method is the wide range of physical-chemical properties of OPEs [log octanol-water partitioning coefficient (log KOW) ranging from ∼1 to >8] (Zhang et al., 2016) that make it challenging to analyse a representative set of target analytes–especially in lipid-rich biota tissue.
Most available analytical methods use either gas-chromatography coupled with mass-spectrometry (GC-MS) or liquid-chromatography with electrospray ionization coupled with MS (LC-ESI-MS) (Pantelaki and Voutsa, 2020). GC-MS has the advantage that it can detect a wide range of semi-polar and non-polar OPEs (including non-chlorinated OPEs) but is very sensitive to lipid residues (requiring labor-intensive clean-up) and it is often not able to separate stereoisomers (Choi et al., 2020; Bekele et al., 2018; Liu et al., 2018). LC-ESI-MS is much less impacted by lipid residues and provides high resolving power but is limited to relatively polar analytes with log KOW ideally <4 which restricts the analysis of many of the more non-polar non-chlorinated OPEs (Castro et al., 2020; Möller et al., 2012; Li et al., 2020; Zheng et al., 2020).
A potential opportunity to enable both the analysis of non-polar OPEs and the resolving power, robustness of LC-MS against lipid-rich samples is the use of atmospheric pressure chemical ionization (APCI). This technique has successfully been applied for a variety of OPEs including selected polar chlorinated OPEs and non-polar non-halogenated OPEs and can span polarities from log KOW of 1–8 as long as the analysed molecules are <1,500 Da (Letcher et al., 2018; Chu and Letcher, 2015). However, the number of included target analytes reported in the literature has so far been limited to fewer than 20 OPEs, limiting the scope of existing studies.
Here we present a newly developed method for the quantification of 34 OPEs in eggs and liver tissue of seabirds as well as liver tissue of Arctic fish using high performance LC coupled with APCI quadrupole time of flight MS (HPLC-APCI-QToF-MS). This extensive range of OPEs in biota tissue provides new opportunities to investigate the mixture of OPEs different biota are exposed to and enables a thorough investigation of the underexplored connection between ingested plastic pollution and OPE contamination in Arctic biota.
2 Materials and methods
2.1 Chemicals and standards
Thirty-seven native OPEs and six isotope-labelled surrogate standards were analysed in the presented method. A full list of the analyte names and acronyms are presented in Tables 1, 2, respectively.
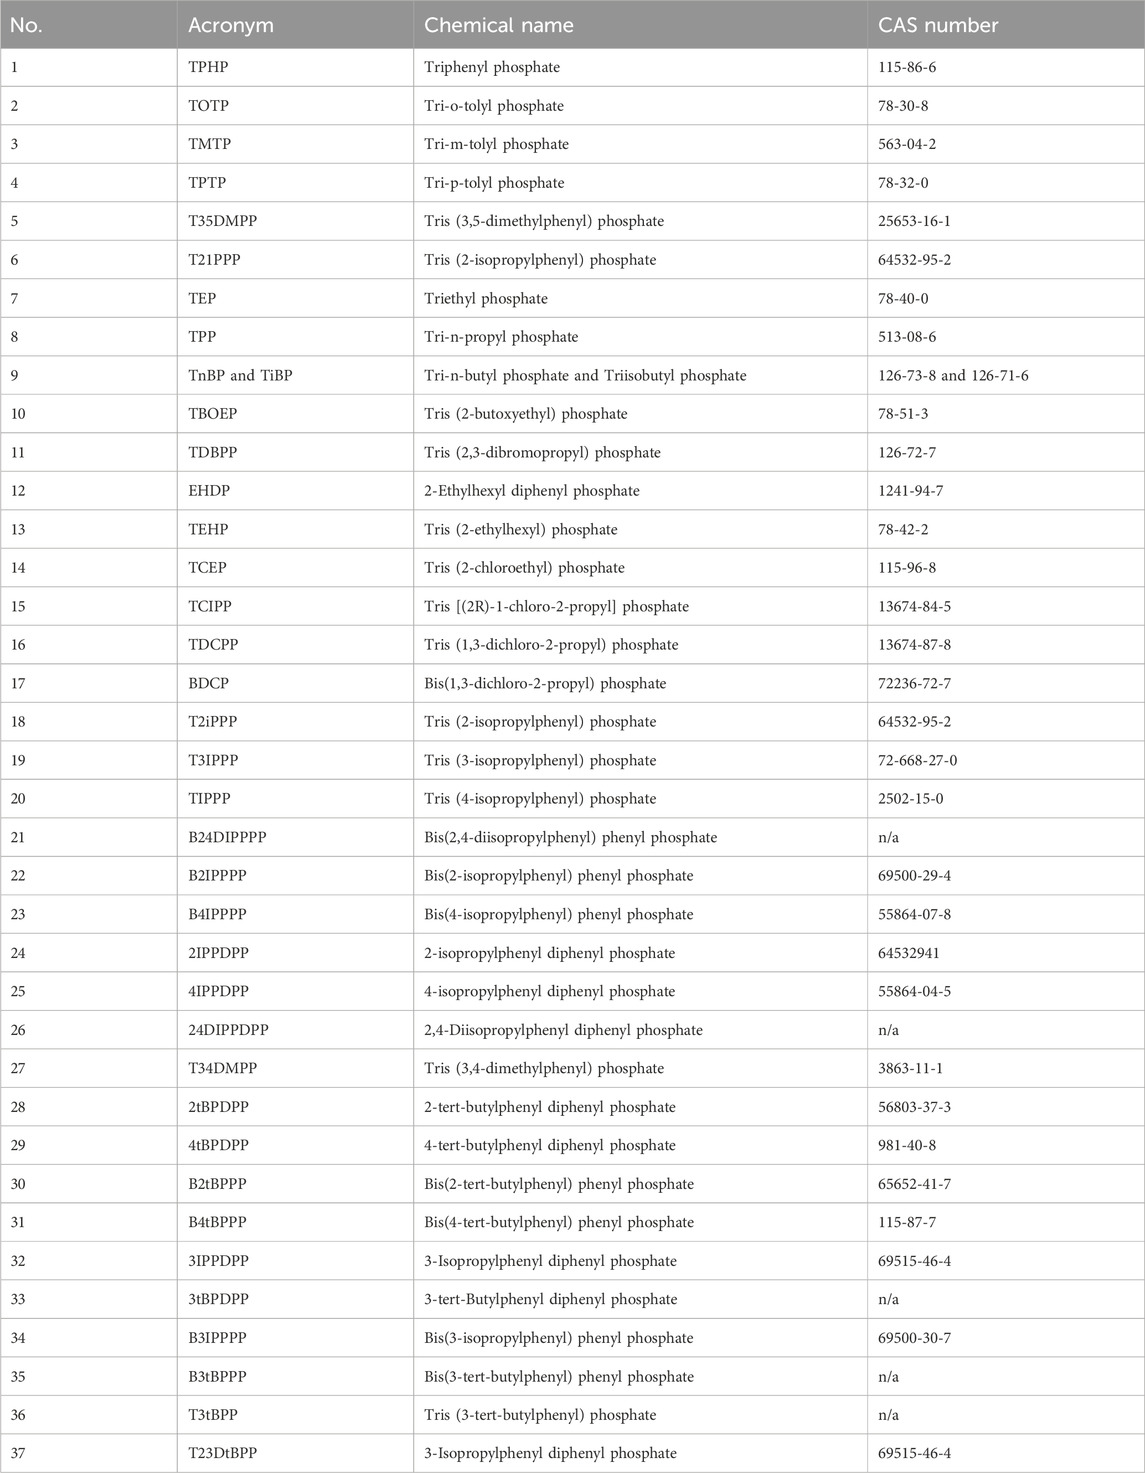
Table 1. Acronym, chemical name, and CAS number of native OPE standards.
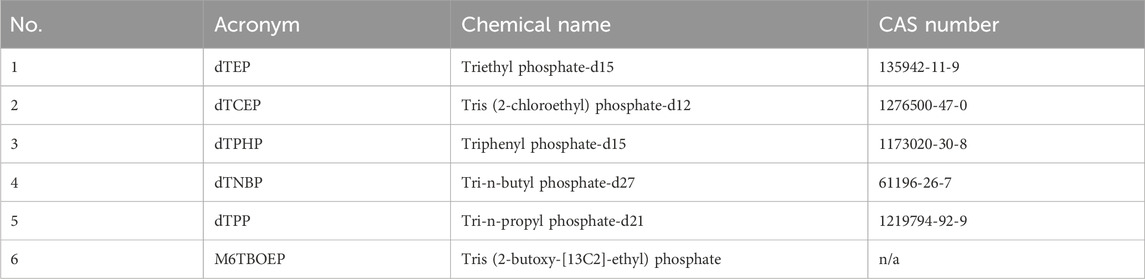
Table 2. Acronym, chemical name, and CAS number of isotope-labelled OPE standards.
Dichloromethane (DCM), hexane (Hex), methanol (MeOH), isooctane (Iso), and acetonitrile (ACN) were HPLC plus grade (purity >99.9%) and obtained from Sigma Aldrich Laboratories (Georgetown, Canada). High-purity formic acid and ammonium formate were obtained from Sigma Aldrich Laboratories (Georgetown, Canada). Sodium sulfate as well as ISOLUTE NH2 1 g, 6 mL and ISOLUTE ENV+ 500 mg, 15 mL cartridges were obtained from Biotage (Charlotte, NC). Cellulose Soxhlet extraction thimbles were purchased from Sigma Aldrich Laboratories (Georgetown, Canada).
2.2 Sample preparation
All samples were homogenised and kept at −20°C until analysis. For analysis, 1 g of the homogenized samples were thawed and mixed with 3 g sodium sulfate. The resulting dried samples were spiked with 20 µL of a mix of five isotope-labelled OPEs (dTEP, M6TBOEP, dTPHP, dTNBP, and dTPP) at 1 ng μL−1 and allowed to soak in for 30 min. For method development, five replicates were spiked with the full set of 37 target OPE analytes as well as the five isotope-labelled OPEs.
2.3 Method development and optimization
2.3.1 Instrumental analysis optimization
An Agilent 1260 Infinity II HPLC system (Santa Clara, California, United States) fitted with an Agilent InfinityLab Poroshell 120 EC-C18 (3.0 × 100 mm, 2.7 micron) column was used for analysis. The mass spectrometer was an Agilent 6546 QToF-MS. A Dual Agilent Jet Stream Electrospray Ionization (ESI) ion source and an Agilent Atmospheric Pressure Chemical Ionization (APCI) were evaluated for the analysis. The ESI source was chosen due to its common use, wide availability, and previous use for the analysis of OPEs in our laboratory. The APCI source was evaluated to enable the analysis of non-polar OPEs outside of the analytical capability of an ESI source (log kow >4).
2.3.1.1 Ion source optimization
Individual OPE standards were scanned at different ion-source settings. The parameters that were optimized included:
• Nozzle voltage (0, 500, 1,000, and 1500 V).
• Fragmentor voltage (65, 75, 115, and 150 V).
• Acquisition rate (1.5, 3, 6 spectra per second).
The nozzle voltage enhances the ionization of apolar molecules while the fragmentor voltage determines the speed at which ions are transferred from the ion source (at atmospheric pressure) into the mass-spectrometer (vacuum). The acquisition rate is the number of spectra per second which is an essential parameter for peak resolution. The parameters were optimized to balance sensitivity and resolution for the target OPE analytes. The tested parameters for electrospray ionization (ESI) are presented in Table 3.
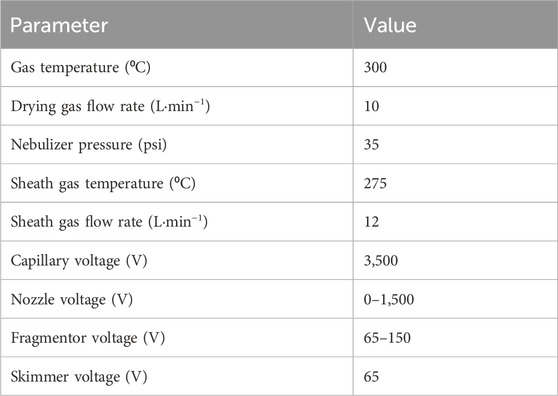
Table 3. Optimization of ESI ion source settings.
The tested parameters for atmospheric pressure chemical ionization (APCI) are presented in Table 4.
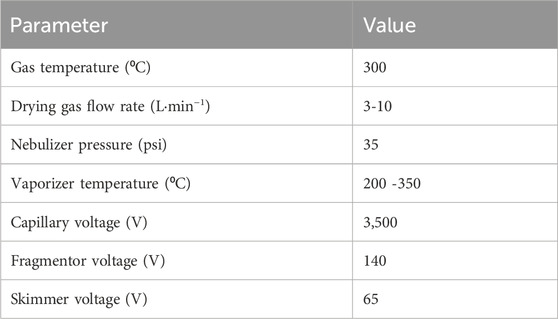
Table 4. Optimization of APCI ion source settings.
An acquisition rate of 6, 3, and 1.5 spectra per second was tested to optimize sensitivity and peak resolution. APCI source parameters were additionally optimized using a 250 pg μL−1 solution of the OPE internal standards (excluding dTCEP), with an injection volume of 1 µL. The vaporizer temperature and the drying gas flow rate were optimized using 25°C increments between 200°C and 350°C. Four drying gas flow rates (3, 5, 7, and 10 L min−1) were tested in conjunction with varying vaporizer temperatures to determine the impact of the analyte peak areas.
2.3.1.2 Quantifier and qualifier selection
Each individual OPE standard was analysed in full-scan mode at a concentration of 1 ng μL−1 to investigate the dominant mass to charge ratio (m/z) to be used as a quantifying ion, as well as at least one minor ion to be used as qualifier. A full list of the resulting quantifier and qualifier ions are presented in the supporting information (Supplementary Table S1).
2.3.1.3 Mobile phase optimization
The mobile phase was chosen based on a previously published literature on OPE detection (Fries and Sühring, 2023; Martínez-Carballo et al., 2007; Sonego et al., 2022; Zhang et al., 2022) and optimized. To optimize peak shape and sensitivity, the responses of native and isotope-labelled standards were compared using different mobile phase additives (5 mM, 10 mM, 50 mM ammonium formate and 0.1% formic acid) in the aqueous portion of the mobile phase and ACN as organic phase for ESI as well as MeOH as organic phase for APCI. For mobile gradient optimization, resolution was evaluated for all detectable target OPEs (34 in APCI and 17 OPEs in ESI). As per manufacturer recommendation, mobile phase flow rates were set to 0.2 mL min−1 for ESI and 0.4 mL min−1 for APCI.
2.3.2 Extraction optimization
Two extraction methods were evaluated: 1) ultrasound assisted extraction for eggs, liver, and fish liver samples and, 2) accelerated Soxhlet extraction for liver samples. To ensure a complete extraction with minimal analyte losses, extraction solvents as well as overall extraction efficiency were tested and optimized using homogenized chicken liver and eggs.
Five different extraction solvent combinations were tested:
1. Iso:DCM, 1:1 (v:v)
2. Hex:DCM, 1:1 (v:v)
3. ACN:DCM, 1:1 (v:v)
4. DCM:MeOH 1:1 (v:v)
5. ACN
For ultrasound assisted extraction, the samples were extracted for 4 × 15 min in 5 mL of the extraction solvent at ambient temperature. Each 5 mL extract was cleaned-up and analysed separately to evaluate and optimize the extraction efficiency.
The accelerated Soxhlet extraction method using VELP Scientific SER 158/6 Solvent Extractor was developed based on the optimized solvent combination from the ultrasound assisted extraction tests. The samples were extracted using 50 mL DCM:ACN, 1:1, (v:v) at the lowest temperature setting. The extraction method started with 50 min immersion, followed by 45 min washing, 30 min recovery, and 4 min cooling. The final volume was ca. 1 mL.
To test the completeness of extraction, three sample replicates were extracted twice and each extract analysed separately.
2.3.3 Clean-up optimization
A solid-phase extraction clean-up method was developed and optimized to reduce interfering sample matrices. Considering the range of physical-chemical properties of OPEs (ranging from polar to non-polar), different cartridges and a multi-step elution method were tested and optimized.
The tested cartridges were ISOLUTE NH2 1 g/6 mL and ISOLUTE ENV+ 500 mg/15 mL.
The tested solvent combinations are presented in Table 5.
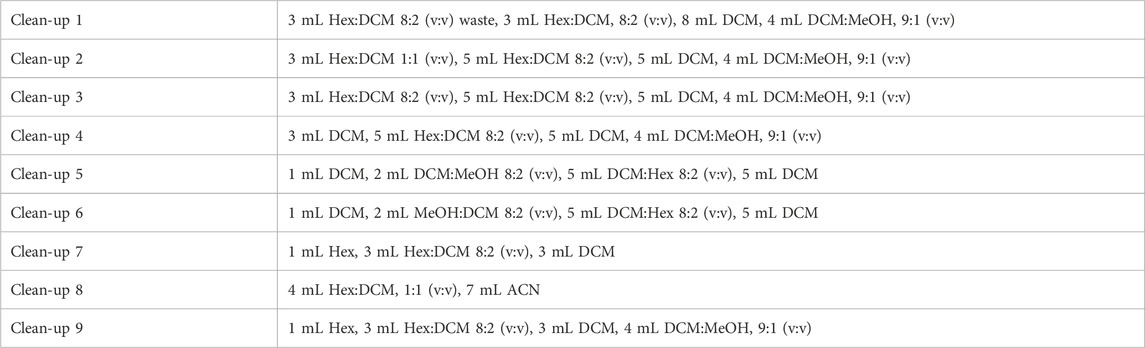
Table 5. Solvent combinations for the 9 different tested clean-up methods.
The recoveries were tested for target analytes and isotope-labelled standards with and without matrix. For method development and optimization, each fraction was collected and analyzed separately.
All cleaned-up sample extracts were reduced in volume to 1 mL under a gentle stream of nitrogen and spiked with 20 µL of the 250 pg μL−1 dTCEP injection standard prior to analysis.
2.4 Quality assurance
All standards were prepared and stored in pre-cleaned 5 mL amber vials with rubber-lined caps. The vials were cleaned by sonicating them in MeOH or acetone for 15 min twice and baking them at 250°C overnight. All glassware was washed in a laboratory dishwasher, baked at 250°C overnight and rinsed with the extraction solvent. The accelerated Soxhlet was run with the cellulose extraction thimbles and 50 mL of extraction solvent for a cleaning run which took in total 129 min; Immersion: 50 min, washing: 45 min, recovery: 30 min and cooling: 4 min.
Laboratory and method blanks were tested for each method development step by spiking pure solvent with the isotope-labelled standards and processing the blank sample in the same way as the samples.
The method limit of detection (MDL) was calculated as the average blank + three times the standard deviation. The method limit of quantification (MQL) was calculated as the average blank +10 times the standard deviation. For compounds without detectable blanks, the detection limit was calculated based on the peak area corresponding to a signal-to-noise ratio of 3 and the quantification limit based on a signal-to-noise ratio of 10. In these cases, the resulting MDL and MQL corresponded to the instrumental detection and quantification limits.
Linearity was tested by analysing the linearity of 5 10-point calibration curves, measured on different days. Precision was evaluated based on the relative standard deviation of the relative peak areas of calibration standards measured five times. The method accuracy and matrix effects were evaluated based on spike recoveries of the target analytes into matrix compared to the target signals in pure solvent. Additionally, the laboratory participated in an interlaboratory study by the Northern Contaminants Program (NCP ILS-17, 2024).
2.5 Data analysis
Peak integration was performed using the MassHunter Quantitative Analysis software version 10.0 by Agilent Technologies. The resulting peak areas, retention times, and signal-to-noise readings for target OPEs and isotope-labelled OPEs were exported to Microsoft excel for further analysis. OPEs were quantified using a 10-point external calibration curve, the accurate mass quantifier, qualifier ions, and retention times. Any analytes below the MDL were excluded from further analysis.
3 Results and discussion
3.1 Results method development and optimization
3.1.1 Instrumental analysis
The optimization of the fragmentor and nozzle voltages in the ESI method was previously reported in Fries and Sühring (Fries and Sühring, 2023). A fragmentor voltage of 75 V and a nozzle voltage of 1,500 V were chosen as the optimal settings, as they provided the greatest signal intensity for the benchmark compounds measured, three of which were isotope-labelled OPEs (dTEP, dTPP, and dTPHP).
For APCI, optimal conditions were determined to be a vaporizer temperature of 200°C and a drying gas flow rate of 5 L min−1, with a median of 77% increase in peak area compared to the other tested conditions.
Both vaporizer temperature and drying gas flow rate had a substantial impact on signal intensity. The high vaporizer pressure used in the initial conditions may have led to the thermal degradation of the OPEs, resulting in lower signal intensity. Similarly, the higher drying gas flow rate used in the initial conditions may have diverted more ions away from the ion capillary, while the lower gas flow rate tested in the optimization (3 L min−1) may have poorly desolvated the ions, both resulting in lower signals. A such, a low vaporizer temperature (200°C) and a lower drying gas flow rate (5 L min−1) were found to be optimal (Figure 1).
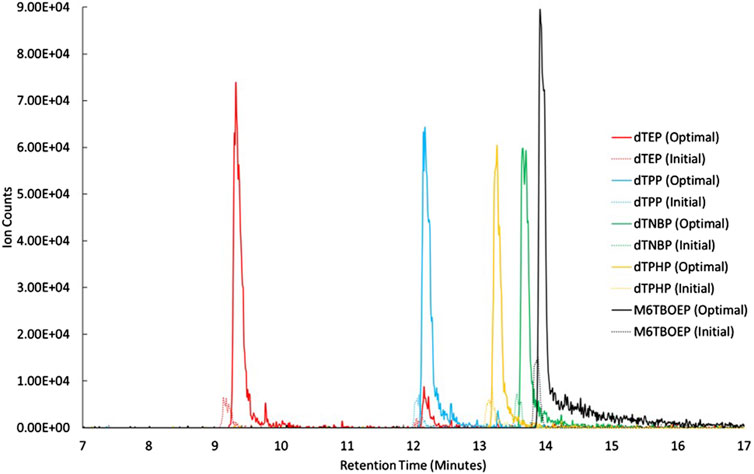
Figure 1. Extracted ion chromatograms of the OPE internal standards analyzed in APCI with a vaporizer temperature = 350°C, and a drying gas flow rate = 10 L min−1 (dashed lines) and at a vaporizer temperature of 200°C, and a drying gas flow rate = 5 L min−1 (solid lines).
ESI enabled the analysis of 17 individual OPEs, whereas APCI allowed for the analysis of 34 individual OPEs due to the ability of the source to ionize more non-polar analytes. Therefore, APCI was chosen as the ionization choice for the final method. Upon testing various combinations of mobile phase additives in both the aqueous and organic components, it was found that a mobile phase system of water with 10 mM ammonium formate and 0.1% formic acid, and methanol with 10 mM ammonium formate and 0.1% formic acid provided the best peak shape when separating the OPEs (Figure 2). As such, this system was used in the final, optimized method (Figure 2).
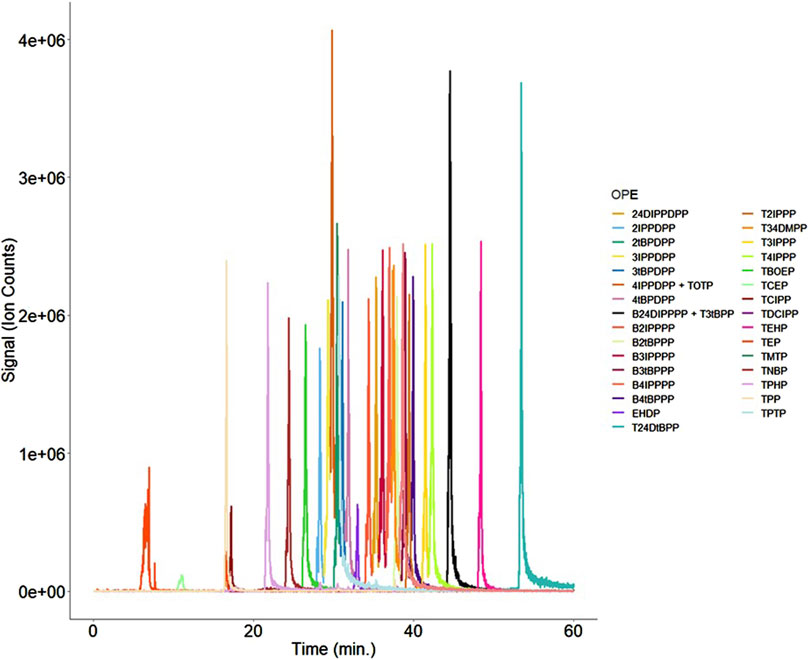
Figure 2. Overlay of the 33 OPEs measured using the finalized APCI method. While most isobars/isomers were partially or fully resolved from one another, two pairs of isobars (4IPPDPP + TOTP and B24DIPPPP + T3tBPP) could not be resolved, and were therefore reported as combined signals.
3.1.2 Extraction and clean-up
For the ultrasound assisted extraction with and without matrix optimization showed best recoveries for both internal and native compounds when using a combination of DCM and ACN (Supplementary Tables S3, S4). Best recoveries (85% ± 6% for dTEP, 85% ± 8% for M6TBOEP, 87% ± 5% for dTPP, 77% ± 5% for dTPHP, and 89% ± 6% for dTNBP) were obtained when extracting at room temperature 3 × 15 min with 5 mL DCM:ACN, 1:1 (v:v) (Supplementary Tables S3, S4). Automated Soxhlet extraction resulted in comparable recoveries as the ultrasound assisted extraction (Supplementary Table S3). Due to the higher throughput of the ultrasound assisted extraction, it was chosen as the extraction method for the final method.
For the SPE clean-up, various combinations of solvents were explored (Figure 3), showing that a higher quantity of DCM led to increasing recoveries (Supplementary Table S3). Additionally, the results showed that most target compounds eluted in the first 3 mL of the eluent. Acetonitrile produced cleaner eluates than hexane and DCM (Supplementary Table S3), which resulted in samples with high turbidity likely due to a reduced elimination of lipids. Isolute NH2 cartridges resulted in slightly better recoveries compared to the ENV + cartridges (Supplementary Table S3). The final clean-up method was therefore clean-up method 8 with Isolute NH2, 1g SPE cartridges with 4 mL Hex:DCM 1:1 (v:v) followed by 7 mL ACN (Figure 3).
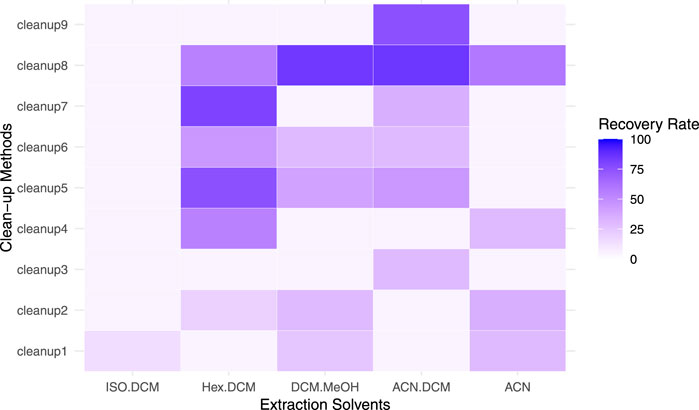
Figure 3. Average OPE recovery rates with and without matrix for different extraction solvent combinations (x-axis, all solvents are a ratio of 1:1 volume by volume) and clean-up methods (y-axis) The clean-up solvent combinations (cleanup1 – cleanup9) are listed in Table 5.
3.2 Final method
3.2.1 Extraction and clean-up
3.2.1.1 Ultrasound assisted extraction
Five mL ACN:DCM, 1:1 (v:v) were added to each 25 mL glass test tube containing the samples and sonicated at room temperature for 15 min. The extraction was repeated twice (three extractions in total) and the extracts for each sample combined. The 15 mL combined extract per sample were reduced in volume to ca. 1 mL in a water bath (40°C) under a gentle stream of nitrogen.
3.2.1.2 Solid-phase extraction clean-up
Isolute NH2, 1 g SPE cartridges (Biotage, Charlottesville) were conditioned using 4 mL Hex:DCM 1:1 (v:v) followed by 7 mL ACN. The ca. 1 mL extracts from the ultrasound assisted extraction were collected using a glass Pasteur-pipette, transferred onto an SPE cartridge, and eluted into 25 mL glass test tube using 4 mL Hex:DCM 1:1 (v:v) followed by 7 mL ACN.
The 11 mL eluate per sample were reduced in volume to ca. 1 mL in a water bath (40°C) under a gentle stream of nitrogen. and transferred into an amber LC autosampler vial with a rubber-lined cap. Finally, 20 µL of the dTCEP injection standard was added to each autosampler vial.
3.2.2 Instrumental analysis
The instrumental analysis was performed on an Agilent 1260 Infinity II HPLC system (Santa Clara, California, United States) fitted with an Agilent InfinityLab Poroshell 120 EC-C18 (3.0 × 100 mm, 2.7 micron) column. The HPLC was coupled with an Agilent 6546 QToF-MS using APCI. The gas temperature was set to 300°C, with high-purity nitrogen as drying gas at a flow rate of 5 L min−1. The nebulizer pressure was 35 psi and the vaporizer temperature 200°C. Applied voltages were, 3,500 V capillary voltage, 140 V fragmentor voltage, and 65 V skimmer voltage (Table 4). The injection volume was 10 µL and the acquisition rate was 1.5 spectra per second. The HPLC flowrate was 0.4 mL min−1. The mobile phase started at 65% water with 10 mM ammonium formate and 0.1% formic acid. The organic phase (methanol with 10 mM ammonium formate and 0.1% formic acid) was increased to 50% over 11 min, followed by 65% over 0.5 min and finally to 100% over 38.5 min, where it was held for 10 min. Post run time were 9 min.
3.2.3 QA/QC
Detectable blanks were in the sub-ng mL−1 range, with highest detectable blanks of 0.78 ng mL−1 for TEP. The resulting blank-corrected MDL ranged from 0.005 ng mL−1 for 2tBPDPP to 1.2 ng mL−1 for TEP. The blank-corrected MQL ranged from 0.016 ng mL−1 for 2tBPDPP to 3.9 ng mL−1 for TEP (Supplementary Table S2).
Linearity was >0.99 for all detectable target analytes apart from B24DIPPPP and T3tBPP which had an R2 of 0.96. The relative standard deviation between repeat measurements ranged between 2.25% for 500 pg μL−1 TPrP and 25.4% for 10 pg μL−1 TCIPP. The median relative standard deviation was below 15% for all calibration points.
Average spike-recoveries (into matrix) for native standards indicated acceptable method accuracy with average recoveries between 70% and 120% (Supplementary Table S3). Average recoveries for the isotope-labelled standards used in the final method with and without matrix were 85% ± 6% for dTEP, 85% ± 8% for M6TBOEP, 87% ± 5% for dTPP, 77% ± 5% for dTPHP, and 89% ± 6% for dTNBP (Supplementary Table S4). The results for the NCP inter laboratory study 2024 (ILS-17) were within the acceptable range of the certified reference materials. The matrix effect, calculated as the % difference between analyte recoveries in matrix and pure solvent, differed between different tissue types, with highest impacts on the signal for bird liver samples (Supplementary Table S4). Species and tissue-specific differences in matrix effects are common due to the presence of sulphur-containing amino acids or other compounds in certain species that can impact the ionization efficiency (Hajšlová and Zrostlíková, 2003; Carrasco et al., 2007). All results were recovery corrected to correct for impacts on the analyte signals both from the sample processing and the matrix.
3.3 Application on biota samples from the Canadian Arctic
3.3.1 Samples
The developed method was applied to eight homogenized common eider (Somateria mollissima borealis) eggs, 10 homogenized black-legged kittiwake (Rissa tridactyla) liver samples, as well as and 11 Arctic char (Salvelinus alpinus) liver samples from the eastern Canadian Arctic provided by Environment and Climate Change Canada (ECCC) and the University of Toronto. Samples were homogenized at the Ottawa ECCC specimen banks and stored at −20°C until analysis.
All samples were processed using the final method described in Section 3.2.
3.3.2 QA/QC
Average recoveries for isotope-labelled OPEs ranged from 69% ± 11% for dTNBP to 96% ± 18% for dTEP in seabird eggs, 85% ± 26% for dTPHP to 128% ± 21% for dTNBP in liver samples, and 71% ± 20% for dTPHP to 90% ± 24% for dTEP in fish liver tissue (Supplementary Table S4).
3.3.3 OPE concentrations in bird eggs, livers, and fish liver tissue
OPEs were detected in every sample in concentrations ranging from ∑34OPEs of 0.16 ng g−1 ww in fish livers to 163 ng g−1 ww in liver tissue of seabirds (Figure 4). The comparatively high concentrations in Arctic seabird liver tissue were driven by high concentrations and detection frequencies of BDCP–a metabolite of the chlorinated OPE TDCPP (Supplementary Table S5). Overall, detectable concentrations of individual OPEs ranged from 2.5 pg g−1 ww for the sum of TMTP, TPTP, and TOTP in fish liver to 147 ng g−1 ww for BDCP in bird livers (Supplementary Tables S4–S6). Due to the limited number of previously published studies, many of the OPEs analysed in this study do not have available literature data. For previously detected OPEs, the concentrations found in this study were generally within the same order of magnitude. For example, Graeves and Letcher (Greaves and Letcher, 2014) reported concentrations for individual OPEs in herring gull eggs from the great lakes in the low ng g−1 ww range. OPE concentrations in herring gull livers reported in the same study, on the other hand, were mostly below the limit of detection, while bird livers in our study had comparatively high detectable OPE numbers and concentrations. An important factor was the inclusion of the metabolite BDCP in our study that was not included in the previously published literature and was found in higher concentrations than any other OPE. Data for BDCP in biota is extremely limited. To the best of our knowledge, the only other study presenting BDCP in biota was published by Su et al. (2014) and reported BDCP in plasma of herring gulls from Lake Huron. They detected BDCP in all analysed samples in concentrations of up to 3.49 ng g−1 ww (Su et al., 2014). Conversely, BDCP has been extensively studied in humans with concentrations of up to μg ml−1 in urine, showing that it is a commonly detected OPE metabolite (Wang et al., 2020). The detection of this chlorinated metabolite in seabird livers highlighted the importance of expanding the list of targeted OPEs in biota studies to include more metabolites.
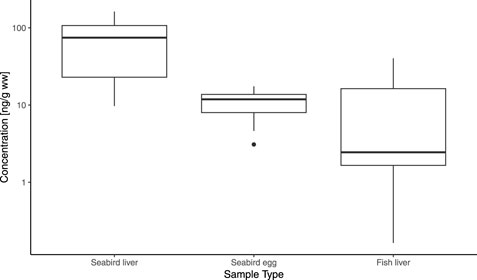
Figure 4. ∑34 OPE concentrations [ng g−1 wet weight] in Arctic seabird livers, seabird eggs, and fish livers.
Apart from BDCP, non-chlorinated OPEs were dominant in seabird eggs and fish livers, which was congruent with OPE patterns in seabirds and fish previously reported (Sühring et al., 2022; Li et al., 2022). The variety of non-chlorinated OPEs detected in the different tissue types, shows the power of HPLC-APCI-MS for a comprehensive analysis of OPEs in biota samples.
3.3.4 Overall evaluation of the method
The unique advantage of this method is its capability to analyze a high number of OPEs (n = 34) in various tissue types without the need for aggressive clean-up methods for lipid removal that could destroy target analytes. The method presents a substantial improvement compared to the highly lipid-sensitive gas-chromatography-MS-based methods that are currently used for the analysis of OPEs in biota both with regards to number of target OPEs that can be included and the workload related to sample processing and clean-up. The recoveries of isotope-labelled standards as well as the MDL and MQL in the pg or low ng g−1 mL range are comparable to previously published analytical methods for OPEs in biota samples (Greaves and Letcher, 2014; Lippold et al., 2022; Li et al., 2022). The use of liquid-chromatography also means that solvent use can be reduced in comparison to many currently available methods that use, for example, gel-permeation chromatography for lipid clean-up of biota samples (Sühring et al., 2012; Rebryk and Haglund, 2021). This not only aligns with sustainability goals but also contributes to a more resource-efficient analytical approach. In addition, the simplicity of the ultrasound-assisted extraction in combination with a standard solid-phase extraction makes the sample processing both accessible and fast.
Data availability statement
The original contributions presented in the study are included in the article/Supplementary Material, further inquiries can be directed to the corresponding author.
Ethics statement
The animal study was approved by the Environment and Climate Change Canada. The study was conducted in accordance with the local legislation and institutional requirements.
Author contributions
MB: Data curation, Formal Analysis, Methodology, Writing–original draft, Writing–review and editing. EF: Data curation, Formal Analysis, Validation, Visualization, Writing–original draft, Writing–review and editing. RC: Methodology, Validation, Writing–original draft, Writing–review and editing. JP: Funding acquisition, Resources, Writing–original draft, Writing–review and editing. MM: Funding acquisition, Resources, Writing–original draft, Writing–review and editing. BH: Funding acquisition, Resources, Writing–original draft, Writing–review and editing. RS: Conceptualization, Data curation, Formal Analysis, Funding acquisition, Methodology, Project administration, Supervision, Writing–original draft, Writing–review and editing.
Funding
The author(s) declare that financial support was received for the research, authorship, and/or publication of this article. This research was supported by Environment and Climate Change Canada, Fisheries and Oceans Canada, the Northern Contaminants Program, and the University of Toronto via both field crews and laboratory support at the National Wildlife Research Centre.
Conflict of interest
The authors declare that the research was conducted in the absence of any commercial or financial relationships that could be construed as a potential conflict of interest.
Generative AI statement
The author(s) declare that no Generative AI was used in the creation of this manuscript.
Publisher’s note
All claims expressed in this article are solely those of the authors and do not necessarily represent those of their affiliated organizations, or those of the publisher, the editors and the reviewers. Any product that may be evaluated in this article, or claim that may be made by its manufacturer, is not guaranteed or endorsed by the publisher.
Supplementary material
The Supplementary Material for this article can be found online at: https://www.frontiersin.org/articles/10.3389/fenvc.2025.1549292/full#supplementary-material
References
AMAP (2021). POPs and chemicals of emerging arctic concern: influence of climate Change. Summary for policy-makers, 16.
Arp, H. P. H., Ku, D., Rummel, C., Macleod, M., Pottho, A., Reichelt, S., et al. (2021). Weathering plastics as a planetary boundary threat: exposure, fate, and hazards. Environ. Sci. Technol. 1. doi:10.1021/acs.est.1c01512
Bekele, T. G., Zhao, H., Wang, Y., Jiang, J., and Tan, F. (2018). Measurement and prediction of bioconcentration factors of organophosphate flame retardants in common carp (Cyprinus carpio). Ecotoxicol. Environ. Saf. 166 (September), 270–276. doi:10.1016/j.ecoenv.2018.09.089
Carrasco, L., Díez, S., and Bayona, J. M. (2007). Methylmercury determination in biota by solid-phase microextraction. J. Chromatogr. A 1174 (1–2), 2–6. doi:10.1016/j.chroma.2007.09.051
Castro, V., Montes, R., Quintana, J. B., Rodil, R., and Cela, R. (2020). Determination of 18 organophosphorus flame retardants/plasticizers in mussel samples by matrix solid-phase dispersion combined to liquid chromatography-tandem mass spectrometry. Talanta. 208 (October 2019), 120470. doi:10.1016/j.talanta.2019.120470
Chen, D., Letcher, R. J., and Chu, S. (2012). Determination of non-halogenated, chlorinated and brominated organophosphate flame retardants in herring gull eggs based on liquid chromatography-tandem quadrupole mass spectrometry. J. Chromatogr. A 1220, 169–174. doi:10.1016/j.chroma.2011.11.046
Choi, W., Lee, S., Lee, H. K., and Moon, H. B. (2020). Organophosphate flame retardants and plasticizers in sediment and bivalves along the Korean coast: occurrence, geographical distribution, and a potential for bioaccumulation. Mar. Pollut. Bull. 156 (May), 111275. doi:10.1016/j.marpolbul.2020.111275
Chu, S., and Letcher, R. J. (2015). Determination of organophosphate flame retardants and plasticizers in lipid-rich matrices using dispersive solid-phase extraction as a sample cleanup step and ultra-high performance liquid chromatography with atmospheric pressure chemical ionization mass spectrometry. Anal. Chim. Acta 885, 183–190. doi:10.1016/j.aca.2015.05.024
Environment and Climate Change Canada, Health Canada (2020). Science assessment of plastic pollution, 32–49.
Fries, E., and Sühring, R. (2023). The unusual suspects: screening for persistent, mobile, and toxic plastic additives in plastic leachates. Environ. Pollut. 335(July):122263, doi:10.1016/j.envpol.2023.122263
Greaves, A. K., and Letcher, R. J. (2014). Comparative body compartment composition and in ovo transfer of organophosphate flame retardants in North American Great Lakes herring gulls. Environ. Sci. Technol. 48 (14), 7942–7950. doi:10.1021/es501334w
Greaves, A. K., and Letcher, R. J. (2017). A review of organophosphate esters in the environment from biological effects to distribution and fate. Bull. Environ. Contam. Toxicol. 98 (1), 2–7. doi:10.1007/s00128-016-1898-0
Gunaalan, K., Fabbri, E., and Capolupo, M. (2020). The hidden threat of plastic leachates: a critical review on their impacts on aquatic organisms. Water Res. 184, 116170. doi:10.1016/j.watres.2020.116170
Hajšlová, J., and Zrostlíková, J. (2003). Matrix effects in (ultra)trace analysis of pesticide residues in food and biotic matrices. J. Chromatogr. A 1000, 181–197. doi:10.1016/s0021-9673(03)00539-9
Katsikantami, I., Sifakis, S., Tzatzarakis, M. N., Vakonaki, E., Kalantzi, O. I., Tsatsakis, A. M., et al. (2016). A global assessment of phthalates burden and related links to health effects. Environ. Int. 97, 212–236. doi:10.1016/j.envint.2016.09.013
Letcher, R. J., Morris, A. D., Dyck, M., Sverko, E., Reiner, E. J., Blair, D. A. D., et al. (2018). Legacy and new halogenated persistent organic pollutants in polar bears from a contamination hotspot in the Arctic, Hudson Bay Canada. Sci. Total Environ. 610–611, 121–136. doi:10.1016/j.scitotenv.2017.08.035
Li, J., Zhang, Y., Bi, R., Ye, L., and Su, G. (2022). High-resolution mass spectrometry screening of emerging organophosphate esters (OPEs) in wild fish: occurrence, species-specific difference, and tissue-specific distribution. Environ. Sci. Technol. 56 (1), 302–312. doi:10.1021/acs.est.1c05726
Li, Z., He, C., Thai, P., Wang, X., Bräunig, J., Yu, Y., et al. (2020). Organophosphate esters and their specific metabolites in chicken eggs from across Australia: occurrence, profile, and distribution between yolk and albumin fractions. Environ. Pollut. 262, 114260. doi:10.1016/j.envpol.2020.114260
Lippold, A., Harju, M., Aars, J., Blévin, P., Bytingsvik, J., Gabrielsen, G. W., et al. (2022). Occurrence of emerging brominated flame retardants and organophosphate esters in marine wildlife from the Norwegian Arctic. Environ. Pollut. 15.
Liu, Y. E., Huang, L. Q., Luo, X. J., Tan, X. X., chen, H. C., Corella, P. Z., et al. (2018). Determination of organophosphorus flame retardants in fish by freezing-lipid precipitation, solid-phase extraction and gas chromatography-mass spectrometry. J. Chromatogr. A 1532, 68–73. doi:10.1016/j.chroma.2017.12.001
MacLeod, M., Arp, H. P. H., Tekman, M. B., and Jahnke, A. (2021). The global threat from plastic pollution. Sci. (1979) 373 (6550), 61–65. doi:10.1126/science.abg5433
Martínez-Carballo, E., González-Barreiro, C., Sitka, A., Scharf, S., and Gans, O. (2007). Determination of selected organophosphate esters in the aquatic environment of Austria. Sci. Total Environ. 388 (1–3), 290–299. doi:10.1016/j.scitotenv.2007.08.005
Möller, A., Xie, Z., Caba, A., Sturm, R., and Ebinghaus, R. (2012). Occurrence and air-seawater exchange of brominated flame retardants and Dechlorane Plus in the North Sea. Atmos. Environ. 46, 346–353. doi:10.1016/j.atmosenv.2011.09.055
Pantelaki, I., and Voutsa, D. (2020). Occurrence, analysis and risk assessment of organophosphate esters (OPEs) in biota: a review. Mar. Pollut. Bull. 160 (October 2019), 111547. doi:10.1016/j.marpolbul.2020.111547
Rebryk, A., and Haglund, P. (2021). Non-targeted screening workflows for gas chromatography–high-resolution mass spectrometry analysis and identification of biomagnifying contaminants in biota samples. Anal. Bioanal. Chem. 413 (2), 479–501. doi:10.1007/s00216-020-03018-4
Sonego, E., Simonetti, G., Di Filippo, P., Riccardi, C., Buiarelli, F., Fresta, A., et al. (2022). Characterization of organophosphate esters (OPEs) and polyfluoralkyl substances (PFASs) in settled dust in specific workplaces. Environ. Sci. Pollut. Res. 29 (34), 52302–52316. doi:10.1007/s11356-022-19486-3
Su, G., Greaves, A. K., Gauthier, L., and Letcher, R. J. (2014). Liquid chromatography-electrospray-tandem mass spectrometry method for determination of organophosphate diesters in biotic samples including Great Lakes herring gull plasma. J. Chromatogr. A 1374, 85–92. doi:10.1016/j.chroma.2014.11.022
Sühring, R., Baak, J. E., Letcher, R. J., Braune, B. M., de Silva, A., Dey, C., et al. (2022). Co-contaminants of microplastics in two seabird species from the Canadian Arctic. Environ. Sci. Ecotechnology 12, 100189. doi:10.1016/j.ese.2022.100189
Sühring, R., Möller, A., Freese, M., Pohlmann, J. D., Wolschke, H., Sturm, R., et al. (2012). Brominated flame retardants and dechloranes in eels from German Rivers. Chemosphere 49, 1–7. doi:10.1016/j.chemosphere.2012.08.016
Teuten, E. L., Saquing, J. M., Knappe, D. R. U., Barlaz, M. A., Jonsson, S., Björn, A., et al. (2009). Transport and release of chemicals from plastics to the environment and to wildlife. Philosophical Trans. R. Soc. B Biol. Sci. 364 (1526), 2027–2045. doi:10.1098/rstb.2008.0284
Wang, C., Chen, H., Li, H., Yu, J., Wang, X., and Liu, Y. (2020). Review of emerging contaminant tris(1,3-dichloro-2-propyl)phosphate: environmental occurrence, exposure, and risks to organisms and human health. Environ. Int. Elsevier Ltd. 143, 105946. doi:10.1016/j.envint.2020.105946
Wiesinger, H., Wang, Z., and Hellweg, S. (2021). Deep dive into plastic monomers, additives, and processing aids. Environ. Sci. Technol. 55 (13), 9339–9351. doi:10.1021/acs.est.1c00976
Zhang, L., Meng, L., Wang, H., Lu, D., and Luo, X. (2022). Development and validation of a liquid chromatography-tandem mass spectrometry method for comprehensive detection of organophosphate esters and their degradation products in sediment. J. Chromatogr. A 1665, 462826. doi:10.1016/j.chroma.2022.462826
Zhang, X., Sühring, R., Serodio, D., Bonnell, M., Sundin, N., and Diamond, M. L. (2016). Novel flame retardants: estimating the physical-chemical properties and environmental fate of 94 halogenated and organophosphate PBDE replacements. Chemosphere 144, 2401–2407. doi:10.1016/j.chemosphere.2015.11.017
Keywords: organophosphate esters (OPEs), Arctic biota, HPLC-QTOF MS, method devlopment, SPE (solid-phase extraction)
Citation: Barghi M, Fries E, Chowdhury R, Provencher J, Mallory ML, Hamilton BM and Sühring R (2025) Development of a sensitive method for the quantitative analysis of 34 organophosphate esters in seabird eggs, liver, and fish liver tissue. Front. Environ. Chem. 6:1549292. doi: 10.3389/fenvc.2025.1549292
Received: 20 December 2024; Accepted: 03 February 2025;
Published: 26 February 2025.
Edited by:
Maurice Millet, Université de Strasbourg, FranceReviewed by:
Matteo Feltracco, Ca’ Foscari University of Venice, ItalyAndrzej R. Reindl, Medical University of Gdansk, Poland
Copyright © 2025 Barghi, Fries, Chowdhury, Provencher, Mallory, Hamilton and Sühring. This is an open-access article distributed under the terms of the Creative Commons Attribution License (CC BY). The use, distribution or reproduction in other forums is permitted, provided the original author(s) and the copyright owner(s) are credited and that the original publication in this journal is cited, in accordance with accepted academic practice. No use, distribution or reproduction is permitted which does not comply with these terms.
*Correspondence: Roxana Sühring, cm94YW5hLnN1ZWhyaW5nQHRvcm9udG9tdS5jYQ==
†These authors have contributed equally to this work and share first authorship