 Sazia Tabassum
 C. B. Kotnala
 A. K. Dobriyal
 Mohammed Salman
 Richa Bamola
94% of researchers rate our articles as excellent or good
Learn more about the work of our research integrity team to safeguard the quality of each article we publish.
Find out more
ORIGINAL RESEARCH article
Front. Environ. Chem. , 05 February 2025
Sec. Environmental Analytical Methods
Volume 6 - 2025 | https://doi.org/10.3389/fenvc.2025.1529439
The Asan Wetland is an important freshwater wetland in Uttarakhand’s Dehradun district. It is known for its diverse flora and fauna and as a stopover for migratory birds. Periphyton, an essential biological component of aquatic ecosystems, serves as a bioindicator of water quality and ecosystem integrity. This study fills a gap in our knowledge of the Asan Wetland’s ecological health by analyzing periphyton populations and a number of physicochemical characteristics across three selected sites from November 2021 to October 2023. Selected sites named as Site 1(S1), Site 2(S2), Site 3 (S3). Monthly variations in parameters such as water temperature, pH, turbidity, transparency, total dissolved solids (TDS), electrical conductivity, dissolved oxygen (DO), total hardness, alkalinity, biological oxygen demand (BOD), chemical oxygen demand (COD), and nutrients were collected, identified and assessed using Ms-excel and Past software. Phosphorus levels in the Asan Wetland indicated a moderate to high nutrient load, peaking in August (1.20–1.25 mg/L) across all three sites and dropping to their lowest in January (0.35–0.65 mg/L). Nitrate levels were moderate, with the highest concentrations in December (1.40–1.55 mg/L) and the lowest in July (0.25–0.35 mg/L), showing similar seasonal patterns across sites. The periphyton was represented in this study by 18 different periphytic taxa that belong to three different classes. These classes include Bacillariophyceae (Cymbella, Navicula, Nitzschia, Fragilaria Meridion, Synedra, Gomphonema, Tabellaria, and Diatoma), members of the Chlorophyceae Ulothrix, Spirogyra, Cosmarium, Microspora, Chlorella, Oedogomium, Zygnema, and Cladophora are, while Phormidium is a member of the Cyanophyceae. The peak periphytic density (individuals/cm2) recorded was 322.67 ± 89.08 × 10³ in January, with all three classes exhibiting maximum values at S3, the minimum periphytic density (individuals/cm2) recorded was 18 ± 5.57 × 10³ in August. The annual percentage composition of periphytic flora in the Asan wetland over 2 years indicates that Bacillariophyceae constituted the predominant group (89%–90%), succeeded by Chlorophyceae (7%–9%) and Cyanophyceae or Myxophyceae (1%–4%) across three sites. The canonical correspondence analysis (CCA) of periphyton among different sites during both years of the study suggested that S3 was more diverse, followed by S1 and S2, represented 64.93%, 35.07% of the variance with eigenvalues of 0.01794, 0.00968 respectively. PCA suggested that PC1 and PC2 were represented by 93.98% and 6.015% of the variance with eigenvalues 279.149 and 17.8675, respectively The multivariate cluster analysis showed the similarity of periphyton at three different sites during the 2-year study. The findings of this study emphasize the need for targeted management strategies to maintain the ecological health of the Asan Wetland.
Wetlands serve as critical interfaces between terrestrial and aquatic ecosystems, offering ecological, hydrological, and social benefits, including biodiversity conservation, water filtration, nutrient cycling, and habitat provision (Blackwell, 2011). Periphyton, a key component of freshwater ecosystems composed of bacteria, fungi, algae, and protozoa, plays a vital role in aquatic food webs by driving primary productivity, nutrient dynamics, and water quality (Gulzar and Agric, 2017; Kumar, 2017; Rojo et al., 2017; Saxena et al., 2024; Singh and Singh, 2024). Found in diverse aquatic habitats, from oligotrophic to eutrophic systems, Periphyton acts as a sensitive bioindicator of ecological health and trophic states (Rojo et al., 2017; Baluni et al., 2019). Its density and diversity are influenced by physicochemical factors such as temperature, pH, nutrients, dissolved oxygen, and turbidity, with disruptions potentially impacting ecosystem balance (Tariq et al., 2021). Elevated nutrient levels, particularly nitrogen and phosphorus, can cause eutrophication and algal blooms, while stable conditions promote diverse periphyton communities and ecological integrity (Pastorino et al., 2024).
The Asan Wetland, located in Uttarakhand’s Dehradun district, is a Ramsar site of global ecological importance, known for its rich biodiversity and as a critical stopover for migratory birds (Khanna and Natural, 2013; Pathak et al., 2024). However, anthropogenic pressures such as agricultural runoff, pollution, habitat modification, tourism, and boating are threatening its ecological health and water quality (Kumar et al., 2018; Rai et al., 2024). Despite its significance, there is a lack of focused research on the wetland’s periphytic communities, which serve as crucial bioindicators of water quality (Sabater and Admiraal, 2005). Although a substantial body of literature exists on limnology at the international and national level (Lai et al., 2018). studied the diatom communities to describe their relationships with environmental variables and to evaluate the impact of an extreme flash flood (Ruggiero et al., 2004). examines the Inter- and intra-annual variation of water chemistry and phytoplankton biomass were addressed. High species richness, diversity, and evenness were found both in epiphytic and epilithic assemblages (Beauger et al., 2020; Tanuja and Nautiyal, 2023) investigated the diatom flora from mineral springs in Auvergne (France) in which a total of 58 taxa were found (Gaiser, 2009; Kaonga and Monjerezi, 2012; Vis et al., 2016)., studied the diatom assemblage in different river basins (Hill et al., 2000; Sabater and Admiraal, 2005; Montuelle et al., 2010; DeNicola and Kelly, 2014) studied the role of periphyton assemblage and their role as an indicator (Wetzel, 1983), recommendations for future work on periphyton (Trbojević et al., 2017), studied the periphyton assemblage in an urban reservoir (Goldsborough et al., 2005)., investigates the periphyton in lakes and wetlands (Wetzel, 2005), also demonstrates the role of periphytons and their management.
In other studies that were carried out in other parts on different rivers and streams on diatom assemblage, their role, as indicators were carried out by (Kelly et al., 1995; Stevenson et al., 2010; Hill et al., 2001; Feio et al., 2007; Kelly et al., 2009; Rimet, 2012; Lavoie et al., 2014; Lobo et al., 2016; Newton et al., 2020; Bartwal and Nautiyal, 2023). Studies on the wetlands were carried out by (Kennish, 2002; Lone et al., 2012; Alam et al., 2017; Mengesha, 2017; Newton et al., 2020; Asgher et al., 2021; Zainulabdeen and Nagaraj, 2022), studied the streams of kashmir himalaya and Arunachal pradesh (Haq et al., 2023; Mustfa et al., 2023; Singh and Himalaya, 2024), studied the periphyton community in uttarakhand (SAGIR and AK Dobriyal, 2020; Gogoi et al., 2021), studied the periphyton community in ponds (Kumar et al., 2013; Mustfa et al., 2023; Vivek Santhiya and Athithan, 2024), studied the periphyton of manipur (Lobo et al., 2016; Trbojević et al., 2017; Alikhani et al., 2023).
Research on periphyton in Uttarakhand state, especially in the regions of the Himalayas. Notable contributions in this area include the works of (Baluni et al., 2018) studied ecological characteristics and the periphytic algal community of the Khankra stream of Garhwal Himalaya, found that the periphytic algal community of Khankra is represented by 21 taxa belonging to 3 major classes (Chauhan and Sharma, 2016; Bahuguna et al., 2021). Found that 19 genera represented the periphytic algal diversity of the Mal Gad stream (Rashid et al., 2013). studied the Periphytic Algal Community of Doodh Ganga and Khansha-Mansha Streams of Yusmarg Forests (Mustfa et al., 2023; SAGIR and AK Dobriyal, 2020). studied the periphyton community of the Nayar River and its tributaries indicated that all these physicochemical parameters were favourable for periphyton growth during the winter season (Badoni et al., 1997; Nautiyal and Kumar, 2001; Nautiyal et al., 2014; Bisht et al., 2019). studied the algal and faunal communities of the Garhwal Himalayas (Lohani and Pant, B, 2017; Yadav et al., 2018) studied the abundance and seasonal variation of Bhimtal Lake and river Ganga (Tariq et al., 2021). investigate the distribution patterns, density, diversity and ecology of the periphyton community in the Balkhila stream, which is a glacier-fed tributary of the Alaknanda River in the Chamoli district of Uttarakhand (Gupta et al., 2008). examines the bio-physical chemical parameters of the Motrowala swamp.
These studies show that periphyton is very sensitive to changes in water quality factors and can show signs of ecological damage early on. The objective of this study is to address the knowledge deficit about the ecological status of the Asan Wetland and its resilience to environmental pressures by evaluating the periphyton density and diversity.
The objectives of this study are to:
• Quantify the density and diversity of periphyton communities in the Asan Wetland,
• Analyze the relationship between periphyton composition and key physicochemical parameters such as pH, dissolved oxygen, nutrient concentrations, and turbidity.
• Evaluate the potential of periphyton as a bioindicator for monitoring water quality in the wetland.
This study investigates the interactions between periphytic communities and environmental factors to develop sustainable management strategies for conserving and restoring the Asan Wetland ecosystem, emphasizing the importance of periphyton in maintaining ecological functions. The findings will provide a basis for future research on periphyton’s role in wetland conservation and offer valuable insights into the health of the Asan Wetland.
The paper is structured as follows: Section 2 details the study area, sampling procedures, and statistical methods; Section 3 presents the results through graphs and figures; and Section 4 discusses the findings, supported by comparisons with previous research.
Asan Wetland is a significant freshwater habitat in the Doon Valley of Dehradun Uttarakhand, India. It is located at an altitude of approximately 403.3 m MSL, with coordinates (30°26′N) and (77°40′E). Figure 1 shows the map of the selected sampling sites (S1, S2, S3) within the Asan Wetland in the Doon Valley. The wetlands are located at the confluence of the Asan and Yamuna Rivers, approximately 40 km west of Dehradun city. In 1967, the Asan Barrage, a small dam, was constructed to redirect river water for agricultural and electricity generation, resulting in the formation of this wetland. Because it serves as a home for migratory waterbirds, the Asan Wetland is recognised globally as a Ramsar site. During the winter, several endangered and threatened bird species use this 4.44-square-kilometre wetland as a shelter. Many plant and animal species inhabit this region, including aquatic vegetation, fish, amphibians, reptiles, and invertebrates. The Asan Wetland is defined by three primary seasons in the subtropical climate: summer (April-June), monsoon (July-September), and winter (October-March). The temperature during summer ranges from a maximum of 38°C to a minimum of 14°C, while in winter, it varies between a maximum of 21°C and a minimum of 2°C. The region receives an average annual rainfall of 250–275 cm, primarily during the southwest monsoon season from June to September. Wind patterns in the area are influenced by the monsoon system, with the southwest monsoon bringing moist winds during the rainy season and humidity is 65%–80%.
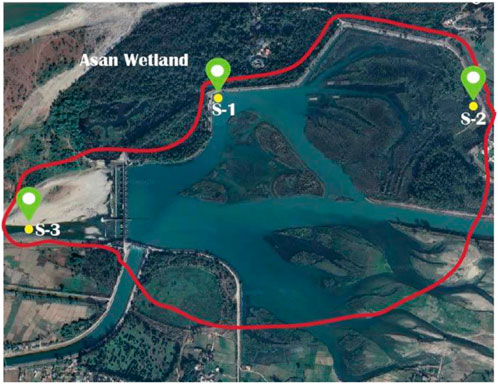
Figure 1. Showing sampling sites (S1,S2,S3) (Tabassum et al., 2024).
The wetland’s water level is primarily influenced by the passage of the Asan and Yamuna Rivers and the monsoon rains, which fluctuate with the seasons.
Despite its biological significance, the Asan Wetland is currently under increased stress due to anthropogenic activities. The deterioration of water quality and the decline of biodiversity is being exacerbated by the pollution from adjacent settlements, agricultural effluent, habitat alteration, and tourism driven by birdwatching. The delicate ecological balance has also been disturbed by changes to the marsh’s hydrological cycle brought about by new approaches to water management aimed at producing hydropower. The Asan Wetland is an ideal location for the study of the dynamics of aquatic ecosystems, particularly the periphyton communities that are essential for the maintenance of water quality and the support of aquatic food webs, as a result of its vulnerability to human impacts and its status as a biodiversity hotspot.
To better understand the ecological health of the wetland and guide conservation efforts, the current study aims to evaluate the density and diversity of periphyton in this wetland as well as the link between periphyton composition and important physico-chemical parameters. Table 1 shows the description of the selected sampling sites (S1, S2, S3) within the Asan Wetland in order to ensure that the study remained practical and yet captured a thorough picture of the wetland’s general state, logistical, financial, and geographic constraints led to the decision to limit the number of sample sites to three.

Table 1. Description of sampling sites.
The Physico-Chemical Analysis at three selected sites was conducted monthly from November 2021 to October 2023. Water samples for the selected parameters were collected from the selected sites and analyzed in the department laboratory as per the standard Method recommended by APHA WEF, (2012) and Welch (Welch, 1948; APHA WEF, 2012). However, some parameters, like Temperature, pH, DO, and free CO2, were analyzed on-site.
For Physio-Chemical analysis water samples were collected and analyzed by standard methodologies as provided by APHA WEF, (2012) and Welch 1948. Temperature was measured on-site using a thermometer, while pH levels were recorded using a portable pH meter. Free carbon dioxide (CO2) was determined during sampling following Welch’s method (1948), and dissolved oxygen (DO) levels were measured using the modified Winkler method by APHA WEF, (2012). Turbidity was assessed using a digital turbidity meter, and electrical conductivity was measured with a conductivity meter. Transparency was determined using the Secchi disk visibility method.
In the laboratory, additional parameters such as TDS, total hardness, TA, sodium (Na), and potassium (K) were analyzed. Total dissolved solids (TDS) were analyzed through the evaporation method.
Total alkalinity was measured following Welch’s method (Welch, 1948) using phenolphthalein and methyl orange indicators, while total hardness was determined using the EDTA titration method. Biochemical oxygen demand (BOD) and chemical oxygen demand (COD) were evaluated using the 5-day incubation method followed by titration. Total nitrogen and total phosphorus levels were also analyzed in the laboratory using specific methods. These methods are standard practices for assessing water quality and provide comprehensive insights into the physico-chemical parameters of aquatic ecosystems.
Periphyton samples, including two to three replicas, were obtained from bottom substrates wherever feasible, as well as from peripheral sources, including pebbles, cobbles, stones, and macrophytes within a 1 cm2 region using a scraper. The collected periphyton was then transferred into sample tubes and stored in 4% formalin to ensure sample integrity throughout transit. The conserved samples were later transported to the Department of Zoology’s laboratory, where they were assessed using a stereo-zoom trinocular Microscope for both quantitative and qualitative assessments. The primary morphometric characteristics analyzed encompassed overall body structure, chloroplast morphology, cell wall attributes, and symmetry systems. Before analysis, the preserved samples were carefully agitated, and 1 mL of the sample was placed onto a Sedgewick-Rafter counting slide. In the lab, a Microscopic Image Processing System (MIPS) was used to identify different algae taxa using standard taxonomic keys and monographs, including the APHA WEF, (2012) standards, Ward and Whipple (1992), and Edmondson’s Freshwater Biology (1992). Further, the analysis of periphyton was conducted using Equation 1.
Where n = is the number of units of periphyton in a specified area (1 cm2), a = average number of periphyton in one chamber of 1 mm3 capacity and c = total amount of preservative used (20 mL).
The data obtained after the laboratory procedure was analyzed using statistical techniques. Several statistical techniques, such as Average, minimum, maximum, standard deviation, and ANOVA, were employed. Multivariate statistical analysis like the Sorenson index, Shannon-Weiner diversity index, Margelef index, CCA, PCA, and Cluster analysis was employed using PAST software to analyze and interpret the relationship between environmental factors and the distribution of periphyton communities across different sites in the Asan Wetland.
For a better understanding of the overall water quality and environmental conditions in the Asan Wetland, we examined periphytons and other physicochemical factors at three different sites (S1, S2, and S3) from November 2021 to October 2023. The average monthly fluctuations in physicochemical parameters S1, S2, and S3) in the Asan Wetland are illustrated in Tables 2–4, respectively. The cumulative analysis of the three tables provides a detailed overview of ecological variations among the three different sites within the Asan Wetland. Water temperatures at all locations exhibited analogous trends, with the lowest temperatures observed in January (11.80°C ± 0.43°C at S1, 12.25°C ± 0.22°C at S2, and 11.35°C ± 0.22°C at S3), while peak temperatures were noted in June (26.2°C ± 0.15°C at S1, 25.9°C ± 0.22°C at S2, and 26.0°C ± 0.08°C at S3). The pH was consistently recorded as slightly alkaline across all three sites, with the highest values (8.55 ± 0.08 at S1, 8.35 ± 0.15 at S2, 8.75 ± 0.08 at S3) generally occurring in January, while lower values (7.15 ± 0.08 at S1, 7.25 ± 0.08 at S2, 7.30 ± 0.15 at S3) were noted in July-August. Turbidity levels were lowest in December (29.5 ± 0.71 NTU at S1, 24.5 ± 0.71 NTU at S2) and in January at S3 (20.5 ± 0.71 NTU), with a significant rise observed in July (211 ± 1.42 NTU at S1, 201 ± 1.42 NTU at S2, 203.5 ± 2.13 NTU at S3). Transparency exhibited an inverse correlation with turbidity, with the highest transparency recorded in January across all locations (60.6 ± 0.43 cm at S1, 57.2 ± 1.42 cm at S2, 63.6 ± 0.29 cm at S3) and the lowest transparency occurring during the monsoon in August (19.05 ± 1.35 cm at S1, 18.65 ± 0.64 cm at S2, 20.9 ± 0.85 cm at S3). The total dissolved solids (TDS) levels were minimal in January (164 ± 5.66 mg/L at S1, 173.5 ± 2.13 mg/L at S2, 178 ± 2.83 mg/L at S3) and escalated during the monsoon, reaching a maximum in August (308.5 ± 4.95 mg/L at S1, 311 ± 4.25 mg/L at S2, 272 ± 4.25 mg/L at S3). Electrical conductivity mirrored the trends of total dissolved solids (TDS), with peak values of 240.9 ± 1.98 m/cm at S1, 250.75 ± 0.78 m/cm at S2, and 262.4 ± 4.11 m/cm at S3 during the monsoon months of August, with the lowest values recorded in January (122.4 ± 2.55 m/cm at S1, 122.85 ± 0.64 m/cm at S2 and 126.05 ± 1.35 m/cm at S3). Higher conductivity during the monsoon reflects increased ionic content in the water due to runoff and mineral dissolution. Dissolved oxygen levels were highest in January with values (10.2 ± 0.57 mg/L at S1, 10.6 ± 0.22 mg/L at S2, and 10.4 ± 0.08 mg/L at S3) while lower values were recorded during the warmer and monsoon month, especially in August (7.6 ± 0.36 mg/L at S1, 7.7 ± 0.15 mg/L at S2, 7.4 ± 0.08 mg/L at S3). Total hardness at all sites was generally higher in December (178.5 ± 0.71 mg/L at S1, 181.5 ± 0.71 mg/L at S2 and 184 ± 1.42 mg/L at S3) and dropped during the monsoon season, with values (141 ± 2.83 mg/L at S1, 127 ± 5.66 mg/L at S2, 146 ± 1.42 mg/L at S3) in July and August. Total Alkanity was found to be maximum in January at all sites (129.5 ± 2.13 mg/L at S1, 125.5 ± 0.71 mg/L at S2, 131.5 ± 2.13 mg/L at S3) while minimum values were observed in July and August (76 ± 8.49 mg/L at S1, 78 ± 2.83 mg/L at S2 and 85 ± 7.08 mg/L at S3). BOD and COD values were found to be higher in August (3.50 ± 0.29 mg/L at S1, 3.60 ± 0.00 mg/L at S2, 3.75 ± 0.22 mg/L at S3) and (4.75 ± 0.08 mg/L at S1, 4.85 ± 0.08 mg/L at S2 and 4.80 ± 0.15 mg/L at s3) respectively while lowest in January with values of BOD (1.65 ± 0.08 mg/L at S1, 1.80 ± 0.15 mg/L at S2, 1.90 ± 0.15 mg/L at S3) and COD (2.40 ± 0.15 mg/L at S1, 2.95 ± 0.08 mg/L at S2, 2.45 ± 0.08 mg/L at S3).

Table 2. Average Monthly variations in the physico-chemical parameters of the Asan Wetland during 2 years of study (November 2021 to October 2023) at site S1.
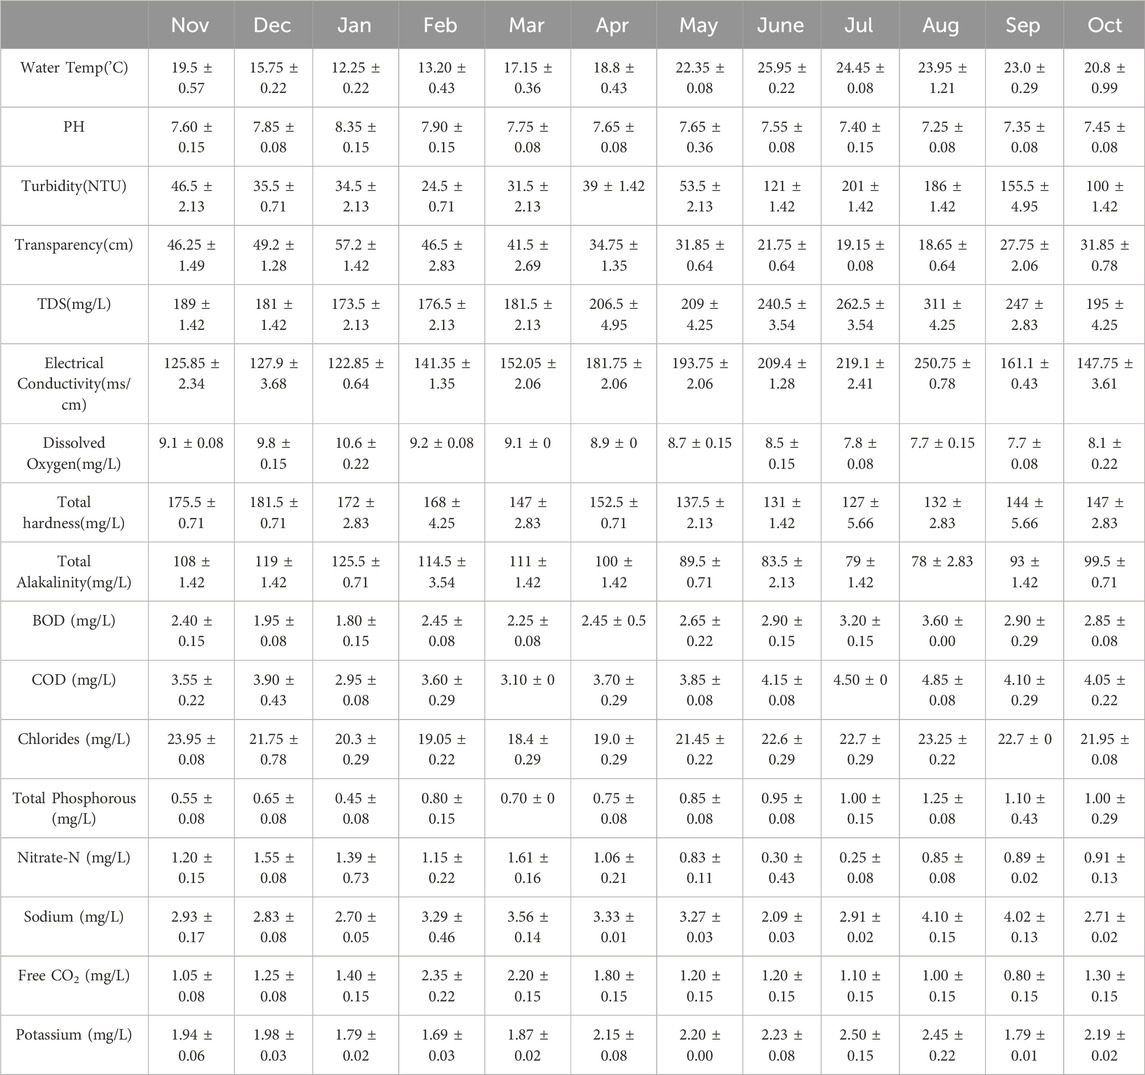
Table 3. Average Monthly variations in the physico-chemical parameters of the Asan Wetland during 2 years of study (November 2021 to October 2023) at site S2.
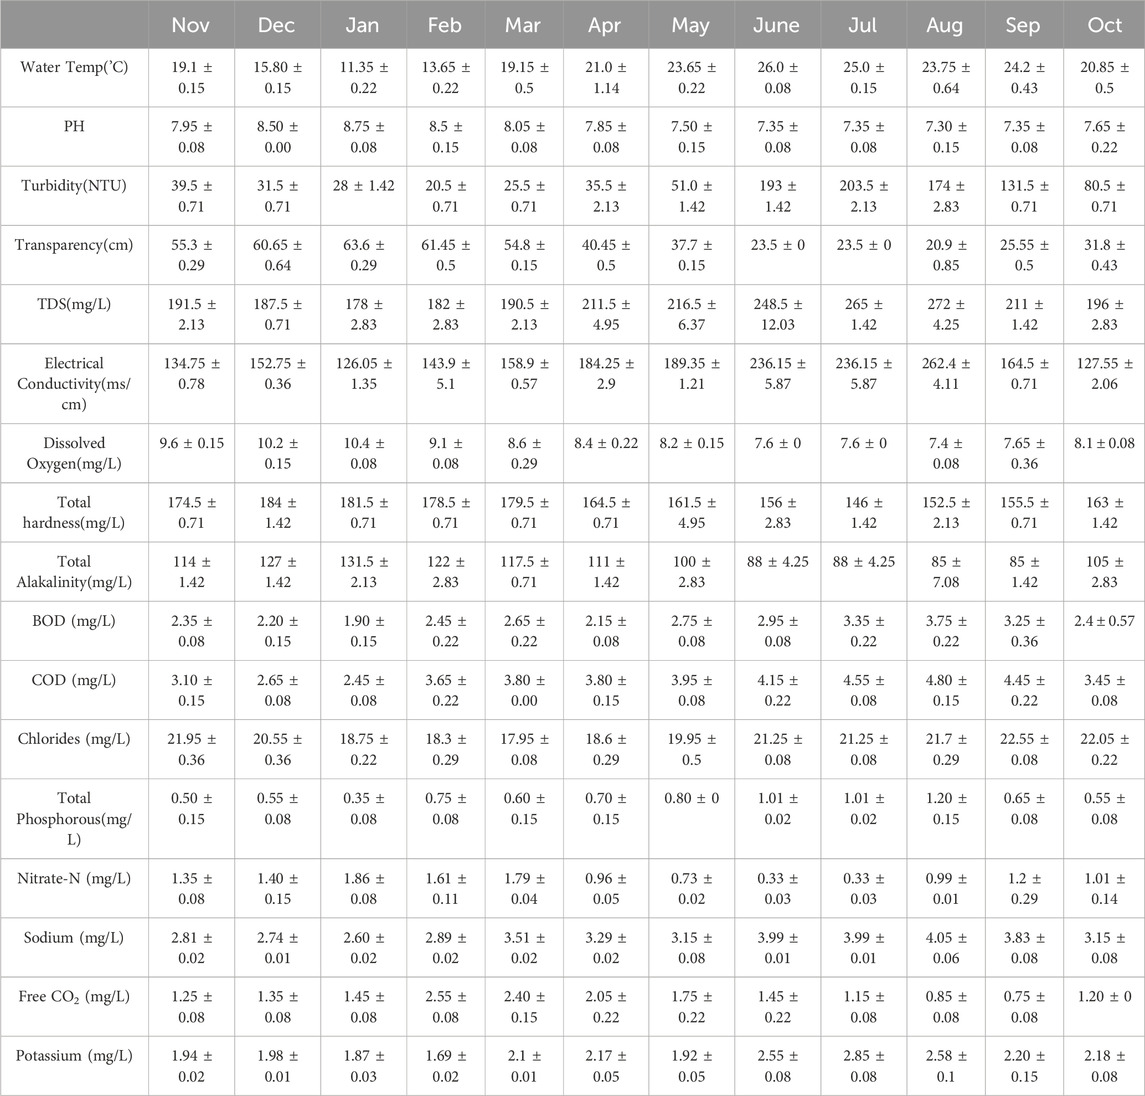
Table 4. Average Monthly variations in the physico-chemical parameters of the Asan Wetland during 2 years of study (November 2021 to October 2023) at site S3.
Phosphorus is a key nutrient that promotes algal growth and is often a limiting factor in freshwater systems. The phosphorus levels at all three sites indicate a moderate to high nutrient load, with almost similar values that were found to be higher in August (1.20 ± 0.15 mg/L at S1, 1.25 ± 0.08 mg/L at S2, 1.20 ± 0.15 mg/L at S3) while fall in January with values (0.65 ± 0.22 mg/L at S1, 0.45 ± 0.08 mg/L at S2, 0.35 ± 0.08 mg/L at S3. Nitrate levels across all three sites are moderate, with relatively similar nitrate concentrations at all sites with values higher in December (1.50 ± 0.15 mg/L at S1, 1.55 ± 0.08 mg/L at S2, 1.40 ± 0.15 mg/L at S3) and lower in July (0.35 ± 0.04 mg/L at S1, 0.25 ± 0.08 mg/L at S2, 0.33 ± 0.03 mg/L at S3).
Potassium is a vital element for plant growth; however, it is less prone to induce eutrophication than nitrogen and phosphorus. Although there is no explicit regulatory limit for potassium in aquatic environments, potassium concentrations in natural waters generally vary from 0 to 10 mg/L. Potassium concentrations were measured at 2.73 ± 0.02 mg/L at S1, 2.50 ± 0.15 mg/L at S2, and 2.85 ± 0.08 mg/L at S3, while Sodium levels were recorded at 4.65 ± 0.78 mg/L at S1, 4.10 ± 0.15 mg/L at S2, and 4.05 ± 0.06 mg/L at S3. Both elements exhibited elevated levels in July and August, followed by a decline in January and February, with Sodium values of 2.52 ± 0.04 mg/L at S1, 2.70 ± 0.05 mg/L at S2, and 2.60 ± 0.02 mg/L at S3, and Potassium values of 1.69 ± 0.08 mg/L at S1, 1.69 ± 0.03 mg/L at S2, and 1.69 ± 0.02 mg/L at S3.
Free CO2 in water results from the breathing of aquatic organisms and the breakdown of organic waste. It is a crucial element for photosynthesis in aquatic flora and algae. Free CO2 concentrations were nearly uniform across all sites, peaking in February (2.93 ± 0.25 mg/L at S1, 2.35 ± 0.22 mg/L at S2, 2.55 ± 0.08 mg/L at S3) and declining in September (1.10 ± 0.15 mg/L at S1, 0.80 ± 0.15 mg/L at S2, 0.75 ± 0.08 mg/L at S3).
The periphyton was represented in this study by 18 different periphytic taxa that belong to three different classes. These classes include Bacillariophyceae (Cymbella, Navicula, Nitzschia, Fragilaria Meridion, Synedra, Gomphonema, Tabellaria, and Diatoma). Ulothrix, Spirogyra, Cosmarium, Microspora, Chlorella, Oedogomium, Zygnema, and Cladophora are members of the Chlorophyceae family, while Phormidium is a member of the Cyanophyceae. The average monthly variations in the density of periphyton distributed in three classes at sites S1, S2, and S3 of the Asan Wetland over a 2-year study period (November 2021 to October 2023) are illustrated in Table 5.
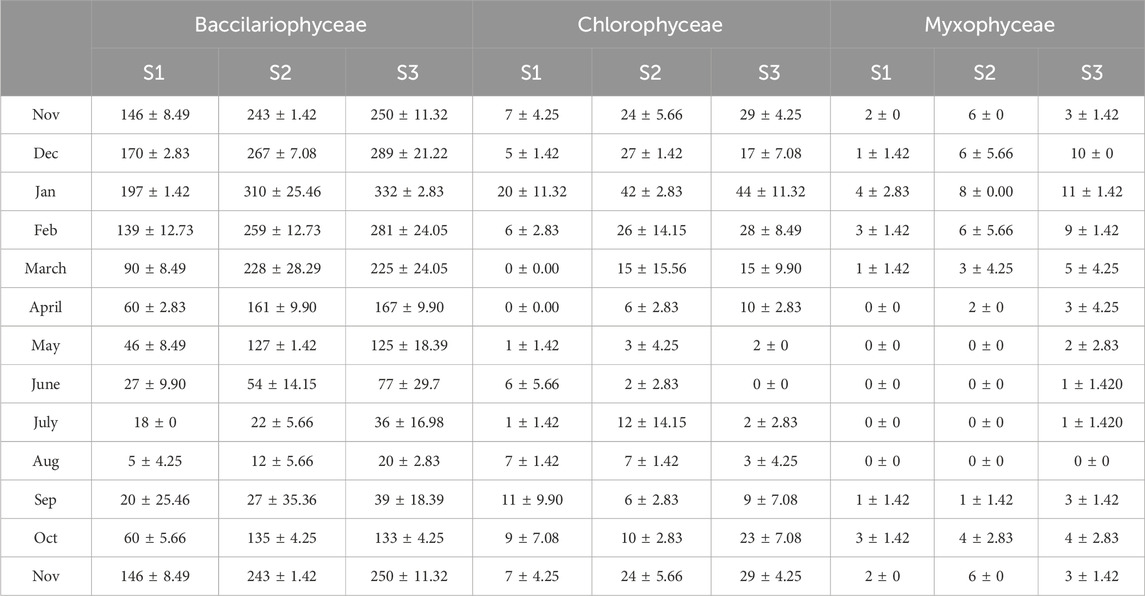
Table 5. Monthly Average density of periphyton of the Asan Wetland during 2 years of study (November 2021 to October 2023) at sites S1, S2, and S3. (units x 103. Cm−2).
The total density of all classes at sites S1, S2, and S3, as well as the overall density of the Asan wetland throughout the 2-year study period from November 2021 to October 2023, is given in Table 6. The peak periphytic density (individuals/cm2) recorded was 322.67 ± 89.08 × 10³ in January, with all three classes exhibiting maximum values at S3: Bacillariophyceae (197 ± 1.42 × 10³ at S1, 310 ± 25.46 × 10³ at S2, 332 ± 2.83 × 10³ at S3), Chlorophyceae (20 ± 11.32 × 10³ at S1, 42 ± 2.83 × 10³ at S2, 44 ± 11.32 × 10³ at S3) and Cyanophyceae (4 ± 2.83 × 10³ at S1, 8 ± 0.00 × 10³ at S2, 11 ± 1.42 × 10³ at S3. The monsoon months (June to August) had the lowest densities, most likely as a result of increased sedimentation and water turbidity, which hinder light penetration and have an impact on periphyton growth. The minimum periphytic density (individuals/cm2) recorded was 18 ± 5.57 × 10³ in August, with Bacillariophyceae values of 5 ± 4.25 × 10³ at S1, 12 ± 5.66 × 10³ at S2, and 20 ± 2.83 × 10³ at S3; Chlorophyceae values of 1 ± 1.42 × 10³ at S1, 2 ± 2.83 × 10³ at S2, and 0 ± 0 × 10³ at S3; and no Cyanophyceae detected at any site.
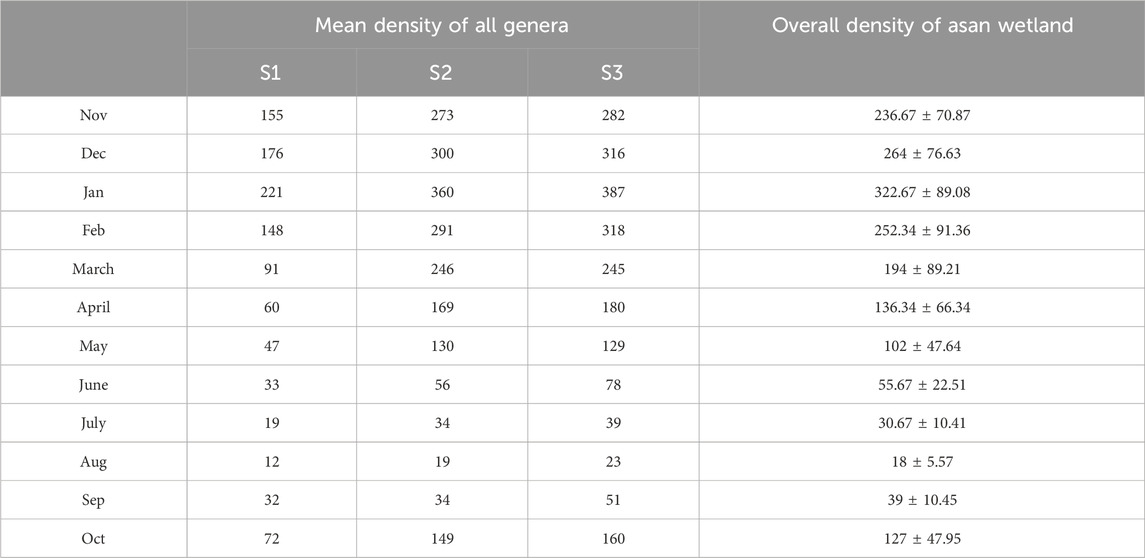
Table 6. The total density of all classes at sites S1, S2, and S3, as well as the overall density of the Asan wetland throughout the 2-year study period from November 2021 to October 2023. (units x 103. Cm−2).
The current study illustrates the annual percentage composition of periphytic flora in the Asan wetland over 2 years, as depicted in Figure 2, indicating that Bacillariophyceae constituted the predominant group (89%–90%), succeeded by Chlorophyceae (7%–9%) and Cyanophyceae or Myxophyceae (1%–4%) across various sites.
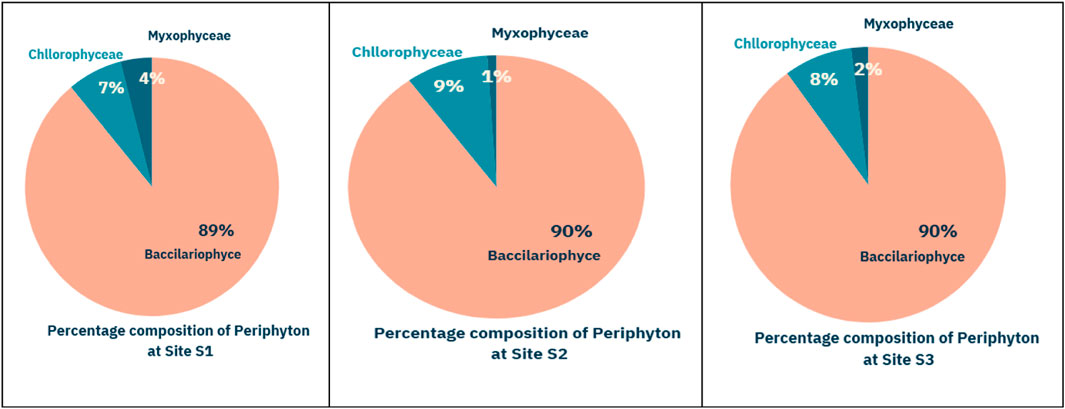
Figure 2. The annual percentage composition of periphytic flora of Asan wetland during the 2 years of study at different sites (S1, S2, S3).
An annual percentage composition illustrates the proportion of various species or groups within a community over 1 year, presented as a percentage of the total community. This type of analysis is commonly used in ecological studies to understand the relative abundance and dominance of different species or taxonomic groups (e.g., classes, genera) throughout the year.
The Sorensen Similarity Index illustrates the pairwise similarity values between months, which are determined by periphyton community data or ecological conditions at various times of the year. Table 7 shows the average values of the Sorenson similarity index during the 2 years of the study period at S1. Monthly values approaching one imply similar periphyton communities or environmental conditions. The December (D) and January (J) communities are quite similar, with a similarity score of 0.814815. February (F) and March (M), with 0.818182, may have similar species composition and environmental conditions affecting periphyton. Moderate Similarity Scores (0.5–0.8) Values in this range indicate moderate community or condition overlap between months. The similarity index is 0.608696 in March (M) and July (J), suggesting some common species but presumably influenced by environmental changes. Low Similarity is Almost 0. Seasonal changes in periphyton diversity and abundance may cause broader differences in community composition or ecological circumstances. The winter months (e.g., December, January, and February) exhibit a high degree of similarity, suggesting that the cold-season conditions are stable and conducive to the growth of specific periphyton communities. The summer or pre-monsoon months (e.g., April, May) are also comparable, which is likely attributable to the stable temperatures and nutrient levels that occur prior to monsoon disruption, rainfall and fertilizer runoff cause ecological alterations. Hence, monsoon and post-monsoon months (July, August, September) have lower similarity scores than winter months.
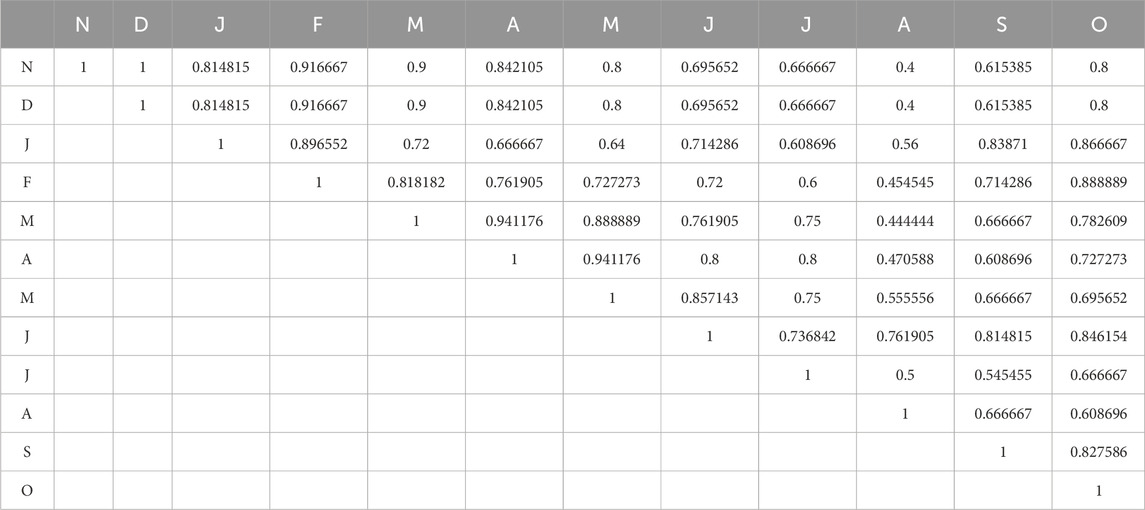
Table 7. Average values of the Sorenson similarity index at S1 of Asan wetland during the 2 years of the study period.
The average values of the Sorenson similarity index during the 2 years of the study period at S2 are presented in Table 8. The ecological conditions of November (N) and January (J) are similar, as evidenced by their similarity of 0.909091. A similarity of 0.965517 is observed between December (D) and March (M), indicating a significant degree of similarity in the periphyton community or water quality between these months. As an illustration, the similarity between April (A) and August (A) is 0.75, suggesting that there are seasonal fluctuations. A value of 0.8 in June (J) and September (S) indicates that there is an overlap in conditions, which may be associated with late summer or post-monsoon outcomes.
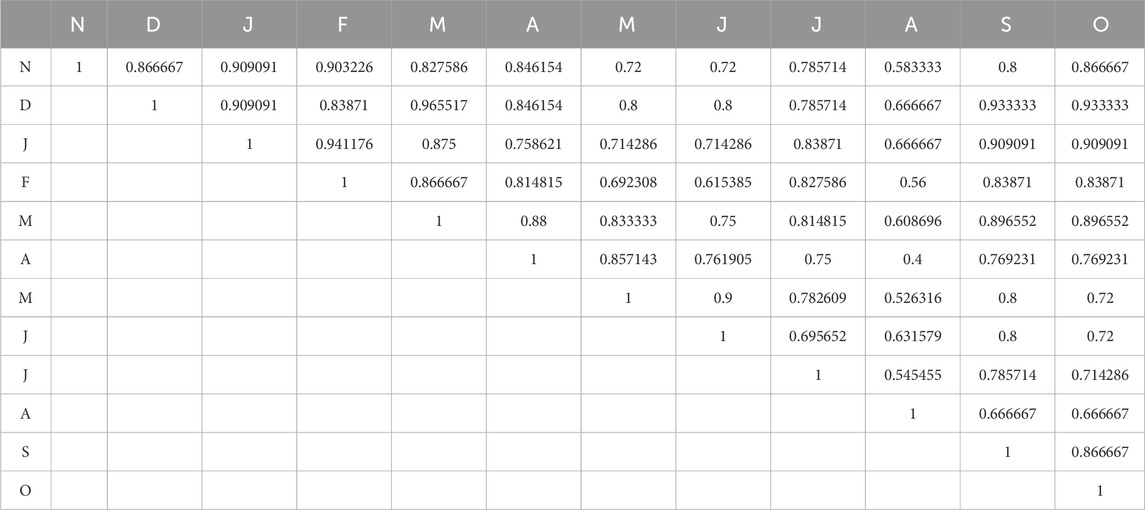
Table 8. Average values of the Sorenson similarity index at S1 of Asan wetland during the 2 years of the study period.
Potentially due to seasonal fluctuations or environmental transitions, lower values suggest more pronounced disparities between the months. For instance, August (A) and May (M) have a low similarity of 0.4, indicating varying biological circumstances due to monsoon influences. The similarity between August (A) and February (F) is 0.56, suggesting that monsoon conditions may induce modifications in periphyton or other ecological characteristics.
The average values of the Sorenson similarity index during the 2 years of the study period at S3 are presented in Table 9. In winter (November–February), Winter months have high similarity ratings, indicating consistent winter conditions and similar periphyton ecosystems. The similarity between January (J) and December (D) is 0.909091, showing no substantial ecological changes. Months May, June, and July show moderate similarities due to biological changes caused by warming and increased precipitation, which can alter periphyton composition. Monsoon and post-monsoon values are comparable due to settling runoff and ecological stabilization. The maximum similarity was found between the winter months at all the sites.
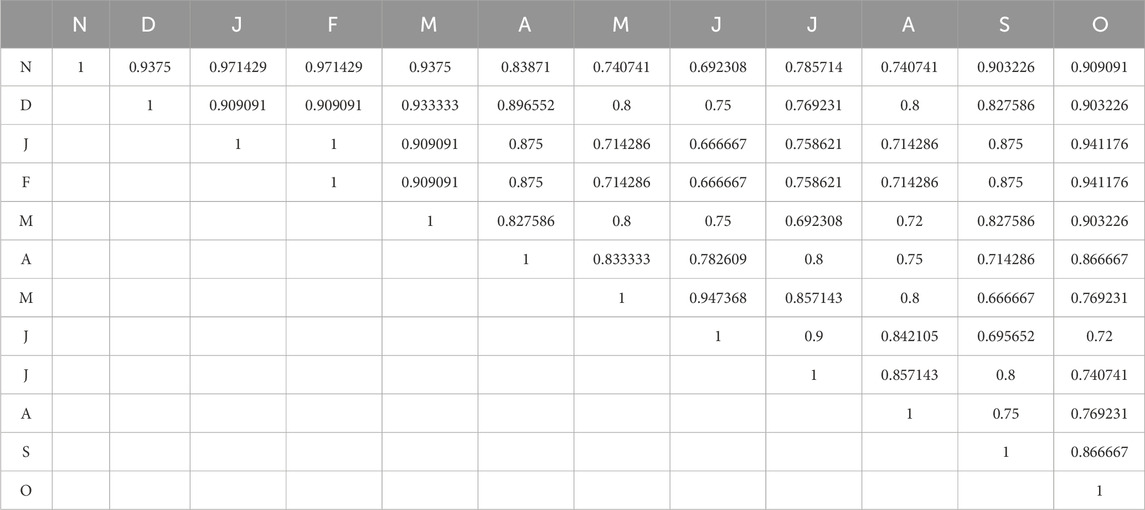
Table 9. Average values of the Sorenson similarity index at S1 of Asan wetland during the 2 years of the study period.
The values of the Shannon–Wiener diversity index during both study years are presented in Figure 3 for the year 2021–22 & 2022–23 respectively. The Shannon–Wiener diversity index values at all sites were high during both years in winter in January (2.427 at S1, 2.495 at S2, 2.562 at S3) and (2.29 at S1, 2.435 at S2, 2.467 at S3) during 2021–22 & 2022–23 respectively while minimum in the monsoon season (1.099 at S1, 1.099 at S2, 1.676 at S3) in 2021–22 and (1.311 at S1, 1.834 at S2, 1.594 at S3) in 2022–23.
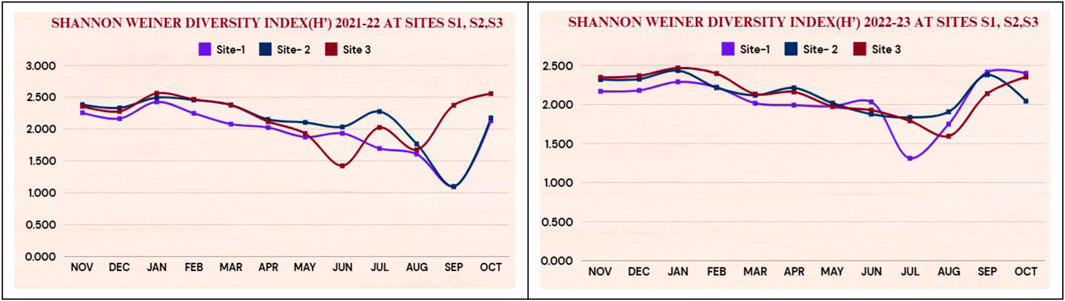
Figure 3. Showing Shannon-Weiner diversity index (H′)2021-22 and 2022-23 at sites S1, S2, S3.
The values of the Margelef index during 2021–22 and 2022–23 are presented in Figure 4. The Margalef Diversity Index measures species richness in a community by counting species and individuals. It is especially beneficial for comprehending the diversity of biological communities, such as periphyton, in aquatic ecosystems. The higher Margalef Index values suggest that the community has a greater diversity of species. Poor numbers indicate poor species richness. In both years, the highest values were found in January (2.763 at S1,2.694 at S2, 2.84 at S3) in 2021–22 (2.05 at S1, 2.745 at S2, 2.867 at S3) in 2022–23. The lowest values (1.116 at S1, 1.11 at S2, 1.573 at S3) in 2021–22 and (1.038 at S1, 1.447 at S2, 1.417 at S3) in 2022–23. were in the monsoon months. Hence, The maximum similarity was found between the winter months at all the sites.
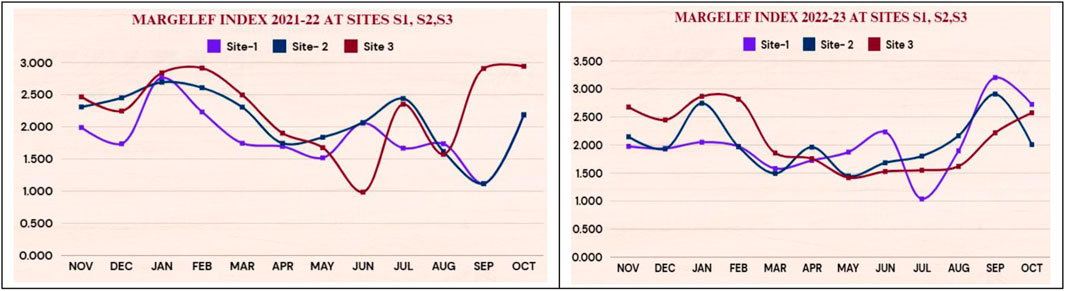
Figure 4. Showing margelef index 2021-22 and 2022-23 at sites S1, S2,S3.
In both years of the investigation, the canonical correspondence analysis (CCA) of periphyton among various sites is illustrated in Figure 5. Multivariate Canonical Correspondence Analysis (CCA) is used to investigate and illustrate species composition (or community structure) and environmental variables. CCA helps ecological researchers determine how environmental gradients (temperature, pH, nutrient levels) affect species distribution and abundance. CCA suggested that S3 was more diverse than S1 and S2. Results show that Axes one and two represented 64.93% and 35.07% of the variance with eigenvalues of 0.01794 and 0.00968, respectively. The dominant genera found at Site one included Synedra, Cladophora, Nithchia, Oedogonium, Fragillaria, and Ulothrix.
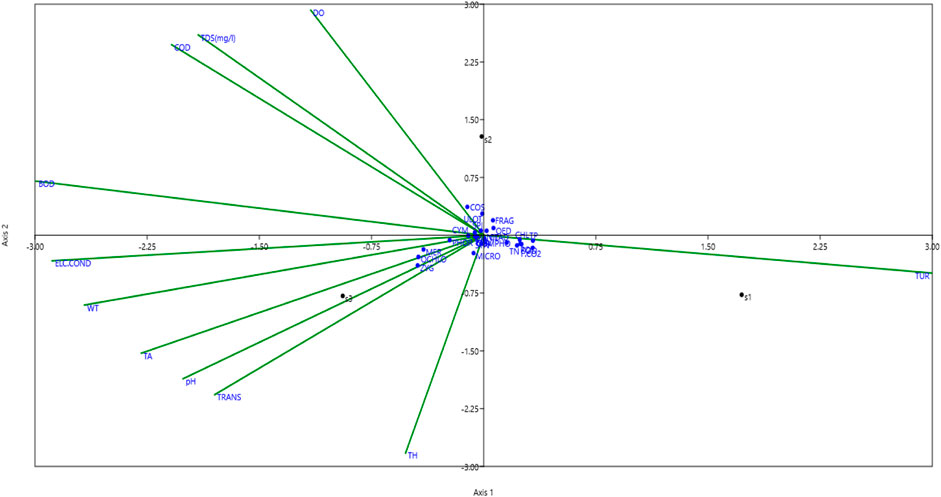
Figure 5. The canonical correspondence analysis (CCA) of periphyton at the sites (S1, S2, S3) in the Asan wetland during the study from November 2021 to October 2023. (Average values). Acronym: Fragilaria (FRAG), Ulothrix (ULOT), Nitzschia (NIT), Diatoma (DIA), Cosmarium (COS), Spirogyra (SPI), Oedogonium (OED), Cladophora (CLAD), Microspora (MIC), Meridion (MER), Phormidium (PHOR), Zygnema (ZYG), Synedra (SYN), and Tabellaria (TAB), Gomphonema (GOMPHO) Navicula (NAV), and Chlorella (CHLO).
These genera are typically more tolerant of higher turbidity, free CO2 and nutrient conditions like total nitrogen, total phosphorous, chlorides, sodium, and potassium. These environmental conditions favour periphyton species that are tolerant of fluctuating and often challenging water quality conditions. Algal populations such as Spirogyra, Diatoma, and Cosmorium were connected with S2, which DO, TDS, COD, and BOD govern. The presence of Cosmarium (a desmid) indicates favourable growth conditions, such as slightly alkaline pH and good light availability. S3 was associated with most of the genera Genera such as Cymbella, Phormidium, Gomphonema, Navicula, Tabellaria, Microspora, Meridion, Chlorella, Zygnema was governed by factors such as electrical conductivity, water temperature, pH, Total Alkalinity, transparency, Total hardness.
The multivariate cluster analysis in Figure 6 shows periphyton similarity at three sites during the 2-year study period. The dendrogram formed thus suggested that sites S2 and S3 were similar, while S1 showed a different group. S3 is different from these similar groups. The difference in S3 compared to the other groups in Figure 7 is primarily due to its higher abundance of periphyton, whereas S2 has some genera present but shows a lower abundance. This contrast arises from the varying levels of disturbance in these areas; S3 experiences significant boating and tourism-related disturbances, which influence its community structure. Despite these differences, the similarities between S2 and S3 are due to shared genera and comparable environmental impacts. In contrast, S1 forms the outgroup because it has the least abundance of periphyton populations, likely due to minimal anthropogenic disturbances.
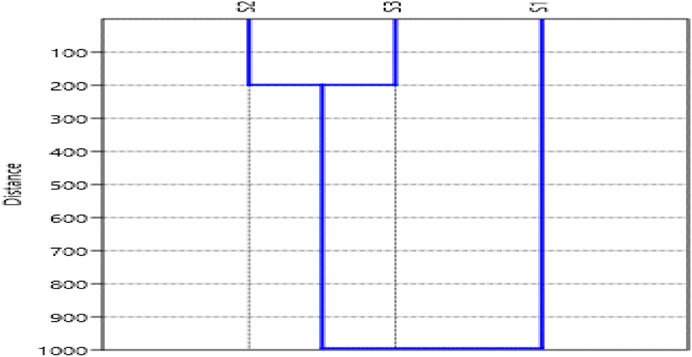
Figure 6. Cluster analysis of Periphytes at site (S1, S2, S3) in the Asan Wetland during the study from November 2021 to October 2023. (Average values).
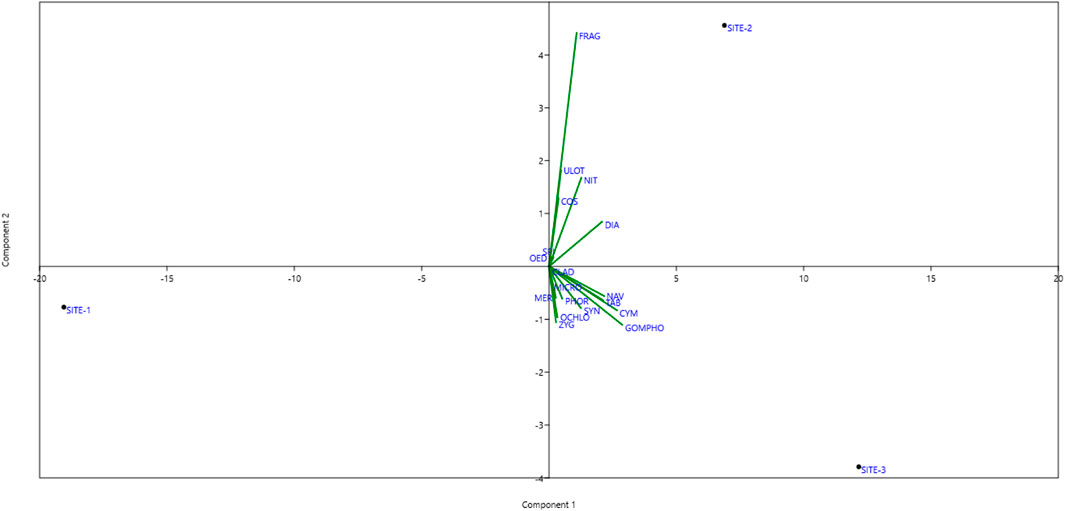
Figure 7. The principal component analysis (PCA) of periphyton at the sites (S1, S2, S3) in the Asan wetland during the study from November 2021 to October 2023. (Average values). Acronym: Fragilaria (FRAG), Ulothrix (ULOT), Nitzschia (NIT), Diatoma (DIA), Cosmarium (COS), Spirogyra (SPI), Oedogonium (OED), Cladophora (CLAD), Microspora (MIC), Meridion (MER), Phormidium (PHOR), Zygnema (ZYG), Synedra (SYN), and Tabellaria (TAB), Gomphonema (GOMPHO) Navicula (NAV), and Chlorella (CHLO.
The principal component analysis (PCA) of periphyton among different sites during both years of the study is presented in Figure 7. Here, PCA suggested that PC1 and PC2 were represented by 93.98% and 6.015% of the variance with eigenvalues 279.149 and 17.8675, respectively. Results show that SITE-1 is not directly associated with any of the genera clustered near the centre, suggesting that the environmental conditions at this site are not conducive to the growth of most of the periphyton genera. Instead, it suggests that SITE-1 is likely to be characterized by highly disturbed or extreme conditions such as high turbidity or nutrient contamination.
The genera Fragilaria (FRAG), Ulothrix (ULOT), Nitzschia (NIT), Diatoma (DIA), Cosmarium (cos), Spirogyra (spi), and Oedogoni-um (oed) are all closer to SITE-2. This shows that these taxa have adapted adequately to the SITE-2 environmental conditions. These genera are close to SITE-2, indicating that they provide ideal conditions, including stable substrates, moderate nutrition levels, and sufficient dissolved oxygen.
Many genera are linked to SITE-3, including Cladophora (Clad) Microspora(Micro), Meridion(Mer), Phormidium(Phor), Zygnema(Zyg), Synedra(Syn), and Tabellaria(Tab). Other genera include Gomphonema (GOMPHO), Navicula (NAV), and Chlorella (CHLO). These genes usually indicate steady, clear water that is well-oxygenated, has adequate light penetration and has balanced nutrition levels.
One-way ANOVA of periphytic at S1, S2, and S3 in the Asan wetland during the study period (November 2021–October 2022). is represented by Table 10. The p-value thus obtained (0.0796) indicates that there is no significant difference between the three sites in the density of periphyton.
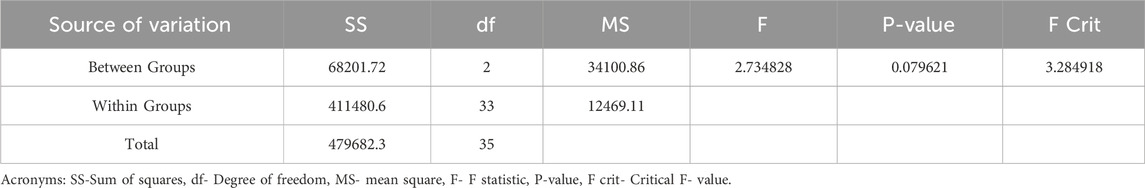
Table 10. One-way ANOVA of Periphytes at sites (S1, S2, S3) in the Asan wetland during the study from November 2021 to October 2023.
This study fills a gap in our knowledge of the Asan Wetland’s ecological health by analyzing periphyton populations and a number of physicochemical characteristics across three selected sites (S1, S2, and S3) from November 2021 to October 2023. The findings emphasize site-specific environmental factors and monthly fluctuations and their impact on periphyton density and diversity.
The findings reveal significant ecological fluctuations among the three sites, influenced by variations in water quality parameters such as temperature, pH, turbidity, total dissolved solids (TDS), transparency, dissolved oxygen (DO), electrical conductivity, total alkalinity, total hardness, BOD, COD, and nutrients.
The water temperature at each site exhibited consistent seasonal patterns, with summer temperatures reaching their highest point and winter temperatures plummeting to their lowest. In all of the selected sampling sites, a consistent pattern was observed, which was attributed to the current environmental conditions. Prior research on wetland ecosystems has shown that temperature fluctuations have a substantial impact on biological activities, including the metabolic rates of aquatic organisms and periphyton growth, as well as the same seasonal pattern. These variations are consistent with this. Site 3’s higher temperatures could be explained by its unique features, such as less shade, lower depth, and more exposure to direct sunlight. These circumstances could lead to localized warming, which would impact the structure and metabolism of periphyton communities (Bhatt et al., 2022). identified the analogous trend of low temperatures in winter and high temperatures in summer and monsoon months in the Kosi River and also shows that Temperature plays a central role in the growth, dispersal and reproduction of aquatic flora and fauna (Kumar et al., 2016) observed similar patterns in the Rawsan stream of Garhwal Himalayas, and (Semwal and Rayal, R, 2023). The same trend was observed in the earlier studies of Asan Wetland in relation to water quality and limnology by (Sharma and JS Rawat, 2009; Singh et al., 2016; Kumar et al., 2018).
The majority of chemical reactions that occur in soil and water are governed by pH, making it one of the most crucial factors. Many living biotas may perish as a result of pH levels that are too high or too low. All three sites had a constant, slightly alkaline pH, with January typically recording the highest pH values and July and August showing the lowest values. The wetland water is consistently alkaline, with higher pH values at Site 3. This could be because of carbonate-rich substrates or because of increased biological activity, such as photosynthesis, which consumes CO2 and raises pH.
The urban wetland of Delhi and Harike Wetland both exhibited a comparable pattern of elevated and decreased pH levels, as reported by (Mabwoga et al., 2010; Joshi et al., 2021), respectively. The growth of sensitive periphyton species is supported by stable pH values, which are maintained by alkalinity, a critical parameter in wetlands. All of the sites had moderate alkalinity levels, which suggests that the wetland is protected from acidification and provides a stable habitat for aquatic life. Numerous researchers have indicated that pH levels are elevated in winter months (7.9-8.2) due to algal proliferation, while they are diminished during the monsoon season (7.2-7.4) (Chauhan and Sharma, 2016; Bahuguna et al., 2018; Baluni et al., 2018; Kumar et al., 2018; Tariq et al., 2020; Mamgain et al., 2021; Bhatt et al., 2022; Tariq et al., 2022; Mustfa et al., 2023) also reported the highest pH levels during the monsoon season in different water bodies. The permissible limit of turbidity in the drinking water is up to 0.5 NTU as per WHO standards and 1.0 NTU as per BIS standards. Turbidity levels were found to be lowest in December and January and increased drastically during July, which collaborates with the findings of (Tuboi et al., 2018) in Loktak Lake (Kant Shukla et al., 2020) Study of the water quality and pollution status of some significant rural village ponds situated in the industrial activity zone of Allahabad district, Uttar Pradesh (Sonal et al., 2010). The study deals with the interactions between these abiotic factors and bird diversity of one such pond in the semiarid zone of Gujarat, India (Rana et al., 2018). reported the same trend of turbidity minimum in January and maximum in June during the rainy month. It also explained that turbidity and the intensity of scattered light are directly proportional to each other. It also meant that as the turbidity of water increases, the amount of sunlight that penetrates the water decreases. The permissible limit of turbidity in the drinking water is up to 0.5 NTU as per WHO standards and 1.0 NTU as per BIS standards. Increased turbidity during the monsoon is linked to sediment runoff, leading to lower water clarity. Higher turbidity affects periphyton growth, reducing light penetration. Sites one and 2 may be more exposed to runoff or human activities, contributing to greater suspended particulate matter, especially during rainy seasons. Transparency was inversely related to turbidity; this reflects the effect of suspended particles in reducing water clarity during periods of high runoff. The higher transparency at Site 3 correlates with its lower turbidity levels, indicating clearer water that allows more sunlight to penetrate. This could benefit aquatic plants and periphyton, enhancing primary productivity at Site 3 compared to the other sites (Sharma and RC Chhipa, 2016; Kumar, 2017; Rana et al., 2018; Sharma et al., 2018; Sharma et al., 2021; Sharma et al., 2022) also reported the same trend of turbidity and transparency.
Electrical conductivity followed the TDS trends; TDS and EC levels were lowest in January and increased during the monsoon season in August. At all of the sampling places, the patterns were the same. There was a strong correlation between EC and TDS. The value of EC increases in proportion to the value of TDS. The higher the EC value, the more salt is dissolved in water. Another factor contributing to the elevated TDS levels in wetlands is the substantial amount of tourists during non-winter months, in addition to runoff from the catchment basin (G Matta, 2014; Tripathi, et al., 2015; Seth et al., 2016; Matta et al., 2017). reported the same findings of EC and TDS.
DO is crucial for aquatic life, and any abrupt decrease in it would be fatal. Its relationship with water bodies provides both direct and indirect information on bacterial activity, photosynthesis, nutrient availability, and stratification (Malik et al., 2023a). Dissolved oxygen levels were highest in January, while lower values were recorded during the warmer and monsoon months, especially in August. A similar pattern was observed in all selected sites. The decrease in DO during the monsoon season is likely due to increased microbial activity and the decomposition of organic matter, which reduces oxygen availability. High dissolved oxygen during winter months and low during monsoon months were also reported by (Sharma et al., 2007; 2021; Rashid et al., 2013; Gulzar et al., 2017; 2017; Baluni et al., 2018; Kumar et al., 2018; SAGIR and AK Dobriyal, 2020; Tariq et al., 2020; Malik et al., 2023b).
Total alkalinity is another essential factor in an aquatic ecosystem, and it neutralizes the acid present. Total Alkanity was found to be maximum in January at all sites, while minimum values were observed in July and August. Similar results in alkalinity were also reported by (Tariq et al., 2022; Malik et al., 2023a; Semwal et al., 2023). The moderate alkalinity values suggest that the Asan Wetland is not highly susceptible to acidification, maintaining a stable environment conducive to aquatic life. However, the slightly lower alkalinity observed during the monsoon season may be due to dilution effects from heavy rainfall, which could lower the concentration of carbonate compounds in the water. Total hardness is a vital parameter indicating the presence of calcium and magnesium ions in water. Hardness at all sites was generally higher in December and dropped during the monsoon season in July and August (Bahuguna et al., 2019). Determined that the total hardness was elevated (134.5 mg/L) in January during the winter season.
BOD and COD values were found to be higher in August while lowest in January. An almost similar pattern of BOD and COD during the previous studies was observed at selected sampling sites by (Malik et al., 2023a; Ishaq and Khan, 2013; Malik et al., 2023b) in the Asan wetland.
The wetland’s primary source of nitrate is nitrogenous fertilizers. The monsoon season exhibited the highest concentration of nitrogen, while the winter season exhibited the lowest concentration of nitrogen at all sites. The highest potassium concentration was observed in July, while the lowest was observed in February. Although potassium is necessary for plant growth, it is less likely than phosphate and nitrogen to produce eutrophication. The chloride concentration levels in this study were shown to be highest in August and lowest in March. A consistent pattern was observed in all of the selected sampling sites. In numerous studies, the concentrations of nutrients and organic matter in several ecosystems have been significantly elevated by water discharge from agricultural lands, forests, and pastures. (Malik et al., 2023a).
When phosphorus levels are too high, eutrophication can occur, which in turn can cause the wetland’s water to become unclear, infested with algae, and oxygen-depleted (Jones and GF Lee, 1982; Rathore et al., 2016). It is essential to control phosphorus inputs, which are probably from domestic or agricultural runoff, in order to stop additional nutrient enrichment and preserve the wetland’s natural equilibrium. According to USEPA recommendations, the acceptable range for total phosphorus in streams to prevent eutrophication is 0.01–0.03 mg/L. Still, the OECD rules state that the desired limit of phosphorus for lakes and reservoirs is less than 0.05 mg/L. The phosphorus levels at the Asan Wetland are substantially higher than the acceptable threshold for preventing eutrophication. Phosphorus concentrations exceeding 0.05 mg/L can stimulate excessive algal proliferation and adversely affect water quality, potentially resulting in eutrophication. Nitrate is a crucial nutrient for plant growth; nevertheless, high levels can result in eutrophication (Ansari et al., 2010; Ngatia et al., 2019). The USEPA’s recommended limit for nitrate in freshwater to prevent eutrophication is less than 1 mg/L (Dodds and EB Welch, 2000). Nitrate concentrations at all three sites are moderate, suggesting that nutrient inputs are relatively consistent throughout the wetland, presumably from agricultural runoff or wastewater discharge. These concentrations are relatively similar. These are hardly concerning levels, but continued nitrate intake may make nutritional enrichment worse, especially if it is coupled with high phosphorus levels. To avoid detrimental ecological effects, nitrate sources must be continuously monitored and controlled.
Potassium is also an important component of plant growth; it is less likely to contribute to eutrophication than nitrogen and phosphorus (Sardans and Peñuelas, 2015). The regulatory limit for potassium in water bodies is not specified; however, potassium levels in natural waters typically range from 0 to 10 mg/L (Bhateria and Jain, 2016). Although potassium and sodium are both in the moderate range and are not expected to impact the quality of the water negatively, they do add to the wetland’s total nutrient load. They may promote the growth of macrophytes and algae. The breathing of aquatic life and the breakdown of organic substances produce free CO2 in water. In algae and aquatic plants, it is a necessary part of photosynthesis. At all sites, free CO2 levels were nearly almost similar, rising in February and falling in September. All sites have comparatively mild CO2 levels, which suggests that aquatic plant life can thrive there without negatively affecting pH or other water quality indicators. On the other hand, a large rise in CO2 levels might cause pH shifts that could pressure aquatic life. For aquatic life to thrive, free CO2 levels in freshwater should normally not be more than 5 mg/L. The respiratory system of aquatic species may be impacted by concentrations of more than 5 mg/L (Singh et al., 2016; Arya et al., 2020).
The investigation of periphyton density and diversity revealed the existence of 18 periphytic taxa from three classes. Bacillariophyceae (diatoms) provided the most significant contribution to the periphyton community at all sites, followed by Chlorophyceae (green algae) and Cyanophyceae (blue-green algae). January had the highest periphytic density, with all three classes reaching their maximum S3 during that month. The monsoon months (June to August) had the lowest densities. Because of the stable environmental conditions, such as ideal temperature, pH, and a healthy quantity of DO, as well as light penetration, the winter months (December, January, and February) exhibited the highest density. However, because of disrupted ecological circumstances such as turbidity, the monsoon months (July, August, and September) had the lowest density.
The maximum density of periphyton in winter and lower in monsoon is in agreement with the findings of (Baba et al., 2011; Khanna and Natural, 2013; Harkal and sciences, 2015; Singh et al., 2016; Sabater and Admiraal, 2005; Kumar, 2017; Lohani et al., 2017; Moss, 2017; Dutta et al., 2018; Kumar et al., 2018; Srivastava et al., 2019; Baluni et al., 2018; Bahuguna et al., 2021; Tariq et al., 2021; Tariq et al., 2022; Mustfa et al., 2023). They also reported Bacillariophyceae dominance in periphyton count. According to them, the factors that influence the growth of the periphyton population are light, temperature, water current, substrate, scoring effects of floods, water chemistry, and grazing. The influence of light on periphyton assemblages can be substantial. The dominance of periphytic communities belonging to Bacillariophyceae was also reported in the glacier-fed streams of the Himalayan region by (Singh and Himalaya, 2024) in the western and central Himalayas (Acharjee, 2013) in Teesta and Rell rivers (Sharma and MK Hatimuria, 2017). In the Brahmaputra river basin (Kumar et al., 2020) in the Mandakini River (Pandit et al., 2020) in the River Ganga at Bihar (Jain et al., 2018) in the Alaknanda River.
The Sorensen Similarity Index is a valuable and intuitive way to measure the degree of similarity between two sets, making it an essential tool in ecological studies to assess the overlap of species between different habitats or study areas. The maximum similarity was found between the winter months at all the sites. This is because there are strong positive correlations between similar conductive environmental features throughout the sampling sites. Comparable trends in similarity were also observed by (Dobriyal, 2021) in the Nayar River in the Garhwal Himalaya throughout the winter months (Lone et al., 2021). observed the periphytonic community of seven springs of Kashmir. They noticed a total of 50 taxa of periphytic algal community, of which 33 belonged to Bacillariophyceae, nine to Chlorophyceae, five to Cyanophyceae, two to Chrysophyceae and one to Euglenophyceae. Periphyton species activity is restricted to a specific temperature range (Butola and Samant, 2010; Tiwari et al., 2018). stated that temperature is recognized as a significant role player in species distribution in spring water. A maximum abundance of periphyton was observed during the winter season (November - February) in the Lastar Gad Springs. This may be due to the increased growth efficiency of periphyton during this period, in addition to favourable physicochemical attributes (Marcus, 1959; Chakraborty, 2021). suggested that the adverse effect of velocity and turbidity is always due to the blanketing bottom effect of the suspended bottom material, which interferes with the photosynthetic activity (Baluni and Kumar, 2017). noticed that high turbidity during monsoon floods significantly reduced light penetration, which adversely affected the rate of photosynthesis.
The Shannon-Weiner Index provides a balanced view of species diversity, accounting for both the number of species and how evenly the individuals are distributed among them. The Shannon–Wiener diversity index values at all sites were high during both years, in winter in January, while they were at minimum during the monsoon season. This signifies an extensive diversity of species during the winter months and a limited diversity in the monsoon months.
Canonical Correspondence Analysis (CCA) illustrates the relationship between biotic and abiotic elements. The CCA analysis determines the importance of a specific variable based on its vector length. Eleven environmental variables were analyzed alongside eighteen genera to determine the association of each genus with the selected physicochemical characteristics. This indicates a good diversity of species in the winter months and limited diversity in the monsoon months.
The Canonical Correspondence Analysis (CCA) shows the correlation between biotic and abiotic factors. The analysis of the CCA indicates the significance of a given variable by its vector length. For analysis, eleven environmental variables were examined with the eighteen genera to establish the relationship of each genus with the selected physicochemical parameters. The presence of genera like Nitzschia and Synedra suggests that these species are well-adapted to higher turbidity conditions, can tolerate pollution, and can be used as sewage pollution indicators. (Macintyre et al., 2011; Jana, 2024). Usually, suspended particles in the water cause increased turbidity because they might hinder light penetration. These taxa are capable of surviving and thriving on substrates in these low-light conditions, which suggests their resilience to sediment-rich and disturbed environments. The greater concentrations of free CO2 indicate that respiration and organic decomposition have increased, which may be linked to an increased input of organic matter. Genera such as Ulothrix and Oedogonium can effectively utilize the additional CO2 for photosynthesis in these conditions, which gives them a competitive advantage. In general, the genera that are present at Site one are more tolerant of nutrient-rich conditions. Fundamental determinants of primary productivity include total nitrogen and total phosphorus. Genera that can thrive in conditions with high nutrient levels include the filamentous green alga Cladophora and the Diatom Fragilaria. This implies that Site one is susceptible to elevated nutrient discharge or point-source contamination inputs.
Due to the high levels of chloride, Site one might have been impacted by urban discharge or agricultural runoff. Tolerating moderate increases in chloride concentrations, genera like Synedra and Nitzschia demonstrate their capacity to control internal ionic balances for life in such conditions. Agriculture or soil runoff may induce elevated sodium and potassium concentrations. The dominance of Ulothrix and Cladophora at Site one is attributed to their capacity to tolerate a variety of ionic concentrations. The growth and metabolic functions of these periphyton species are also influenced by these ions, which contribute to the osmotic balance. A somewhat nutrient-rich environment with good oxygenation and stable ionic concentrations is suggested by the presence of Spirogyra, Diatoma, and Cosmarium at Site 2. Favourable environmental conditions facilitate the proliferation of various diatoms and green algae, which utilize the available organic matter. S3 was associated with the majority of the genera. Several variables, such as electrical conductivity, water temperature, pH, total alkalinity, transparency, and total hardness, influenced genera, including Cymbella, Phormidium, Gomphonema, Navicula, Tabellaria, Microspora, Meridion, Chlorella, and Zygnema. The significant species at Site 3 include Cymbella, Phormidium, Gomphonema, Navicula, Tabellaria, Microspora, Meridion, Chlorella, and Zygnema, indicating a well-balanced and stable ecosystem. The presence of a varied assortment of diatoms, green algae, and cyanobacteria signifies that Site 3 offers ideal circumstances for a diversified range of periphyton species. Cluster analysis is a statistical method that is employed to organize sampling sites according to environmental parameters or species composition, thereby facilitating the identification of similarities between sites. The generated dendrogram helps identify areas that need comparable management approaches by highlighting which locations have ecological characteristics that are closely related. The resulting dendrogram in this investigation indicated that, whereas S1 displayed a distinct group, sites S2 and S3 were similar.
The S3 is different from these similar kinds of groups. CCA and cluster was also performed by (Nautiyal et al., 2015; Chauhan and RC Sharma, 2016; Rana et al., 2019; Malik, 2020; Tariq et al., 2020; Ikram et al., 2022; Tariq et al., 2022; Mustfa et al., 2023; Tabassum et al., 2024) to study the lineage of physicochemical parameters toward the different benthic and algal communities in the Rivers and streams of Uttarakhand. They found that the CCA plot clearly depicted the lineage of different physicochemical parameters toward the benthic biota.
A statistical technique known as Principal Component Analysis (PCA) is employed to investigate the relationships between environmental factors and the distribution of species. The results suggest that SITE-1 is not conducive to the growth of the majority of periphyton genera, which is likely a result of extreme or disturbed conditions, such as high turbidity or nutrient contamination. SITE-2 is linked to groups like Fragilaria, Ulothrix, Nitzschia, Diatoma, Cosmarium, Spirogyra, and Oedogonium, which suggests that it has good conditions with average amounts of nutrients, enough dissolved oxygen, and stable substrates. Site-3, on the other hand, is home to more genera, such as Cymbella, Gomphonema, Navicu-la, Chlorella, Cladophora, Microspora, Meridion, Phormidium, Zygnema, Synedra, and Tabellaria. This means that the water is clear, well-oxygenated, stable, and has good light penetration and balanced nutrients. An analysis of variance, or one-way ANOVA, is a statistical technique used to ascertain whether the means of three or more independent groups differ in any statistically significant way. Periphyte density has not been observed to vary significantly among the three locations in this investigation.
This research sheds light on the periphyton communities’ relationship with physicochemical characteristics and the ecological variability of the Asan Wetland across the three sites (S1, S2, and S3). The novelty of this research lies in its comprehensive analysis of periphyton diversity in conjunction with detailed physicochemical profiling, which provides a unique insight into unexamined relationships between environmental factors and periphyton dynamics in this wetland. Site 3 demonstrated optimal conditions for diverse periphyton growth, while Site one faced ecological stress due to high turbidity and nutrient enrichment. Site two supported moderate ecological conditions and mixed periphyton populations. Seasonal changes in water quality, such as fluctuations in temperature, pH, turbidity, and dissolved oxygen, were closely tied to periphyton density and diversity. Winter months showed higher periphyton densities, while monsoon months experienced reductions due to turbidity and nutrient runoff. Elevated phosphorus levels, particularly during the monsoon, underline the need for nutrient management to prevent eutrophication. Statistical analyses identified strong correlations between environmental factors and periphyton genera, reinforcing the necessity for site-specific management strategies. Addressing turbidity, nutrient inputs, and sedimentation is essential to maintain ecological balance.
The findings of this study emphasize the need for targeted management strategies to maintain the ecological health of the Asan Wetland. The distinct differences in environmental conditions and periphyton diversity among the three sites highlight the importance of controlling external inputs such as nutrient runoff and sedimentation. Reducing turbidity levels and managing nutrient sources are critical to preventing further degradation of water quality and ensuring the sustainability of the wetland ecosystem.
The original contributions presented in the study are included in the article/supplementary material, further inquiries can be directed to the corresponding author.
The manuscript presents research on animals that do not require ethical approval for their study.
ST: Conceptualization, Data curation, Investigation, Methodology, Project administration, Resources, Validation, Writing–original draft, Writing–review and editing. CK: Conceptualization, Data curation, Investigation, Methodology, Project administration, Resources, Supervision, Validation, Writing–review and editing. AD: Data curation, Investigation, Resources, Supervision, Validation, Writing–original draft, Writing–review and editing. MS: Resources, Writing–review and editing. RB: Resources, Writing–review and editing.
The author(s) declare that no financial support was received for the research, authorship, and/or publication of this article.
The authors declare that the research was conducted in the absence of any commercial or financial relationships that could be construed as a potential conflict of interest.
The author(s) declare that no Generative AI was used in the creation of this manuscript.
All claims expressed in this article are solely those of the authors and do not necessarily represent those of their affiliated organizations, or those of the publisher, the editors and the reviewers. Any product that may be evaluated in this article, or claim that may be made by its manufacturer, is not guaranteed or endorsed by the publisher.
Acharjee, M. (2013). Diversity of plankton and ichthyofauna in relation to limnochemistry of river Teesta and Relli in the Darjeeling Himalaya of West Bengal. Available at: https://ir.nbu.ac.in/bitstream/123456789/944/1/07_DIVERSITYOFPLANKTONANDICHTHYOFAUNAINRELATION.pdf (Accessed October 29, 2024).
Alam, M., Boggs, L., Rahman, A., Haque, M. M., Miah, M. R. U., Moniruzzaman, M., et al. (2017). Water quality and resident perceptions of declining ecosystem services at Shitalakka wetland in Narayanganj city. Elsevier 9-10, 53–66. doi:10.1016/j.swaqe.2017.03.002
Alikhani, H. A., Ahmadi, H., Etesami, H., Noroozi, M., Rahmani, H. A., and Emami, S. (2023). Studies on autotrophic components of periphyton in some Iranian aquatic ecosystems. Int. J. Environ. Res. 17 (2), 24–12. doi:10.1007/s41742-023-00511-3
Ansari, A. A., Gill, S. S., and Khan, F. A. (2010). “Eutrophication: threat to aquatic ecosystems,” in Eutrophication: causes, consequences and control. Dordrecht: springer Netherlands, 143–170. doi:10.1007/978-90-481-9625-8_7
Apha Wef, A. (2012). Standard methods for examination of water and wastewater. Washington: American Public Health Association. Available at: https://search.proquest.com/openview/85626245e0feccc3314bcce5a84957f3/1?pq-origsite=gscholar&cbl=54817 (Accessed January 8, 2025).
Arya, A. K., Joshi, K. K., and Bachheti, A. (2020). A review on distribution and importance of wetlands in the perspective of India. J. Appl. Nat. Sci. 12 (4), 710–720. doi:10.31018/jans.v12i4.2412
Asgher, M. S., Sharma, S., Singh, R., and Singh, D. (2021). Assessing human interactions and sustainability of Wetlands in Jammu, India using Geospatial technique. Model. Earth Syst. Environ. 7 (4), 2793–2807. doi:10.1007/s40808-020-01066-4
Baba, A. I., Sofi, A. H., Bhat, S. U., and Pandit, A. K. (2011). Periphytic algae of river Sindh in the Sonamarg area of Kashmir valley. J. Phytol. 3 (6), 2075–6240.
Badoni, K., Nautiyal, R., and Bhatt, J. P. B. K. (1997). Variations in the epilithic diatom community structure due to river valley projects on the. Conference: Proc. Indian Natn. Sci. Acad. B63 No. 6, pp 523–536.
Bahuguna, P., Ashok, D., Rajesh, R., and Neha, S. (2018). First report on the occurrence of some benthic macroinvertebrates in the spring-fed streams of Garhwal Himalaya, India. IJRAR. Available at: http://ijrar.org/viewfull.php?&p_id=IJRAR1905158.
Bahuguna, P., Negi, S., and Dobriyal, A. K. (2019). Density and diversity of aquatic mites in a spring fed stream of Garhwal Himalaya, India. Acad. edu 14 (2), 57–61. doi:10.51220/jmr.v14i2.6
Bahuguna, P., Rajani, , Rayal, R., and Baluni, P. (2021). Observation on ecology and diversity of periphyton community in the Mal Gad stream from Garhwal region, India. UPJOZ 17, 84–94.
Baluni, P., Bahuguna, P., Rajani, , Rayal, R., and Kahera, N. S. (2019). Periphyton community structure of the spring-fed foot-hill stream tamsa nadi from Doon Valley, uttarakhand, India. Sci. Temper 11 (1and2). doi:10.58414/SCIENTIFICTEMPER.2020.11.1.14
Baluni, P., Koshal, K., Hemwati, N., and Koshal, K. (2018). Ecology, Distribution Pattern, Periphyton in Khankra Spring Himalaya, India. J. Mountain Res. 11. Jagatpur, Ahmedabad, Gujarat: IJRAR.
Baluni, P., and Kumar, R. (2017). Studies on the periphyton density, diversity and physico chemical parameters of Rudraprayag from I. J. Mt. Res. 12, 73–79.
Bartwal, T., and Nautiyal, P. (2023). Hydropower development in the Himalaya: identifying critical river stretches. Environ. Sci. Pollut. Res. 30 (16), 46741–46747. doi:10.1007/s11356-023-25401-1
Beauger, A., Olivier, V., Carlos E., W., Elisabeth, A., Fanny, M., and Vincent, B. (2020). Biodiversity and ecology of diatoms in mineral springs of the area of of Sainte Marguerite (Saint-Maurice-ès-Allier, Massif central, France). BIOM 1, 21–34.
Bhateria, R., and Jain, D. (2016). Water quality assessment of lake water: a review. Sustain. Water Resour. Manag. 2 (2), 161–173. doi:10.1007/s40899-015-0014-7
Bhatt, P., Patiyal, R. S., Pathak, B. C., and Giri, A. K. (2022). Temporal study of physicochemical characteristics and qualitative plankton diversity of a river Kosi, a tributary of west ramganga in reference to the habitat of Garra gotyla gotyla. Asian Pac. J. Health Sci. 9 (1), 136–141. doi:10.21276/apjhs.2022.9.1.19
Bisht, K. L., Dobriyal, A. K., and Singh, H. R. (2019). A note on the ecosystem health of a glacier-fed river pinder from chamoli garhwal, uttarakhand. J. Mt. Res. 14 (2), 9–17. doi:10.51220/jmr.v14i2.2
Blackwell, M. S. A. (2011). Wetland ecosystems. J. Environ. Qual. 40 (3), 1028. doi:10.2134/jeq2011.0002br
Butola, J. S., and Samant, S. S. (2010). Saussurea species in Indian Himalayan Region: diversity, distribution and indigenous uses. Int. J. Plant Biol. 1 (1), e9–e51. doi:10.4081/pb.2010.e9
Chakraborty, S. K. (2021). River pollution and perturbation: perspectives and processes. Riverine Ecol. 2, 443–530. doi:10.1007/978-3-030-53941-2_5
Chauhan, A., and Sharma, R. C. (2016). Ecological study of periphyton diversity in crenic habitat of Sahashradhara (Garhwal Himalayas, India). Int. J. Environ. 5, 79–95. doi:10.3126/ije.v5i1.14566
DeNicola, D. M., and Kelly, M. (2014). Role of periphyton in ecological assessment of lakes. Freshw. Sci. 33 (2), 619–638. doi:10.1086/676117
Dobriyal, A. K. (2021). Maturation Biology and spawning ethos of A hillstream loach lepidocephalus guntea (Ham-Buch) from river mandal, pauri garhwal, uttarakhand. J. Mt. Res. 16 (1), 201–207. doi:10.51220/jmr.v16i1.20
Dodds, W., and Welch, E. B. (2000). Establishing nutrient criteria in streams. journals.uchicago.edu 19, 186–196. doi:10.2307/1468291
Dutta, R., Dutta, A., and Bhagobaty, N. (2018). Periphyton community structure of Namsang stream, Arunachal Pradesh. Journal of Coldwater Fisheries 1 (1), 113–120.
Feio, M., Almeida, S. F., Craveiro, S. C., and Calado, A. n. J. (2007). Diatoms and macroinvertebrates provide consistent and complementary information on environmental quality. Fundam. Appl. Limnol. 169, 247–258. doi:10.1127/1863-9135/2007/0169-0247
Gaiser, E. (2009). Periphyton as an indicator of restoration in the Florida Everglades. Ecol. Indic. 9 (6), S37–S45. doi:10.1016/j.ecolind.2008.08.004
Gogoi, P., Sinha, A., Tayung, T., Naskar, M., Das Sarkar, S., Ramteke, M. H., et al. (2021). Unravelling the structural changes of periphyton in relation to environmental variables in a semilotic environment in the Sundarban eco-region, India. Arabian J. Geosciences 14 (19), 2038. doi:10.1007/s12517-021-08386-4
Goldsborough, L. G., McDougal, R. L., and North, A. K. (2005). “Periphyton in freshwater lakes and wetlands,” in Periphyton: ecology, exploitation and management (Wallingford: CABI), 71–89. doi:10.1079/9780851990965.0071
Gulzar, A., and Agric, M. M. (2017). Stream Periphyton community: a brief review on Ecological importance and Regulation. Int. J. Appl. Pure Sci. Agric. 3 (9), 64–68. doi:10.22623/ijapsa.2017.3100.utf4v
Gulzar, A., and Agric, M.M.-I. J. A. P. S. (2017). Stream Periphyton community: a brief review on Ecological importance and Regulation. Int. J. Appl. Pure Sci. Agric. 3 (9), 64–68. doi:10.22623/IJAPSA.2017.3100.UTF4V
Gupta, N., Sharma, R. C., and Tripathi, A. K. (2008). Study of bio-physico-chemical parameters of mothronwala swamp, Dehradun (uttarakhand). J. Environ. Biol. 29 (3), 381–386.
Haq, S. M., Waheed, M., Khoja, A. A., Amjad, M. S., Bussmann, R. W., and Ali, K. (2023). A cross-cultural study of high-altitude botanical resources among diverse ethnic groups in Kashmir Himalaya, India. J. Ethnobiol. Ethnomedicine 19 (1), 12. doi:10.1186/s13002-023-00582-8
Harkal, A. D., and Mokashe, S. S. (2015). An Assessment of Periphytic Fauna of Kagzipura Lake, District Aurangabad, Maharashtra, India. Journal For Basic Sciences 1, 34–38.
Hill, B. H., Herlihy, A. T., Kaufmann, P. R., Stevenson, R. J., McCormick, F. H., and Johnson, C. B. (2000). Use of periphyton assemblage data as an index of biotic integrity. J. North Am. Benthol. Soc. 19 (1), 50–67. doi:10.2307/1468281
Hill, B. H., Stevenson, R. J., Pan, Y., Herlihy, A. T., Kaufmann, P. R., and Johnson, C. B. (2001). Comparison of correlations between environmental characteristics and stream diatom assemblages characterized at genus and species levels. J. North Am. Benthol. Soc. 20 (2), 299–310. doi:10.2307/1468324
Ikram, S. F., Uniyal, V., and Kumar, D. (2022). Changes in species composition of cyanobacterial and microalgal communities along a temperature gradient in Tapovan Hot Spring, Garhwal Himalaya, Uttarakhand, India. Aquat. Ecol. 56 (3), 573–584. doi:10.1007/S10452-021-09921-X
Ishaq, F. F., and Khan, A. A. (2013). Diversity pattern of macrozoobenthos and their relation with qualitative characteristics of river Yamuna in Doon Valley uttarakhand. Available at: https://www.cabidigitallibrary.org/doi/full/10.5555/20143065024 (Accessed October 29, 2024).
Jain, C. K., Malik, D. S., and Tomar, G. (2018). Seasonal Variation in Physico-Chemical and Phytoplankton Diversity of Alaknanda River at Garhwal Region (Uttarakhand). International Journal of Fisheries and Aquatic Studies 6 (2), 353–357.
Jana, B. B. (2024). Aquatic sciences in the tropics, aquatic sciences in the tropics: plankton, animal community and productivity. Boca Rat. CRC Press. doi:10.1201/9781003501688
Jones, R., and Lee, G. F. (1982). Recent advances in assessing impact of phosphorus loads on eutrophication-related water quality. Res. Net. 16, 503–515. doi:10.1016/0043-1354(82)90069-0
Joshi, P., Siva Siddaiah, N., and Dixit, A. (2021). Urban wetlands of Delhi, India: water quality and pollution status. Chem. Ecol. 37 (2), 104–131. doi:10.1080/02757540.2020.1836164
Kamitani, T., and Nobuhiro, K. (2007). Species-Specific Heavy Metal Accumulation Patterns of Earthworms on a Floodplain in Japan. Ecotoxicology and Environmental Safety 66 (1), 82–91. doi:10.1016/j.ecoenv.2005.10.009
Kant Shukla, B., Pushpendra Kumar Sharma, A., and Aakash, G. (2020). “Pollution status and water quality assessment in pre-monsoon season: a case study of rural villages in Allahabad district,”. Uttar Pradesh, India: Elsevier. doi:10.1016/j.matpr.2020.03.823
Kaonga, C. C., and Monjerezi, M. (2012). “Periphyton and earthworms as biological indicators of metal pollution in streams of blantyre city, Malawi,” in Water pollution (InTech). Ecotoxicology and Environmental Safety. Available at: https://www.sciencedirect.com/journal/ecotoxicology-and-environmental-safety.
Kelly, M., Bennion, H., Burgess, A., Ellis, J., Juggins, S., Guthrie, R., et al. (2009). Uncertainty in ecological status assessments of lakes and rivers using diatoms. Hydrobiologia 633 (1), 5–15. doi:10.1007/s10750-009-9872-z
Kelly, M. G., Penny, C. J., and Whitton, B. A. (1995). Comparative performance of benthic diatom indices used to assess river water quality. Hydrobiologia 302 (3), 179–188. doi:10.1007/BF00032108
Kennish (2002). Environmental threats and environmental future of estuaries. Environmental Conservation29 (1), 78–107. doi:10.1017/S0376892902000061
Khanna, D. R., and Ishaq, F. (2013). Impact of Water Quality Attributes and Comparative Study of Icthyofaunal Diversity of Asan Lake and River Asan. Journals. Ansfoundation.Org 5 (1), 200–206.
Kumar, K., Rana, A. R., Kotnala, C. B., and Balodi, V. (2016). Water quality and pollution status of rawasan stream in garhwal himalaya, uttarakhand, India. J. Mountain Res. 13, 9–14.
Kumar, P., Mishra, R., and Singh, D. (2013). Species composition of periphyton community in ponds of chapra district, 3 (1), 3524.
Kumar, P. B. R. (2017). Studies on the periphyton density, diversity and - google Scholar, Studies on the periphyton density, diversity and physico chemical parameters of Laster Gad stream in district Rudraprayag of Uttarakhand India. Available at: https://scholar.google.com/scholar?hl=en&as_sdt=0%2C5&q=Studies+on+the+periphyton+density%2C+diversity+and+physico+chemical+parameters+of&btnG= (Accessed October 26, 2024).
Kumar, R., Kumari, R., Prasad, C., Tiwari, V., Singh, N., Mohapatra, S., et al. (2020). Phytoplankton diversity in relation to physicochemical attributes and water quality of Mandakini River, Garhwal Himalaya. Environ. Monit. Assess. 192 (12), 799. doi:10.1007/S10661-020-08768-3
Kumar, R., Sharma, V., and Sharma, R. C. (2018). Physico-chemical and microbiological water quality of asan wetland of garhwal himalaya, India. Res. Net. 5 (3), 64–70. Available at: https://www.researchgate.net/profile/Rahul-Kumar-267/publication/333533424_Physico-Chemical_and_Microbiological_Water_Quality_of_Asan_Wetland_of_Garhwal_Himalaya_India/links/5cf27589299bf1fb184f0261/Physico-Chemical-and-Microbiological-Water-Quality-of-As (Accessed October 28, 2024).
Lai, G. G., Ector, L., Wetzel, C. E., Sechi, N., Lugliè, A., and Padedda, B. M. (2018). Periphytic diatoms of the Mediterranean karst spring Sa Vena (Su Gologone system, Sardinia, Italy): relationships with environmental variables and effects of an extreme flash flood. Inland Waters 8 (3), 284–293. doi:10.1080/20442041.2018.1457851
Lavoie, I., Campeau, S., Zugic-Drakulic, N., Winter, J. G., and Fortin, C. (2014). Using diatoms to monitor stream biological integrity in Eastern Canada: an overview of 10 years of index development and ongoing challenges. Elsevier 475, 187–200. doi:10.1016/j.scitotenv.2013.04.092
Lobo, E. A., Heinrich, C. G., Schuch, M., Wetzel, C. E., and Ector, L. (2016). “Diatoms as bioindicators in rivers,” in River algae (Cham: Springer International Publishing), 245–271. doi:10.1007/978-3-319-31984-1_11
Lohani, V., Hema, T., Malobica Das, T., and Bonika, P. (2017). An insight to species abundance of periphyton community in Bhimtal Lake. Journal of Entomology and Zoology Studies 5 (5).
Lohani, V., and Pant, B. H. T. (2017). An insight to species abundance of periphyton community in Bhimtal Lake. Acad. edu 5 (5). Available at: https://www.academia.edu/download/75678046/5-4-268-405.pdf (Accessed: October 27, 2024).
Lone, S. A., Ashok, K. P., and Sami, U. B. (2012). Dynamics of Periphytic Algae in Some Crenic Habitats of District Anantnag, Kashmir. Journal of Himalayan Ecology and Sustainable Development 7, 28–34.
Lone, S. A., Hamid, A., and Bhat, S. U. (2021). Algal community dynamics and underlying driving factors in some crenic habitats of kashmir himalaya. Water, Air, and Soil Pollut. 232 (3), 104. doi:10.1007/s11270-021-05010-9
Mabwoga, S. O., Chawla, A., and Thukral, A. K. (2010). Assessment of water quality parameters of the Harike wetland in India, a Ramsar site, using IRS LISS IV satellite data. Environ. Monit. Assess. 170 (1–4), 117–128. doi:10.1007/s10661-009-1220-2
Macintyre, H. L., Stutes, A. L., Smith, W. L., Dorsey, C. P., Abraham, A., and Dickey, R. W. (2011). Environmental correlates of community composition and toxicity during a bloom of Pseudo-nitzschia spp. in the northern Gulf of Mexico. J. Plankton Res. 33 (2), 273–295. doi:10.1093/plankt/fbq146
Malik, D., Chauhan, R., and Rathi, P. (2023a). Factors affecting the ecological habitat of Benthic macro-invertebrate assemblages in Asan wetland, Dehradun in Garhwal Himalaya. journals.ansfoundation.Org. 15, 262–272. doi:10.31018/jans.v15i1.4222
Malik, D., Chauhan, R., and Sharma, A. K. (2023b). Macrobenthic diversity in relation to physico-chemical and nutrient characteristics of Asan wetland. Search. ebscohost.Com. 23, 279–286. doi:10.51470/bca.2023.23.1.279
Malik, D. S., and Sharma, A. K. (2020). Current status of macrobenthic diversity and their habitat ecology in River Ganga and its tributaries. Uttarakhand.’, search.ebscohost.com. Available at: https://search.ebscohost.com/login.aspx?direct=true&profile=ehost&scope=site&authtype=crawler&jrnl=09720030&AN=145176483&h=eDy%2BWnNBGrTKyOZ1424xotqc2qwNnaffqZ530Za61HKmo9kxVgr0acmrrK3i2oGTy64HZw91obeTRsZYTF6j8w%3D%3D&crl=c (Accessed October 30, 2024).
Mamgain, D., Bahuguna, P., Dobriyal, A. K., and Rayal, R. (2021). Macrozoobenthos of basti damar stream in rudraprayag district, garhwal, uttarakhand:diversity and habitat analysis. Acad. edu 16 (1), 235–246. doi:10.51220/jmr.v16i1.24
Marcus, M. G. (1959). Limnology: its growth and evolution. Ann. Assoc. Am. Geogr. 49 (4), 466–470. doi:10.1111/j.1467-8306.1959.tb01630.x
Matta, G. (2014). A study on physico-chemical Characteristics to assess the pollution status of river Ganga in Uttarakhand. Res. Net. 7 (3). Available at: https://www.researchgate.net/profile/Gagan-Matta/publication/273815942_A_study_on_physico-chemical_Characteristics_to_assess_the_pollution_status_of_river_Ganga_in_Uttarakhand/links/550df1a40cf2ac2905aa8648/A-study-on-physico-chemical-Characteristics-to-a (Accessed October 28, 2024).
Matta, G., Srivastava, S., Pandey, R. R., and Saini, K. K. (2017). Assessment of physicochemical characteristics of Ganga Canal water quality in Uttarakhand. Environ. Dev. Sustain. 19 (2), 419–431. doi:10.1007/s10668-015-9735-x
Mengesha, T. (2017). Review on the natural conditions and anthropogenic threats of Wetlands in Ethiopian. Agriscigr.us 2 (1), 006–014. doi:10.17352/gje.000004
Montuelle, B., Dorigo, U., Bérard, A., Volat, B., Bouchez, A., Tlili, A., et al. (2010). “The periphyton as a multimetric bioindicator for assessing the impact of land use on rivers: an overview of the Ardières-Morcille experimental watershed (France),” in Global change and river ecosystems—implications for structure, function and ecosystem services (Dordrecht: Springer Netherlands), 123–141. doi:10.1007/978-94-007-0608-8_9
Mustfa, G., Ahmed, I., Tariq, M., and Dobriyal, A. (2023). Ecology, diversity and community structure of periphyton in the datpul Gad stream A spring fed tributary of river nayar from uttarakhand, India. J. Mt. Res. 18 (1), 281–293. doi:10.51220/jmr.v18i1.30
Nautiyal, P., and Kumar, A. (2001). Ecology of mountain streams and rivers in Garhwal Himalaya. Ecology and Conservation of Lakes, Reservoirs and Rivers. Jaipur: A B D Publishers. 393–417. Available at: https://www.researchgate.net/profile/Prakash-Nautiyal-2/publication/302271170_Ecology_of_mountain_streams_and_rivers_in_Garhwal_Himalaya/links/5d14aaa3299bf1547c82720f/Ecology-of-mountain-streams-and-rivers-in-Garhwal-Himalaya.pdf (Accessed October 27, 2024).
Nautiyal, P., Mishra, A. S., and Semwal, V. P. (2015). “Spatial distribution of benthic macroinvertebrate fauna in mountain streams of uttarakhand, India,” in Aquatic ecosystem: biodiversity, ecology and conservation (India: Springer), 31–51. doi:10.1007/978-81-322-2178-4_4
Nautiyal, P., Verma, J., and Mishra, A. S. (2014). “Distribution of major floral and faunal diversity in the mountain and upper gangetic plains zone of the Ganga: diatoms, macroinvertebrates and fish,” in Our national River Ganga (Cham: Springer International Publishing), 75–119. doi:10.1007/978-3-319-00530-0_3
Newton, A., Icely, J., Cristina, S., Perillo, G. M. E., Turner, R. E., Ashan, D., et al. (2020). Anthropogenic, direct pressures on coastal wetlands. Front. Ecol. Evol. 8. doi:10.3389/fevo.2020.00144
Ngatia, L., Grace, J. M., Moriasi, D., and Taylor, R. (2019). “Nitrogen and phosphorus eutrophication in marine ecosystems,” in Monitoring of marine pollution (London, United Kingdom: IntechOpen). doi:10.5772/intechopen.81869
Pandit, D., Kumari, P., and Sharma, S. (2020). Ecology and diversity of zooplankton of the river Ganga at Bihar, India in relation to water quality. Acad. edu 4929 (2), 305–313. doi:10.12944/CWE.15.2.18
Pastorino, P., Barceló, D., and Prearo, M. (2024). Alps at risk: high-mountain lakes as reservoirs of persistent and emerging contaminants. J. Contam. Hydrology 264, 104361. doi:10.1016/j.jconhyd.2024.104361
Pathak, S., Sharma, S., Banerjee, A., and Kumar, S. (2024). A methodology to assess and evaluate sites with high potential for stormwater harvesting in Dehradun, India. Big Data Res. 35, 100415. doi:10.1016/j.bdr.2023.100415
Rai, P., Kumar, J. S. Y., and Sen, A. (2024). Ganga, GAP, and lockdown: potential threats to the biodiversity of the river. J. Water Clim. Change 15 (11), 5482–5500. doi:10.2166/wcc.2024.322
Rana, J. S., Semalty, B., Singh, P., Swami, N., Dewan, S., Singh, J., et al. (2019). Checklist of benthic macroinvertebrate taxa along different riparian land use types in Alaknanda River catchment of the central himalaya, uttarakhand (India). Proc. Zoological Soc. 72 (2), 130–153. doi:10.1007/s12595-017-0241-z
Rana, K. S., Sharma, R. C., and Tiwari, V. (2018). Assessment of surface water quality of the Himalayan lake Beni Tal, India. Researchgate.Net. Available at: https://www.researchgate.net/profile/Rahul-Kumar267/publication/323684808_Assessment_of_Surface_Water_Quality_of_the_Himalayan_La ke_Beni_Tal_India/links/5aa40a030f7e9badd9a9ab9c/Assessment-of-Surface-WaterQuality-of-the-Himalayan-Lake-Beni-Tal-India.pdf.
Rashid, R., Bhat, R. A., Pandit, A. K., and Bhat, S. (2013). Ecological study of periphytic algal community of Doodh Ganga and khansha-mansha streams of Yusmarg forests: a health resort of kashmir valley, India. Ecological Balkanica 5 (1). 19.
Rathore, S. S., Chandravanshi, P., Chandravanshi, A., and Jaiswal, K. (2016). Eutrophication: impacts of excess nutrient inputs on aquatic ecosystem. Citeseer 09, 89–96. doi:10.9790/2380-0910018996
Rimet, F. (2012). Recent views on river pollution and diatoms. Hydrobiologia 683 (1), 1–24. doi:10.1007/s10750-011-0949-0
Rojo, C., Mosquera, Z., Álvarez-Cobelas, M., and Segura, M. (2017). Microalgal and cyanobacterial assemblages on charophytes: a metacommunity perspective. Res. Net. 190, 97–115. doi:10.1127/fal/2017/1032
Ruggiero, A., Solimini, A. G., and Carchini, G. (2004). Limnological aspects of an Apennine shallow lake. Ann. de Limnologie - Int. J. Limnol. 40 (2), 89–99. doi:10.1051/limn/2004014
Sabater, S., and Admiraal, W. (2005). “Periphyton as biological indicators in managed aquatic ecosystems,” in Periphyton: ecology, exploitation and management (Wallingford: CABI), 159–177. doi:10.1079/9780851990965.0159
Sagir, M., and Dobriyal, A. K. (2020). Structural and functional diversity of periphyton community from the western Nayar River of garhwal himalaya. Res. manuscritpub.com. 41 (1), 15–29. Available at: http://research.manuscritpub.com/id/eprint/3380 (Accessed October 27, 2024).
Sardans, J., and Peñuelas, J. (2015). Potassium: a neglected nutrient in global change. Glob. Ecol. Biogeogr. 24 (3), 261–275. doi:10.1111/GEB.12259
Saxena, P., Harish, , Shah, D., Vats, K., Miglani, R., Singh, A. K., et al. (2024). A critical review on fate, behavior, and ecotoxicological impact of zinc oxide nanoparticles on algae. Environ. Sci. Pollut. Res. 31, 19105–19122. doi:10.1007/s11356-024-32439-2
Semwal, N., Rajesh, R., Kamini, L., and Tripathi, D. M. (2023). Impact of seasonal dynamics on physicochemical profiles of river water in Himalayan regions with special reference to the River Mandakini in Uttarakhand. Journal Of Experimental Zoology India 26 (1), 1073–1078. doi:10.51470/jez.2023.26.1.1073
Semwal, P., Rayal, R., and Rawat, A. S. (2023). Reproductive power of Garra lamta (Hamilton) from spring-fed khoh river, garhwal himalaya, India. Journal of Experimental Zoology 26 (2). doi:10.51470/jez.2023.26.2.2107
Seth, R., Mohan, M., Singh, P., Singh, R., Dobhal, R., Singh, K. P., et al. (2016). Water quality evaluation of himalayan rivers of kumaun region, uttarakhand, India. Uttarakhand, India’, Springer 6 (2), 137–147. doi:10.1007/s13201-014-0213-7
Sharma, A., Sharma, R. C., and Anthwal, A. (2007). Monitoring phytoplankton diversity in the hill stream Chandrabhaga in Garhwal Himalayas. 80–84. doi:10.7537/marslsj040107.16
Sharma, B., and Hatimuria, M. K. (2017). Phytoplankton diversity of floodplain lakes of the Majuli River Island of the Brahmaputra river basin, Assam, northeast India. ij-aquaticbiology.Com. 5 (5), 295–309. doi:10.22034/ijab.v5i5.347
Sharma, C., Jindal, R., and Singh, U. B. (2018). Assessment of water quality of river Sutlej, Punjab (India). Springer. Available at: https://link.springer.com/article/10.1007/s40899-017-0173-9 (Accessed October 28, 2024).
Sharma, R., Kumar, A., Singh, N., and Sharma, K. (2021). Impact of seasonal variation on water quality of Hindon River: physicochemical and biological analysis. Springer 3 (1), 28. doi:10.1007/s42452-020-03986-3
Sharma, R., Kumar, R., Sharma, D. K., Sarkar, M., Mishra, B. K., Puri, V., et al. (2022). Water pollution examination through quality analysis of different rivers: a case study in India. Environ. Dev. Sustain. 24 (6), 7471–7492. doi:10.1007/S10668-021-01777-3
Sharma, R., and Rawat, J. S. (2009). “Monitoring of aquatic macroinvertebrates as bioindicator for assessing the health of wetlands: a case study in the Central Himalayas, India,”Ecol. Indic., 9. 118–128. doi:10.1016/j.ecolind.2008.02.004
Sharma, S., and Chhipa, R. C. (2016). Seasonal variations of ground water quality and its agglomerates by water quality index. gjesm.Net. 2 (1), 79–86. doi:10.7508/gjesm.2016.01.009
Sharma, R. C, Nindhi, S., and Rahul, K. (2016). Physico-chemical and microbiological water quality of bhimgoda wetland of Garhwal Himalaya, India. Journal of Research & Development 16, 96–103.
Singh, M., Tripathi, A., and Jeeva, V. (2016). Limnological study of Asan Wetland in relation to water quality in doon Valley, Uttarakhand, India. content.iospress.Com. 13 (1), 17–26. doi:10.3233/AJW-160003
Singh, Y., and Himalaya, G. S. (2024). Algal diversity of the western and central himalaya. taylorfrancis.Com., 85–102. doi:10.1201/9781003455202-4
Singh, Y., and Singh, G. (2024). “Algal diversity of the western and central Himalaya,” in Biodiversity hotspot of the himalaya (Apple Academic Press), 85–102. doi:10.1201/9781003455202-4
Sonal, D., Jagruti, R., and Geeta, P. (2010). Avifaunal diversity and water quality analysis of an inland wetland. Acad. edu 4, 1–32. doi:10.3126/jowe.v4i0.4151
Srivastava, K., Das, S., Thakur, V., and Alam, A. (2019). Biodiversity and spatio-temporal variation of periphyton of the River Ganga (gangotri to vindhyachal). Fish. Com. 7 (1), 109–115. Available at: https://www.fisheriesjournal.com/archives/2019/vol7issue1/PartB/6-6-52-265.pdf (Accessed October 29, 2024).
Stevenson, R. J., Yangdong, P., and Herman van, D. (2010). “Assessing Environmental Conditions in Rivers and Streams with Diatoms.” In The Diatoms: Applications for the Environmental and Earth Sciences, Second Edition, 57–85. Cambridge University Press. doi:10.1017/CBO9780511763175.005
Tabassum, S., Kotnala, C. B., Salman, M., Tariq, M., and Khan, N. A. (2024). The impact of heavy metal concentrations on aquatic insect populations in the Asan Wetland of Dehradun, Uttarakhand. Sci. Rep. 14 (1), 4824. doi:10.1038/s41598-024-52522-5
Tanuja, B., and Nautiyal, P. (2023). Diatom communities in himalayan river (lower stretch of Alaknanda, srinagar): periodic variations in relative abundance. Indian J. Ecol. doi:10.55362/ije/2023/3976
Tariq, M., Bhanu Kotnala, C., and Dobriyal, A. K. (2020). Diversity and population structure of macroinvertebrates in the glacier fed stream balkhila at tilfara from garhwal himalaya. J. Mt. Res. 15 (1), 81–89. doi:10.51220/jmr.v15i1.9
Tariq, M., Kotnala, C. B., Dobriyal, A. K., and Tabassum, S. (2022). Population structure and diversity of the periphyton community in the glacier-fed stream Balkhila at Siron from Garhwal Himalaya. J. Appl. Nat. Sci. 14 (1), 163–171. doi:10.31018/jans.v14i1.3282
Tariq, M., Kotnala, C., Dobriyal, A., and Tabassum, S. (2021). Distribution patterns and diversity of periphyton community in the glacier fed stream balkhila at Tilfara from Garhwal Himalaya’, Mbimph.Com. Available at: https://mbimph.com/index.php/UPJOZ/article/view/2797/2438.
Tiwari, P. C., Tiwari, A., and Joshi, B. (2018). Urban growth in himalaya. J. Urban Regional Stud. Contemp. India 4 (2), 15–27. Available at: http://home.hiroshima-u.ac.jp/hindas/index.html (Accessed January 8, 2025).
Trbojević, I., Jovanović, J., Kostić, D., Popović, S., Krizmanić, J., Karadžić, V., et al. (2017). Structure and succession of periphyton in an urban reservoir: artificial substrate specificity. Oceanol. Hydrobiological Stud. 46 (4), 379–392. doi:10.1515/ohs-2017-0038
Tripathi, D. K., Govind, P., and Jain, C. K. (2015). Physicochemical analysis of selected springs water samples of Dehradun City, Uttarakhand, International Journal for Innovative Research in Science & Technology 2 (05), 99–103.
Tuboi, C., Irengbam, M., and Hussain, S. A. (2018). Seasonal variations in the water quality of a tropical wetland dominated by floating meadows and its implication for conservation of Ramsar wetlands. Elsevier 103, 107–114. doi:10.1016/j.pce.2017.09.001
Vis, C., Hudon, C., Cattaneo, A., and Pinel-Alloul, B. (2016). Periphyton as an indicator of water quality in the st lawrence river (quebec, Canada). Elsevier. doi:10.13140/RG.2.1.3666.0088
Vivek Santhiya, A. A., and Athithan, S. (2024). Effect of different natural substrates on periphyton production under earthen lined seawater pond for periphyton based aquaculture. Indian J. Animal Res. 58 (1), 154–160. doi:10.18805/IJAR.B-4820
Welch, B. L. (1948). On the comparison of several mean values: an alternative approach. Biometrika 38 (3/4), 330. doi:10.2307/2332579
Wetzel, R. (1983). Recommendations for future research on periphyton. Springer. Available at: https://link.springer.com/content/pdf/10.1007/978-94-009-7293-3.pdf#page=323 (Accessed October 26, 2024).
Wetzel, R. (2005). Periphyton in the aquatic ecosystem and food webs. Books. google, 51–69. doi:10.1079/9780851990965.0051
Yadav, A., Kumar, D., Singh, R. S., Pandey, L. K., and Rai, J. (2018). Seasonal variations in response of periphytic algal community to nutrient enrichment in the river Ganga (Varanasi, India). Ann. de Limnologie - Int. J. Limnol. 54, 32. doi:10.1051/limn/2018025
Keywords: Asan Wetland, ecosystem conservation strategies, nutrient dynamics, periphyton communities, ramsar site, water quality bioindicators
Citation: Tabassum S, Kotnala CB, Dobriyal AK, Salman M and Bamola R (2025) Distribution and dynamics for the ecological assessment of Asan Wetland through periphyton -a water quality indicator. Front. Environ. Chem. 6:1529439. doi: 10.3389/fenvc.2025.1529439
Received: 16 November 2024; Accepted: 17 January 2025;
Published: 05 February 2025.
Edited by:
Naser A. Anjum, Aligarh Muslim University, IndiaReviewed by:
Akbar Ali, Dayalbagh Educational Institute, IndiaCopyright © 2025 Tabassum, Kotnala, Dobriyal, Salman and Bamola. This is an open-access article distributed under the terms of the Creative Commons Attribution License (CC BY). The use, distribution or reproduction in other forums is permitted, provided the original author(s) and the copyright owner(s) are credited and that the original publication in this journal is cited, in accordance with accepted academic practice. No use, distribution or reproduction is permitted which does not comply with these terms.
*Correspondence: Sazia Tabassum, c2F6aWF0YWIyMEBnbWFpbC5jb20=
Disclaimer: All claims expressed in this article are solely those of the authors and do not necessarily represent those of their affiliated organizations, or those of the publisher, the editors and the reviewers. Any product that may be evaluated in this article or claim that may be made by its manufacturer is not guaranteed or endorsed by the publisher.
Research integrity at Frontiers
Learn more about the work of our research integrity team to safeguard the quality of each article we publish.