 Yosri Wiesner1*†
 Marius Bednarz2*†
 Ulrike Braun2
 Claus Gerhard Bannick2
 Mathias Ricking2Korinna Altmann1
- 1Bundesanstalt für Materialforschung und -prüfung, Berlin, Germany
- 2Federal Environment Agency, Berlin, Germany
Inputs of plastic impurities into the environment via the application of fertilizers are regulated in Germany and the EU by means of ordinances. Robust and fast analytical methods are the basis of legal regulations. Currently, only macro- and large microplastic contents (>1 mm) are measured. Microplastics (1–1,000 µm), are not yet monitored. Thermal analytical methods are suitable for this purpose, which can determine the mass content and can also be operated fully automatically in routine mode. Thermal extraction desorption-gas chromatography/mass spectrometry (TED-GC/MS) allows the identification of polymers and the determination of mass contents in solid samples from natural environments. In accordance with the German or European Commission (EC) Fertiliser Ordinance, composting plants should be monitored for microplastic particles with this method in the future. In this context a compost plant was sampled. At the end of the rotting process, the compost was sieved and separated in a coarse (>1 mm) and a fine fraction (<1 mm). The fine fraction was processed using density separation comparing NaCl and NaI as possible salt alternative and screened for microplastic masses by TED-GC/MS with additional validation and quality assurance experiments. With TED-GC/MS total microplastics mass contents of 1.1–3.0 μg/mg in finished compost could be detected with polyethylene mainly. What differs much to the total mass of plastics in the coarse fraction with up to 60 μg/mg, which were visually searched, identified via ATR-FTIR and gravimetrically weighted.
1 Introduction
Plastics in the environment has been in the public, politics, standardization (ISO, 2020) and scientific spotlight for years, especially microplastics (MP) (Hale et al., 2020; Rios Mendoza et al., 2021). At present, efforts are being made to formulate and adopt international binding requirements for the reduction of plastic inputs into the environment at UN level. MP describes plastic particles with a size of 1–1,000 μm and 1–5 mm for large MP according to the definition in ISO/TR 21960:2020 (ISO, 2020), which mainly consists of synthetic polymers, e.g., polyethylene (PE), polypropylene (PP), polystyrene (PS), polyamide (PA) or polyethylene terephthalate (PET). Little is known about the occurrence, transport pathways, fate or risk of these small plastic particles in water, and even less in soil (Horton et al., 2017; He et al., 2018). Also no validated data exists for the pathways and behavior of plastic contaminations in industrial biowaste treatment plants (Gui et al., 2021). Agricultural soils are increasingly the focus of plastic-relevant investigations due to direct inputs of plastics such as mulch films and applications of plastic-containing fertilizers such as compost and sewage sludge (van Schothorst et al., 2021; Vithanage et al., 2021).
In 2017, approximately 14.2 million tons of biodegradable waste were collected in Germany, from which 3.9 million tons of compost was produced (Federal Statistical Office, 2019). Various legal regulations are intended to ensure composts of a high quality. These are neither harmonized nor are binding test methods prescribed. The German Fertilizer Ordinance (DüMV) (DüMV, 2023) permits the presence of plastic particles larger than 1 mm (until 2021 > 2 mm (current EC limit)) in industrially produced composts with 0.5 wt% (5 μg/mg) for total allowed plastics amounts and 0.1 wt% (1 μg/mg) for shape-flexible foil fragments as maximum limits. Neither regulation prescribes a testing requirement. In Germany, the Biowaste Ordinance (BioAbfV) still regulates the quality of the biomaterial to be composted. The limits of max. 0.5 wt% plastics (>2 mm) specified there are to be tested according to the BGK e.V. method book. Another German ordinance (Fertilizer Sampling and Analysis Ordinance; DüngMProbV) serves to regulate the testing of fertilizers (DüngMProbV, 2023). In this, the application of the examination method according to the VDLUFA method book as well as according to the method of BGK e.V. is recommended very vaguely, although both methods differ (VDLUFA, 2000). There are no requirements for fraction < 1/(2 EC) mm.
General compost feedstock based on biowaste from private households and green waste (Federal Environment Agency, 2022). Apart from compostable packaging such as compost bags and papers, plastic products consisting of conventional polymer types such as PE, PP, PS or PET can be expected. Improper waste collection and many misthrows within the organic waste lead to the fact that a high technical effort with advanced separation techniques is required to guarantee a sufficient compost quality according to legal regulations.
The incoming waste as well as plastic impurities are exposed to mechanical and thermical stress and biological influences. The separation of the waste and its subsequent homogenization is carried out mechanically using conveyor belts, sieve drums, magnetic separators, wind sifters and excavator shovels. Various strains of bacteria and fungi are responsible for the biological degradation processes, which, in addition to bio-chemical processes, also create an exothermic environment with higher temperatures. In part, biogas can also be obtained by means of upstream fermentation, whereby the pH value of the biowaste decreases. Since compost is subsequent used as a fertilizer in agriculture and landscaping in Germany, plastic particles can enter the soil via this route, thus providing a pathway for MP into the environment (Lwanga et al., 2022). Starting from the improperly discarded and insufficiently sorted plastic products, even smaller particles are often created during the subsequent spreading of the compost on the field due to weathering of larger plastic particles and their further degradation (Sholokhova et al., 2021a; Gui et al., 2021).
The determination of the content of impurities in compost is described in the book of methodology on compost analysis (Bundesgütegemeinschaft Kompost, 2016) with the separation of impurities by selection from the coarse fraction >1 mm. Nothing is said for smaller particles. Several types of large MP and macroplastics can be identified with vibrational methods like Attenuated total reflectance—Fourier-Transform Infrared Spectroscopy (ATR-FTIR). Nowadays, various methods are available for the identification of MP small particles based on different procedures, but they are unsuitable for routine testing. Often plastic particles in composts are determined in a visual way. However, this method is very inaccurate. This was already pointed out by Hidalgo in 2012 (Hidalgo-Ruz et al., 2012). Microscopic methods like µ- Infrared Spectroscopy (µ-IR) and µ-Raman spectroscopy (µ-Raman) can generate a number of MP particles in addition to size and shape (Ruggero et al., 2020; Sholokhova et al., 2021b), while total masses can be determined by thermoanalytical methods (Müller et al., 2019; Becker et al., 2020). A practical approach for MP detection in compost samples is the ThermalExtractionDesorption-Gas Chromatography/Mass Spectrometry (TED-GC/MS). TED-GC/MS has been developed at BAM in recent years (Duemichen et al., 2019). By coupling thermogravimetric analysis (TGA) with gas chromatography/mass spectrometry (GC/MS), different types of polymers can be identified in one sample next to each other on the basis of their specific polymeric decomposition products and quantified in terms of their total mass, making the method ideally suited for limit value monitoring in accordance with DüMV (BMUV, 2021).
In the context of the present work, the TED-GC/MS method was adapted as routine detection method for MP masses in composts. A proof of concept for the detection of plastics in compost samples has been developed, including sample preparation and the separation of large MP with 1–5 mm particle sizes. For this purpose, real compost samples were obtained from a composting plant in the northern part of Germany. For the first time, the work represents a routine procedure for the analysis of plastics smaller and larger than 1 mm according to the DüMV in compost. The samples were separated in different size fractions by sieving, homogenized and partly density separated. Due to the sample pretreatment, microplastic particles in the range of 1,000-5 µm were measured. Analysis of the particles occurred by TED-GC/MS (fraction < 1 mm) and ATR-FTIR (fraction > 1 mm) screening for typical synthetic polymer types such as PE, PP, PS, PET, PVC (polyvinylchloride), SBR (styrene-butadiene rubber) or EVAC (ethylene-vinyl acetate). Two biodegradable polymers, polybutylene adipate terephthalate (PBAT) and polylactide (PLA), were also included.
2 Materials and methods
2.1 Material
The compost samples tested originated from the same composting plant. Three sampling campaigns were carried out. The samples are so-called finished compost, which is mainly produced from municipal biowaste. In order to come from the biowaste to the final product (finished compost), the following steps are taken: Coarse cleaning, fermentation, composting and fine processing. The resulting finished compost is then piled up into a heap. Samples were taken from these piles according to the State Working Group on Waste (Länderarbeitsgemeinschaft Abfall) (Ländergemeinschaft Abfall LAGA, 2001). Representative volumes were taken, homogenized, and divided into samples consisting of each 1 L of compost (∼350 g).
Samples from the first sampling campaign differed in their storage time at the plant. These were a daily fresh produced finished compost, a compost stored for 1 week and a compost stored for 3 weeks after production with a sample volume of 10–30 L each. In the second sampling campaign, 2 L freshly made compost fresh on the day and 5 L compost with a 3-week storage period were sampled. In the last campaign, a bigger amount of ×10 1 L each daily fresh compost was collected.
2.2 Sample preparation
The test samples from the first campaign were steam sterilized, air-dried at 50°C in a drying cabinet (UL 80, Memmert GmbH, Schwabach, Germany) and divided into two parts by chopping and quartering. One-half was homogenized with a centrifugal mill (ZM200, Retsch GmbH, Haan, Germany) under cooling with liquid nitrogen as pretreatment followed by milling with 18,000 rpm using a stainless-steel sieve with trapezoidal holes of 1 mm hole size. 50 g of the ground compost sample was additionally treated with 250 mL of a 20% water solution of hydrogen peroxide (H2O2) for 24 h to achieve a reduction in organic content (Al-Azzawi et al., 2020). Subsequently, these samples were washed and filtered with a 5–6 µm stainless-steel mesh (GKD—Gebr. Kufferath AG; Düren; Germany) and dried afterwards at 30°C.
The second half of the samples were also reduced to 1 L each by chopping and quartering. Each liter of compost was sieved through a stainless-steel 1 mm mesh size (ring sieve, diameter 20 cm, Retsch) and was fractionated into a coarse fraction (>1 mm) and a fine fraction (<1 mm). The mass content of each fraction was determined gravimetrically with a mass balance (BP 6100, Sartorius, Göttingen, Germany).
Samples taken in the second campaign were reduced to 1 L sample volume each, steam sterilized and air-dried at 50°C. Afterwards, they were transferred in and fractionated by a stainless-steel sieve with 1 mm mesh size (ring sieve, diameter 20 cm). Two aliquots of ∼50 g each from the <1 mm fraction was density separated comparing two density separation agents (500 mL each): sodium chloride (NaCl) with a solution density of 1.2 g/cm3 and sodium iodide (NaI), 1.9 g/cm3, respectively. Subsequently, the remaining samples were prepared with the more efficient agent to determine the total plastic contents. The floating material was separated from the separation solution using a 5 µm stainless steel mesh and was homogenized with the same centrifugal mill as in the first sampling campaign but using a stainless-steel sieve with a mesh size of 200 µm additionally.
Coarse material from the sieving was separated over a period of 20 min from all plastic impurities (>1 mm) with the aid of stainless-steel tweezers. All plastic impurities were measured with an ATR-FTIR instrument (Nicolet IS50, Thermo Fisher, Waltham, United States) equipped with diamond crystal for identification of the polymer type and weighted on a balance (MSE225S-100-DI, Sartorius, Göttingen, Germany) separately.
During the third sampling campaign, for statistical reasons, 10 individual samples of 1 L sample volume each were taken from a homogenized bulk of more than 100 L. In order, these samples were steam sterilized, air dried and sieved in the laboratory. Five of the individual samples were then separated and passed over a 1 mm ring sieve. Coarse material that has not passed the sieve was investigated for plastic impurities like in the second campaign. Afterwards, a density separation of the fractions <1 mm was made by using a concentrated NaI solution (Constant et al., 2021). Finally, the floating material was separated and again homogenized with milling in the centrifugal mill like in the second campaign.
2.3 Detection of macroplastics and large plastics content in the coarse fractions (>1 mm)
The plastic polymer types were identified by ATR-FTIR and quantified gravimetrically, with a finer distinction than deformable and non-deformable plastics corresponding to the DÜMV. The calculation of the proportion (w = mass share) of plastic types is the quotient of the sum of the plastic masses (m = mass) and the specimen mass:
with
2.4 Detection of MP content in the fine fraction (<1 mm) determined by ThermoExtractionDesorption-gas chromatography/mass spectrometry
TED-GC/MS has already been routinely used as an identification and quantification method for detection of MP masses in different environmental matrices (Eisentraut et al., 2018; Bannick et al., 2019; Mansa and Zhou, 2021). Here, the aim is to perform initial screening measurements using TED-GC/MS to investigate a possible application of this method to compost samples. Furthermore, an influence of the storage time on the plastic contents was to be investigated in order to guarantee a stable analysis. Additionally, a better homogenization of the sample should be achieved with the reduction of the organic components by the use of H2O2-treatment as pretreatment for TED-GC/MS measurement.
The TED-GC/MS is a multi-step analysis procedure, in which first the organic compounds of a sample are pyrolyzed and the gaseous pyrolysis products are collected on a solid phase adsorber (thermal extraction). In a further step, the decomposition products are thermally desorbed (thermal desorption), chromatographically separated in a gas chromatography system and then detected by mass spectrometry.
All samples were measured by TED-GC-MS. The samples were each weighed in a 150 µL alumina crucible with a sample intake of 20–25 mg. Since the screening was carried out for the most used plastics in industry such as PE, PP, PS, PET, acrylates, PA and SBR. Table 1 lists all pyrolysis products used for quantification for the screened polymers.
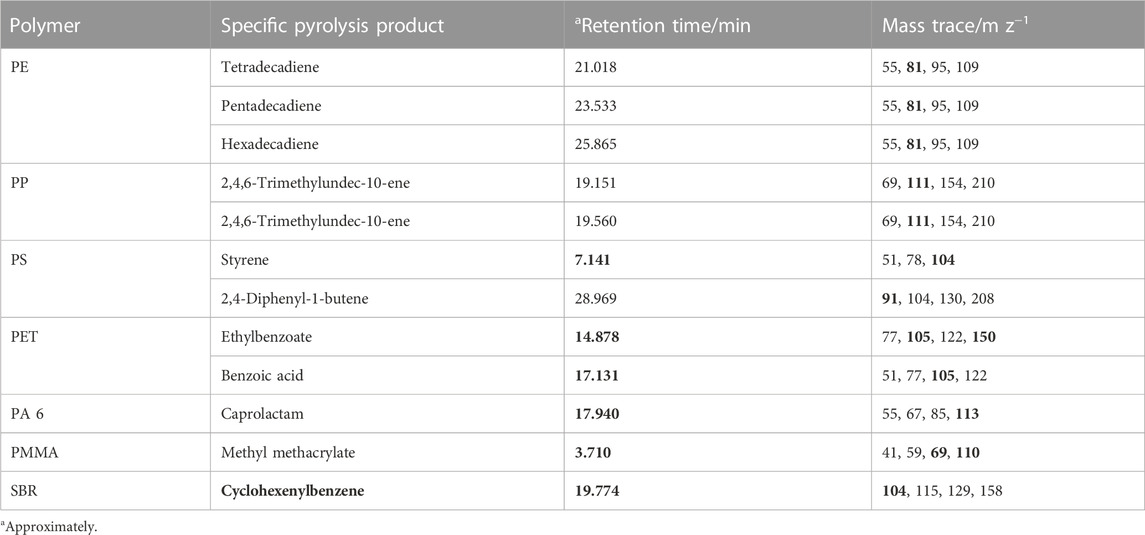
TABLE 1. Screened polymers, corresponding specific pyrolysis product, retention time and relevant mass traces (in bold: mass traces used for quantification).
In addition, the screening protocol was extended by two biodegradable plastics. These are polybutylene adipate terephthalate (PBAT) and polylactide (PLA). Characteristic pyrolysis products identified for PBAT were adipic acid dibut-3-enyl ester and terephthalic acid, di (but-3-enyl) ester. For PLA, the compounds propenoic acid and 3,6-Dimethyl-1,4-dioxande-2,5-dione were detected (Figure 1).
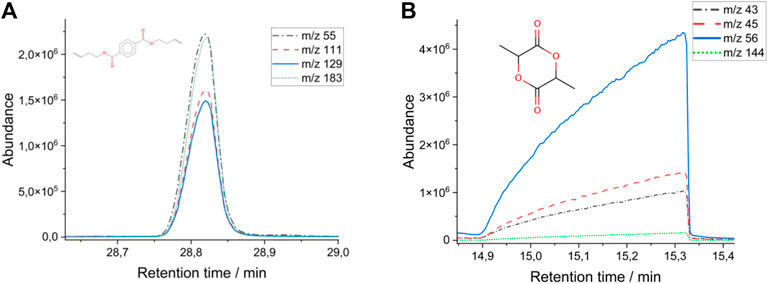
FIGURE 1. Characteristic pyrolysis products of PBAT (A) and PLA (B).
The presence of styrene-butadiene rubber (SBR) as a typical polymeric compound found in tire wear is also routinely tested in samples with environmental relevance. Limits of detection (LOD) from below 0.08 µg (PS) to 2.2 µg (PE) for the pure polymers absolute in measuring crucible were observed. The LODs for PBAT and PLA are 0.07 and 0.39 µg. The limit of quantification (LOQ) is assumed by twice LOD.
Identification of the polymer type is carried out by locating characteristic and specific marker molecules on the basis of respective mass traces in the chromatogram. The quantification was performed using a matrix-relevant response factor via standardaddition (factormr).
For this purpose, a sample is measured twice. In the first measurement, a representative subsample is measured. The corresponding peak areas of the analytes (pa1) can be calculated and standardized with the help of the internal standard (D5-PS). In a second measurement, known masses of the identified polymer types are added to a new subsample of same intake. Here too, the corresponding normalized peak areas (pa2) are calculated. Finally, the subtraction of the normalized peak area is performed to obtain the resulting normalized peak areas (pares) of the known weight-in masses for the individual polymer types.
For quantification, the ratio between pares and the given polymer mass (mpol) is calculated (factormr):
2.5 Quality assessment
Sampling was carried out exclusively with stainless steel vessels and tools and natural products such as cellulose to work as plastic-free as possible. Components in contact with the sample during sample preparation and detection were made exclusively of glass, stainless steel, silicone and PFA (perfluoroalkoxy alkanes). For sample storage during sample preparation, samples were stored in a fume cupboard covered in glass jars. The liquids used were filtered through glass fiber filters with a mesh size of 0.2 µm to eliminate any relevant contamination. Due to the lack of a plastic-free reference compost, no “field-blank” samples could be measured. 4 μg/L Deuterated polystyrene (D5-PS; Polymer Source, Dorval, Canada) was spiked to all samples as an internal standard for TED-GC/MS to make the measurements comparable by considering the matrix and to guarantee a well-working device. Blanks were performed between each sample measurement to avoid possible carry-over of pyrolysis products.
3 Results
The samples obtained from the composting plant were prepared using various sample preparation steps in order to develop a routine method for the analysis of compost according to the DüMV. The determination of plastic impurities was carried out according to the book of methodology for compost analyzing (DüMV, 2023). In addition, an identification of the plastics (>1 mm) contained was carried out with ATR-FTIR measurements. The first two campaigns were aimed at obtaining an impression of the variations in MP mass content. On the other hand, a protocol for sample preparation was developed on the basis of these samples to generate a homogeneous partial and analytical sample. In the first campaign the general feasibility of thermoanalytical determination of plastic contents in composts was to be tested, as well as effects of the reduction of organic matrix components by means of H2O2. In a second campaign, two potential separation solutions were compared. The methodology was statistically validated with a third campaign. The prepared analysis samples were finally measured in TED-GC/MS for MP mass determination.
3.1 Macroplastics and large plastics content in the coarse fraction (>1 mm)
The share of the coarse fraction varies over the entire sampling period. Mass shares of composting materials that did not pass the 1 mm sieve mesh vary from 285.82 to 460.72 mg/g compost. A coarse share of 285.82 mg/g with was determined in the daily fresh compost of the first campaign, 324.97 mg/g in the 1 week storage compost and 319.57 mg/g in the 4 weeks storage, respectively. Here, the day-fresh compost contained 113.2 mg of plastics, the 1 week compost 41.4 mg, and the 3 weeks compost 44.8 mg.
In the samples of the second sampling campaign 1 g daily fresh compost contains 361.25 mg coarse material (>1 mm) including 0.023 mg of plastics and 460.72 mg in 3 weeks storage compost with 0.012 mg plastics. The five samples of the third campaign show an average share of 352.74 mg (±9.66 mg) per 1 g daily fresh compost and a plastics mass of 20.78±10.75 mg.
PE was the most common found plastics, followed by PP. However, PET, PVC and EVAC were detected as shown in Figure 2. In the samples of the second campaign, the PE content varied between 0.007 (daily fresh) and 0.009 μg/mg (3 weeks storage). The same samples include PP just in the daily fresh compost with 0.016 μg/mg. The 3 weeks stored compost contain PVC with 0.003 μg/mg.
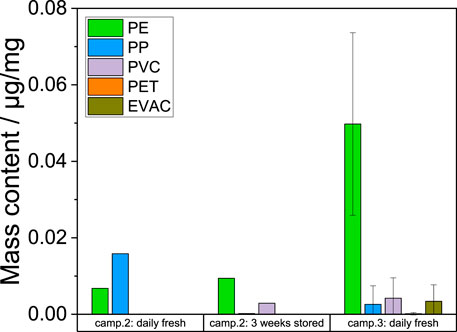
FIGURE 2. Mass contents of the separately detected large plastic particles in the coarse fractions of the compost samples [µg/mg] from the second and third campaign (mean value; n = 5).
The inhomogeneity of plastic type contents in compost becomes visible in the five samples of campaign 3. There are PE contents of 0.050 μg/mg in average with a standard deviation of 0.024 μg/mg. The standard deviations of PP (0.003 ± 0.005 μg/mg), PVC (0.004 ± 0.005 μg/mg), PET (<0.001 ± <0.001 μg/mg) and EVAC (0.003 ± 0.004 μg/mg) are higher than mean values and depends on the presence or absence of single plastic particles in the samples. The presence of PE is shown by a higher amount of foil residues, while the other plastic types were present as single fragments.
All investigated samples include plastic impurities with particle sizes of >1 mm, but with concentrations below the limit value of 0.5% (5 μg/mg) allowed by DüMV.
3.2 Microplastics content in the fine fraction (<1 mm)
3.2.1 Homogeneity
The compost can be characterized through four areas identified in the mass loss curve and their first deviation (mass loss rate) (Gašparovič et al., 2010; Kremer et al., 2021), which is a result of thermogravimetric analysis (TGA) as TED-GC/MS extraction step with the thermobalance (Figure 3). The decrease in mass up to 160°C is due to the loss of adhesive and crystal water. The mass loss between 200°C and 360°C is attributed to biological-organic components. Between 360°C and 550°C, more stable biological organic compounds decompose. On the other hand, polymers also show a mass loss in this range, which was checked again by spiking a compost sample. Here PE, PP, PS and SBR were added. The mass residue mainly consists of oxidizable organic substances and inorganic compost components. All five samples of the third sampling campaign show a very similar behavior in thermogravimetry analysis, which indicates a high degree of homogeneity (Figure 3).
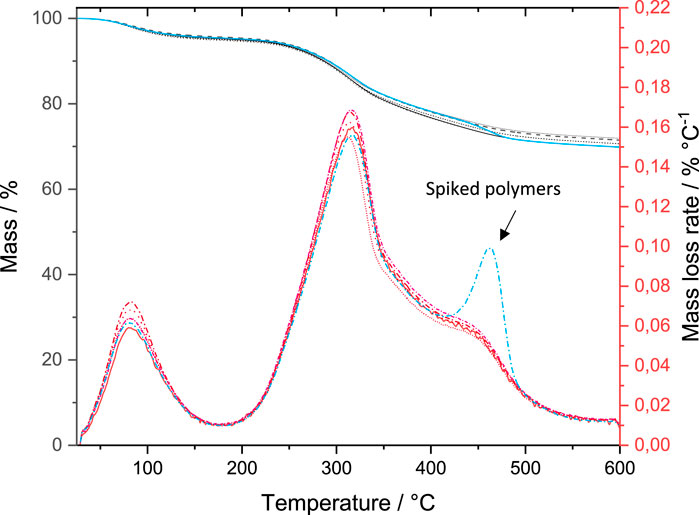
FIGURE 3. Mass and mass loss rate (differential mass) curves of the five compost samples (black: mass; red: mass loss rate) and with polymers spiked sample (blue).
3.2.2 Organic reduction by H2O2 treatment
The samples from the first sampling campaign were used for H2O2 pretreatment tests to reduce the organic part. The samples taken as individual random samples differ only to a limited extent in their polymer mass. Since we have no information about the individual composition of the samples at the composting plant and this is a proof-of-concept, the results were averaged over the samples. At this point, we cannot make any statement about possible differences due to the different storage times at the composting plant. The standard deviation may be slightly overestimated because not only the influence of the H2O2 treatment is considered, but also the different compositions of the samples due to sampling.
In all compost samples (non/and H2O2 treated), the detected polymer contents were above LOD and LOQ and thus sufficient to ensure a stable identification and quantification by TED-GC/MS. Mainly PE and PS were identified and quantified with mass contents of 0.99–2.68 μg/mg for PE and 0.06–0.89 μg/mg for PS intake within the measuring crucible next to PP and SBR with lower masses (Figure 4).
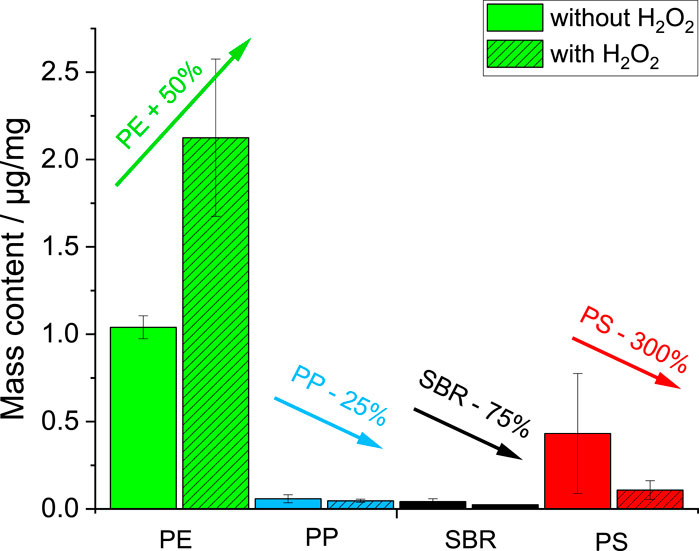
FIGURE 4. Determined polymer masses before and after H2O2 treatment.
The determined polymer mass increases to higher values for PE after H2O2 treatment. The masses for PP, SBR and PS decrease by up to 300% for PS. H2O2 acts not only on the natural particles but also on the synthetic MP particles during H2O2 treatment.
H2O2 is a strong oxidation agent. It acts mainly through the formation of radicals. It is well known in the literature that PS can be degraded by radical agents (Ortiz et al., 2022). The degradation products listed in Table 1 and the polymer markers used for quantification are most likely no longer the only ones describing PS. Oxidized products are missing, therefore a lower mass is determined. A similar assumption is made for SBR, as SBR is a co-polymer of polystyrene and butadiene. Unlike polyethylene, polypropylene has a tertiary H atom, which makes it less resistant to oxidants than PE.
The increasing mass for PE can be explained by matrix reduction, which gives a lower baseline during peak integration and higher masses after polymer content calculation. Since PE has no functional groups, it is less vulnerable to oxidation processes.
H2O2 treatment was dispensed with in the further course and is not recommended. On the one hand, because the signal changes were not significant. And on the other hand, potential polymer damage affecting the mass contents could not be excluded.
3.2.3 Inorganic reduction by density separation (NaCl < - > NaI)
Some compost samples of the second sample campaign were used to test the efficiency of density separation for inorganic matric reduction with the aim of a reduction of inorganic components and an enrichment of organic contents. Thus, the enrichment led to a homogenization of the relevant plastic phases and an increase of the plastic content. Density separations are usually carried out with different saturated salt solutions. The salts differ in various properties. In this study, NaCl and NaI were compared. NaCl is an environmentally friendly and very inexpensive salt, whereas NaI is highly harmful to aquatic organisms and much more costly. Saturated solutions of the respective salts reach densities of ∼1.2 g/cm³ (NaCl) and ∼1.9 g/cm³ (NaI). Since PE and PS made up the highest proportion in the first investigations (see above, Figure 4), the more expensive and less environmentally friendly variant with NaI could be dispensed with.
After NaCl density separation, only PE could be found (Figure 5). At 0.93 g/cm3 it is the only polymer detected in the compost samples with a lower density than water. It would naturally float. PS and SBR have higher densities. Whereas the density of PS is around 1.05 g/cm³, SBR is often added to products that are made up of several material combinations. The density thus varies depending on the product composition used and can reach a density of 1.6–1.7 g/cm³ for tires. Obviously, these polymers cannot be separated from the compost matrix with NaCl and thus these polymers would be underestimated in monitoring measurements using NaCl as separation agent.
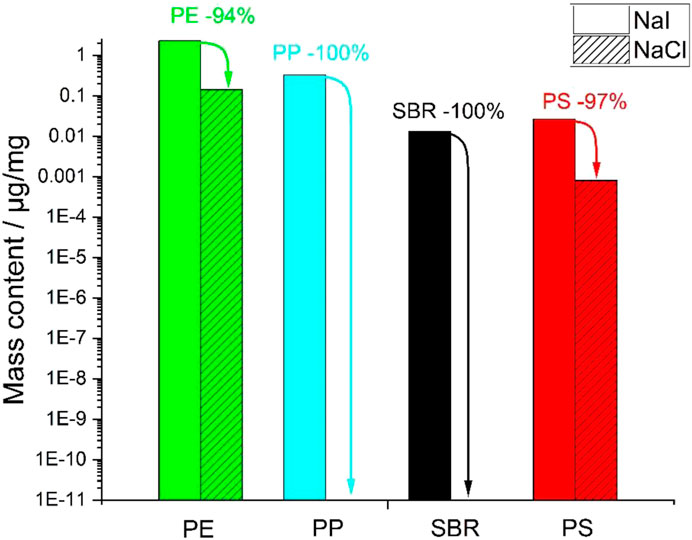
FIGURE 5. Logarithmic plot of TED-GC/MS results of fraction <1 mm of finished compost with previous density separation using NaCl and NaI.
The detectable PE concentrations were higher by a factor of four in direct comparison to density separation with NaI as agent. Additionally, PP, PS and SBR were detected with PP only being present after NaI pretreatment. These results indicate that the significantly higher density of NaI with 1.9 g/cm3 leads to improved separation of MP particles and inorganic matrix.
Since PE accounts for the highest mass content and, next to PP, has the lowest density, the difference in density of the NaCl and NaI solutions of 0.7 g/cm³ seems to have a high influence on the separation efficiency. All detected polymers except SBR have a density of up to 1.05 g/cm³ and should therefore be transferred from a saturated NaCl solution to the buoyant phase. The fact that this does not happen could be due to increased aggregate formation and/or adhesion of MP particles to sediment particles.
Opposite, NaI as a salt seems to be well-suited, because NaI allows to set a density of 1.9 g/cm3 at a pH of 6–9 and a moderate toxicity, which is high enough to enable the separation of polymers with a high density such as PET (1.4 g/cm3) or SBR (1.6 g/cm3).
3.3 Validation of the method
To validate an analytical method and ensure that an accurate measurement result is obtained, the method must be tested for accuracy and precision, where accuracy describes the deviation of the measurement result from the “true” value and precision describes repeatability.
3.3.1 Accuracy
The absolute masses in the measurement of all detected polymer types in the samples are significantly higher than the limit of detection and limit of quantification, which also indicates a robustness of the method. Table 2 shows the ratio of detected polymer masses divided by the LOD/LOQ.
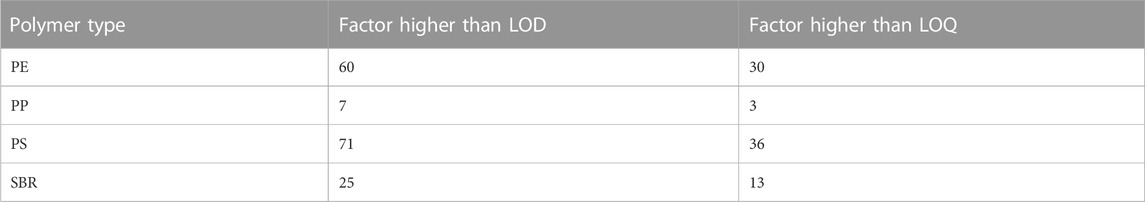
TABLE 2. Detected polymer masses in relation to the LOD and LOQ.
Mass contents between 1.1 and 3.0 μg/mg could be determined with PE being the dominant polymer (Table 3) in the compost samples.
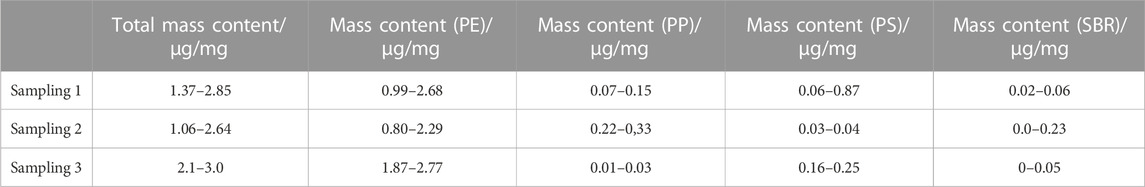
TABLE 3. Overview of the total plastic masses and the relative polymer amounts.
As PE has the highest mass content, further checks were carried out to rule out false positive PE identification, which would theoretically be possible as compounds with a similar chemical structure to PE (e.g., fatty acids or glycerin fatty acid ester) could produce similar decomposition. For this purpose, three criteria for verification of “real” PE were introduced:
1) Pure PE decomposes mainly into a homologous series of alkanes, alkenes and alkadienes during pyrolysis. 2) There are natural compounds such as fatty acids that also decompose to alkanes, alkenes and alkadienes. However, the quantity and ratio of the similar decomposition products, espacially of the different alcadienes of natural fatty acids are different compared to PE. 3) Spiking the sample with pristine PE can serve as a comparison to evaluate the pyrolysis behaviour of the spiked PE in the compost matrix with the original PE.
These criteria are explained in more detail below.
(1) All samples show repeating triplets of alkadienes, alkenes and alkanes in their decomposition products in the compost sample. Figure 6 shows the pattern of the specific mass traces (m/z). The alkane is represented by m/z 85, the alkene by m/z 83 and the alkadiene by m/z 81. Similar compounds often generate decomposition products consisting of alkene and alkanes, but without alkadienes. Alkadienes are much more specific and a high indication for existence of PE.
(2) Natural substances that produce a relevant amount of long-chain alkadienes during pyrolysis are for example, fats or the corresponding unsaturated fatty acids. In particular, natural fats and fatty acids can decompose into long hydrocarbon chains under the pyrolytic process, and with appropriate chain length, the formation of C14, C15, C16 alkadienes is also possible. Most likely, only individual markers are formed, while PE generates a homologous series of all named polymer marker molecules. For this purpose, the amount of different alkadienes is different from that of PE. For this reason, quantification must be carried out via more than one alkadiene compound, whereby the different alkadienes must lead to a homogeneous mass result without a high standard deviation within a sample when quantified via standard addition. No indication of fatty acids could be found in the presented chromatogram. If acids are present in a significant proportion, particularly saturated even-numbered fatty acids are also detectable in the chromatogram.
(3) The mass traces of the alkadienes presented in Figure 7A are clearly visible in the samples as an example of the hexadecadiene quantifiers of the PE via evaluation using three characteristic mass traces (m/z 82, 81, 67). Adding known mass of PE (Figure 7B, pristine PE) to the sample increases the peak area (Figure 7C) as correlating factor to the unknown mass of PE in the compost sample. In the direct comparison with the spiked sample (Figure 7C), the peak position as well as the peak pattern are consistent between the samples and show very similar course of the different mass traces. The minimal retention time shift of 0.04 min in the peak positions is because different measurement times. On the other hand, these are measurements with and without compost matrix. The pyrolysis products of the organic components in the compost interfering with elution of some compounds.
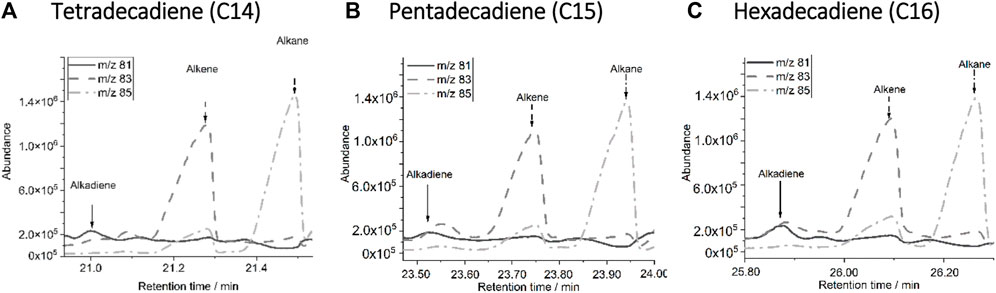
FIGURE 6. Repeating alkadiene, alkene and alkane triplets of C14 (A), C15 (B) and C16 chains (C) according to the homologous series of PE used for quantification.

FIGURE 7. Pattern of the relevant mass traces of hexadecadiene in the compost sample (A), in pure PE (B) and in the spiked compost sample (C).
3.3.2 Precision
Five aliquotes of the same sample (third sampling campaign) were measured to assess repeatability. Again, PE, PP, PS and SBR were detected with PE as dominant polymer type. The total polymers masses are between 2.3 and 2.7 μg/mg including PE masses of 2.06–2.5 μg/mg. The masses of the compost subsample measurements showed no significant variations with regard to the identification of the polymer type and the corresponding mass (Table 4).
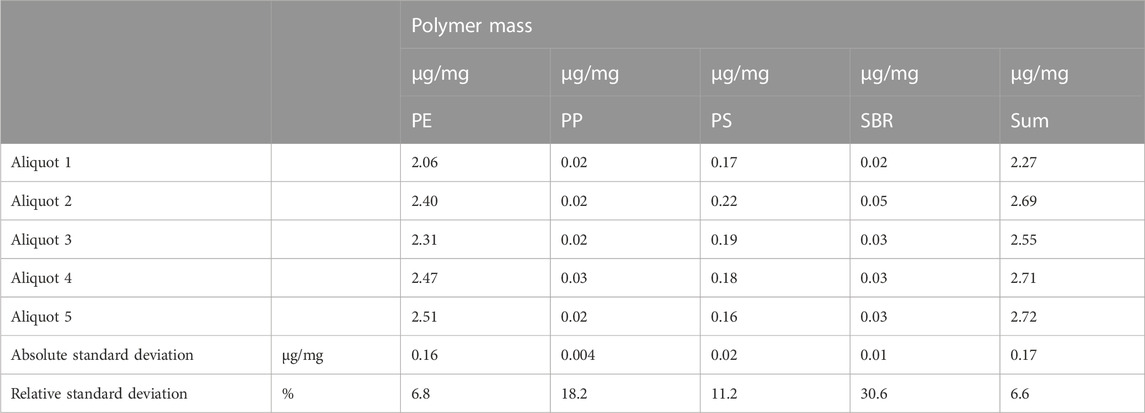
TABLE 4. Detected polymer masses of five aliquotes of one sample from third sampling campaign according to the precision parameter.
PE accounts for more than 90% of the total mass. The relative standard deviation for the quantified PE mass is about 7%, which also corresponds to the standard deviation for the total mass. The polymers PP, PS and SBR, which were identified with a lower mass, show relative standard deviations between 11% and 31%, which is acceptable due to the very low masses and therefore propably a more difficult homogeneous distribution in the sample.
In addition to the standard deviation for the determined polymer masses from the samples, the analytical error can also be determined on the measuring device. If possible, each polymer is evaluated with more than one marker molecule to ensure identification (Table 1). This results in several masses per polymer type and sample, which should ideally all have the same value. In reality, these values usually vary, so that it is worth taking a closer look at the variation and positional relationship of the mass contents for further analysis. The results are prepared in the form of boxplot diagrams for the polymers PE, PP and PS (Figure 8). SBR was quantified via one marker compound, which is why the number of values was too low for analysis by boxplot.
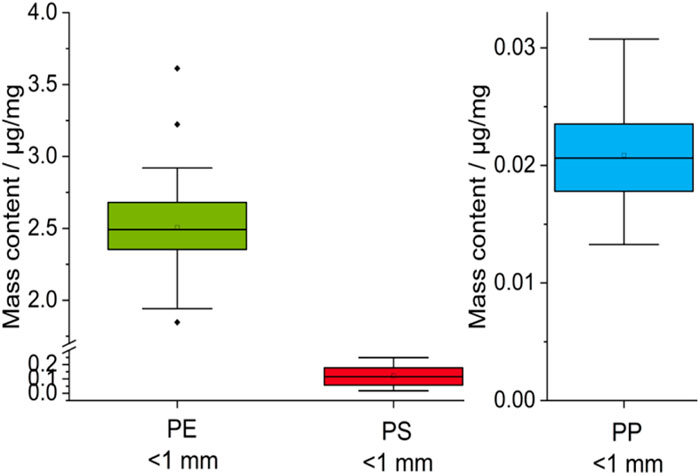
FIGURE 8. Boxplot diagrams of the mass contents of PE, PP, PS.
PE, PP, and PS show strong similarity of mean and median, suggesting symmetric data distribution. PE further shows a modal value of 2.4 μg/mg, which is close to the median and mean value and additionally indicates an unimodal distribution. In combination with the low standard deviation, the results show a high reproducibility of the PE mass contents in all samples and for each of three marker components used for quantification. A high reproducibility can also be seen for PP and PS. The higher standard deviation compared to PE could be related to the lower contents of PS and PP. Thus, the standard deviation increases from ∼7% to 18%, but in the same course the masses also decrease by a factor of 100. A possible explanation for this could be a decreasing particle number, which leads to a less homogeneous distribution in the sample compared to PE.
4 Conclusion
The identification of different types of plastics and their quantification in compost samples by TED-GC/MS was successfully carried out, as well as the determination of large MP by ATR-FTIR. Especially the inhomogeneities of the coarse fractions, proved the importance of a good sample homogenization. Due to the inorganic mineral content, homogeneity is preferably done with density separation, as mechanical homogenization through grinding can lead to wear of the grinding tool. In addition, this results in an enrichment of the plastics in the organic-rich floated phase, which leads to a more intensive signal of the polymer-specific decomposition gases. Density separation is performed with a saturated NaI solution, since density separation using NaCl is not sufficient. It is likely that existing agglomerates between plastic particles and environmental matrix cannot be dissolved under the conditions of NaCl solution due to too low density, so the resulting plastic content in the flotate is significantly lower than in samples prepared using NaI. A reduction of the organics by means of a H2O2 pretreatment is not necessary for the measurement by TED-GC/MS and can potentially lead to an oxidative damage of the contained plastics and thus change the result. For these reasons, this procedure is not used, because a reduction of mineral components is more useful for plastic detection, than oxidative reduction of organic matrix contents.
The prepared analytical samples are characterized by a high homogeneity, which is reflected in almost congruent TGA curves. The TED-GC/MS achieved a high degree of reproducibility, which is evident in a low standard deviation of the total content of 7% (<1 mm), respectively. In addition, the qualitative composition of the polymer types (PE, PP, PS, SBR) is detected in all analysis samples and reproducible mass contents for the individual polymers are also achieved. PE represents the dominant polymer, accounting for 85% of the total plastic content and is consistent with the investigations of the coarse fractions, in which PE also dominated. This value is similar to other soil-relevant investigations (Scheuer and Bigalke, 2018). The quantity of large MP strongly depends on the particle numbers of the several plastic types.
The detection of MP in composts shows that compost contains MP and hence, could be a possible transport pathway into terrestrial ecosystems. However, the investigation of plastic impurities >1 mm, according to the DÜMV and the EU fertilising products and amending regulations are insufficient, to describe the real plastic contents in compost. High amounts of plastic contents are additionally visible in the fine fractions.
Data availability statement
The raw data supporting the conclusion of this article will be made available by the authors, without undue reservation.
Author contributions
YW: Writing–original draft, Data curation, Methodology. MB: Writing–original draft, Data curation, Methodology, Visualization. UB: Conceptualization, Project administration, Writing–review and editing. CB: Conceptualization, Project administration, Writing–review and editing. MR: Conceptualization, Data curation, Writing–review and editing. KA: Writing–original draft, Conceptualization.
Funding
The authors declare financial support was received for the research, authorship, and/or publication of this article. Federal Ministry of Education and Research (BMBF) Project: Development of New Plastics for a Clean Environment by Determining Relevant Entry Points (ENSURE) Funding Number: 02WPL1449A-G.
Acknowledgments
The authors acknowledge financial support from the German Federal Ministry of Education and Research (BMBF) within the project ENSURE (funding number 02WPL1449A-G). We would also like to thank the Federal Environment Agency (UBA), here personally Volker Weiss and Tim Hermann, for the very helpful discussion on content. We are also grateful for the opportunity to sample the compost plant and for the friendly and competent cooperation with the plant operators.
Conflict of interest
The authors declare that the research was conducted in the absence of any commercial or financial relationships that could be construed as a potential conflict of interest.
Publisher’s note
All claims expressed in this article are solely those of the authors and do not necessarily represent those of their affiliated organizations, or those of the publisher, the editors and the reviewers. Any product that may be evaluated in this article, or claim that may be made by its manufacturer, is not guaranteed or endorsed by the publisher.
References
Al-Azzawi, M. S. M., Kefer, S., Weißer, J., Reichel, J., Schwaller, C., Glas, K., et al. (2020). Validation of sample preparation methods for microplastic analysis in wastewater matrices—reproducibility and standardization. Water 12, 2445. doi:10.3390/w12092445
Bannick, C. G., Szewzyk, R., Ricking, M., Schniegler, S., Obermaier, N., Barthel, A. K., et al. (2019). Development and testing of a fractionated filtration for sampling of microplastics in water. Water Res. 149, 650–658. doi:10.1016/j.watres.2018.10.045
Becker, R., Altmann, K., Sommerfeld, T., and Braun, U. (2020). Quantification of microplastics in a freshwater suspended organic matter using different thermoanalytical methods – outcome of an interlaboratory comparison. J. Anal. Appl. Pyrolysis 148, 104829. doi:10.1016/j.jaap.2020.104829
BMUV (2021). bmuv. Available at: https://www.bmuv.de/fileadmin/Daten_BMU/Download_PDF/Glaeserne_Gesetze/19._Lp/bioabfallvo/Stellungnahmen/Stellungnahmen_Verbaende/bioabfallvo_stn_bgk_bf.pdf (Accessed February 24, 2021).
Bundesgütegemeinschaft Kompost (2016). Methodenbuch zur Analyse organischer Düngemittel, Bodenverbesserungsmittel und Substrate. Bundesgütegemeinschaft Kompost. e.V.5. Aufl.
Constant, M., Billon, G., Breton, N., and Alary, C. (2021). Extraction of microplastics from sediment matrices: experimental comparative analysis. J. Hazard. Mater. 420, 126571. doi:10.1016/j.jhazmat.2021.126571
Duemichen, E., Eisentraut, P., Celina, M., and Braun, U. (2019). Automated thermal extraction-desorption gas chromatography mass spectrometry: a multifunctional tool for comprehensive characterization of polymers and their degradation products. J. Chromatogr. A 1592, 133–142. doi:10.1016/j.chroma.2019.01.033
DüMV (2023). Verordnung über das Inverkehrbringen von Düngemitteln, Bodenhilfsstoffen, Kultursubstraten und Pflanzenhilfsmitteln1 (Düngemittelverordnung - DüMV). Available at: https://www.gesetze-im-internet.de/d_mv_2012/D%C3%BCMV.pdf (Accessed July 21, 2023).
DüngMProbV (2023). Verordnung über Probenahmeverfahren und Analysemethoden für die amtliche Düngemittelüberwachung (Düngemittel-Probenahmeund Analyseverordnung). Available at: https://www.gesetze-im-internet.de/d_ngmprobv/DüngMProbV.pdf (Accessed July 21, 2023).
Eisentraut, P., Dümichen, E., Ruhl, A. S., Jekel, M., Albrecht, M., Gehde, M., et al. (2018). Two birds with one stone—fast and simultaneous analysis of microplastics: microparticles derived from thermoplastics and tire wear. Environ. Sci. Technol. Lett. 5 (10), 608–613. doi:10.1021/acs.estlett.8b00446
Federal Environment Agency (2022). umweltbundesamt. Available at: https://www.umweltbundesamt.de/daten/ressourcen-abfall/verwertung-entsorgung-ausgewaehlter-abfallarten/bioabfaelle#bioabfalle-gute-qualitat-ist-voraussetzung-fur-eine-hochwertige-verwertung.
Gašparovič, L., Koreňová, Z., and Jelemenský, L. (2010). Kinetic study of wood chips decomposition by TGA. Chem. Pap. 64 (2), 174–181. doi:10.2478/s11696-009-0109-4
Gui, J., Sun, Y., Wang, J., Chen, X., Zhang, S., and Wu, D. (2021). Microplastics in composting of rural domestic waste: abundance, characteristics, and release from the surface of macroplastics. Environ. Pollut. 274, 116553. doi:10.1016/j.envpol.2021.116553
Hale, R. C., Seeley, M. E., La Guardia, M. J., Mai, L., and Zeng, E. Y. (2020). A global perspective on microplastics. J. Geophys. Research:Oceans 125, e2018JC01471. doi:10.1029/2018JC014719
He, D., Luo, Y., Lu, S., Liu, M., Song, Y., and Lei, L. (2018). Microplastics in soils: analytical methods, pollution characteristics and ecological risks. TRAC-Trends Anal. Chem. 109, 163–172. doi:10.1016/j.trac.2018.10.006
Hidalgo-Ruz, V., Gutow, L., Thompson, R. C., and Thiel, M. (2012). Microplastics in the marine environment: a review of the methods used for identification and quantification. Environ. Sci. Technol. 46 (6), 3060–3075. doi:10.1021/es2031505
Horton, A. A., Walton, A., Spurgeon, D. J., Lahive, E., and Svendsen, C. (2017). Microplastics in freshwater and terrestrial environments: evaluating the current understanding to identify the knowledge gaps and future research priorities. Sci. Total Environ. 586, 127–141. doi:10.1016/j.scitotenv.2017.01.190
ISO (2020). ISO/TR 21960:2020, Plastics — environmental aspects — State of knowledge and methodologies (ISO/TR 21960:2020).
Kremer, I., Tomić, T., Katančić, Z., Hrnjak-Murgić, Z., Erceg, M., and Schneider, D. R. (2021). Catalytic decomposition and kinetic study of mixed plastic waste. Clean. Techn Environ. Policy 23, 811–827. doi:10.1007/s10098-020-01930-y
Ländergemeinschaft Abfall (LAGA) (2001). “LAGA PN 98 Richtlinie für das Vorgehen bei physikalischen, chemischen und biologischen Untersuchungen im Zusammenhang mit der Verwertung/Beseitigung von Abfällen,” in Ministerium für Umwelt und Forsten Rheinland-Pfalz (Ländergemeinschaft Abfall LAGA).
Lwanga, E. H., Beriot, N., Corradini, F., Silva, V., Yang, X., Baartman, J., et al. (2022). Review of microplastic sources, transport pathways and correlations with other soil stressors: a journey from agricultural sites into the environment. Chem. Biol. Technol. Agric. 9, 20. doi:10.1186/s40538-021-00278-9
Mansa, R., and Zhou, S. (2021). Thermogravimetric analysis of microplastics: a mini review. Environ. Adv. 5, 100117. doi:10.1016/j.envadv.2021.100117
Müller, Y. K., Wernicke, T., Pittroff, M., Witzig, C. S., Storck, F. R., Klinger, J., et al. (2019). Microplastic analysis—are we measuring the same? Results on the first global comparative study for microplastic analysis in a water sample. Anal. Bioanal. Chem. 412, 555–560. doi:10.1007/s00216-019-02311-1
Ortiz, D., Munoz, M., Nieto-Sandoval, J., Romera-Castillo, C., de Pedro, Z. M., and Casas, J. A. (2022). Insights into the degradation of microplastics by Fenton oxidation: from surface modification to mineralization. Chemosphere 309, 136809. Part 2. doi:10.1016/j.chemosphere.2022.136809
Rios Mendoza, L. M., Vargas, D. L., and Balcer, M. (2021). Microplastics occurrence and fate in the environment. Curr. Opin. Green Sustain. Chem. 32, 100523. doi:10.1016/j.cogsc.2021.100523
Ruggero, F., Gori, R., and Lubello, C. (2020). Methodologies for microplastics recovery and identification in heterogeneous solid matrices: a review. J. Polym. Environ. 28, 739–748. doi:10.1007/s10924-019-01644-3
Scheuer, M., and Bigalke, M. (2018). Microplastics in Swiss floodplain soils. Environ. Sci. Technol. 52 (6), 3591–3598. doi:10.1021/acs.est.7b06003
Sholokhova, A., Ceponkus, J., Sablinskas, V., and Denafas, G. (2021b). Abundance and characteristics of microplastics in treated organic wastes of Kaunas and Alytus regional waste management centres, Lithuania. Environ. Sci. Pollut. Res. 29, 20665–20674. doi:10.1007/s11356-021-17378-6
Sholokhova, A., Denafas, G., and Mykhaylenko, V. (2021a). The organic output from mechanical–biological treatment plants as a source of microplastics: mini-review on current knowledge, research methodology and future study perspectives. Waste Manag. Res. 39 (5), 652–663. doi:10.1177/0734242x20983914
van Schothorst, B., Beriot, N., Lwanga, E. H., and Geissen, V. (2021). Sources of light density microplastic related to two agricultural practices: the use of compost and plastic mulch. Environments 8, 3. doi:10.3390/environments8040036
VDLUFA (2000). VERBAND DEUTSCHER LANDWIRTSCHAFTLICHER UNTERSUCHUNGS- UND FORSCHUNGSANSTALTEN METHODENBUCH Band II.2 Die Untersuchung von Sekundärrohstoffdüngern, Kultursubstraten und Bodenhilfsstoffen, 1. Auflage. VDLUFA-Verlag Darmstadt.
Keywords: microplastics, compost, TED-GC/MS, mass content, soil, fertilizer, monitoring
Citation: Wiesner Y, Bednarz M, Braun U, Bannick CG, Ricking M and Altmann K (2023) A promising approach to monitor microplastic masses in composts. Front. Environ. Chem. 4:1281558. doi: 10.3389/fenvc.2023.1281558
Received: 23 August 2023; Accepted: 10 October 2023;
Published: 24 October 2023.
Edited by:
Naser A. Anjum, Aligarh Muslim University, IndiaReviewed by:
Fabiana Corami, National Research Council (CNR), ItalyVictoria Salvadó, University of Girona, Spain
Copyright © 2023 Wiesner, Bednarz, Braun, Bannick, Ricking and Altmann. This is an open-access article distributed under the terms of the Creative Commons Attribution License (CC BY). The use, distribution or reproduction in other forums is permitted, provided the original author(s) and the copyright owner(s) are credited and that the original publication in this journal is cited, in accordance with accepted academic practice. No use, distribution or reproduction is permitted which does not comply with these terms.
*Correspondence: Yosri Wiesner, eW9zcmkud2llc25lckBiYW0uZGU=; Marius Bednarz, bWFyaXVzLmJlZG5hcnpAdWJhLmRl
†These authors have contributed equally to this work