 Jaycie M. Montney
 Sebastian A. Flores
 Matthew J. Fhaner
- University of Michigan-Flint, Department of Natural Sciences, Flint, MI, United States
Electrochemical methods, specifically square wave voltammetry (SWV) offer fast, portable, and quantitative screening for antioxidant levels and lipid degradation in consumer products. Initial studies within our research group utilized benzene as the non-polar component in solvent systems utilized for analysis. In order to explore additional applications of SWV, less hazardous solvent systems that maintain or improve on previous figures of merit for analytes of interest are necessary. To this extent, ethanol was selected as the polar solvent under the 7th principle of green chemistry (use of renewable feedstocks). To replace our non-polar species (benzene), four solvent candidates were identified under the 5th principle of green chemistry (safer solvents and auxiliaries) including diethyl ether, acetonitrile, isopropyl alcohol, and ethyl acetate. Each solvent was investigated on its own, and then in varying combinations of v/v ratios with ethanol. Each solvent combination was used to investigate the limit of detection, lower limit of quantitation, sensitivity, and linearity of previously studied antioxidants butylated hydroxytoluene, sesamol, and rosemary extract. Each antioxidant was found to yield improved figures of merit depending on the solvent combination tested. After comparing all antioxidant figures of merit, it was found that 50%–50% ethanol—acetonitrile and 50%–50% ethanol—ethyl acetate were within the top five solvent systems for all antioxidants tested, providing a more green alternative to benzene solvent systems.
1 Introduction
In recent years, consumer habits have trended towards products that are less influenced by synthetic additives and unnecessary chemical byproducts (Maruyama et al., 2021; Montemurro et al., 2021). This shift has led to increased research interests in natural antioxidants (Frankel et al., 1996; Wasowicz et al., 2004; Hwang et al., 2012) providing consumers with products that are viewed as more healthy. (Mitterer-Daltoѐ et al., 2021). Additionally, identifying more effective natural antioxidants can reduce harmful byproducts (Martínez, Penci, Ixtaina, Ribotta and Maestri, 2013; Sekhon-Loodu, Warnakulasuriya, Rupasinghe and Shahidi, 2013; Fhaner, Hwang, Winkler-Moser, Bakota and Liu, 2016). To this extent, the ability to obtain quantitative and qualitative information regarding antioxidants, along with other important components such as omega-3/6 fatty acids, has become increasingly important to thoroughly assess their protective effects. A variety of options exist for investigating antioxidants, however electrochemical methods have garnered interest in the last decade due to their unique combination of qualitative and quantitative abilities in addition to being cost effective, fast, and providing nM-µM detection limits (Lin et al., 2013; Ng et al., 2017; Yilmaz et al., 2018).
Previous work in our group assessed voltammetric methods for quantifying and qualifying antioxidant species in real-world samples (Lubcekyj et al., 2017; Keene et al., 2019). However, previous work relied on solvent systems which contained benzene as the non-polar solvent component. In order to fully explore the applications beyond the laboratory, it became necessary to identify solvent systems that were less hazardous using previously characterized specieies including sesamol, butylated hydroxytoluene (BHT), and rosemary extract (RE). In order to guide the identification of solvent options, the 12 principles of green chemistry (Jessop et al., 2009) were used as a framework for considering what types of solvents would be less hazardous and more green than the benzene system previously used.
Within the 12 principles of green chemistry, two specific principles were identified as closely related to the goals of the proposed work. Using the principle of safer solvents and auxiliaries (Principle 5), acetonitrile, ethyl acetate, ethyl ether, and isopropanol were identified as potential replacements for the non-polar component of the initial system, benzene. While the proposed studies were limited to organic solvents in an effort to promptly identify replacements for methanol and benzene, emerging opportunities in the fields of deep eutectic solvents (DESs) (Wawoczny and Gillner, 2023) and ionic liquids (ILs) (Ren et al., 2020) could provide the next-generation of solvents for enhancing the safety and sustainability of these types of experiments. Proposed solvents must pose less severe health hazards as compared to benzene which has both cancer and genetic defect risks (Paustenbach et al., 1993). While all chemicals have an inherent level of risk, the proposed solvents represent a lower category of overall risk compared to benzene. Acetonitrile is flammable (Category 2) and poses health risks such as acute oral and dermal toxicity (Category 4) and eye damage/irritation (Category 2) (Fisher Scientific, 2021a). Hazards for ethyl acetate, ethyl ether, and isopropyl alcohol have similar hazard levels as acetonitrile, which are generally similar or lower in category risk compared to benzene (Fisher Scientific, 2021b; Fisher Scientific, 2021c; Fischer Scientific, 2021d). The only instance where a proposed solvent has a higher category risk compared to benzene is the flammability of ethyl ether, which has a category 1 classification as compared to benzene being classified as a category 2 substance.
Furthermore, the identified solvents are recognized as less hazardous solvents in consumer product applications. Ethyl acetate and isopropyl alcohol are both generally recognized as safe (GRAS) solvents and have been used in the food applications previously (Gonçalves et al., 2015, Johnson et al., 1997). Acetonitrile and ethyl ether are both considered class 2 and class 3 solvents, respectively, in pharmaceutical products under the Food and Drug Administration Q3C guidelines. Under this classification, acetonitrile is limited to 410 ppm/day while ethyl ether, ethanol, ethyl acetate, and isopropyl alcohol, are all considered class 3 solvents and are recommended to limits of 5,000 ppm/day. While it is universally understood that all proposed solvents pose some level of human risk, the proposed solvents are currently used within the production of consumer products and are considered safer than benzene, which is listed as a Class 1; to be avoided and not exceed 2 ppm/day within the Q3C guidelines.
The second green chemistry principle that utilized is the “use of renewable feedstocks” (Principle 7). Previous work in our group used methanol as the polar component of the solvent system. Although methanol is a GRAS solvent, it is primarily produced through fossil fuel sources. Renewable production of methanol is currently available, however the scale is not able to compete with the production of methanol from traditional fossil fuel sources (Roode-Gutzmer et al., 2019). Another GRAS solvent, ethanol, has increased accessibility as a renewable solvent compared to methanol. Ethanol can be produced from a variety of sources including sugars, starches, and cellulose feedstocks (Kumar et al., 2010). This diversity of raw materials, in addition to the existing infrastructure for converting biomass to bio-ethanol and low cost, position ethanol as a more readily available renewable feedstock as compared to other sustainable solvents at the moment, although that may change in the future.
The purpose of this work was to evaluate various solvent combinations via figures of merit obtained from generating calibration plots including analytical sensitivity (A/µM), coefficient of determination (R2), limit of detection (LOD), and lower limit of quantitation (LLOQ) for the antioxidants BHT), sesamol, and RE. These target molecules were selected as they are well studied in the literature and our research group has experience with voltammetric analysis of them. Each antioxidant was tested at 100% v/v ratios of pure solvent except for ethyl ether due to its volatility with our supporting electrolyte, which was 0.24 M sulfuric acid. Additionally, each antioxidant was tested in mixtures of acetonitrile, isopropyl alcohol, ethyl ether, and ethyl acetate at 1:3, 1:1, and 3:1 v/v ratios with ethanol. Of all solvent systems tested, only 50%–50% ethanol-acetonitrile and 50%–50% ethanol-ethyl acetate were within the lowest four LLOQ values for all three antioxidant species.
2 Materials and methods
2.1 Materials and reagents
2-propanol (ACS Plus; A416-4), ethyl ether anhydrous (ACS Grade; E138-1), acetonitrile (HPLC Grade; A998-4), ethyl acetate (HPLC Grade; E195-4), ethanol (200 proof; 04-355-451), and sulfuric acid (96.5% w/w; LC255501) were all purchased from Fischer Scientific. Butylated hydroxytoluene (99%; PHR1117-1G) and sesamol (98%; S3003-5G-A) were purchased from Sigma Aldrich. Rosemary extract was obtained from Kemin Industries (ROSEEN Liquid; S015604). A potentiostat and software for recording square wave voltammograms (CHI660E) were purchased from CH Instruments. Additionally, a glassy-carbon working electrode (CHI104), silver silver-chloride reference electrode (CHI111), platinum wire counter electrode (CHI115) electrode polishing kit (CHI120), and Picoamp Booster faraday cage (CHI200) were also purchased from CH Instruments.
2.2 Electrochemical analysis
Square wave voltammograms of sesamol, BHT, and RE were collected in varying solvent compositions ranging from pure solvent (100%) to volume per volume (v/v) ratios of polar and non-polar solvents (25%–75%, 50%–50%, and 75%–25%). Sulfuric acid was used as the supporting electrolyte for all solvent combinations such that the final concentration of sulfuric acid in each solvent system was 0.24 M. Prior to recording voltammograms, the glass-carbon working electrode was polished for 60 s using a 1.0 micron MicroPolish Powder slurry (CH Instruments) on a polishing pad by rotating the electrode in clockwise and counterclockwise patterns every 10 s. The glassy-carbon working electrode was rinsed with deionized water, and then all electrodes were soaked in the solvent system to be tested for 10 min. Background voltammograms were collected from 0.0 V to 1.5 V with the following experimental conditions:
step increment: 0.004 V
step amplitude: 0.005 V
frequency: 2 Hz
A quiet time of 2 s was employed prior to each voltammogram being collected. Background scans were collected and reviewed until there was no observable change in current signals between voltammograms. Depending on the specific analytical sensitivity of an antioxidant within a given solvent system, standards were prepared between 5 μM and 150 µM. Linear ranges for each antioxidant-solvent pairing can be found in the Supplementary Material. Each antioxidant standard was measured in quadruplicate. Prior to moving onto the next higher antioxidant standard concentration, all electrodes were again soaked in the solvent and a voltammogram was collected to ensure no analyte oxidation signal was observed. This process was repeated until a minimum of five different concentrations were analyzed for figures of merit analysis.
2.3 Determination of figures of merit
Calibration plots were generated for each antioxidant-solvent combination and can be found in the Supplementary Material. The analytical sensitivity for each calibration plot was assessed similarly to previous studies via linear regression analysis (Lubcekyj et al., 2017). Briefly, the LOD (Eq. 1), and LLOQ (Eq. 2) were calculated using the standard deviation for the peak current signals of the lowest standard concentration “s” and the slope of the best-fit line linear regression analysis “m.” The R2 value was obtained via linear regression analysis for each calibration plot and the analytical sensitivity for each calibration was obtained via the slope “m”.
2.4 Statistical analysis
Peak currents were obtained via the CH Instrument software using a Gaussian peak definition. When necessary, oxidation peaks were manually identified by extending the baseline past the oxidation peak. The average oxidation peak current for each antioxidant at a given concentration was plotted to generate calibration plots. Error bars for each data point presented in the calibration plots represent the standard error of the mean for the quadruplicate measurements of a given standard concentration.
3 Results
3.1 Qualitative analysis of square wave voltammograms
Initially, antioxidants were analyzed in 100% v/v solutions for each solvent proposed, except for ethyl ether due to safety concerns. Figure 1 details 100 µM sesamol, BHT, and RE voltammograms in 100% ethanol (A), isopropyl alcohol (B), acetonitrile (C), and ethyl acetate (D), respectively. It is worth noting that no antioxidant species produced analytical signal in 100% ethyl acetate. Sesamol produced a single oxidation peak in ethanol (−0.780 V), acetonitrile (−0.910 V), and isopropyl alcohol (−0.770 V). BHT also produced a single oxidation peak in ethanol (−0.970 V), acetonitrile (−1.150 V), and isopropyl alcohol (−0.980 V). RE yielded varying numbers and differentiation for oxidation peaks depending on the solvent used. In 100% ethanol, RE produced four distinct peaks, with three producing calibration plots (−0.630 V, −0.910 V, and −1.200 V). In 100% acetonitrile and isopropyl alcohol, RE produced a single peak that yielded calibration data (acetonitrile: −0.970 V; isopropyl alcohol: −0.740 V). The differences in oxidation peak number and definition observed RE in each solvent tested can be explained by the multiple components that make up this antioxidant extract. Rosemary extract is known to contain a number of compounds with antioxidant properties, including rosmarinic acid, carnosic acid, carnosol, rosmanol, flavonoids, and other phenolic compounds. (Žegura et al., 2011). Therefore, the studies in pure solvent suggest that the solubility of several compounds within RE are closer to that of ethanol, as witnessed by the improved peak definition as compared with other solvents such as 100% acetonitrile and isopropyl alcohol in Figures 1C, D.
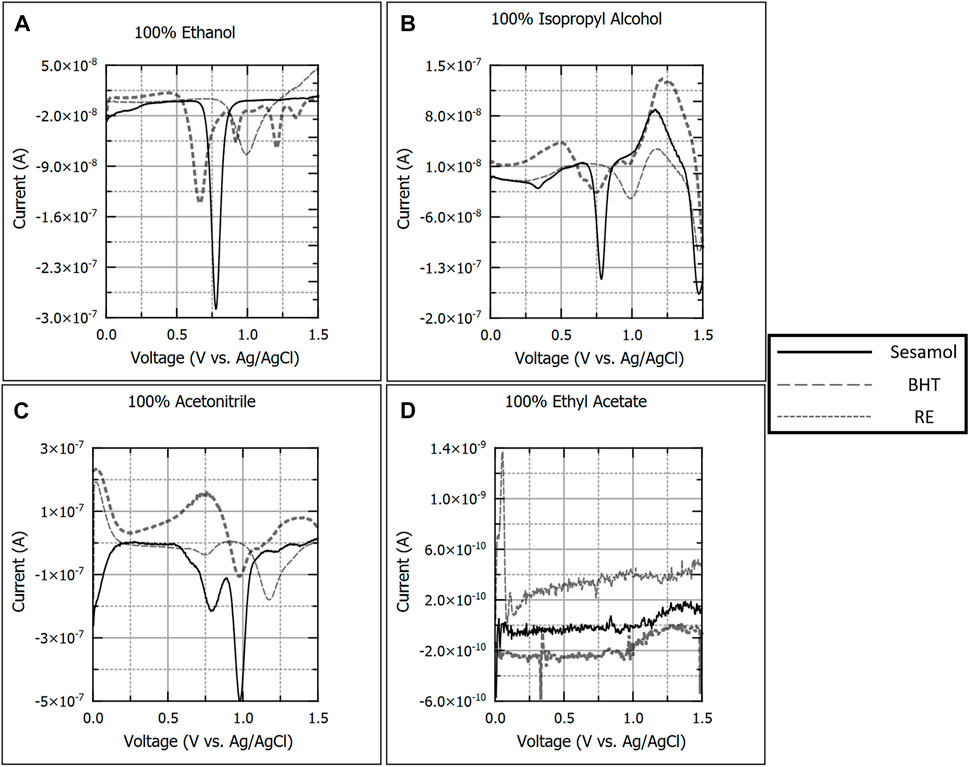
FIGURE 1. Background subtracted square wave voltammograms of 100 µM sesamol, butylated hydroxytoluene, and rosemary extract in 100% ethanol (A), isopropyl alcohol (B), acetonitrile (C), and ethyl acetate (D). Each voltammogram is presented as current (A) versus applied potential to the working electrode (V vs. Ag/AgCl).
Of the pure solvents investigated, ethanol produced the lowest background signal over the widest potential window, as can be observed in the 100% ethanol voltammogram for 100 µM sesamol in Figure 1A. Acetonitrile yielded a solvent oxidation peak near 0.75 V, which is undesirable for an analytical solvent system as it can interfere with oxidation peaks from our analytes. As noted earlier, 100% ethyl acetate did not yield any oxidation peaks for any antioxidants. This could be due to interactions between the dilute sulfuric and ethyl acetate which are known to react and form form ethanoic acid and ethanol. Since sulfuric acid acts as the supporting electrolyte in our solvent, a decrease in concentration will result in a decrease in solution conductivity. However, this would require further investigations to verify.
In addition to pure solvents, ethanol was paired with acetonitrile, isopropyl alcohol, ethyl acetate, and ethyl ether in varying ratios. Figure 2 details 100 µM sesamol, BHT, and RE in ethanol-acetonitrile (EtOH-Ace) solvents. Solvent composition was varied between 75% and 25% v/v (Figure 2A), 50%–50% (Figure 2B) v/v, and 25%–75% v/v EtOH-Ace (Figure 2C). Sesamol (−0.770 V) and BHT (−1.050 V) produced a single oxidation peak in all EtOH-Ace solvent combinations. RE produced three distinct peaks (−0.690 V, −0.960 V, −1.240 V) that yielded calibration curves across all EtOH-Ace solvent combinations. Varying the solvent composition had no impact on the number of oxidation peaks observed for each antioxidant. However, varying the solvent composition shifted oxidation peak potentials positive for each antioxidant.
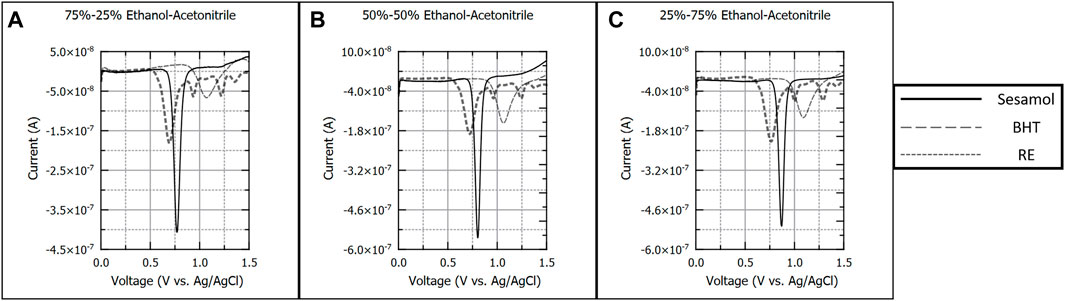
FIGURE 2. Background subtracted square wave voltammograms of 100 µM sesamol, butylated hydroxytoluene, and rosemary extract in 75%–25% (A), 50%–50%, (B), and 25%–75% (C) v/v ratios of ethanol and acetonitrile. Each voltammogram is presented as current (A) versus applied potential to the working electrode (V vs. Ag/AgCl).
Of the three solvent combinations presented in Figure 2, all combinations allowed for successful determination of figures of merit for each antioxidant. Additionally, the oxidation peak observed for 100% acetonitrile near 0.750 V was not observed in the 25%–75% EtOH-Ace solvent combination, suggesting that any of the ratios would be appropriate for BHT analysis.
Figures 3A–C details 100 µM sesamol, BHT, and RE in ethanol-isopropyl alcohol (EtOH-IPA) solvents. Solvent compositions were varied in the same ratios as EtOH-Ace studies. Sesamol (−0.740 V) and BHT (−0.950 V) produced a single oxidation peak in all EtOH-IPA solvent combinations. RE only yielded two distinct peaks (−0.640 V, −0.930 V) that generated calibration curves across all EtOH-IPA solvent combinations. Similarly, to EtOH-Ace, varying the solvent composition had no impact on the number of oxidation peaks observed for each antioxidant, although the oxidation potential for individual peaks shifted more positive as the percentage of IPA in the combination was increased. BHT and RE yielded a lower analytical signal than the EtOH-Ace solvent combinations, however calibration and subsequent determination of figures of merit were possible for all EtOH-IPA solvent combinations presented in Figure 3.
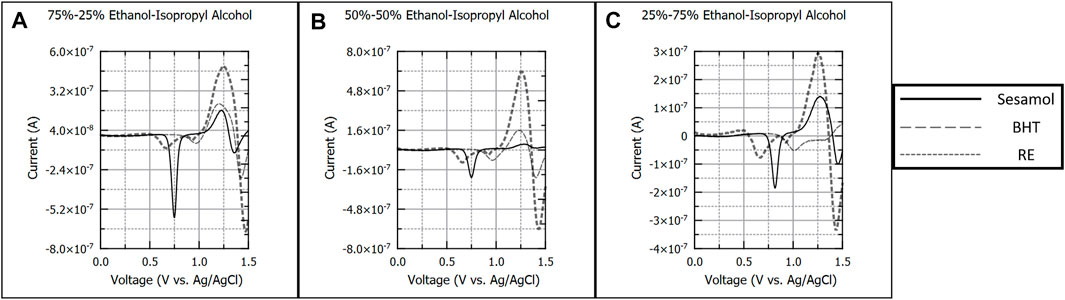
FIGURE 3. Background subtracted square wave voltammograms of 100 µM sesamol, butylated hydroxytoluene, and rosemary extract in 75%–25% (A), 50%–50%, (B), and 25%–75% (C) v/v ratios of ethanol and isopropyl alcohol. Each voltammogram is presented as current (A) versus applied potential to the working electrode (V vs. Ag/AgCl).
EtOH-IPA solvent combinations produced less defined peaks for BHT and RE as compared to the EtOH-Ace system. The poor peak resolution was not expected given the fact that EtOH and IPA have the most similar relative polarity values of all solvent combinations tested. (Reichardt and Welton, 2010). Previous studies provide insights into the possible explanations for this observation. A study investigating the radical scavenging capacity of antioxidants in various solvents found that BHT had poor antioxidant capacity in both EtOH and IPA compared to other antioxidant specifies (La et al., 2021). Additionally, Chang observed that BHT has lower solubility in IPA relative to EtOH (Chang and Maurey, 1985). There is also previous evidence that IPA may be a poor solvent for RE analysis. Zhang et al. observed that carnosol, a major component of RE, degraded to epirosmanol ethyl ether in the presence of IPA (Zhang et al., 2012). The poor experimental results combined with literature review suggests that IPA is not a suitable candidate as a replacement for the non-polar component of a greener solvent system.
Figures 4A–C presents 100 µM sesamol, BHT, and RE in ethanol-ethyl acetate (EtOH-EA) solvents. While pure ethyl acetate proved to be a poor solvent for antioxidant analysis, the goal of this study was to assess the range of combinations between a polar solvent (ethanol) and other less polar solvents such as ethyl acetate. Thus, solvent compositions were varied in the same ratios as EtOH-Ace studies. Again, a single oxidation peak was observed for sesamol (−0.800 V) and BHT (−1.05 V) respectively. RE produced four distinct peaks (−0.600, −0.900, −1.180, and −1.330 V) in 75%–25%, with each peak yielding a calibration curve. As the ratio of ethyl acetate increased, the individual oxidation peak definition decreased as observed in 50%–50% and 25%–75% EtOH-EA respectively. This resulted in a more convoluted calibration for 50%–50% and 25%–75% EtOH-EA, albeit determination of figures of merit was still possible.
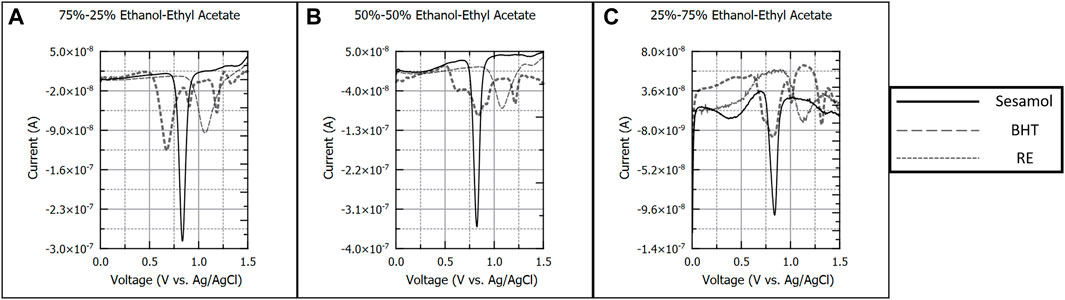
FIGURE 4. Background subtracted square wave voltammograms of 100 µM sesamol, butylated hydroxytoluene, and rosemary extract in 75%–25% (A), 50%–50%, (B), and 25%–75% (C) v/v ratios of ethanol and ethyl acetate. Each voltammogram is presented as current (A) versus applied potential to the working electrode (V vs. Ag/AgCl).
As the percentage of EA was increased, the analytical signal of all antioxidant systems decreased, with RE and BHT experiencing more pronounced impacts than sesamol. Sesamol and BHT exhibited roughly a 53% decrease in analytical signal between 75% and 25% EtOH-EA and 25%–75% EtOH-EA (Supplementary Data S1). RE peaks varied in how solvent ratio impacted peak intensity and separation. RE oxidation peaks observed in 75%–25% EtOH-EA from 0.500 to 1.200 V suffered from poor resolution and decreasing analytical signal as the amount of EA was increased. However, the peak near 1.300 V was not adversely impacted by the change in solvent ratio producing an increase in analytical signal at 25%–75% EtOH-EA compared to 75%–25% EtOH-EA.
Figure 5 presents 100 µM sesamol, BHT, and RE in ethanol-ethyl ether (EtOH-EE) solvents. Antioxidant species were analyzed in solvent compositions of 75%–25% (Figure 5A) and 50%–50% (Figure 5B) EtOH-EE only. Solvent compositions of 25%–75% EtOH-EE and pure EE were not investigated due to flammability hazards. Results mirrored EtOH-Ace solvent systems, with a single oxidation peak for sesamol (−0.800 V) and BHT (−0.980 V) respectively. RE again produced four distinct peaks (−0.640, −0.900, −1.20, and −1.315 V) in 75%–25% EtOH-EE, with each peak yielding a calibration curve. As the ratio of ethyl ether increased, the peak potentials for all species shifted slightly positive.
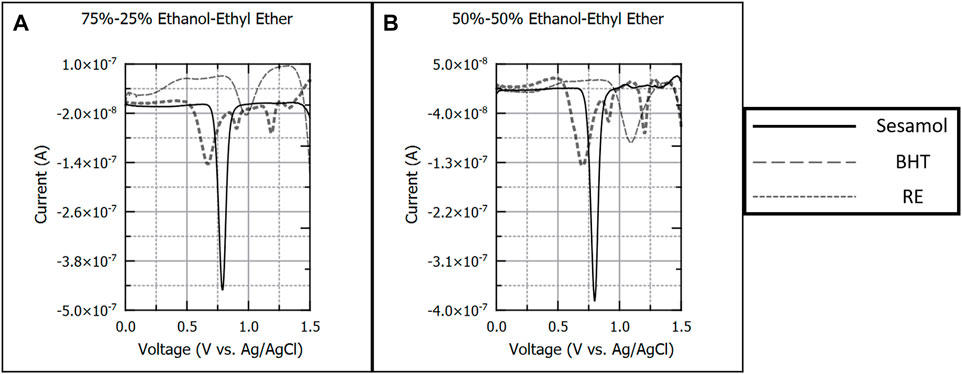
FIGURE 5. Background subtracted square wave voltammograms of 100 µM sesamol, butylated hydroxytoluene, and rosemary extract in 75%–25% (A) and 50%–50%, (B) v/v ratios of ethanol and ethyl ether. Each voltammogram is presented as current (A) versus applied potential to the working electrode (V vs. Ag/AgCl).
3.2 Antioxidant figures of merit
Figures of merit including calibration sensitivity, coefficients of determination, LODs, and LLOQs are provided in Tables 1, 2, 3 for individual antioxidant species in all solvent systems tested. Figures of merit should be conexturalized with previously published values obtained using the methanol-benzene solvent system. (Keene et al., 2019). In the methanol-benzene solvent, sesamol produced a LOD of 2.64 µM, LLOQ of 8.80 µM, coefficient of determination of 0.9835, and sensitivity of −3.07*10–9 A/µM. As outlined in Table 1, all solvent systems except 100% Ace yielded lower LOD and LLOQ than the methanol-benzene system previously utilized for sesamol. The solvent systems with the lowest four LLOQ values were used to compare figures of merit across antioxidants investigated in this study. For Sesamol (Table 1), the lowest four LLOQ values were all below 1 µM and included 50%–50% EtOH-EA (0.873 µM), 100% Ethanol (0.780 µM), 25%–75% EtOH-Ace (0.680 µM), and 50%–50% EtOH-Ace (0.570 µM). Furthermore, sensitivity and coefficient of determinations for each of the four identifies solvents were comparable or higher than the same values obtained for methanol-benzene.
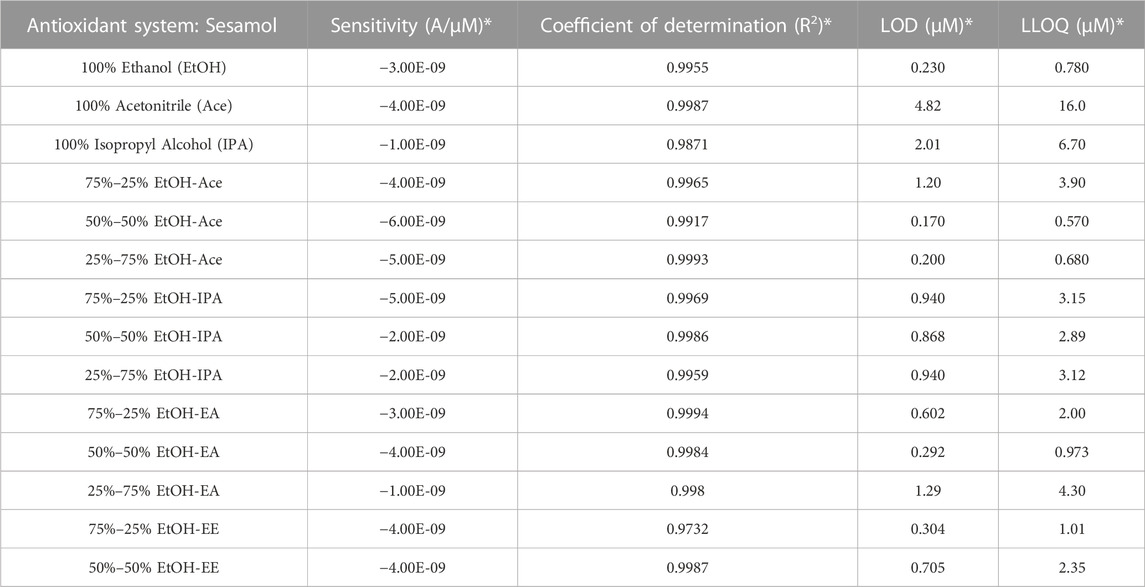
TABLE 1. Overview of figures of merit for sesamol in each solvent. 100% Ethyl Ether was not tested due to safety concerns and 100% Ethyl Acetate produced no observable signal (Figure 1). Sensitivity (Slope), Coefficient of determination (R2 Value), Limits of Detection (LOD), and Lower Limits of Quantitation (LLOQ) for calibration curves of 5–100 µM Sesamol in each solvent listed. * Figures of merit correlate to the oxidation peak identified for each individual calibration curve presented in the supplemental materials section.
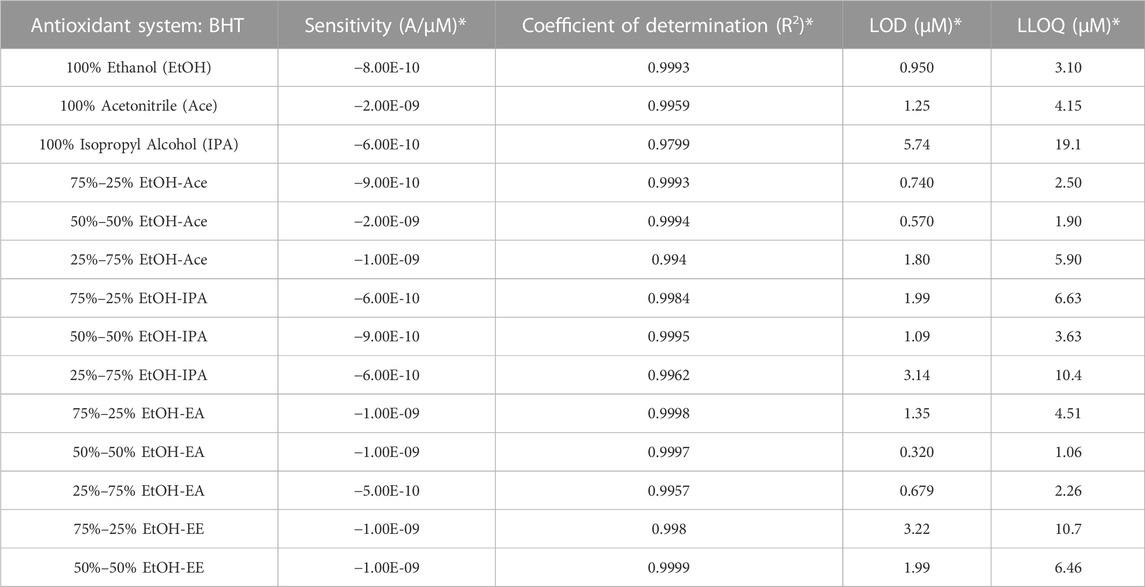
TABLE 2. Overview of figures of merit for butylated hydroxytoluene in each solvent. 100% Ethyl Ether was not tested due to safety concerns and 100% Ethyl Acetate produced no observable signal (Figure 1). Sensitivity (Slope), Coefficient of determination (R2 Value), Limits of Detection (LOD), and Lower Limits of Quantitation (LLOQ) for calibration curves of 5µM–150 µM BHT in each solvent listed. * Figures of merit correlate to the oxidation peak identified for each individual calibration curve presented in the supplemental materials section.
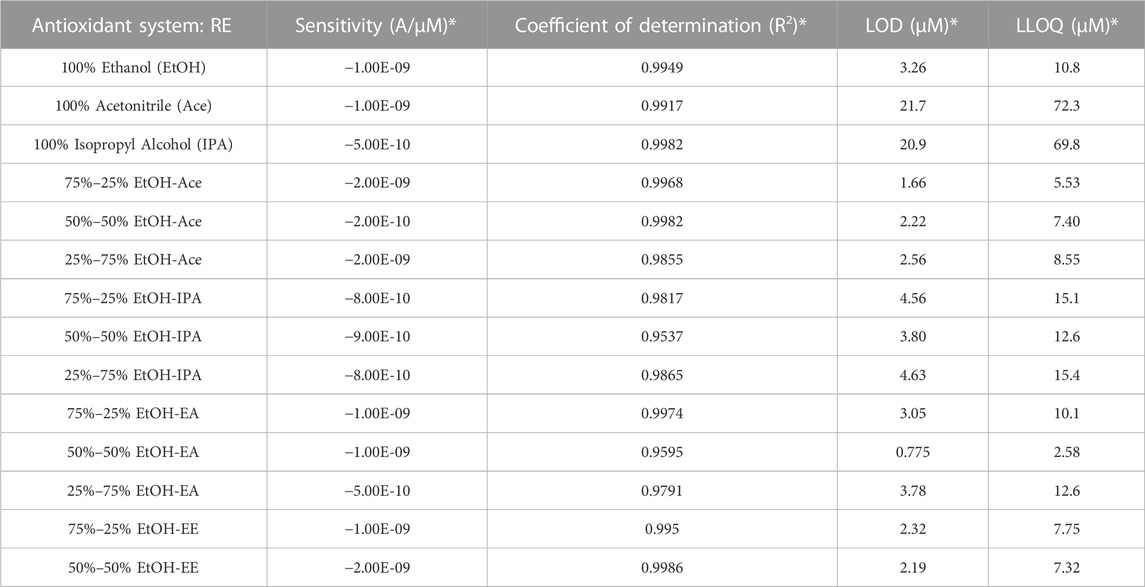
TABLE 3. Overview of figures of merit for rosemary extract in each solvent. 100% Ethyl Ether was not tested due to safety concerns and 100% Ethyl Acetate produced no observable signal (Figure 1). Sensitivity (Slope), Coefficient of determination (R2 Value), Limits of Detection (LOD), and Lower Limits of Quantitation (LLOQ) for calibration curves of 5µM–150 µM SRE in each solvent listed. * Figures of merit correlate to the oxidation peak identified for each individual calibration curve presented in the supplemental materials section.
BHT (Table 2) produced slightly higher LLOQ values compared to sesamol. This is most likely due to the increased steric interference to electron transfer from the molecule to the electrode, causing BHT to have lower sensitivity values on average as compared to sesamol. In methanol-benzene, BHT produced a LOD of 6.26 µM, LLOQ of 20.87 µM, coefficient of determination of 0.9858, and sensitivity of −6.93*10–10 A/µM. The four lowest LLOQ values obtained for BHT were all 2.50 µM or lower and included 75%–25% EtOH-Ace (2.50 µM), 25%–75% EtOH-EA (2.26 µM), 50%–50% EtOH-Ace (1.90 µM), and 50%–50% EtOH-EA (1.06 µM). Similar to sesamol, all systems resulted in comparable or higher sensitivity and coefficient of determination values than methanol-benzene except for 25%–75% EtOH-EA, which had a lower sensitivity at −5.00*10–10. Regardless, with lower LLOQ values and comparable results for the remaining figures of merit, all four of the systems highlighted would be acceptable for future BHT analysis.
Finally, RE (Table 3) resulted in the highest LLOQ values of the antioxidants tested. This is not surprising, given the complexity of electroactive compounds within RE. In methanol-benzene, RE yielded a LOD of 74.77 µM, LLOQ of 249.26 µM, coefficient of determination of 0.9688, and sensitivity of −3.03*10–10 A/µM. All solvent systems investigated in this study yielded lower LOD and LLOQ values than the methanol-benzene system. The four lowest LLOQ values obtained for RE were all below 7.50 µM and included 50%–50% EtOH-Ace (7.40 µM), 50%–50% EtOH-EE (7.32 µM), 75%–25% EtOH-Ace (5.53 µM), and 50%–50% EtOH-EA (2.58 µM). Similar to RE and sesamol, sensitivity and coefficients of determination were comparable or higher in the four lowest LLOQ solvent systems as compared to methanol-benzene except for two instances. First, the sensitivity for 50%–50% EtOH-Ace was −2.00*10–10, where the sensitivity for methanol-benzene was at −3.03*10–10. Additionally, the coefficient of determination for 50%–50% EtOH-EA was 0.9595, which was lower than the 0.9688 obtained for methanol-benzene.
Figure 6 provides examples of calibration curves for each antioxidant in the solvent system that yielded the lowest limits of detection. Calibration curves for all solvent combinations for each antioxidant can be found in the Supplementary Data S1. Only 50%–50% EtOH-Ace and 50%–50% EtOH-EA were common between all antioxidant species. The 50%–50% EtOH-Ace provided superior figures of merit for sesamol. 50%–50% EtOH-EA provided superior figures of merit for both BHT and RE. Given the higher sensitivity and stronger analytical signal that sesamol yields as compared to BHT and RE, EtOH-EA is the best candidate as a green solvent system.
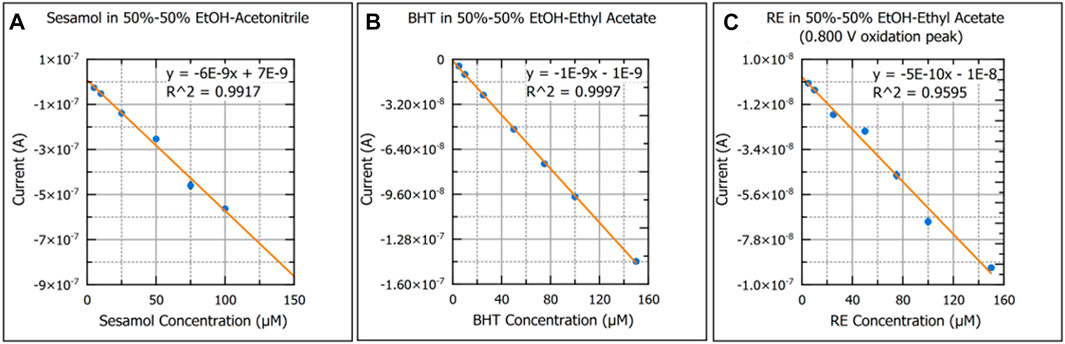
FIGURE 6. Calibration curves of sesamol in 50%–50% ethanol-acetonitrile (A), butylated hydroxytoluene in 50%–50% ethanol-ethyl acetate (B), and rosemary extract in 50%–50% ethanol-ethyl acetate (C) are presented. Standard error of the mean was used for y-axis error bars for each plot point. A linear regression best-fit-line and coefficient of determination are provided for each plot.
4 Discussion
The goal of this work was to identify less hazardous solvent options for the analysis of food quality, via the model systems of sesamol, BHT, and RE. To this end, EtOH-EA was identified as the most versatile solvent system for the three antioxidants tested. Compared to the previous methanol-benzene system, EtOH-EA yielded a 10-fold decrease in LLOQ for sesamol, a 19-fold decrease in LLOQ for BHT, and a 96-fold decrease in LLOQ for RE. Additionally, EA is currently used in a variety of consumer products applications and is a GRAS solvent, making it a greener choice than benzene.
Limits of detection reported in this work compare well with other reported methods in the literature. A 2023 study by Smarzewka et al. using SWV on a modified guanine-glass carbon working electrode obtained a 0.15 µM LOD. (Smarzewska et al., 2023). A 2022 review of various methods for detecting BHT highlights that hyphenated techniques such as LC-MS/MS, GC-FID, and HPLC-DAD produce superior LOD values for BHT in edible oils compared to these studies. However, a SWV method yielded LOD values between 0.04–0.08 µM using a modified glassy carbon electrode. (Gonçalves-Filho and De Souza, 2022). Finally, a 2022 study of rosmarinic acid analysis via an ionic liquid modified electrode provides an overview of various detection limits in the literature. Rosmarinic detection limits for ranged from 14 nM to 700 nM depending on the electrode and method utilized. (Wang et al., 2022). The results presented in this study are similar to those reported with the advantages of uncomplicated sample preparation and not requiring electrode modifications.
In addition to identifying new solvents, it was observed that the oxidation peak potentials generally shifted towards more positive potentials as the solvent composition became increasingly non-polar. Using the EtOH-Ace results as an example, in Figure 1, the oxidation peak potential of sesamol is observed at 0.770 V for 75%–25% EtOH-Ace, 0.790 V for 50%–50% EtOH-Ace, and 0.860 V EtOH-Ace. The exact explanation for the increase in peak oxidation was not investigated here as it is outside the scope of this study, however, two potentials explanations are proposed. One explanation is that over time, antioxidant species adsorb to the electrode surface. When this occurs, the electrode requires an overpotential to complete electron transfer, (Bard and Faulkner, 2001), which would manifest itself as a more positive oxidation peak potential as larger amounts of the analyte adsorb onto the electrode surface. This is unlikely since electrodes were soaked in solvent between each new standard concentration and voltammograms were collected to ensure no oxidation events were present.
Another possible explanation is that the change in solvent composition affects the polarity or the pH of the solvent. Changes in pH are positively correlated with increases in the oxidation/reduction potential for a species. Additionally, differences in mobility between ethanol and acetonitrile could create a junction potential in the solution. Acetonitrile has a larger diffusion coefficient (in water) compared to ethanol. (Haynes et al., 2014). It is reasonable to conclude that slight differences in solubility and mobility of sulfuric acid between ethanol and acetonitrile could create a junction potential in the solution resulting in a more positive potential at the electrode surface to be required in order to promote analyte oxidation. Regardless of the exact explanation of the oxidation peak potential shift, the variations over the time required to collect a series of calibration standard voltammograms was minimal (−0.01–0.07 V) and could be corrected using mathematical modeling.
This work provides a meaningful path forward for moving square wave voltammetric methods into novel industry applications. Our previous methods relying on benzene and methanol limited our applications to laboratory analyses. The findings from this work provide solvents systems that can more readily used around consumer products and pose less hazards to analysts. Thus, it is possible to work with restaurant and snack-food industry partners to explore new applications of square wave voltammetry as part of their quality assurance and control practices. For example, square wave voltammetry could be used to monitor the concentrations of antioxidants in products over time, yielding information that would allow for more precise modeling of antioxidant degradation in various foods. Additionally, these methods could be move directly on-site to restaurants as a way of monitoring relevant electroactive components in foods, such as omega 3/6 fatty acids in frying oils. Using the principles of green chemistry, it is possible to explore novel opportunities for assessing the healthfulness and quality of the products we interact with every day.
Data availability statement
The original contributions presented in the study are included in the article/Supplementary Material, further inquiries can be directed to the corresponding author.
Author contributions
A-RS (undergraduate student) helped compile the list of possible solvent options for investigation, in addition to collecting preliminary data to determine the viability of the study. JM (undergraduate student) led the majority of data collection. SF (undergraduate student) supported data collection and led the majority of data analysis. MF (Associate Professor) oversaw all areas of student contributions in addition to writing and submitting the manuscript. All authors contributed to the article and approved the submitted version.
Funding
The authors would like to thank the University of Michigan-Flint Office of Research and Economic Development for providing stipends to support student research through the Undergraduate Research Opportunity Program and the Summer Undergraduate Research Experience program.
Acknowledgments
The authors would like to thank undergraduate students Alice Chapin, Christian Cleis, Charlea Mossner, Sharvari Pathak who participated in supporting a portion of these studies. The authors would also like to thank Dr. Cassie Fhaner and Dr. Jessica Tischler for providing valuable feedback during the revision process for this manuscript.
Conflict of interest
The authors declare that the research was conducted in the absence of any commercial or financial relationships that could be construed as a potential conflict of interest.
Publisher’s note
All claims expressed in this article are solely those of the authors and do not necessarily represent those of their affiliated organizations, or those of the publisher, the editors and the reviewers. Any product that may be evaluated in this article, or claim that may be made by its manufacturer, is not guaranteed or endorsed by the publisher.
Supplementary material
The Supplementary Material for this article can be found online at: https://www.frontiersin.org/articles/10.3389/fenvc.2023.1226960/full#supplementary-material
References
Bard, A. J., and Faulkner, L. R. (2001). Electrochemical methods: Fundamentals and applications. 2nd Ed., Hoboken, New Jersey, United States: John Wiley and Sons.
Chang, S. S., and Maurey, J. R. (1985). Solubilities of BHT in various solvents. J. Chem. Eng. Data 30 (4), 384–387. doi:10.1021/je00042a006
Fhaner, M., Hwang, H.-S., Winkler-Moser, J. K., Bakota, E. L., and Liu, S. X. (2016). Protection of fish oil from oxidation with sesamol. Eur. J. Lipid Sci. Technol. 118 (6), 885–897. doi:10.1002/ejlt.201500185
Fischer Science, (2021c). Ethyl ether; MSDS. https://beta-static.fishersci.com/content/dam/fishersci/en_US/documents/programs/education/regulatory-documents/sds/chemicals/chemicals-e/S25903.pdf.
Fischer Scientific, (2021d). Isopropyl alcohol; MSDS. https://www.fishersci.com/msdsproxy%3FproductName%3DA426P4%26productDescription%3D2-PROPANOL%2BHISTO%2B4L%2BPOLY%26catNo%3DA426P-4%2B%26vendorId%3DVN00033897%26storeId%.
Fisher Scientific, (2021a). Acetonitrile MSDS. https://www.fishersci.ca/store/msds?partNumber=A9981&countryCode=CA&language=en.
Fisher Scientific, (2021b). Ethyl acetate; MSDS. https://beta-static.fishersci.com/content/dam/fishersci/en_US/documents/programs/education/regulatory-documents/sds/chemicals/chemicals-e/S25305.pdf.
Frankel, E. N., Shu-Wen Huang, E. P., Robert, A., and Aeschbach, R. (1996). Evaluation of antioxidant activity of rosemary extracts, carnosol and carnosic acid in bulk vegetable oils and fish oil and their emulsions. J. Sci. Food Agric. 72 (2), 201–208. doi:10.1002/(sici)1097-0010(199610)72:2<201:aid-jsfa632>3.0.co;2-q
Gonçalves, V. S. S., Rodríguez-Rojo, S., De Paz, E., Mato, C., Martín, T., and Cocero, M. J. (2015). Production of water soluble quercetin formulations by pressurized ethyl acetate-in-water emulsion technique using natural origin surfactants. Food Hydrocoll. 51, 295–304. doi:10.1016/j.foodhyd.2015.05.006
Gonçalves-Filho, D., and De Souza, D. (2022). Detection of synthetic antioxidants: What factors affect the efficiency in the chromatographic analysis and in the electrochemical analysis? Molecules 27 (20), 7137. doi:10.3390/molecules27207137
Haynes, W. M., Lide, D. R., and Bruno, T. J. (2014). CRC handbook of chemistry and physics. Boca Raton, Florida, United States: CRC Press.
Hwang, H. S., Winkler-Moser, J. K., and Liu, S. X. (2012). Structural effect of lignans and sesamol on polymerization of soybean oil at frying temperature. JAOCS, J. Am. Oil Chemists’ Soc. 89 (6), 1067–1076. doi:10.1007/s11746-011-1994-6
Jessop, P. G., Trakhtenberg, S., and Warner, J. (2009). The twelve principles of green chemistry. ACS Symp. Ser. 1000, 401–436. doi:10.1021/bk-2009-1000.ch012
Keene, K. A., Ruddy, R. M., and Fhaner, M. J. (2019). Investigating the relationship between antioxidants and fatty acid degradation using a combination approach of GC-FID and square-wave voltammetry. ACS Omega 4, 983–991. doi:10.1021/acsomega.8b02275
Kumar, S., Singh, N., and Prasad, R. (2010). Anhydrous ethanol: A renewable source of energy. Renew. Sustain. Energy Rev. 14 (7), 1830–1844. doi:10.1016/j.rser.2010.03.015
La, J. W., Kim, M. J., and Lee, J. H. (2021). Evaluation of solvent effects on the DPPH reactivity for determining the antioxidant activity in oil matrix. Food Sci. Biotechnol. 30 (3), 367–375. doi:10.1007/s10068-020-00874-9
Lin, X., Ni, Y., and Kokot, S. (2013). Glassy carbon electrodes modified with gold nanoparticles for the simultaneous determination of three food antioxidants. Anal. Chim. Acta 765, 54–62. doi:10.1016/j.aca.2012.12.036
Lubcekyj, R. A., Winkler-Moser, J. K., and Fhaner, M. J. (2017). Application of differential pulse voltammetry to determine the efficiency of stripping tocopherols from commercial fish oil. J. Am. Oil Chemists’ Soc. 94 (4), 527–536. doi:10.1007/s11746-017-2968-0
Martínez, M. L., Penci, M. C., Ixtaina, V., Ribotta, P. D., and Maestri, D. (2013). Effect of natural and synthetic antioxidants on the oxidative stability of walnut oil under different storage conditions. LWT - Food Sci. Technol. 51 (1), 44–50. doi:10.1016/j.lwt.2012.10.021
Maruyama, S., Streletskaya, N. A., and Lim, J. (2021). Clean label: Why this ingredient but not that one? Food Qual. Prefer. 87, 104062. doi:10.1016/j.foodqual.2020.104062
Mitterer-Daltoé, M., Bordim, J., Lise, C., Breda, L., Casagrande, M., and Lima, V. (2021). Consumer awareness of food antioxidants. Synthetic vs. Natural. Food Sci. Technol. 41 (1), 208–212. doi:10.1590/fst.15120
Montemurro, M., Pontonio, E., and Rizzello, C. G. (2021). Design of a “clean-label” gluten-free bread to meet consumers demand. Roods 10, 462. doi:10.3390/foods10020462
Ng, K. L., Tan, G. H., and Khor, S. M. (2017). Graphite nanocomposites sensor for multiplex detection of antioxidants in food. Food Chem. 237, 912–920. doi:10.1016/j.foodchem.2017.06.029
Paustenbach, D. J., Bass, R. D., and Price, P. (1993). Benzene toxicity and risk assessment, 1972-1992: Implications for future regulation. Environ. Health Perspect. 101 (Suppl. 6), 177–200. doi:10.1289/ehp.93101s6177
Reichardt, C., and Welton, T. (2010). Solvents and solvent effects in organic chemistry. Hoboken, New Jersey, United States: Wiley. doi:10.1002/9783527632220
Ren, F., Wang, J., Xie, F., Zan, K., Wang, S., and Wang, S. (2020). Applications of ionic liquids in starch chemistry: A review. Green Chem. 22 (7), 2162–2183. doi:10.1039/c9gc03738a
Roode-Gutzmer, Q. I., Kaiser, D., and Bertau, M. (2019). Renewable methanol synthesis. ChemBioEng Rev. 6 (6), 209–236. doi:10.1002/cben.201900012
Sekhon-Loodu, S., Warnakulasuriya, S. N., Rupasinghe, H. P. V., and Shahidi, F. (2013). Antioxidant ability of fractionated apple peel phenolics to inhibit fish oil oxidation. Food Chem. 140 (1–2), 189–196. doi:10.1016/j.foodchem.2013.02.040
Smarzewska, S., Guziejewski, D., Ullah, N., and Koszelska, K. (2023). Electrochemical evaluation of free radical scavenging activity of sesamol. J. Electrochem. Soc. 170 (5), 055502. doi:10.1149/1945-7111/acd1b9
Wang, K., Cui, X., Zheng, Y., Liu, B., Sang, H., and Dong, R. (2022). Electrochemical determination of rosmarinic acid in edible flowers using ionic liquid modified electrode. Int. J. Electrochem. Sci. 17 (12), 221284. doi:10.20964/2022.12.113
Wasowicz, E., Gramza, A., Hes, M., Malecka, M., and Jelen, H. H. (2004). Oxidation of lipids in food systems. Pol. J. Food Nutr. Sci. 13 (54), 87–100.
Wawoczny, A., and Gillner, D. (2023). The most potent natural pharmaceuticals, cosmetics, and food ingredients isolated from plants with deep eutectic solvents. J. Agric. Food Chem. 151. doi:10.1021/acs.jafc.3c01656
Yilmaz, Ü. T., Calik, E., Akdulum, B., and Yilmaz, H. (2018). Determination of carnosic acid in Rosmarinus officinalis L. using square wave voltammetry and electrochemical behavior. J. Food Drug Analysis 26 (1), 300–308. doi:10.1016/j.jfda.2017.04.004
Žegura, B., Dobnik, D., Niderl, M. H., and Filipič, M. (2011). Antioxidant and antigenotoxic effects of rosemary (Rosmarinus officinalis L) extracts in Salmonella typhimurium TA98 and HepG2 cells. Environ. Toxicol. Pharmacol. 32 (2), 296–305. doi:10.1016/j.etap.2011.06.002
Keywords: natural antioxidants, electrochemistry, lipid oxidation, green solvents, functional foods
Citation: Montney JM, Siddiqui A-R, Flores SA and Fhaner MJ (2023) Identifying greener solvents for square wave voltammetry applications in functional food analysis. Front. Environ. Chem. 4:1226960. doi: 10.3389/fenvc.2023.1226960
Received: 23 May 2023; Accepted: 25 July 2023;
Published: 03 August 2023.
Edited by:
Maryam Arabi, Yantai Institute of Coastal Zone Research (CAS), ChinaReviewed by:
Alen Albreht, National Institute of Chemistry, SloveniaSarfaraz Mahesar, University of Sindh, Pakistan
Ebrahim Naghian, Islamic Azad University South Tehran Branch, Iran
Copyright © 2023 Montney, Siddiqui, Flores and Fhaner. This is an open-access article distributed under the terms of the Creative Commons Attribution License (CC BY). The use, distribution or reproduction in other forums is permitted, provided the original author(s) and the copyright owner(s) are credited and that the original publication in this journal is cited, in accordance with accepted academic practice. No use, distribution or reproduction is permitted which does not comply with these terms.
*Correspondence: Matthew J. Fhaner, ZmhhbmVyQHVtaWNoLmVkdQ==