 John Ovie Olomukoro1Nwamaka Ogochukwu Obi-Obueze1Rukeme Eko-Imirianye1
 Osikemekha Anthony Anani2*Victoria Obot1
- 1Department of Animal and Environmental Biology, University of Benin, Benin City, Nigeria
- 2Laboratory of Ecotoxicology and Forensic Biology, Department of Biological Science, Faculty of Science, Edo State University Uzairue, Auchi, Nigeria
The preliminary consequence of pollutants in water is to reduce the quality of water although this may not be immediately noticeable because of the self-purifying ability of some water bodies. The study on the physicochemical characteristics, bacteriological, and macrobenthic invertebrates was carried out in the Orogodo River. All the examined physicochemical characteristics of the water showed no significant difference (p > 0.05) across the stations. For the heavy metals, it was in decreasing order as follows: station 2 > station 3 > station 1. All the heavy metals except nickel had high values upstream (station 1). Bacteriological examination of the water revealed the presence of mesophilic bacteria across the stations at p < 0.01 (a highly significant difference). E. coli varied significantly (p < 0.01) across the stations. However, a further evaluation using the DMR test revealed that the population recorded at station 3 was significantly higher than that recorded at stations 1 and 2. A total of 787 macrobenthic invertebrates comprising 44 macroinvertebrates’ taxa were recorded. Most of the macrobenthic faunas observed were distributed across the three stations except the chironomids, the rat-tailed maggot (Eristalis tenax), and the family Hirudinea whose occurrence was almost restricted to station 2. This revealed an ecological impact because this species is a basic indicator of an ecosystem sentinel. Sorenson’s quotient of faunal similarity showed that macrobenthic fauna at these three stations was similar. The similarity was the highest between stations 1 and 3 (75.0%) and the lowest between stations 1 and 2 (50.0%). The biological monitoring working party (BMWP) score system showed that station 2 was moderately polluted, while stations 1 and 3 were only slightly affected. At stations 1, 2, and 3, the arithmetic WQI (water quality) values were 900.99, 1010.10, and 951.20, respectively. The high values of WQI obtained across the stations were attributable to the concentrations of Fe, Cu, Cr, Cd, Ni, Pb, V, and THC, thus reiterating the conclusion drawn from the physicochemical parameter analysis. Boiling the water before consumption is highly recommended to avoid possible human health problems, especially effects from microbial pathogens like coliforms and E. coli.
1 Introduction
Freshwater ecosystems are an important hub in the cycling of nutrients and energy which are of ecological value to different food chain strata or trophic faunas depending on their basic need(s) and habits (Anani et al., 2020b; Liu et al., 2020; Keke et al., 2021b). They are also a basic source of ecosystem services and goods like food, nursery grounds for aquatic and terrestrial faunas, recreational activities, navigation, and domestic and water supply for humans (Berger et al., 2016; Nguyen et al., 2018; Anani and Olomukoro, 2021; Tampo et al., 2021).
However, in the past years, it has been in the ecological spotlight that anthropogenic activities like the use of herbicides and pesticides in farming, road construction, and wastes from industries, a consequence of urbanization, have greatly impacted the life-forms in aquatic systems, leading to their death, distribution, and dispersal depending on the level of the pollutants (Dickens et al., 2002; Anani et al., 2020a; Keke et al., 2021a).
So it is pertinent to carry out an assessment of water that has been perceived to be polluted by various human activities to determine its integrity and safeguard the ecosystem of living biotas. Hence, several scientists have employed different forms of assessments to monitor aquatic ecosystems with considerable levels of pollution (Kaizer and Osakwe, 2010; Ahmad et al., 2012; Dami et al., 2012; Anani and Olomukoro, 2018; Olomukoro and Anani, 2019; Olatunji and Anani, 2020).
The bacteriological and physicochemical contents of water bodies have been employed by Isobe et al. (2004), Dami et al. (2012), Enerijiofi et al. (2018), and Olatunji and Anani, (2020) to characterize the quality of different water sources. The findings from their studies showed that E. coli, Klebsiella, Salmonella, and Bacillus individually were the causative pathogens of poor water quality. Boiling the water and treating individuals infected by these microbes with strong antibiotics were highly recommended.
Again, benthic macroinvertebrates, often referred to as bottom fauna or macrobenthos, are an extremely important part of river ecosystems. They are associated with or live in the bottom of woods, vegetation, stones, the root system of mangrove trees, canoes, boats, sediments, streams, seas, rivers, ponds, and lakes (Olomukoro and Egborge, 2003). Examples of such organisms are Mollusca, Crustacea, Polychaeta, and insects (Olomukoro and Anani, 2019). Olomukoro and Egborge (2003) and Olomukoro and Anani, (2019) revealed that these benthos or benthic macroinvertebrates are perfect biological indicators of a perturbed ecosystem and are highly recommended for water quality management.
So the benthic macroinvertebrate community plays an important role in ecosystem services by transferring nutrients into the food chain and as ecological pointers to a depleted water system and species. However, the biotic fauna distributions and diversities are keenly influenced by the fluctuation of biotic and abiotic features like physical commotion, depth, photosynthesis, salinity, temperature, the form of the sediment, and species–species interaction within the aquatic terrain (Olomukoro and Azubuike, 2009; Arslan et al., 2016; Olomukoro and Anani, 2019).
This study deployed the application of chemical, physical, microbiological, and benthic macroinvertebrates as an indicator for water quality evaluation of the Orogodo River in sub-Saharan Africa. This ensured that SDG (Sustainable Development Goal) 6 (clean water and sanitation) and SDG 14 (life below water) as established by the 2015 UN (United Nations) General Meeting on “sustainable management of sanitation and water for all” have been attained. It ensures that human activities (chemicals from wastes and pollutants) disposed into river bodies from source and non-source points do not compromise the 6th and 14th goals with respect to life, earth, and all the biodiversity therein.
2 Materials and methods
2.1 Study area
The Orogodo River is the main source of water for different communities (Mbiri, Owa Nta, Agbor Nta, Agbor, and Abavo) in Delta State, Nigeria. It lies or flanked at latitudes (5° 43′N and 5° 30′N) and longitudes (6°20′E and 6° 12′E), respectively, as shown in Figure 1. The source of the river is from an elevation of about 150 m above the sea level at Mbiri. The river flows from its source and meets the Ethiope River at a community called Urhuoka in Abraka, Delta State. The climatic season is dry (November–March) and wet (April–October) year in and year out.
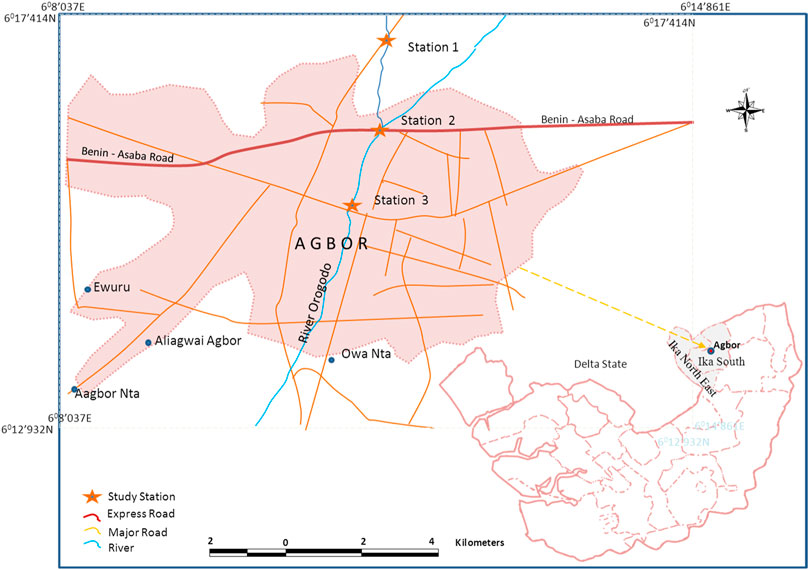
FIGURE 1. Map of the study area showing the sampled stations.
Station 1 is sited at latitude 6°16.775′N and longitude 6°11.626′E upstream of the waste outfall point. The water channel here is narrow, relatively shallow (mean water depth of 0.50 m), and has a noticeably slow flow rate (8.33 cm/s to 80.90 cm/s).
Station 2 is sited at latitude 6°16.019′N and longitude 6° 11.594′E. Waste water is drained directly into the stream here through the drainage channeled directly into the river. The average water depth is 0.52 m and has a flow rate between 28.30 and 117.20 cm/s.
Station 3 is sited downstream about 1 km from station 2 along with the transient with latitude and longitude of 6°15.307′N and 6° 11.295′E, respectively. The substratum is predominantly sand and a little clayey. Station 3 has a flow rate between 27.00 and 77.30 cm/s and is rather shallow with an average depth of water (0.38 m).
2.2 Sampling
Sampling was carried out monthly between the months of April and December 2011. Three stations were selected within 5 km along the stretch of the river bed.
Sampling was carried out between 08:00 and 11:00 h for each sampling regime day, beginning at stations 1, 2, and 3 and following the same order. Samples of water were collected in 1-L plastic containers for the analysis of their physicochemical properties. The samples were labeled according to the stations collected prior to collection. For the analysis of the heavy metals, samples were collected and preserved with HNO3 (nitric acid) (Anani et al., 2020b). Samples for dissolved oxygen (DO) and biochemical oxygen demand (BOD5) determination were collected and corked underwater (to prevent air bubbles from being trapped in the bottle and also to prevent atmospheric air from entering the bottle) in pre-washed 250-ml transparent and amber-colored glass bottles, respectively. Samples for the determination of dissolved oxygen (DO) were fixed with Winkler’s solutions A and B, while the samples for the determination of biochemical oxygen demand were not fixed (Anani et al., 2020b). Sterile universal bottles were used to collect water samples from each station for microbial analysis. The media utilized for the bacteriological examination of the surface water include EMBA (eosin methylene blue agar), MB (MacConkey broth), NA (nutrient agar), and PCB (plate count agar) (Olatunji and Anani, 2020). The prepared media were weighed-out following the specifications of the manufacturers. The plate count technique was utilized for this study. This gives a better view of the growing colonies of the bacteria so that they can be counted (Enerijiofi et al., 2018). Macrobenthic fauna was collected by sampling the river substratum using an Eckman grab manufactured by HYDRO-BIOS recommended for shallow soft bottom sediment sampling (Olomukoro and Anani, 2019).
2.3 Biotic indices of water quality
The modified biological monitoring working party (Paisley et al., 2014; Arslan et al., 2016), the average score per taxon (ASPT) National Biological Survey (Arslan et al., 2016), and the Lincoln quality index (LQI) as described by Krisanti et al. (2017) were used to estimate the water quality with the aid of macroinvertebrates. The water quality index (WQI), proposed by Cude (2001) and modified by Anani and Olomukoro (2021), was used to characterize the integrity of the river water with the aid of physicochemical parameters. The water status by Ramakrishniah et al. (2009) and Abbasnia et al. (2018), as modified by Anani and Olomukoro (2021), was used to categorize the surface water integrity in this study.
2.4 Data analysis
The average physicochemical properties of the surface water and the microbial content for the three stations were compared using the one-way ANOVA (analysis of variance) set at p < 0.05. When there is a significant difference, a DMR (Duncan multiple range) post hoc test, was employed. This was carried out using version 16.0 of SPSS (SPSS Inc, 2007). The dominant and sub-dominant groups were determined using the system proposed by Slack et al. (1979).
3 Results
3.1 Results of the physicochemical characteristics of the Orogodo River, Agbor
Table 1 shows the summary of the physicochemical parameters of water sourced from the three designated stations at the Orogodo River, Agbor. From the results, the highest mean (9.06 NTU) of turbidity was found in station 3, while the lowest (5.20 NTU) was in station 1 at p > 0.05. The range of values was 2.80–40.10 NTU and 1.20–10.00 NTU, respectively.
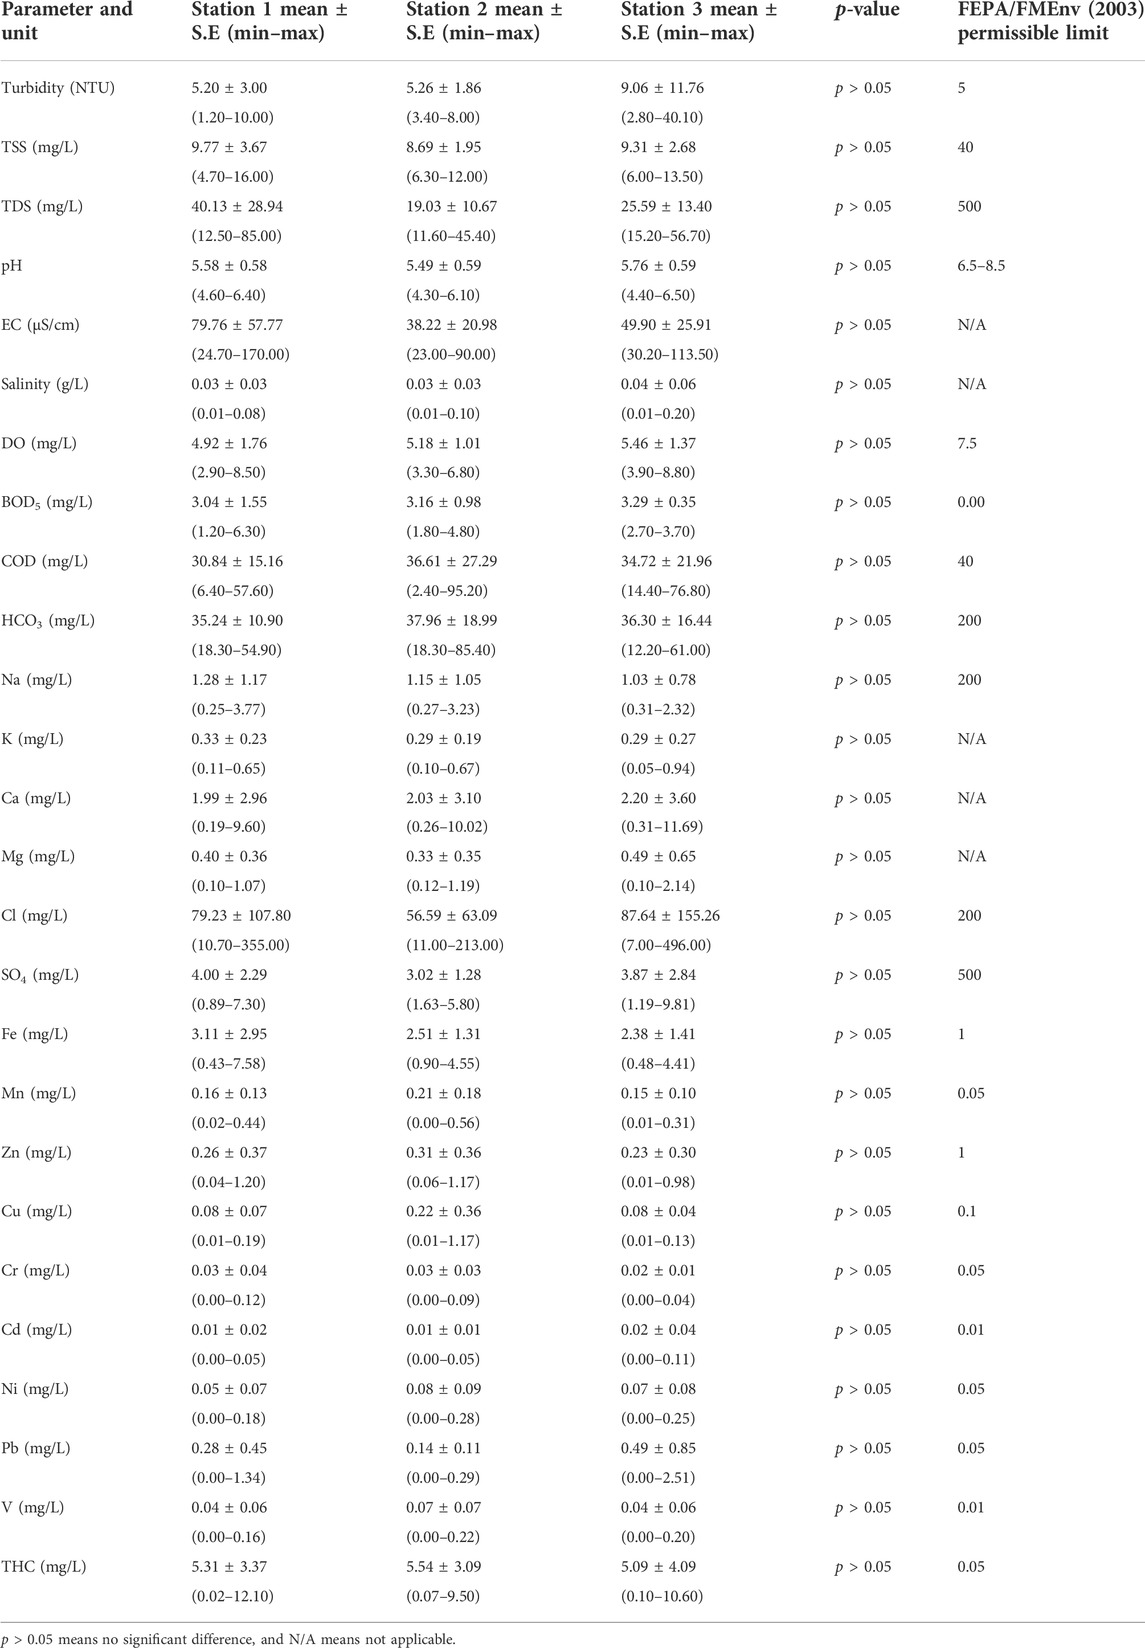
TABLE 1. Summary of the physicochemical parameters in the three designated stations at the Orogodo River, Agbor, Delta State, for the period of April–December 2011.
For TDS and TSS, the highest mean values were 9.77 and 40.13 mg/L at station 1, respectively. The lowest mean values were 19.03 and 5.58 mg/L at stations 2 and 1, respectively, at p > 0.05. The range of values was TDS (4.70–16.00 mg/L and 6.30–12.00 mg/L) and TSS (12.50–85.00 mg/L and 11.60–45.40 mg/L), respectively.
The highest mean (5.76) of pH was in station 3, while the lowest (5.58) was in station 1 at p > 0.05. The range of values was 4.40–6.50 and 4.60–6.40, respectively. The highest mean (79.76 μS/cm) of EC was in station 1, while the lowest (38.22 μS/cm) was in station 2 at p > 0.05. The range of values was 24.70–1.70 μS/cm and 23.00–90.00 μS/cm, respectively. The highest mean (0.04 g/L) of salinity was in station 3,, while the lowest (0.03 g/L) was in stations 1 and 2, at p > 0.05. The range of values was 0.01–0.20 g/L, 0.01–0.08 g/L, and 0.01–0.10 g/L, respectively.
For DO, BOD5, and COD, the highest mean values were 5.46, 3.29, and 36.61 mg/L at stations 3 and 2, respectively. The lowest mean values were 4.92, 3.04, and 30.84 mg/L at station 1, respectively, at p > 0.05. The range of values was DO (3.90–8.80 mg/L and 2.90–8.50 mg/L), BOD5 (2.70–3.70 mg/L and 1.20–6.30 mg/L), and COD (2.40–95.20 mg/L and 6.40–57.60 mg/L), respectively.
The highest mean (37.96 mg/L) of HCO3 was in station 2, while the lowest (35.24 mg/L) was in station 1 at p > 0.05. The range of values was 18.30–85.40 mg/L and 18.30–54.90 mg/L, respectively. The highest mean (1.28 mg/L) of Na was in station 1, while the lowest (1.03 mg/L) was in station 3 at p > 0.05. The range of values was 0.25–3.77 mg/L and 0.31–2.32 mg/L, respectively. The highest mean (0.29 mg/L) of K was in stations 2 and 3, while the lowest (0.33 mg/L) was in station 1 at p > 0.05. The range of values was 0.10–0.67 mg/L, 0.05–0.94 mg/L, and 0.11–0.65 mg/L, respectively. The highest mean (2.20 mg/L) of Ca was in station 3, while the lowest (1.99 mg/L) was in station 1 at p > 0.05. The range of values was 0.31–11.69 mg/L and 0.19–9.60 mg/L, respectively.
For Mg, Cl, and SO4, the highest mean values were 0.49, 87.64, and 4.00 mg/L at stations 3 and 1, respectively. The lowest mean values were 0.33, 79.23, and 3.02 mg/L at stations 1 and 2, respectively, at p > 0.05. The range of values was Mg (0.10–2.14 mg/L and 0.12–1.19 mg/L), Cl (7.00–4.96 mg/L and 10.70–3.55 mg/L), and SO4 (0.89–7.30 mg/L and 1.63–5.80 mg/L) respectively.
The highest mean (3.11 mg/L) of Fe was recorded in station 1, while the lowest (2.38 mg/L) was in station 2 at p > 0.05. The range of values was 0.43–7.58 mg/L and 0.48–4.41 mg/L, respectively. The highest mean (0.21 mg/L) of Mn was in station 2, while the lowest (0.16 mg/L) was in station 1 at p > 0.05. The range of values was 0.00–0.54 mg/L and 0.02–0.44 mg/L, respectively. The highest mean (0.31 mg/L) of Zn was in station 2, while the lowest (0.23 mg/L) was in station 3 at p > 0.05. The range of values was 0.06–1.17 mg/L and 0.01–0.31 mg/L, respectively.
For Cu, Cr, and Cd, the highest mean values were 0.22, 0.03, and 0.02 mg/L at stations 3, 2, and 1, respectively. The lowest mean values were 0.08, 0.02, and 0.01 mg/L at stations 1 and 2, respectively, at p > 0.05. The range of values was Cu (0.01–1.17 mg/L, 0.01–0.19 mg/L, and 0.01–0.13 mg/L), Cr (0.00–0.12 mg/L, 0.00–0.09 mg/L, and 0.00–0.04 mg/L), and Cd (0.00–0.11 mg/L and 0.00–0.05 mg/L), respectively.
The highest mean (0.08 mg/L) of Ni was recorded in station 2, while the lowest (0.05 mg/L) was in station 1 at p > 0.05. The range of values was 0.00–0.28 mg/L and 0.00–1.34 mg/L, respectively. The highest mean (0.49 mg/L) of Pb was recorded in station 3, while the lowest (0.28 mg/L) was in station 1 at p > 0.05. The range of values was 0.00–2.51 mg/L and 0.00–1.34 mg/L, respectively. The highest mean (0.04 mg/L) of V was recorded in stations 1 and 3, while the lowest (0.05 mg/L) was in station 2 at p > 0.05. The range of values was 0.00–0.28 mg/L and 0.00–1.34 mg/L, respectively. Meanwhile, the highest mean (5.54 mg/L) of THC was recorded in station 2, while the lowest (5.09 mg/L) was in station 3 at p > 0.05. The range of values was 0.07–9.50 mg/L and 0.10–10.60 mg/L, respectively.
3.2 Water Quality Index (WQI)
The WQI for the individual stations was computed using the actual and ideal values for the selected parameters and their corresponding Federal Ministry of Environment standard Figure 2. At stations 1, 2, and 3, the WQI values were 900.99, 1010.10, and 951.20, respectively. High values of WQI obtained across the stations were attributable to the concentrations of Fe, Cu, Cr, Cd, Ni, Pb, V, and THC.
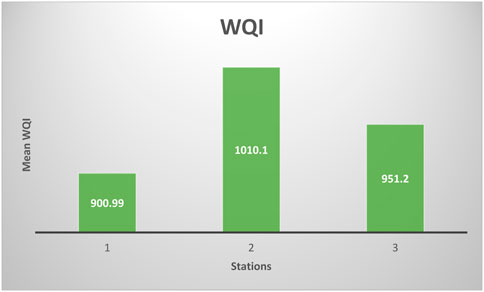
FIGURE 2. WQI for individual stations in the Orogodo River.
Not good for drinking, >300; very poor, 250–300; poor, 100–200; good, 50–100, and excellent, <50 (unsuitable for drinking) (Ramakrishniah et al., 2009; Abbasnia et al., (2018); Anani and Olomukoro, 2021).
3.3 Microbial characteristics
The overall abundance of the aerobic mesophilic bacteria across the stations when compared using a one-way analysis of variance indicated p < 0.01 (a highly significant difference) Table 2. A further evaluation using the DMT showed that the population of the aerobic mesophilic bacteria at station 3 was the source of the significant difference. The population of presumptive coliforms, like E. coli, varied significantly (p < 0.01) across the stations. In the case of presumptive coliforms, a further evaluation using the DMT showed that the population recorded at stations 1 and 2 showed p > 0.01 (not significantly different); however, station 3 was significantly higher. For E. coli, a further evaluation using the DMT showed that the population recorded at station 3 was higher than that at stations 1 and 2 Table 2.
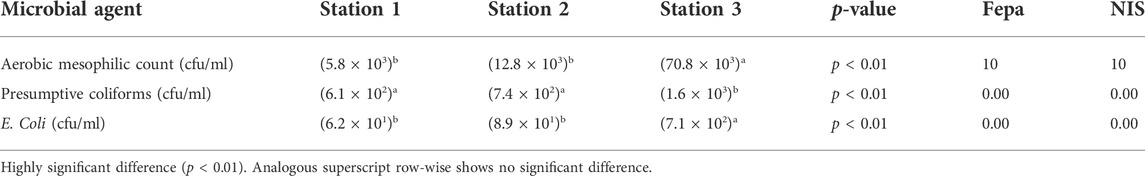
TABLE 2. Results of the selected microbial properties of the sampled stations at the Orogodo River.
3.4 Macrobenthic invertebrate fauna
A total of 787 macrobenthic invertebrates comprising 44 macroinvertebrates’ taxa were recorded. These include four species of Oligochaetes, two species of Hirudinea, one species of Crustacea, three species of Ephemeroptera, five species of Odonata, ten species of Hemiptera, four species of Coleoptera, one species of Diptera, and five species of Gastropoda. The benthic fauna was dominated by dipterans with 47.65%, followed by Hemiptera (20.58%). Coleoptera and Anisoptera were subdominants with 8.89 and 5.08%, respectively. The other groups were found rare. The species richness was in the following rank order: station 3, station 1, and station 2. Sorenson’s quotient of fauna similarity indicated that macrobenthic fauna at these three stations were the same or similar. The similarity was the highest between stations 1 and 3 (75.0%) and the lowest between stations 1 and 2 (50.0%).
3.4.1 Distribution of dominant and subdominant groups
Table 3 shows the dominance rating of the benthic microfauna collected. According to Slack’s method, 15% of the taxonomic groups are considered dominant, while 5–15% are considered subdominant. All groups below 5% are considered rare.
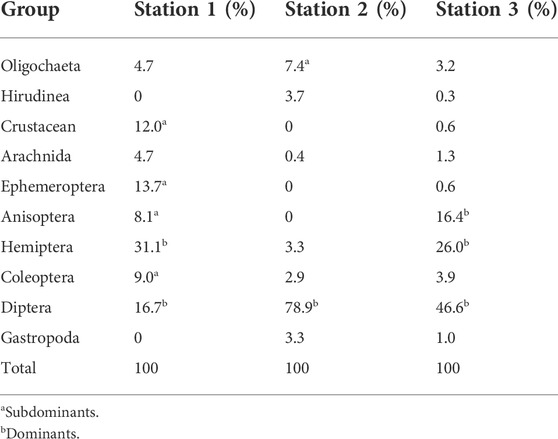
TABLE 3. Distribution of dominant and subdominant benthic groups.
3.5 Results of the biotic indices of water quality
Table 4 shows the results of BMWP, ASPT, and LQI scores across the stations. The BMWP score was in the following rank order: station 3 (73), station 1 (61), and station 2 (48). These values show that the water quality was moderate with a moderately impacted status at stations 1 and 2, while station 3 had good quality with a clean but slightly impacted status. Calculation of the average score per taxon canceled out the effect of sample size, showing a better picture of the water quality status as follows: station 1 (5.08), station 3 (4.56), and station 2 (4.0), correspondingly. This means that water quality at the stations varied from being slightly impacted to being moderately polluted. The BMWP and ASPT were combined to give an overall description using the Lincoln quality index. Meanwhile, the LQI value is in the following rank order: station 1 (4.5), station 3 (4.0), and station 2 (3.0), respectively. This means that water quality at stations 1 and 3 was good, while station 2 had a moderate quality.
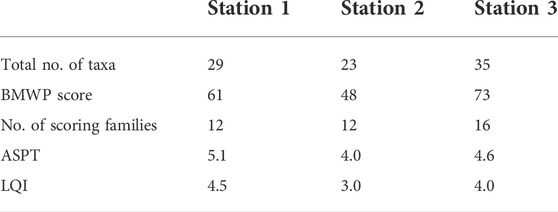
TABLE 4. BMWP, ASPT, and LQI scores across the stations.
4 Discussion
Of all the physicochemical parameters employed in the assessment of water quality of this river, none showed a significant difference among the sampled stations. In this study, the turbidity values recorded were fairly higher than the set standards used in this study. A similar result (5.54 NTU) was reported by Anani et al. (2020b) at the Ossiomo River. The concentration of turbidity is usually higher during the wet season because of run-offs of murky waters and soil materials, especially the silts carried along the water currents to the river and deposited as sediment or alluvial. However, during the dry season, there are no run-offs, so the water body is usually clean without murkiness apart from dust particles carried in the air. This study shows that station 3 was highly impacted, while stations 1 and 2 were fair when compared with the regulatory standards for drinking water.
Electrical conductivity, which measures how well the water conducts electric current, showed an unusual increase in station 1. This is attributed to a higher concentration of dissolved solids like bicarbonates in station 1. However, the EC values from this study are lower than those reported by Rim-Rukeh et al. (2006) but similar to those reported by Idise and Maduka (2011), all from the same river.
The level of concentration of DS (dissolved salts) in aquatic bodies is termed salinity (UNEP, 2008). The spatial similarity of the salinity values of this river is an indication of a relative uniformity in the major dissolved ions (Cl−, SO42-, HCO32-, Na+, Ca2+, K+, and Mg+) across the stations. Turbidity, however, exceeded the same permissible limits at all the sample stations.
The murkiness of any aquatic water is due to the level of TSS (total suspended solids) in it, which in turn affects and increases the turbidity status therein. The high turbidity experienced at station 3 could be attributed to anthropogenic activities like car washing, bathing, and run-off prevalent at this station. The most contributing elements to the relatively high turbidity at station 3 were particulates of clay and silt from shoreline erosion, as most of the samplings were carried out during the rainy season.
In this study, the TSS and TDS values recorded at the three sampled stations all fell within the Federal Ministry of Environment’s permissible limits. The slightly higher solid (TDS and TSS) values recorded at stations 1 and 3 are attributable to the car washing activities going on at these stations. However, the relative uniformity in the solids among the designated stations in this river had earlier been corroborated by Aisien et al. (2010) and Rim-Rukeh and Agbozu (2013). The mean DO values (4.92–5.46 mg/L) recorded in this study all fell under the permissible limits of the Federal Ministry of Environment, but, according to Boyd (1979), the DO threshold level in the water (3–12 mg/L) has been shown to support life-forms in water. In consonance with the reports of Arimoro F. O. et al. (2007), Aisien et al. (2010), Arimoro and Oganah (2010), and Idise and Maduka (2011) in the same region, there was no significant difference in the DO throughout the stretch of the river under study. The COD and BOD5 values reported in this study exceeded the Federal Ministry of Environment’s permissible limits. These values confirm the reports by Agbaire and Obi (2009) and Idise and Maduka (2011) but are significantly lower than those by Aisien et al. (2010). The high concentration of COD and BOD5 in this river is caused by ORM (organic matter) from run-offs coming from adjoining communities.
The alkaline earth metals such as sodium, magnesium, calcium, and potassium fell well below the Federal Ministry of Environment’s permissible limits. There was a significant correlation and homogeneity between both the alkali and alkaline earth metals in which p > 0.05 was recorded between the sampled stations, albeit there was a slight progressive increase in all these metals downstream except for Na+ recorded at its highest value in station 1. This is attributable to anthropogenic activities at this station, probably effluents from car washing and bathing. The Ca > Na > Mg > K order of dominance reported in this study disagrees with what was obtained from five other rivers in Delta State by Kaizer and Osakwe (2010) as well as that of Omo-Irabor and Olabaniyi (2007) from the River Ethiope. The mean concentration of phosphorus fell below the permissible limits as stipulated by the Federal Ministry of Environment in all the sampled stations. The slight decrease in station 2 is evidence of the self-purifying ability of the river. This is also reflected in the investigations performed by Okokoyo and Rim-Rukeh (2003) and Rim-Rukeh et al. (2004).
Iron (Fe) recorded the highest mean values among all the heavy metals analyzed in this study. In the present study, Fe was also positively correlated with the total dissolved solids, total suspended solids, salinity, electrical conductivity, and sulfates. The slightly higher mean values of Fe documented in station 1 could be linked to high run-offs from domestic activities (Radojevic and Bashkin, 1999). Except for chromium (Cr), the rest of the heavy metals like V, Pb, Ni, Cu, Zn, and Mn exceeded the Federal Ministry of Environment’s permissible limits and also exceeded the values recorded by Oguzie and Okhagbuzo (2010), Wogu and Okaka (2011), and Dami et al. (2012). This unnatural concentration of heavy metals may be a result of the generally increasing African human population neighboring the inland waters, which uses these aquatic bodies as a receptacle for their enormous wastes (Edorh et al., 2011). However, vanadium (V) and nickel (Ni) showed positive correlations with pH—corroborating the fact that pH influences the interactions and dynamics of metals within the water matrix (Salvad et al., 2006).
The total hydrocarbon content (THC) recorded in all the stations sampled in this study exceeded the Federal Ministry of Environment’s permissible limit. p > 0.05 was recorded in THC regardless of the stations. The homogeneity among the stations corroborates the observation that there were no noticeable oil/gas activities along the studied stretch of the river. This is in sharp contrast to the report by Ibigoni Clinton et al. (2009) who reported a much higher mean THC of 23.6 mg/l as a consequence of the oil exploitation and exploration activities going on around the areas they studied.
The microbial investigation of the surface water from the river revealed that the values of the aerobic mesophilic count, presumptive E. coli, and coliforms were higher than the Federal Ministry of Environment’s stipulated load. High loads of these bacteria forms detected in the river showed the incidence of high ORM (organic matter) and associated sources of the nutrients. This is also attributable to the prevailing temperature as in the case of the aerobic mesophilic group. The presence of E. coli, which is a subgroup of fecal coliform, is an indication of contamination by fecal matter (Geidreich and Clark, 1966; Enerijiofi et al., 2018; Olatunji and Anani, 2020). This may be from human or animal fecal matter or even from animal droppings used as a fertilizer by the populace. Although p < 0.01 was recorded in terms of bacteria load, the presence of these microorganisms is ubiquitous along the studied stretch of the Orogodo River. None of the selected stations could be set aside as the most contaminated during the study duration because the count of these microorganisms exceeded the Federal Ministry of Environment’s stipulated load. All the bacterial counts observed in this study showed a positive correlation with physical and chemical parameters such as color, turbidity, potassium, calcium, and magnesium.
The macrobenthic invertebrates’ fauna composition of the Orogodo River showed a relatively high taxon richness across the study stations with a total of 44 taxa recorded. However, this could be considered low when compared to the works by Olomukoro and Eborge (2003) and Olomukoro and Anani (2019). Most of the macrobenthic faunas observed were distributed across the three stations except the chironomids, the rat-tailed maggot (Eristalis tenax), and the family Hirudinea, whose occurrence was almost restricted to station 2. Station 2 generally had the lowest number of taxa. Apart from the chemical quality of station 2, other factors may have contributed to the significantly lower taxon richness. Such factors include the significantly faster flow rate and the coarse nature of sediments at this station. Olomukoro and Anani (2019) also reported a similar pattern that could be linked to reduced EC, DO, and pH with a possible impact on species diversity. Any severe modifications in these factors will significantly influence the community of the macroinvertebrates in this study. The macrobenthic fauna was dominated by the members of the class insect, constituting 88.52% of the total faunal abundance. This is in agreement with Arimoro F. et al. (2007) who reported that in most tropical freshwater the macroinvertebrate fauna is numerically dominated by insects. The order Diptera was the dominant order, accounting for 375 out of the total 787 individuals and making up 47.65%. This could be attributed to their ability to survive and proliferate in polluted waters. The order Diptera is followed by the order Hemiptera, which makes up 20.58%. Coleoptera and Anisoptera were subdominants with 8.89 and 5.08%, respectively.
The biotic indices used in estimating water quality (biomonitoring working party index, mean score per taxon, and Lincoln quality index) all revealed that station 2 was moderately polluted, while stations 3 and 1 were only slightly impacted.
The WQI obtained in this study showed that the integrity of the water was not too good for human consumption because the values were more than the benchmark 100 established by Ahmad et al. (2012) and Anani and Olomukoro, (2020a). This coincided with the previously discussed sections as the majority of the parameters did not comply favorably with the Federal Ministry of Environment’s guideline standards.
5 Conclusion and recommendations
In this study, it was noticed that the integrity status of the Orogodo River was considerably poor and not fit for human ingestion. Out of twenty-six (26) chemical and physical parameters investigated, about seven (pH, TSS, TDS, HCO3, Cl, P, and SO4) of these parameters complied well with the permissible or standard limits (Federal Ministry of Environment) used in this study. The results obtained from the WQI estimation also complied with the findings obtained from the evaluation of the chemical and physical parameters. The high values obtained showed that all the stations studied were greatly polluted. This showed that human activities have greatly impacted the aquatic system.
The microbial characterization of the water has a high aerobic mesophilic count, presumptive coliforms, E. coli counts, and traces of disease-causing organisms in the water. This shows a direct indication of organic and fecal contamination, which could elicit several health conditions, like typhoid, stomach upset, and cholera, in consumers that drink from it.
Most of the macrobenthic faunas observed were distributed across the three stations except the chironomids, the rat-tailed maggot (Eristalis tenax), and the family Hirudinea, whose occurrence was almost restricted to station 2. Station 2 generally had the lowest number of taxa. This revealed the ecological impact because this species is a basic indicator of an ecosystem sentinel. The biotic indices used in estimating water quality all revealed that station two was moderately polluted, while stations 3 and 1 were only slightly impacted.
It is recommended that the continuous monitoring of the ecosystem will help to provide prevailing data that will help policymakers and environmentalists to help safeguard the life-forms therein and inform humans on the current status of the river. In addition, boiling the water before consumption is highly recommended to avoid possible human health problems, especially effects from microbial pathogens like coliforms and E. coli.
Data availability statement
The raw data supporting the conclusion of this article will be made available by the authors, based on request.
Author contributions
All authors (JO, OA, NO-O, VO, and RE-I) contributed equally to the technical writing, draft review, table and figure preparation, data analysis, and the design of this manuscript.
Acknowledgments
The authors thank the management of the University of Benin, Benin City, and Edo State University Uzairue for their assistance in providing the environment and facilities during this research.
Conflict of interest
The authors declare that the research was conducted in the absence of any commercial or financial relationships that could be construed as a potential conflict of interest.
Publisher’s note
All claims expressed in this article are solely those of the authors and do not necessarily represent those of their affiliated organizations, or those of the publisher, the editors, and the reviewers. Any product that may be evaluated in this article, or claim that may be made by its manufacturer, is not guaranteed or endorsed by the publisher.
References
Abbasnia, A., Radfard, M., Mahvi, A. H., Nabizadeh, R., Yousefi, M., Soleimani, H., et al. (2018). Groundwater quality assessment for irrigation purposes based on irrigation water quality index and its zoning with GIS in the villages of Chabahar, Sistan, and Baluchistan, Iran. Data Brief 19, 623–631. doi:10.1016/j.dib.2018.05.061
Agbaire, P. O., and Obi, C. G. (2009). Seasonal variations of some physico-chemical properties of river Ethiope water in Abraka, Nigeria. J. Appl. Sci. Environ. Manage. 13 (1), 55–5. doi:10.4314/jasem.v13i1.55265
Ahmad, I. K., Salih, N. M., and Nzar, Y. H. (2012). Determination of water quality index (WQI) for qalyasan stream in sulaimani city/kurdistan region of Iraq. Int. J. Plant, Animal Envtal Sci. 2 (4), 148–157.
Aisien, E. T., Gbegbaje Das, E., and Aisien, F. A. (2010). Water quality assessment of river Ethiope in the Niger-delta coast of Nigeria. EJEAFChe 9 (11), 1739–1745.
Anani, O. A., and Olomukoro, J. O. (2020a). Examination and screening of the perceived toxicity influence of produced wastewater using Allium cepa assay and health risk model as monitoring tools. Arch. Sc. Technol. 1, 33–44.
Anani, O. A., Olomukoro, J. O., and Ezenwa, I. M. (2020b). Limnological evaluation in terms of water quality of Ossiomo River, Southern Nigeria. Inter. J. conser. Sc. 11 (2), 571–588.
Anani, O. A., and Olomukoro, J. O. (2018). Health risk from the consumption of freshwater prawn and crab exposed to heavy metals in a tropical river, southern Nigeria. J. Heavy Metall. Toxic. Dis. 3 (2), 5. doi:10.21767/2473-6457.10024
Anani, O. A., and Olomukoro, J. O. (2021). Probabilistic risk assessment and water quality index of a tropical delta river. PeerJ 9 (2), e12487. doi:10.7717/peerj.12487
Arimoro, F., Ogbeibu, A. E., and Raifu, F. F. (2007b). Phytophilous macroinvertebrates of floating Nymphea lotus and pistia stratiotes in river Orogodo, Niger-Delta. Trop. Freshw. Biol. 16 (1), 75–87.
Arimoro, F. O., Ikomi, R. B., and Osalor, E. C. (2007a). The impact of sawmill wood wastes on the water quality and fish communities of Benin river, Niger delta area, Nigeria. Int. J. Sci. Tech. 2 (1), 1–12.
Arimoro, F. O., and Oganah, A. O. (2010). Zooplankton community responses in a perturbed tropical stream in the Niger delta, Nigeria∼!2009-07-22∼!2009-10-22∼!2010-04-09∼!. Open Environ. Biolog. Monit. J. 3, 1–11. doi:10.2174/1875040001003010001
Arslan, N., Salur, A., Kalyoncu, H., Mercan, D., Barisik, B., and Odabasi, D. A. (2016). The use of BMWP and ASPT indices for evaluation of water quality according to macroinvertebrates in Küçük Menderes River (Turkey). Biologia 71, 49–57. doi:10.1515/biolog-2016-0005
Berger, E., Haase, P., Oetken, M., and Sundermann, A. (2016). Field data reveal low critical chemical concentrations for river benthic invertebrates. Sci. Total Environ. 544, 864–873. doi:10.1016/j.scitotenv.2015.12.006
Boyd, C. E. (1979). Water quality in warm water fish ponds. Auburn, Alabama, USA: Craftmaster, Printers Inc., 353.
Cude, C. (2001). Oregon water quality index: A tool for evaluating water quality management effectiveness. J. Amer. Water Res. Ass. 37, 125–137. doi:10.1111/j.1752-1688.2001.tb05480.x
Dami, A., Ayuba, H. K., and Amukali, O. (2012). Physico-chemical and bacterialogical analysis of the surface water used for domestic purposes in okpai and beneku, delta state, Nigeria. Glob. J. Hum. Soc. Sci. Geogr. Environ. Geosciences 12 (13), 30–36.
Dickens, C. W. S., and Graham, P. M. (2002). The South African Scoring System (SASS) version 5 rapid bioassessment method for rivers. Afr. J. Aquat. Sci. 27, 1–10. doi:10.2989/16085914.2002.9626569
Edorh, A. P., Montcho, E., Gnandi, K., Guédénon, P., Koumolou, L., Boko, M., et al. (2011). Preliminary assessment of the contamination of the marine water and fish by trace metals in Cotonou (Bénin). Ann. Des. Sci. Agron. 15 (1), 37–49. doi:10.4314/asab.v15i1.67367
Enerijiofi, K., Olatunji, O., and Irerua, P. (2018). Effect of human activities on the physicochemical and bacteriological qualities of ujiogba river, ujiogba, Edo state, Nigeria. J. Appl. Life. Sc. Inter. 17 (1), 1–8. doi:10.9734/jalsi/2018/40435
FEPA/(FMEnv) (2003). Guidelines and standards for environmental pollution control in Nigeria. Washington, DC: Federal Environmental Protection Agency, 238.
Geidreich, E. E., and Clark, N. A. (1966). Bacterial pollution indicators in the intestinal tract of fresh water fish. Appl. Microbiol. 14, 429–437. doi:10.1128/am.14.3.429-437.1966
Ibigoni Clinton, H., Ugwemorubong Ujagwung, G., and Horsfall, M. (2009). Evaluation of total hydrocarbon levels in some aquatic media in an oil polluted mangrove wetland. Appl. Ecol. Environ. Res. 7 (2), 111–120. doi:10.15666/aeer/0702_111120
Idise, O. E., and Maduka, K. (2011). The impact of industrial effluent discharge on physicochemical and microbial parameters of Orogodo River, agbor, Nigeria. Afr. J. Microbiol. Res. 5 (22), 3747–3752.
Isobe, K. O., Tarao, M., Chiem, N. H., Minh, L. Y., and Takada, H. (2004). Effect of environmental factors on the relationship between concentrations of coprostanol and fecal indicator bacteria in tropical (Mekong delta) and temperate (Tokyo) freshwaters. Appl. Environ. Microbiol. 70, 814–821. doi:10.1128/aem.70.2.814-821.2004
Kaizer, A. N., and Osakwe, S. A. (2010). Physicochemical characteristics and heavy metal levels in water samples from five river systems in delta state, Nigeria. J. Appl. Sci. Environ. Manage. 14 (1), 83–87. doi:10.4314/jasem.v14i1.56501
Keke, U. N., Arimoro, F. O., Ayanwale, A. V., Odume, O. N., and Edegbene, A. O. (2021a). Weak Relationships among macroinvertebrates beta diversity (β), river status, and environmental correlates in a tropical biodiversity hotspot. Ecol. Indic. 129 (202), 107868. doi:10.1016/j.ecolind.2021.107868
Keke, U. N., Omoigberale, M. O., Ezenwa, I., Yusuf, A., Biose, E., Nweke, N., et al. (2021b). Macroinvertebrate communities and physicochemical characteristics along an anthropogenic stress gradient in a southern Nigeria stream: Implications for ecological restoration. Environ. Sustain. Indic. 12, 100157. doi:10.1016/j.indic.2021.100157
Krisanti, M., Wardiatno, Y., and Anzani, Y. M. (2017). Assessing the ecological status of the Cisadane River’s headwaters using benthic macroinvertebrates. IOP Conf. Ser. Earth Environ. Sci. 54, 012023. doi:10.1088/1755-1315/54/1/012023
Liu, X., Zhang, J., Shi, W., Wang, M., Chen, K., and Wang, L. (2020). Priority pollutants in water and sediments of a river for control basing on benthic macroinvertebrate community structure. Water 11, 1267. doi:10.3390/w11061267
Nguyen, T. H. T., Forio, M. A. E., Boets, P., Lock, K., Damanik Ambarita, M. N., Suhareva, N., et al. (2018). Threshold responses of macroinvertebrate communities to stream velocity in relation to hydropower dam: A case study from the guayas river basin (Ecuador). Water 10, 1195. doi:10.3390/w10091195
Oguzie, F. A., and Okhagbuzo, G. A. (2010). Concentrations of heavy metals in effluent discharges downstream of Ikpoba river in Benin City, Nigeria. Afri. J. Biotechnol. 9 (3), 319–325.
Okokoyo, P. A., and Rim-Rukeh, A. (2003). Pollution pattern of Orogodo River, agbor, delta state, Nigeria. Afr. Jour. Appl. Zoo Environ. Bio. 5, 25–28.
Olatunji, E. O., and Anani, O. A ( (2020). Bacteriological and physicochemical evaluation of river ela, Edo state Nigeria: Water quality and perceived community health concerns. J. Biol. Inno. 9 (5), 736–749. doi:10.46344/JBINO.2020.v09i05.09
Olomukoro, J. O., and Anani, O. A. (2019). Evaluation of aquatic macro-invertebrate populations: A model for emergent bio-monitoring guide for quantifying uncleanness of some rivers in northern Central Nigeria. Nig. J. Tech. Res. l14 (2), 54–62. doi:10.4314/njtr.v14i2.7
Olomukoro, J. O., and Azubuike, C. N. (2009). Heavy metals and macroinvertebrates communities in bottom sediment of ekpan creek, warri, Nigeria. J. J. Biol. Sc. 2 (1), 1–8.
Olomukoro, J. O., and Egborge, A. B. M. (2003). Hydrobiological studies on Warri River, Nigeria. Part II: Seasonal trend in the physic-chemical limnology. Trop. Freshw. Biol. 12 (13), 9–23.
Omo-Irabor, O. O., and Olobaniyi, S. B. (2007). Investigation of the hydrological quality of Ethiope River watershed, southern Nigeria. J. Appl. Sci. Environ. Manage. 11 (2), 13–19.
Paisley, M. F., Trigg, D. J., and Walley, W. J. (2014). Revision of the biological monitoring working party (BMWP) score system: Derivation of present-only and abundance-related scores from field data. River Res. Appl. 30 (7), 887–904. doi:10.1002/rra.2686
Radojevic, M., and Bashkin, V. N. (1999). Practical environmental analysis. Cambridge, UK: The Royal Soceity of Chemistry, 466.
Ramakrishniah, C. R., Sadashivaiah, C., and Ranganna, G. (2009). Assessment of water quality index for the groundwater in tumkur taluk. Euro. J. Chem. 6 (2), 523–530.
Rim-Rukeh, A., and Agbozu, I. E. (2013). Impact of partially treated sewage effluent on the water quality of recipient epie creek Niger delta, Nigeria using Malaysian water quality index (wqi). J. Appl. Sci. Environ. Manage. 17 (1), 5–12.
Rim-Rukeh, A., Ikhifa, O. G., and Okokoyo, A. P. (2006). Effects of agricultural activities on the water quality of Orogodo River, agbor Nigeria. J. Appl. Sc. Res. 2 (5), 256–259.
Rim-Rukeh, A., Okokoyo, P. A., and Nenwiaba, O. (2004). Self-purification of Orogodo River, agbor Nigeria. J. Sci. Indus. Stud. 2, 65–68.
Salvad, V., Quitana, X. D., and Hidalgo, M. (2006). Monitoring of nutrients, pesticides, and metals in waters, sediments, and fish of a wetland. Arch. Environ. Contam. Toxicol. 5, 377–386. doi:10.1007/s00244-005-0107-7
Slack, K. V., Nauman, J. W., and Tilley, L. J. (1979). Benthic inveretebrates in a North flowing stream and a South flowing stream, Brooks range Alaska. J. Am. Water Resour. Assoc. 15, 108–135. doi:10.1111/j.1752-1688.1979.tb00293.x
SPSS Inc (2007). SPSS release 16.0.0 for windows. Polar engineering and consulting. Chicago, IL: SPSS Inc.
Tampo, L., Kaboré, I., Alhassan, E. H., Ouéda, A., Bawa, L. M., and Djaneye-Boundjou, G. (2021). Benthic macroinvertebrates as ecological indicators: Their sensitivity to the water quality and human disturbances in a tropical river. Front. Water 3, 662765. doi:10.3389/frwa.2021.662765
United Nations Environment Programme (UNEP) (2008). Water quality for ecosystem and human health. 2nd Edition. Ontario: United Nations Environment Programme Global Environment Monitoring Systems, 120.
Wogu, M. D., and Okaka, C. E. (2011). Pollution studies on Nigerian rivers: Heavy metals in surface water of warri river, delta state. J. Biodiver. Environ. Sc. 1 (3), 7–12.
Glossary
BMWP biological monitoring working party
WQI water quality
Fe iron
Cu copper
Cr chromium
Cd cadmium
Ni nickel
Pb lead
V vanadium
THC total hydrocarbon concentration
HNO3 nitric acid
DO dissolved oxygen
EMBA eosin methylene blue agar
MB MacConkey broth
NA nutrient agar
PCB plate count agar
ASPT average score per taxon
LQI Lincoln Quality Index
ANOVA analysis of variance
DMR Duncan multiple ranges
NTU nephelometric turbidity units
TDS total dissolve substances
TSS total soluble substances
DO dissolved oxygen
BOD5 biological dissolved oxygen at day 5
COD chemical dissolved oxygen
HCO3 bicarbonates
Mg magnesium
Cl chlorine
SO4 sulfate
Keywords: human activities, water quality, benthos, river system, indices, HYDRO-BIOS
Citation: Olomukoro JO, Obi-Obueze NO, Eko-Imirianye R, Anani OA and Obot V (2022) Water quality evaluation using physicochemical and biological indices to characterize the integrity of the Orogodo River in sub-Saharan Africa. Front. Environ. Chem. 3:961369. doi: 10.3389/fenvc.2022.961369
Received: 04 June 2022; Accepted: 03 October 2022;
Published: 10 November 2022.
Edited by:
Uyiosa Osagie Aigbe, Cape Peninsula University of Technology, South AfricaReviewed by:
Adewale Oladipo, University of South Africa, South AfricaHugues Kamdem Paumo, North West University, South Africa
Copyright © 2022 Olomukoro, Obi-Obueze, Eko-Imirianye, Anani and Obot. This is an open-access article distributed under the terms of the Creative Commons Attribution License (CC BY). The use, distribution or reproduction in other forums is permitted, provided the original author(s) and the copyright owner(s) are credited and that the original publication in this journal is cited, in accordance with accepted academic practice. No use, distribution or reproduction is permitted which does not comply with these terms.
*Correspondence: Osikemekha Anthony Anani, Y3liZXJ0MjAwNEBnbWFpbC5jb20=