 Jin-Ping Xue
 Chad W. Cuss
 Yu Wang
 Muhammad B. Javed
 Tommy Noernberg
- Department of Renewable Resources, University of Alberta, Edmonton, AB, Canada
Although river mixing occurs widely in nature, the corresponding evolution of dissolved organic matter (DOM) composition remains poorly understood. Here, surface water samples were collected at multiple transects in the lower Athabasca River (LAR) under base-flow conditions. Asymmetric flow field-flow fractionation (AF4) coupled to online excitation-emission measurements (EEMs) and parallel factor analysis (PARAFAC) were utilized to investigate the size distribution of fluorescent DOM components during river mixing and the corresponding variation in size-resolved fluorescence. The majority of fluorescent components occurred at 0.810 and 1.170 kDa, reflecting the small size of the DOM molecules with maximum fluorescence. The loadings of fluorescence normalized to absorbance at 254 nm (A254) were highest for most terrestrial humic-like components, followed by the microbial humic-like component, and the protein-like components. Differences in size-resolved fluorescence were observed between DOM in humic-rich tributaries and in the mainstem of the LAR upstream of tributary inputs. The trend of variations in the A254-normalized PARAFAC loadings of terrestrial humic-like components also illustrates conservative mixing of aromatic-rich terrestrial DOM across size fractions in the LAR. From a molecular point of view, the mixing of fluorescent DOM occurred linearly and simultaneously across sizes without any evidence of aggregation, sedimentation, or changes in the fluorescence or concentration of any size fraction over the >60 km required for complete mixing of the river and its tributaries. Overall, this study provides insights into the size characteristics of fluorescent components of DOM and their conservative mixing behavior in large boreal rivers.
1 Introduction
The boreal ecosystem covers 11% of the land surface on the Earth and serves as a key driver in the global carbon cycle (Bonan and Shugart, 1989; Bradshaw and Warkentin, 2015). River networks occur throughout this biome, serving as a major route for carbon transport along the terrestrial-aquatic continuum (Hutchins et al., 2019). However, the functioning of boreal networks is at risk of being heavily impacted in the coming decades, due to intensified natural (e.g., forest fire) or anthropogenic (e.g., forest harvesting) disturbances, as well as climate change (Magnani et al., 2007; Lapierre et al., 2013; Olefeldt et al., 2013; Gómez-Gener et al., 2020). For instance, the increased browning of boreal rivers has been observed over the last three decades, largely as a result of climate change and its influences on adjacent organic-rich terrestrial ecosystems (e.g., peatlands) (Blanchet et al., 2022). This situation highlights the importance of improving our understanding of fluvial carbon evolution and transport in the boreal zone.
Dissolved organic matter (DOM) is a complex mixture of diverse organic molecules occurring ubiquitously in natural waters (Thurman, 1985). In aquatic systems, DOM possesses a vast array of roles, such as providing nutrients to aquatic food webs and influencing the toxicity and transport of trace elements and organic pollutants (Keil and Kirchman, 1991; Latch and McNeill, 2006; Bravo et al., 2017). The role of DOM in the chemistry of natural waters (e.g., acid-base balance) generally depends on its abundance, composition, and reactivity (Lochmueller and Saavedra, 1986; Kellerman et al., 2018). The size characteristics of DOM are also a key variable regulating its interactions with organic and inorganic contaminants (e.g., the size of algae-derived dissolved organic matter affects microbial Hg uptake), and hence should be assessed in DOM studies (Cuss and Guéguen, 2015; Trubetskoj et al., 2018; Mangal et al., 2019).
The degradation of DOM is a key feature of carbon cycling across ecosystems, but its governing variables remain largely unresolved (Kothawala et al., 2021). In freshwaters, DOM persistence is related to its molecular composition along with the water retention time (Kellerman et al., 2015). However, large inconsistencies in the evolution of DOM occur along the terrestrial-freshwater continuum, and in different geographical areas, which may be due to ecosystem-specific properties. River mixing has been reported as a key hydrological feature that alters DOM quality in tropical and temperate rivers (Guinoiseau et al., 2016), potentially contributing to carbon dioxide outgassing to the atmosphere (Simon et al., 2019). A recent study of mixing phenomena in a large boreal river demonstrated conservative DOM mixing at large confluences under different hydrological regimes, meaning that variations in DOM quality were primarily caused by dilution during mixing, with little evidence of DOM loss or degradation (Xue et al., 2022). Other confluences along the same large river did not display delayed mixing, with the variable behavior explained by different hydrological and geomorphological conditions (Mackay, 1970; Parsons et al., 2008; Cuss et al., 2021). Overall, these contrasting mixing patterns in freshwaters across latitudes suggest the need to better understand the factors influencing DOM degradation and/or persistence in freshwaters (Kothawala et al., 2021).
Various methods haven been utilized to study the size properties of DOM, including gel permeation chromatography, size-exclusion chromatography, ultrafiltration, and asymmetric flow field-flow fractionation (AF4) (Grasso et al., 1990; Guéguen and Cuss, 2011; Guéguen et al., 2013; Romera-Castillo et al., 2014; Wünsch et al., 2018). For instance, the molecular weight distribution of DOM has been determined using gel permeation chromatography, but the measurement could be potentially skewed due to analytical issues such as the destruction of aggregates as a result of the application of pressure during adsorption to the stationary phase (Grasso et al., 1990). In comparison, the versatile AF4 separation system has been more recently favoured due to advantages such as the small sample size requirement, precise size determinations, and robust size calibration (Cuss and Guéguen, 2012; Wang et al., 2020). More significantly, when coupled to fluorescence excitation-emission matrices (EEMs) and robust chemometric methods such as parallel factor analysis (PARAFAC), an efficient linkage can be provided between the fluorescence of DOM molecules having different sizes, using only a small number of samples (Cuss and Guéguen, 2012, 2015; Wünsch et al., 2017; Lin and Guo, 2020). Given that recurring PARAFAC-derived fluorescent components have been found across natural and engineered systems, and can be connected using comPARAFAC and OpenFluor, the combination of AF4-EEM-PARAFAC may significantly advance our understanding of DOM at a global scale (Murphy et al., 2014; Parr et al., 2014; Wünsch et al., 2019). However, the applications of such cutting-edge analytical techniques to DOM are largely lacking along hydrological/trophic interfaces where the size-resolved fluorescence characteristics of DOM may provide additional insight into the fate and transport of DOM (Cuss and Guéguen, 2015; Lin and Guo, 2020).
Analysis of the evolution of size-resolved DOM composition during river mixing is a useful approach for elucidating the fate and transport of DOM in the lower Athabasca River (LAR) and other large boreal rivers, and for improving our understanding of its role in the global carbon cycle (Mackay, 1970; Xue et al., 2022). The objectives of this study were: 1) To determine relationships between the molecular mass (∼0.800–4.000 kDa) and fluorescence of DOM in a large boreal river, and 2) To assess the extent of interactions and transformation in these size-resolved DOM fractions from different sources during mixing.
2 Materials and Methods
2.1 The Study Area
The Athabasca River (AR) begins at the glaciers within the Columbia Icefield in Jasper National Park, and travels ∼1,200 km before discharging into Lake Athabasca. From there, its waters move into the Mackenzie River and ultimately into the Arctic Ocean. Along the river, the concentration of dissolved organic carbon (DOC) increases over nine-fold from 1.0 mg C L−1 in the Athabasca Glacial meltwater (flow rate: ≤ 14 m3/s) to 9.4 mg C L−1 in waters collected from the lower reach of the AR (i.e., LAR; flow rate: ∼450–700 m3/s) (Staniszewska et al., 2021; Xue et al., 2022). Under base-flow conditions, such a longitudinal increase of DOC is largely contributed by major tributaries (Cuss et al., 2019). The abundance of peatlands in surrounding ecosystems of the LAR is the likely cause for elevated DOM in these tributaries, where darker waters are delivered and visibly mixed with the relatively milky mainstem (Cuss et al., 2021). Delayed mixing of DOM between the mainstem and its major tributaries have been examined at confluences in the LAR, similar to other large boreal rivers (e.g., the Mackenzie River) (Mackay, 1970; Xue et al., 2022).
2.2 Sample Collection
The field campaign was conducted in the fall of 2018 under base-flow conditions in the LAR (Xue et al., 2022). Representative surface water samples were collected at a depth of 0.3 m, at four mainstem transects along the LAR (T1–T4) (Figure 1). At each transect, samples were collected from the east (T1E–T4E, n = 4) and west sides (T1W–T4W, n = 4). Samples were also collected at the outlet of three major tributaries: the Horse River (HR), the Clearwater River (CL), and the Steepbank River (SB) (n = 3). Sampling coordinates and hydrographic parameters are listed in Table 1.
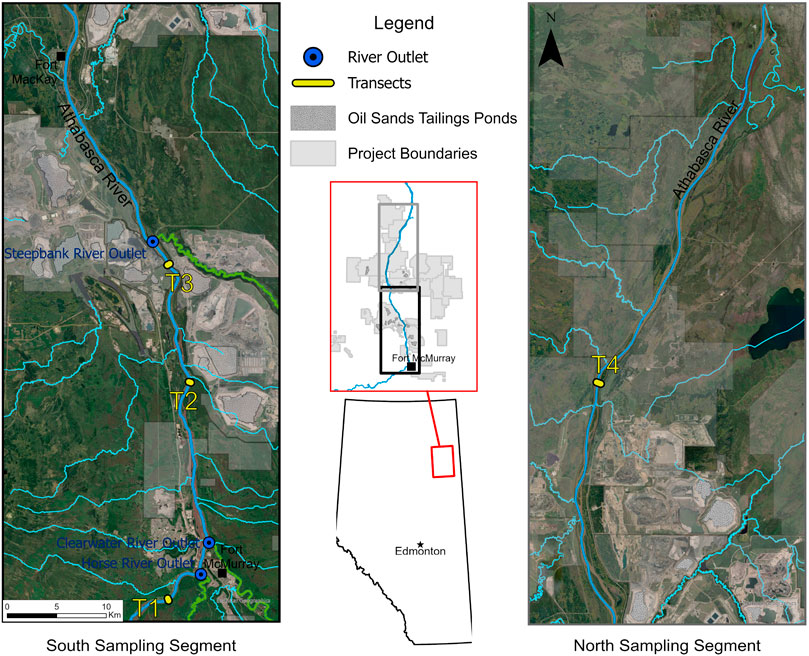
FIGURE 1. Sampling sites along the lower Athabasca River (LAR), northern Alberta.
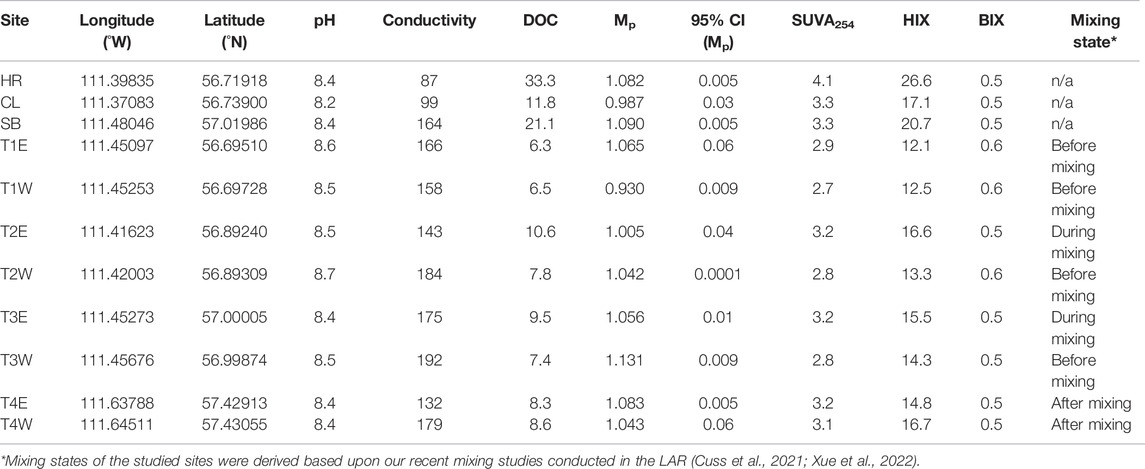
TABLE 1. Sampling coordinates, pH, electrical conductivity, bulk DOM properties, and mixing state in the LAR. 95% CI denotes a 95% confidence interval. Units: Conductivity (µs cm−1), DOC (mg C L−1), Mp (kDa), and SUVA254 (L mg−1 C m−1).
Specialized methods were used to ensure the quality of DOM samples during preparation and sampling (Spencer and Coble, 2014). Briefly, for the collection of DOM samples, amber-glass vials (40 ml) with Teflon-lined caps were rinsed in ASTM Type I water before and after soaking in 5% HCl for ≥24 h. The vials were covered with aluminum foil and combusted at 450°C for ≥5 h. Acid-cleaned polypropylene tubing, bottles, and syringes along with a peristaltic pump were utilized for sample collection in the field. Samples were immediately filtered into the amber-glass vials using 0.22 µm polytetrafluoroethylene filters. Samples were transferred into coolers with ice packs during transport for storage at 4°C in the refrigerator. Size and optical properties were analyzed after warming water samples to room temperature.
2.3 Bulk Dissolved Organic Matter Characterization
Dissolved organic carbon was determined using the combustion technique followed by the analysis of carbon dioxide (Shimadzu TOC-5000A, Kyoto, Japan). Offline fluorescence EEM measurements were conducted for bulk (0.22 µm filtered) DOM samples (n = 11) in ratio (S/R) mode using an Agilent G1321B fluorescence detector (Agilent Technologies, Santa Clara, United States). The bandwidth of excitation/emission monochromator is normally fixed as 20 nm for the fluorescence detector. However, with respect to spectrum acquisition, the step size can be set from 1 to 20 nm. Wavelength ranges for excitation/emission spectra were thus set at 220–450/280–550 nm with 1 and 5 nm intervals, respectively. Wavelength calibration followed manufacturer-recommended procedures. Background noise and scatters were reduced by subtracting an EEM of Milli-Q water on a daily basis. Absorbance spectra were also determined across a wavelength range of 200–640 nm using a diode array detector (Agilent G4212B, Agilent Technologies, Santa Clara, United States). The inner-filtering effect was corrected using the absorbance spectra (220–550 nm) (Kothawala et al., 2013). The humification index (HIX), biological index (BIX), and specific UV absorbance at 254 nm (SUVA254) were calculated for bulk DOM samples using methods detailed elsewhere (Zsolnay et al., 1999; Weishaar et al., 2003; Huguet et al., 2009).
2.4 Determination of Size-Resolved DOM Properties Using AF4
2.4.1 General Settings of the AF4 System
A Postnova AF2000 Multiflow FFF fractionation system (Postnova Analytics, Salt Lake City, Utah, United States) was equipped with a 300 Da polyethersulfone membrane and coupled to on-line diode array and fluorescence detectors (G4212 DAD and G1321B FLD, Agilent Technologies, Santa Clara, California, United States) (Guéguen and Cuss, 2011). The EC and pH of the carrier fluid were adjusted to mimic in situ conditions of the LAR (approximately 300 μS cm−1 and pH 8), using a buffer made from 99.999% metal-free (NH4)2CO3 (Sigma-Aldrich, St. Louis, Missouri, United States). Memory effects were minimized and clean conditions were ensured by both rinsing the system and analyzing a complete carrier fluid blank between each sample (Cuss et al., 2017). Absorbance at a wavelength of 254 nm (A254) was chosen to monitor the size distribution of DOM (Guéguen and Cuss, 2011). The steps used for the analysis, size calibration, and the calculation of the molecular mass at peak maximum (Mp) for bulk samples can be found elsewhere (Xue et al., 2022). Detailed information about the AF4 instrumentation (e.g., flow program), analytical conditions, quality control, and optimization steps are reported by Cuss et al., 2017.
2.4.2 Procedures for Online Size-Resolved EEM Measurements
Complete size-resolved EEM spectra were measured at four molecular masses: 0.810 ± 0.006 kDa, 1.170 ± 0.008 kDa, 2.310 ± 0.01 kDa, and 4.130 ± 0.02 kDa. These masses were chosen to span the breadth of the size distribution and corresponding retention times (tR) of the samples, while ensuring sufficient distance from unfocused material in the void peak (respective tR ≈ 8.30, 8.65, 9.50, and 10.50 min) (Figure 2). Molecular masses were measured as the average ± 95% confidence interval (CI) corresponding to the two calibration curves that bracketed each set of samples. Retention times were adjusted after the first calibration of each day to ensure that EEMs were measured at comparable masses for all samples. Size calibration over a size range of 0.69–20.7 kDa was performed using a mixture of bromophenol blue (Sigma-Aldrich, St. Louis, Missouri, United States) and polystyrene-sulfonate sodium salt standards (PSS-Polymer Standards Service-USA, Inc., Amherst, Massachusetts). To minimize adsorptive losses and ensure consistent separation conditions, the membrane was conditioned using Suwannee River natural organic matter (SRNOM) before the first calibration curve in each sample set.
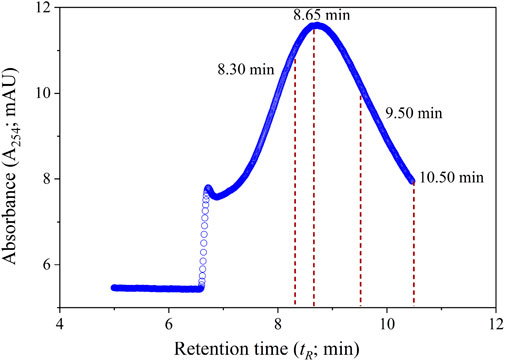
FIGURE 2. The fractogram of the DOM sample collected at the east side of the T1 transect (T1E), showing four stopping points (tR ≈ 8.30, 8.65, 9.50, and 10.50 min) for online size-resolved EEM measurements in this study.
Size-resolved EEMs were measured by stopping the system flow at the retention times corresponding to the desired molecular masses. The carrier flow was first stopped to measure the EEMs at a specific size, after which the sample was separated and the carrier flow was stopped again to measure the EEMs at the next size, and so on. The UV/Visible diode-array detector (DAD) allows for measuring the whole UV/Visible spectra of eluting samples instead of a fixed wavelength (the detector can be operated in multi-Ex or multi-Em mode online, or in EEM mode when the flow is stopped). We were able to measure the excitation and emission spectra of DOM samples along the molecular weight distribution by coupling AF4 to DAD (G4212) and a fluorescence detector (G1321B) (Guéguen and Cuss, 2011). The resolving power of the current fractionation approach has been well demonstrated using both riverine DOM and leaf leachates (Cuss and Guéguen, 2012, 2015). The fluorescence detector settings for size-resolved EEMs were the same as those used for bulk sample EEMs in the offline mode.
2.5 PARAFAC Modelling
A regional-scale PARAFAC analysis was conducted in the LAR using a total of 664 EEMs, including bulk sample EEMs and 44 size-resolved EEMs reported in this study (Matlab R2017b, MathWorks). The PARAFAC model was developed using the DOMFluor and drEEM toolboxes following spectral correction (Stedmon and Bro, 2008; Murphy et al., 2013). Details of the procedures used to develop and validate the model are reported in the corresponding study (Xue et al., 2022). The corresponding component EEMs are shown in Figure 3.
FIGURE 3. Eight PARAFAC components used in this study. In specific, C1–C4 and C6 are classified as terrestrial humic-like components, and C5 as a microbial humic-like component. In addition, C7 is designated as a tryptophan-like component, and C8 is generally a protein-like component. The PARAFAC model has been validated and cross-checked with other published studies, showing no overfitting. Fluorescence intensities are normalized to Raman units (r.u.). Detailed information can be found in Xue et al., 2022.
In this study, PARAFAC component loadings (i.e., Fmax values) were normalized to A254 (i.e., Fmax/A254; referred to as normalized PARAFAC loadings) for two reasons. First, A254 is proportional to the concentration of DOC at the stopping point of a fractogram (within-sample differences) where the size-resolved EEMs were measured. A254 is also proportional to the overall DOC concentration at that point (between-sample differences) in the fractogram (A254 will be proportionally higher on the fractogram if a sample has a higher DOC concentration). With the understanding that the DOM at a specific size across different samples may have a consistent relationship between DOC and A254, it was thought that the A254-normalized PARAFAC loadings could be used to account for both within-sample and between-sample differences.
3 Results
3.1 Concentration, Size and Optical Properties of DOM
The concentration of DOC at T1 was 6.3 ± 0.2 mg C L−1 (Table 1). Downstream of T1, the level of DOC first increased and then decreased from T2 to T4 on the east side (10.6, 9.5 and 8.3 mg C L−1). Higher DOC concentrations were found in tributaries (11.8–33.3 mg C L−1). The molecular mass at peak maximum of DOM at T1E (1.065 ± 0.06 kDa) was similar to major tributaries such as HR and SB (1.081 ± 0.005 and 1.090 ± 0.005 kDa, respectively). In addition, the DOM in tributaries was generally characterized by elevated HIX and SUVA254, and lower BIX values relative to the mainstem.
3.2 Fluorescence of PARAFAC Components for Different DOM Sizes
The A254-normalized PARAFAC loadings were highest at 0.810 and/or 1.170 kDa (Figure 4). The normalized PARAFAC loadings of terrestrial humic-like components C1–C4 were higher than the loading for microbial humic-like component C5 in most samples, while the lowest loadings were generally on protein-like components C7 and C8.
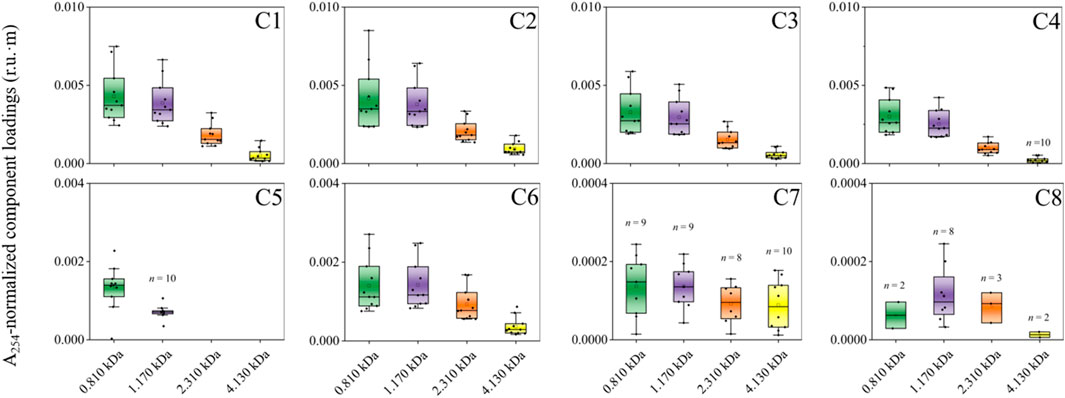
FIGURE 4. A254-normalized PARAFAC component loadings (r.u.·m) across size fractions. The marked number(s) within a specific component panel indicate(s) that only a portion of the entire sample set (i.e., n = 11 in total) is found to have that specific component at a given size (e.g., n = 10 samples for C5 at 1.170 kDa). Similarly, the components without a number indicate that they are present in all samples at a given size.
Terrestrial humic-like components C1–C4 and C6 were measured in DOM of all sizes, for all samples (n = 11, Figure 4). The protein-like component C7 was also measured in all fractions for most samples (8 ≤ n ≤ 10). In contrast, tryptophan-like component C8 was primarily measured at 1170 Da (n = 8 samples). Microbial humic-like component C5 occurred exclusively in the smallest size fractions for the majority of samples (i.e., 0.810 and 1.170 kDa; 10 ≤ n ≤ 11).
3.3 Size-Resolved DOM in the LAR and Its Tributaries
The intensity of fluorescence was generally higher in size-resolved EEM spectra of DOM fractions with small sizes (e.g., 0.810 and 1.170 kDa) than other sizes within each sample (n = 11) (Figure 5). The size-resolved EEMs of DOM samples collected at T1 also varied substantially from tributaries. In addition, differences in the shapes and intensities of size-resolved EEMs were also apparent among the tributaries.
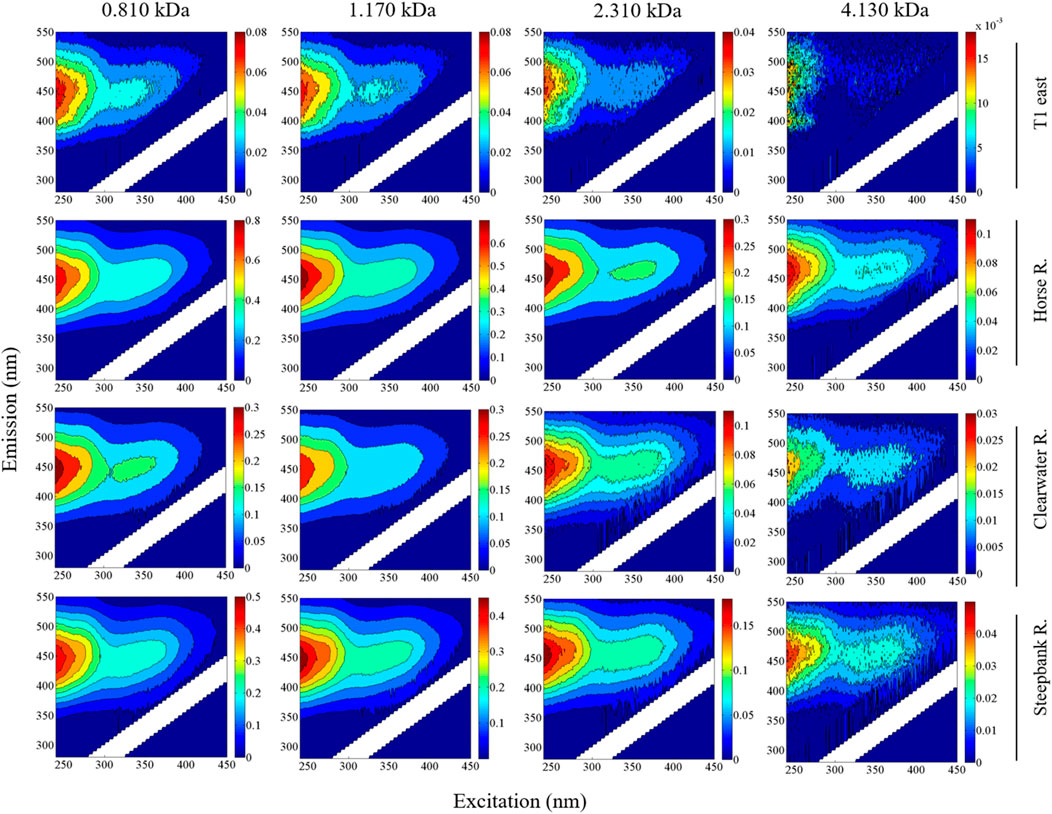
FIGURE 5. Size-resolved EEMs for a mainstem site (T1 east) free of tributary input and major tributaries (i.e., Horse River, Clearwater River, and Steepbank River) in the LAR. Fluorescence intensities are normalized to Raman units (r.u.).
3.4 Evolution of Size-Resolved DOM Along the River
Variations in size-resolved EEMs were evident in samples collected at mainstem sites along the east side of the LAR (Figures 5, 6). In general, a sharp increase in fluorescence intensity occurred in all size fractions between sample sites T1 and T2, following inputs of DOM from HR and CL. This was followed by a gradual decrease in fluorescence intensity from sites T2 to T4. This pattern largely mimicked those observed for bulk DOM and associated quality indicators such as SUVA254 and HIX (Table 1).
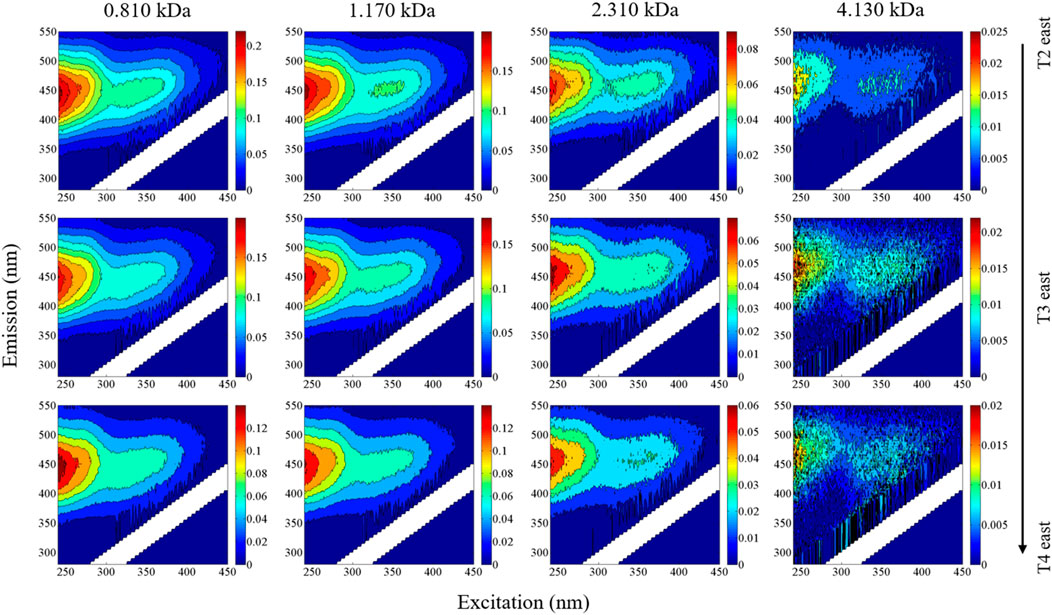
FIGURE 6. Evolution of size-resolved EEMs along the east side of the LAR. The T2–T4 site locations are identified in Figure 5. Fluorescence intensities are normalized to Raman units (r.u.).
Compositional variations in the normalized PARAFAC loadings of humic-like components C1–C4 and C6 were relatively consistent across sizes for samples collected at four mainstem transects (Figure 7). In contrast, the distribution of microbial humic-like and protein-like components C5, C7, and C8 were relatively heterogeneous among size fractions. In addition, the loading of normalized humic-like component C1 was linearly related to loadings on C2–C4 and C6 across both size fractions and samples (Figure 8). Between C5, C7, C8, and C1, no such linear relationships were found, respectively (Figure 9).
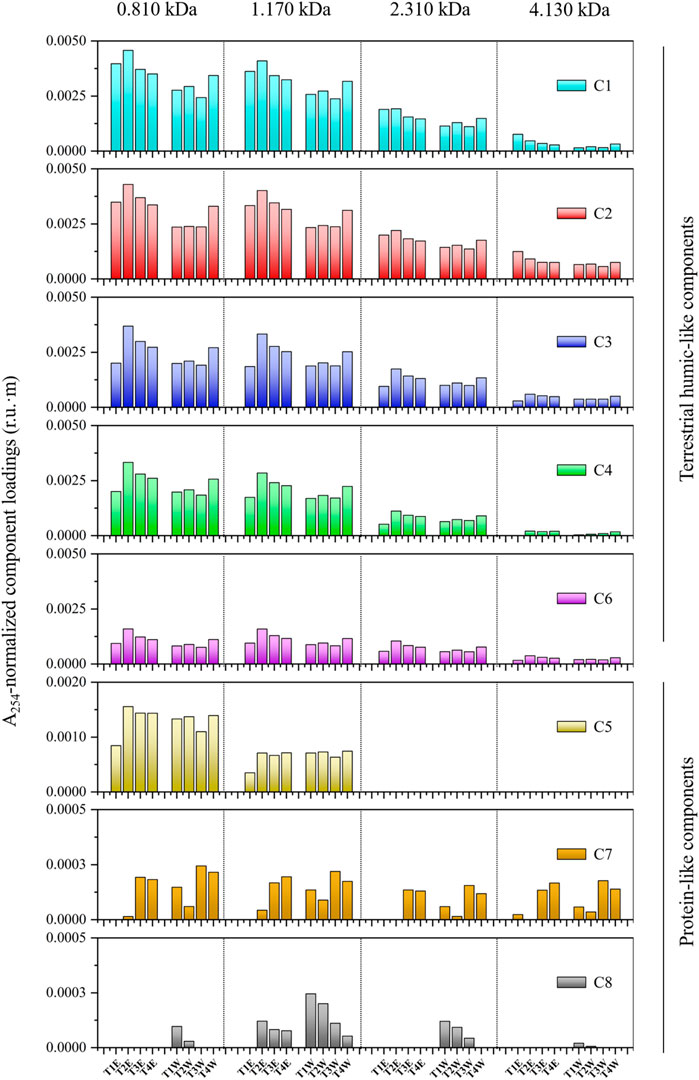
FIGURE 7. A254-normalized PARAFAC component loadings (r.u.·m) across size fractions for terrestrial humic-like components (C1–C4 and C6) and protein-like components (C5, C7, and C8) found in this study. Samples are collected at four mainstem transects including the east (T1E–T4E) and west sides (T1W–T4W) along the LAR.
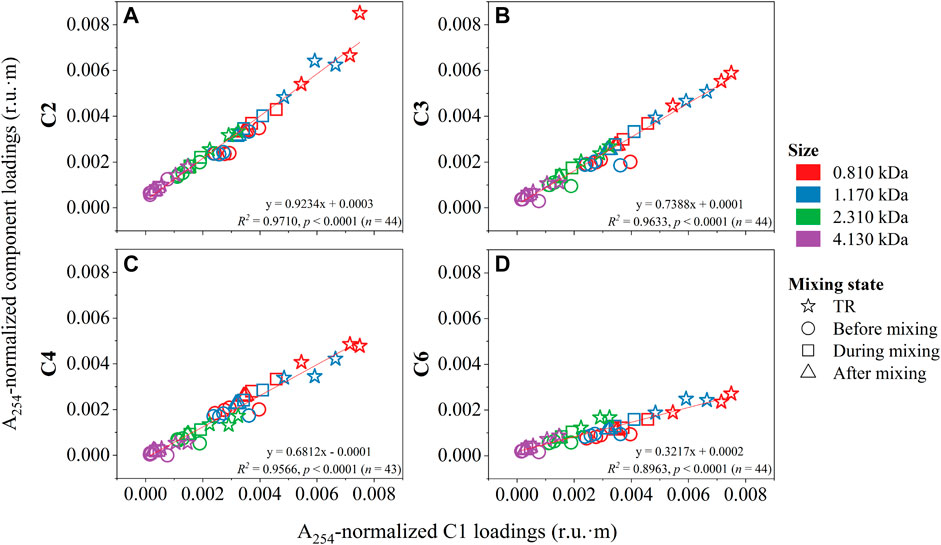
FIGURE 8. Ratios of A254-normalized PARAFAC component loadings (r.u.·m) by C1 for other terrestrial humic-like components (C2–C4, and C6) found in this study. TR denotes tributaries. Before, during, and after mixing refer to mixing states of the mainstem.
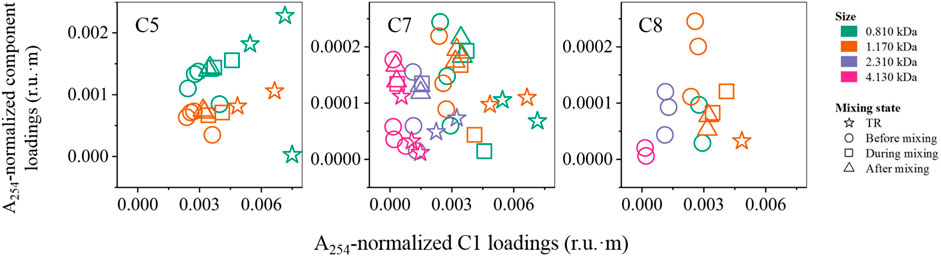
FIGURE 9. Ratios of A254-normalized PARAFAC component loadings (r.u.·m) by C1 for protein-like components (C5, C7, and C8) found in this study. TR denotes tributaries. Before, during, and after mixing refer to mixing states of the mainstem.
4 Discussion
4.1 Size Properties of PARAFAC Components
4.1.1 Intensities of PARAFAC Components Across Sizes
Similarities in the behavior of normalized PARAFAC loadings for some PARAFAC components across size fractions reveal that the proportions of the associated DOM moieties may be uniformly distributed across sizes (e.g., humic-like C1–C4 and C6) (Figure 4). In comparison, proportions of other DOM moieties may be elevated in specific size fractions (e.g., microbial humic-like C5 and protein-like C7 and C8 vs. humic-like C1–C4 and C6). The normalized PARAFAC loadings were elevated in humic-like C1–C4 compared with others, suggesting higher concentrations or fluorescence efficiency for these components.
Our results on the elevated normalized PARAFAC loadings at 0.810 and/or 1.170 kDa agree with size exclusion chromatography results for the highest fluorescence signal between 180 and 2000 Da in freshwater samples from the Florida Everglades (Romera-Castillo et al., 2014). The prevalence of humic-like components relative to the microbial humic-like component was previously observed within the size fraction of ∼1304–1597 Da using size exclusion chromatography, suggesting elevated levels of humic-like components in freshwaters (Romera-Castillo et al., 2014).
4.1.2 Distribution of PARAFAC Components Across Sizes
The existence of the majority of components (i.e., C1–C4, C6 and C7) across sizes supports the hypothesis of a supramolecular structure of DOM widely observed in natural waters (Piccolo, 2001; Romera-Castillo et al., 2014; Cuss and Guéguen, 2015; Wünsch et al., 2018).
Reports in respect of the size distribution of fluorescent components are relatively inconsistent. For instance, in this study, tryptophan-like C8 occurred mainly in the 1.170 kDa size fraction, unlike the broad size distribution of the other protein-like component C7 (Figure 4). In contrast, previous studies report a smaller molecular size (0.496 kDa) and a much larger size of 4.300 kDa for tryptophan-like components, respectively (Cuss and Guéguen, 2012; Wünsch et al., 2018). Another study has found that protein-like components were more abundant in both the small and large size fractions (Romera-Castillo et al., 2014), generally in agreement with the broad size distribution of protein-like C7 examined in this study. Additionally, our findings agree with other researchers who have suggested that peak C-related fluorophores (Ex/Em = 350/450 nm) (e.g., C3 in our case) are present mostly in the 1–3 kDa size range, while peak T-associated fluorophores (Ex/Em = 275/340 nm; C7 in our case) also has a peak in the 1–3 kDa size fraction (Lin and Guo, 2020).
Microbial humic-like C5 was only detected in the 0.810 and 1.170 kDa size fractions. Previously, a study suggested that microbial and terrestrial humic-like components were both found in the middle size fraction using AF4 (i.e., 1.600 kDa) (Cuss and Guéguen, 2012). In contrast, two microbial humic-like components were present in small size ranges (e.g., 0.180–0.998 kDa) based upon results from size exclusion chromatography under various pH conditions (Romera-Castillo et al., 2014), largely in agreement with the present findings.
The application of various separation techniques to measure the size distributions of fluorescent components may contribute to those aforementioned varying results for a single component (Wünsch et al., 2018). Also, different sources of DOM may have different size distributions for similar fluorescent components (e.g., protein-like components), such as leaf litter leachates and soil-derived biopolymers (Cuss and Guéguen, 2012; Romera-Castillo et al., 2014; Xu and Guo, 2017). As such, further studies are needed to better determine the sources of inconsistency for the size characteristics of fluorescent DOM components.
4.2 Size-Dependent DOM Fluorescence: Tributaries vs. the LAR
Comparing fluorescent DOM signatures from natural waters is useful for tracking its source and elucidating its fate and behavior (Fellman et al., 2010; Stubbins et al., 2014). In the context of size-resolved DOM fluorescence, critical observations can be obtained as the size and shape of DOM as well as its fluorescence are generally considered to be impacted by solution chemistry (e.g., ionic strength and pH) (Lochmueller and Saavedra, 1986; Pace et al., 2012; Romera-Castillo et al., 2014; Xu et al., 2018). In large boreal rivers such as the LAR, major tributaries are characterized by elevated concentrations of DOC, iron, and other trace elements relative to the mainstem, largely as a result of redox processes, groundwaters and the abundance of peatlands in their drainage basins (Cuss et al., 2019; Xue et al., 2022). This study demonstrated significant differences in the size-dependent fluorescence of DOM less than 4.130 kDa between tributaries and the mainstem sites (e.g., Clearwater River vs. T1E) (Figure 5). It is thus desirable to study the extent of these sources on size-dependent DOM properties in boreal systems. For instance, cations (e.g., Ca2+) could greatly influence the dispersion and aggregation behaviour of DOM in natural waters due to bridging (Xu et al., 2018).
4.3 Conservative Mixing Patterns Revealed by Size-Resolved DOM
The sharp increase of size-resolved loadings for C1–C4 and C6 between T1 and T2 follows the large contribution of DOM from the HR and CL (Figures 5, 6). The decreasing trend between T2 and T4 on the east side suggests the gradual dilution of DOM during the mixing process, just as the gradual increase on the west side follows mixing across the river (Xue et al., 2022). The difference between T1E and T2E arises due to inputs from both HR and CL, such that the extent of change varies for different components.
The conservative behavior of DOM quality during mixing was qualitatively evidenced by the trend of changes (e.g., before and after addition of tributary DOM between T1E and T2E) of the A254-normalized PARAFAC loadings of size-resolved humic-like components along the mixing transect (Figure 7). Such a mixing pattern was particularly evident in all size fractions of humic-like components. For instance, the A254-normalized loadings of C1 at 0.810 kDa were found to be increasing T1E–T2E (e.g., addition of DOM from major tributaries, HR and CL) and decreasing from T2E–T4E (e.g., gradual mixing or dilution). At the west side, they kept relatively stable from T1W–T3W (sites before mixing; Table 1 for mixing state classification), and a sharp increase from T3W–T4W. In addition, Figure 8 also showed the majority of squares (during mixing) and triangles (after mixing) between the stars (tributaries) and circles (before mixing) in those linear correlations between A254-normalized loadings of terrestrial humic-like components for each size fraction. Size-resolved DOM samples were also classified according to their mixing states (Figure 8). It should be mentioned that the classification of mixing states was of great significance, as we directly found that there was no effect of mixing on the distribution of size-resolved fluorescence in nature, where concentrations often differ.
It should be noted that conservative mixing in the LAR has been quantitatively shown for selected bulk DOM quality measurements including DOC concentration in our previous study (Xue et al., 2022). Here, to be completely convinced, the mass balance calculations were performed for A254-normalized PARAFAC loadings across size fractions in a similar way. Consequently, it was found that the calculated A254-normalized loadings at the end of the mixing zone (e.g., T4E) largely matched what we observed. For instance, from 0.810 to 4.130 kDa, the calculated loadings of C3 were 0.0026, 0.0024, 0.0012, and 0.0004 r.u.·m (e.g., the mixing ratio of T1E:HR:CL ≈ 15:1:10 for C3 at 0.810 kDa), while the measured values are 0.0027, 0.0025, 0.0013, and 0.0005 r.u.·m, respectively. The calculated loadings of other terrestrial humic-like components (i.e., C1, C2, C4, and C6) were also found to be closely matched to the measured results, owing to the similar trend of variations in A254-normalized PARAFAC loadings (Figure 7).
From a molecular point of view, the mixing of DOM occurred evenly across sizes between the two water bodies, and no preferential mixing was observed (Figures 7, 8). Also, there was no indication of fluorescence quenching due to interactions or adsorption to mineral surfaces and losses due to microbial or photochemical degradation within a specific size for the aromatic-rich DOM (Figure 7). The conservative mixing across sizes may be a significant factor underlying a large magnitude of DOM export from boreal systems across the globe, without consideration of loss and degradation of DOM at river confluences. The release of DOM could also be exaggerated by intensifying fires (Jones et al., 2020), and climate change (e.g., permafrost degradation) (Fouché et al., 2020), inducing a significantly increased contribution to the world’s oceans (Mantoura and Woodward, 1983).
4.4 Implications for Persistence of Terrestrial DOM in Boreal Rivers
The non-conservative transport of DOM has been reported as a dominant process in both temperate and tropical rivers (Ward et al., 2013; Simon et al., 2019), accompanied by significant outgassing of carbon dioxide to the atmosphere (Richey et al., 2002; Mayorga et al., 2005; Butman and Raymond, 2011). The mixing of rivers is a ubiquitous phenomenon. If the mixing and transport of DOM in the boreal zone occur differently, as indicated in this study, then these ecosystems and rivers require more attention, especially given their increased sensitivity to climate change (Nijssen et al., 2001). Here we demonstrate an instance of conservative mixing in a large boreal river, although such persistence of DOM may be distinct across ecosystems. For instance, in boreal lakes, it was suggested that degradation mainly removes aromatic and oxidized compounds, which is contrary to our findings, suggesting the complexity of DOM behavior in the boreal biome (Kellerman et al., 2015). This fact also amplifies the call for additional research to better understand the mechanisms underlying organic matter degradation across ecosystems (Kothawala et al., 2021). Additionally, the mixing patterns among base flow conditions, during ice cover, and during snowmelt are expected to be different due to hydrological and geomorphological differences (Elhadi et al., 1984; Cuss et al., 2021; Xue et al., 2022). In general, a large proportion of rivers in the boreal zone become ice-covered in winter, dramatically changing the mixing behavior (Elhadi et al., 1984). Conservative mixing patterns across various sizes of DOM might be altered due to the adsorption of particular functional groups resulting from increased interactions with inorganic and organic particles during spring freshet, when turbulence is elevated. For example, the distance required for complete mixing of the HR and CL was ∼60–80 km in the fall of 2018, compared to >100 km in the fall of 2017, and ∼40 km in the spring of 2018 (Cuss et al., 2021; Xue et al., 2022). Overall, the mixing behavior and corresponding persistence of different DOM size fractions is valuable for understanding the underlying mechanisms that govern this behavior. It is also helpful for improving our ability to predict the response of DOM to environmental changes in various aquatic systems and biomes.
5 Conclusions
Online AF4-EEM-PARAFAC is a useful approach for resolving the size fractions of riverine DOM. It also provides great potential for tracking source contributions and their evolution along the river continuum, especially at key locations that may influence its properties and persistence, such as large river confluences. Size-resolved DOM fluorescence significantly differed between tributaries and the upstream of the LAR prior to mixing. Variations in the A254-normalized PARAFAC loadings of humic-like components were relatively consistent along the LAR, indicating that the mixing of DOM occurred evenly across size fractions, with no preferential mixing or losses associated with the bulk material or specific size fractions. The persistence of aromatic-rich, terrestrial DOM in the LAR contributes toward conservative mixing. The contrasting mixing and persistence of DOM in various seasons and biomes emphasizes the need for additional study to predict the impacts of environmental change on carbon transport, sequestration and losses in fluvial systems.
Data Availability Statement
The original contributions presented in the study are included in the article/supplementary material, further inquiries can be directed to the corresponding author.
Author Contributions
CC and MJ collected the samples with the assistance of TN in the fall of 2018 (Sept. 25–Oct. 03). JX, CC, and WS designed the study. JX conducted the formal analysis, organized the database, and performed the visualization/data presentation work. JX, CC, and WS conducted the interpretation work and drafted the manuscript with contributions from YW and RP.
Funding
This work was supported by funding from the Natural Sciences and Engineering Research Council of Canada (NSERC Grant CRDPJ 510512-17), Canada’s Oil Sands Innovation Alliance (COSIA Grant 2083) and Alberta Innovates.
Conflict of Interest
The authors declare that the research was conducted in the absence of any commercial or financial relationships that could be construed as a potential conflict of interest.
Publisher’s Note
All claims expressed in this article are solely those of the authors and do not necessarily represent those of their affiliated organizations, or those of the publisher, the editors and the reviewers. Any product that may be evaluated in this article, or claim that may be made by its manufacturer, is not guaranteed or endorsed by the publisher.
Acknowledgments
We are grateful to the Canada Foundation for Innovation, the Government of Alberta, and the University of Alberta Faculty of Agriculture, Life and Environmental Sciences for funding the SWAMP laboratory facility. Special thanks to Tracy Gartner for administrative support.
References
Blanchet, C. C., Arzel, C., Davranche, A., Kahilainen, K. K., Secondi, J., Taipale, S., et al. (2022). Ecology and Extent of Freshwater Browning - What We Know and What Should Be Studied Next in the Context of Global Change. Sci. Total Environ. 812, 152420. doi:10.1016/j.scitotenv.2021.152420
Bonan, G. B., and Shugart, H. H. (1989). Environmental Factors and Ecological Processes in Boreal Forests. Annu. Rev. Ecol. Syst. 20, 1–28. doi:10.1146/annurev.es.20.110189.000245
Bradshaw, C. J. A., and Warkentin, I. G. (2015). Global Estimates of Boreal Forest Carbon Stocks and Flux. Glob. Planet. Change 128, 24–30. doi:10.1016/j.gloplacha.2015.02.004
Bravo, A. G., Bouchet, S., Tolu, J., Björn, E., Mateos-Rivera, A., and Bertilsson, S. (2017). Molecular Composition of Organic Matter Controls Methylmercury Formation in Boreal Lakes. Nat. Commun. 8, 14255. doi:10.1038/ncomms14255
Butman, D., and Raymond, P. A. (2011). Significant Efflux of Carbon Dioxide from Streams and Rivers in the United States. Nat. Geosci. 4, 839–842. doi:10.1038/ngeo1294
Cuss, C. W., Donner, M. W., Noernberg, T., Pelletier, R., and Shotyk, W. (2019). EEM-PARAFAC-SOM for Assessing Variation in the Quality of Dissolved Organic Matter: Simultaneous Detection of Differences by Source and Season. Environ. Chem. 16, 360. doi:10.1071/EN19016
Cuss, C. W., Ghotbizadeh, M., Grant-Weaver, I., Javed, M. B., Noernberg, T., and Shotyk, W. (2021). Delayed Mixing of Iron-Laden Tributaries in Large Boreal Rivers: Implications for Iron Transport, Water Quality and Monitoring. J. Hydrology 597, 125747. doi:10.1016/j.jhydrol.2020.125747
Cuss, C. W., Grant-Weaver, I., and Shotyk, W. (2017). AF4-ICPMS with the 300 Da Membrane to Resolve Metal-Bearing “Colloids” < 1 kDa: Optimization, Fractogram Deconvolution, and Advanced Quality Control. Anal. Chem. 89, 8027–8035. doi:10.1021/acs.analchem.7b01427
Cuss, C. W., and Guéguen, C. (2012). Determination of Relative Molecular Weights of Fluorescent Components in Dissolved Organic Matter Using Asymmetrical Flow Field-Flow Fractionation and Parallel Factor Analysis. Anal. Chim. Acta 733, 98–102. doi:10.1016/j.aca.2012.05.003
Cuss, C. W., and Guéguen, C. (2015). Relationships Between Molecular Weight and Fluorescence Properties for Size-Fractionated Dissolved Organic Matter from Fresh and Aged Sources. Water Res. 68, 487–497. doi:10.1016/j.watres.2014.10.013
Elhadi, N., Harrington, A., Hill, I., Lau, Y. L., and Krishnappan, B. G. (1984). River Mixing-A State-Of-The-Art Report. Can. J. Civ. Eng. 11, 585–609. doi:10.1139/l84-076
Fellman, J. B., Hood, E., and Spencer, R. G. M. (2010). Fluorescence Spectroscopy Opens New Windows into Dissolved Organic Matter Dynamics in Freshwater Ecosystems: A Review. Limnol. Oceanogr. 55, 2452–2462. doi:10.4319/lo.2010.55.6.2452
Fouché, J., Christiansen, C. T., Lafrenière, M. J., Grogan, P., and Lamoureux, S. F. (2020). Canadian Permafrost Stores Large Pools of Ammonium and Optically Distinct Dissolved Organic Matter. Nat. Commun. 11, 4500. doi:10.1038/s41467-020-18331-w
Gómez-Gener, L., Lupon, A., Laudon, H., and Sponseller, R. A. (2020). Drought Alters the Biogeochemistry of Boreal Stream Networks. Nat. Commun. 11, 1795. doi:10.1038/s41467-020-15496-2
Grasso, D., Chin, Y.-P., and Weber, W. J. (1990). Structural and Behavioral Characteristics of a Commercial Humic Acid and Natural Dissolved Aquatic Organic Matter. Chemosphere 21, 1181–1197. doi:10.1016/0045-6535(90)90139-K
Guéguen, C., and Cuss, C. W. (2011). Characterization of Aquatic Dissolved Organic Matter by Asymmetrical Flow Field-Flow Fractionation Coupled to UV-Visible Diode Array and Excitation Emission Matrix Fluorescence. J. Chromatogr. A 1218, 4188–4198. doi:10.1016/j.chroma.2010.12.038
Guéguen, C., Cuss, C. W., and Chen, W. (2013). Asymmetrical Flow Field-Flow Fractionation and Excitation-Emission Matrix Spectroscopy Combined with Parallel Factor Analyses of Riverine Dissolved Organic Matter Isolated by Tangential Flow Ultrafiltration. Int. J. Environ. Anal. Chem. 93, 1428–1440. doi:10.1080/03067319.2013.764415
Guinoiseau, D., Bouchez, J., Gélabert, A., Louvat, P., Filizola, N., and Benedetti, M. F. (2016). The Geochemical Filter of Large River Confluences. Chem. Geol. 441, 191–203. doi:10.1016/j.chemgeo.2016.08.009
Huguet, A., Vacher, L., Relexans, S., Saubusse, S., Froidefond, J. M., and Parlanti, E. (2009). Properties of Fluorescent Dissolved Organic Matter in the Gironde Estuary. Org. Geochem. 40, 706–719. doi:10.1016/j.orggeochem.2009.03.002
Hutchins, R. H. S., Prairie, Y. T., and Giorgio, P. A. (2019). Large‐Scale Landscape Drivers of CO2, CH4, DOC, and DIC in Boreal River Networks. Glob. Biogeochem. Cycles 33, 125–142. doi:10.1029/2018GB006106
Jones, M. W., Coppola, A. I., Santín, C., Dittmar, T., Jaffé, R., Doerr, S. H., et al. (2020). Fires Prime Terrestrial Organic Carbon for Riverine Export to the Global Oceans. Nat. Commun. 11, 2791. doi:10.1038/s41467-020-16576-z
Keil, R., and Kirchman, D. (1991). Contribution of Dissolved Free Amino Acids and Ammonium to the Nitrogen Requirements of Heterotrophic Bacterioplankton. Mar. Ecol. Prog. Ser. 73, 1–10. doi:10.3354/meps073001
Kellerman, A. M., Guillemette, F., Podgorski, D. C., Aiken, G. R., Butler, K. D., and Spencer, R. G. M. (2018). Unifying Concepts Linking Dissolved Organic Matter Composition to Persistence in Aquatic Ecosystems. Environ. Sci. Technol. 52, 2538–2548. doi:10.1021/acs.est.7b05513
Kellerman, A. M., Kothawala, D. N., Dittmar, T., and Tranvik, L. J. (2015). Persistence of Dissolved Organic Matter in Lakes Related to its Molecular Characteristics. Nat. Geosci. 8, 454–457. doi:10.1038/ngeo2440
Kothawala, D. N., Kellerman, A. M., Catalán, N., and Tranvik, L. J. (2021). Organic Matter Degradation Across Ecosystem Boundaries: The Need for a Unified Conceptualization. Trends Ecol. Evol. 36, 113–122. doi:10.1016/j.tree.2020.10.006
Kothawala, D. N., Murphy, K. R., Stedmon, C. A., Weyhenmeyer, G. A., and Tranvik, L. J. (2013). Inner Filter Correction of Dissolved Organic Matter Fluorescence. Limnol. Oceanogr. Methods 11, 616–630. doi:10.4319/lom.2013.11.616
Lapierre, J.-F., Guillemette, F., Berggren, M., and Del Giorgio, P. A. (2013). Increases in Terrestrially Derived Carbon Stimulate Organic Carbon Processing and CO2 Emissions in Boreal Aquatic Ecosystems. Nat. Commun. 4, 2972. doi:10.1038/ncomms3972
Latch, D. E., and McNeill, K. (2006). Microheterogeneity of Singlet Oxygen Distributions in Irradiated Humic Acid Solutions. Science 311, 1743–1747. doi:10.1126/science.1121636
Lin, H., and Guo, L. (2020). Variations in Colloidal DOM Composition with Molecular Weight within Individual Water Samples as Characterized by Flow Field-Flow Fractionation and EEM-PARAFAC Analysis. Environ. Sci. Technol. 54, 1657–1667. doi:10.1021/acs.est.9b07123
Lochmueller, C. H., and Saavedra, S. S. (1986). Conformational Changes in a Soil Fulvic Acid Measured by Time-dependent Fluorescence Depolarization. Anal. Chem. 58, 1978–1981. doi:10.1021/ac00122a014
Mackay, J. R. (1970). Lateral Mixing of the Liard and Mackenzie Rivers Downstream from Their Confluence. Can. J. Earth Sci. 7, 111–124. doi:10.1139/e70-008
Magnani, F., Mencuccini, M., Borghetti, M., Berbigier, P., Berninger, F., Delzon, S., et al. (2007). The Human Footprint in the Carbon Cycle of Temperate and Boreal Forests. Nature 447, 849–851. doi:10.1038/nature05847
Mangal, V., Stenzler, B. R., Poulain, A. J., and Guéguen, C. (2019). Aerobic and Anaerobic Bacterial Mercury Uptake Is Driven by Algal Organic Matter Composition and Molecular Weight. Environ. Sci. Technol. 53, 157–165. doi:10.1021/acs.est.8b04909
Mantoura, R. F. C., and Woodward, E. M. S. (1983). Conservative Behaviour of Riverine Dissolved Organic Carbon in the Severn Estuary: Chemical and Geochemical Implications. Geochimica Cosmochimica Acta 47, 1293–1309. doi:10.1016/0016-7037(83)90069-8
Mayorga, E., Aufdenkampe, A. K., Masiello, C. A., Krusche, A. V., Hedges, J. I., Quay, P. D., et al. (2005). Young Organic Matter as a Source of Carbon Dioxide Outgassing from Amazonian Rivers. Nature 436, 538–541. doi:10.1038/nature03880
Murphy, K. R., Stedmon, C. A., Graeber, D., and Bro, R. (2013). Fluorescence Spectroscopy and Multi-Way Techniques. PARAFAC. Anal. Methods 5, 6557. doi:10.1039/C3AY41160E
Murphy, K. R., Stedmon, C. A., Wenig, P., and Bro, R. (2014). OpenFluor- An Online Spectral Library of Auto-Fluorescence by Organic Compounds in the Environment. Anal. Methods 6, 658–661. doi:10.1039/C3AY41935E
Nijssen, B., O'Donnell, G. M., Hamlet, A. F., and Lettenmaier, D. P. (2001). Hydrologic Sensitivity of Global Rivers to Climate Change. Clim. Change 50, 143–175. doi:10.1023/A:1010616428763
Olefeldt, D., Devito, K. J., and Turetsky, M. R. (2013). Sources and Fate of Terrestrial Dissolved Organic Carbon in Lakes of a Boreal Plains Region Recently Affected by Wildfire. Biogeosciences 10, 6247–6265. doi:10.5194/bg-10-6247-2013
Pace, M. L., Reche, I., Cole, J. J., Fernández-Barbero, A., Mazuecos, I. P., and Prairie, Y. T. (2012). pH Change Induces Shifts in the Size and Light Absorption of Dissolved Organic Matter. Biogeochemistry 108, 109–118. doi:10.1007/s10533-011-9576-0
Parr, T. B., Ohno, T., Cronan, C. S., and Simon, K. S. (2014). comPARAFAC: A Library and Tools for Rapid and Quantitative Comparison of Dissolved Organic Matter Components Resolved by Parallel Factor Analysis. Limnol. Oceanogr. Methods 12, 114–125. doi:10.4319/lom.2014.12.114
Parsons, D. R., Best, J. L., Lane, S. N., Kostaschuk, R. A., Hardy, R. J., Orfeo, O., et al. (2008). “Large River Channel Confluences,” in River Confluences, Tributaries, and the Fluvial Network. Editors S. P. Rice, A. G. Roy, and B. L. Rhoads (Hoboken, N.J.: John Wiley & Sons), 73–91. doi:10.1002/9780470760383.ch5
Piccolo, A. (2001). The Supramolecular Structure of Humic Substances. Soil Sci. 166, 810–832. doi:10.1097/00010694-200111000-00007
Richey, J. E., Melack, J. M., Aufdenkampe, A. K., Ballester, V. M., and Hess, L. L. (2002). Outgassing from Amazonian Rivers and Wetlands as a Large Tropical Source of Atmospheric CO2. Nature 416, 617–620. doi:10.1038/416617a
Romera-Castillo, C., Chen, M., Yamashita, Y., and Jaffé, R. (2014). Fluorescence Characteristics of Size-Fractionated Dissolved Organic Matter: Implications for a Molecular Assembly Based Structure? Water Res. 55, 40–51. doi:10.1016/j.watres.2014.02.017
Simon, C., Osterholz, H., Koschinsky, A., and Dittmar, T. (2019). Riverine Mixing at the Molecular Scale - An Ultrahigh-Resolution Mass Spectrometry Study on Dissolved Organic Matter and Selected Metals in the Amazon Confluence Zone (Manaus, Brazil). Org. Geochem. 129, 45–62. doi:10.1016/j.orggeochem.2019.01.013
Spencer, R. G. M., and Coble, P. G. (2014). “Sampling Design for Organic Matter Fluorescence Analysis,” in Aquatic Organic Matter Fluorescence. Editors P. G. Coble, J. Lead, A. Baker, D. M. Reynolds, and R. G. M. Spencer (New York, NY, USA: Cambridge University Press), 125–146. doi:10.1017/cbo9781139045452.008
Staniszewska, K. J., Cooke, C. A., and Reyes, A. V. (2021). Quantifying Meltwater Sources and Contaminant Fluxes from the Athabasca Glacier, Canada. ACS Earth Space Chem. 5, 23–32. doi:10.1021/acsearthspacechem.0c00256
Stedmon, C. A., and Bro, R. (2008). Characterizing Dissolved Organic Matter Fluorescence with Parallel Factor Analysis: A Tutorial. Limnol. Oceanogr. Methods 6, 572–579. doi:10.4319/lom.2008.6.57210.4319/lom.2008.6.572b
Stubbins, A., Lapierre, J.-F., Berggren, M., Prairie, Y. T., Dittmar, T., and del Giorgio, P. A. (2014). What's in an EEM? Molecular Signatures Associated with Dissolved Organic Fluorescence in Boreal Canada. Environ. Sci. Technol. 48, 10598–10606. doi:10.1021/es502086e
Trubetskoj, O. A., Richard, C., Voyard, G., Marchenkov, V. V., and Trubetskaya, O. E. (2018). Molecular Size Distribution of Fluorophores in Aquatic Natural Organic Matter: Application of HPSEC with Multi-Wavelength Absorption and Fluorescence Detection Following LPSEC-PAGE Fractionation. Environ. Sci. Technol. 52, 5287–5295. doi:10.1021/acs.est.7b03924
Wang, Y., Cuss, C. W., and Shotyk, W. (2020). Application of Asymmetric Flow Field-Flow Fractionation to the Study of Aquatic Systems: Coupled Methods, Challenges, and Future Needs. J. Chromatogr. A 1632, 461600. doi:10.1016/j.chroma.2020.461600
Ward, N. D., Keil, R. G., Medeiros, P. M., Brito, D. C., Cunha, A. C., Dittmar, T., et al. (2013). Degradation of Terrestrially Derived Macromolecules in the Amazon River. Nat. Geosci. 6, 530–533. doi:10.1038/ngeo1817
Weishaar, J. L., Aiken, G. R., Bergamaschi, B. A., Fram, M. S., Fujii, R., and Mopper, K. (2003). Evaluation of Specific Ultraviolet Absorbance as an Indicator of the Chemical Composition and Reactivity of Dissolved Organic Carbon. Environ. Sci. Technol. 37, 4702–4708. doi:10.1021/es030360x
Wünsch, U. J., Bro, R., Stedmon, C. A., Wenig, P., and Murphy, K. R. (2019). Emerging Patterns in the Global Distribution of Dissolved Organic Matter Fluorescence. Anal. Methods 11, 888–893. doi:10.1039/C8AY02422G
Wünsch, U. J., Murphy, K. R., and Stedmon, C. A. (2017). The One-Sample PARAFAC Approach Reveals Molecular Size Distributions of Fluorescent Components in Dissolved Organic Matter. Environ. Sci. Technol. 51, 11900–11908. doi:10.1021/acs.est.7b03260
Wünsch, U. J., Stedmon, C. A., Tranvik, L. J., and Guillemette, F. (2018). Unraveling the Size-Dependent Optical Properties of Dissolved Organic Matter. Limnol. Oceanogr. 63, 588–601. doi:10.1002/lno.10651
Xu, H., and Guo, L. (2017). Molecular Size-Dependent Abundance and Composition of Dissolved Organic Matter in River, Lake and Sea Waters. Water Res. 117, 115–126. doi:10.1016/j.watres.2017.04.006
Xu, H., Lin, H., Jiang, H., and Guo, L. (2018). Dynamic Molecular Size Transformation of Aquatic Colloidal Organic Matter as a Function of pH and Cations. Water Res. 144, 543–552. doi:10.1016/j.watres.2018.07.075
Xue, J.-P., Cuss, C. W., Noernberg, T., Javed, M. B., Chen, N., Pelletier, R., et al. (2022). Size and Optical Properties of Dissolved Organic Matter in Large Boreal Rivers During Mixing: Implications for Carbon Transport and Source Discrimination. J. Hydrology Regional Stud. 40, 101033. doi:10.1016/j.ejrh.2022.101033
Keywords: dissolved organic matter, river mixing, asymmetric flow field-flow fractionation, fluorescence excitation-emission matrices, parallel factor analysis, boreal rivers
Citation: Xue J-P, Cuss CW, Wang Y, Javed MB, Noernberg T, Pelletier R and Shotyk W (2022) Size-Resolved Fluorescence Underscores Negligible Interaction of Dissolved Organic Matter During Conservative Mixing in a Large Boreal River. Front. Environ. Chem. 3:937721. doi: 10.3389/fenvc.2022.937721
Received: 06 May 2022; Accepted: 22 June 2022;
Published: 22 July 2022.
Edited by:
Yingxun Du, Nanjing Institute of Geography and Limnology (CAS), ChinaReviewed by:
Penghui Li, Sun Yat-sen University, ChinaWei He, China University of Geosciences, China
Copyright © 2022 Xue, Cuss, Wang, Javed, Noernberg, Pelletier and Shotyk. This is an open-access article distributed under the terms of the Creative Commons Attribution License (CC BY). The use, distribution or reproduction in other forums is permitted, provided the original author(s) and the copyright owner(s) are credited and that the original publication in this journal is cited, in accordance with accepted academic practice. No use, distribution or reproduction is permitted which does not comply with these terms.
*Correspondence: William Shotyk, c2hvdHlrQHVhbGJlcnRhLmNh
†Present Addresses: Jin-Ping Xue, Université de Pau et des Pays de l’Adour, E2S UPPA, CNRS, IPREM, Institut des Sciences Analytiques et de Physico-chimie pour l’Environnement et les matériaux, Pau, FranceChad W. Cuss, School of Science and Environment, Grenfell Campus, Memorial University of Newfoundland, Corner Brook, NL, CanadaMuhammad B. Javed, Hatfield Consultants, Fort McMurray, AB, Canada