
95% of researchers rate our articles as excellent or good
Learn more about the work of our research integrity team to safeguard the quality of each article we publish.
Find out more
ORIGINAL RESEARCH article
Front. Environ. Chem. , 14 June 2022
Sec. Environmental Analytical Methods
Volume 3 - 2022 | https://doi.org/10.3389/fenvc.2022.926233
This article is part of the Research Topic Recent Advances in Gaseous Hydrocarbons Sensing View all 8 articles
 Andrea Zifarelli1†
 Giansergio Menduni1†
 Marilena Giglio1*
 Arianna Elefante1
 Anton Sukhinets1,2Angelo Sampaolo1,3Pietro Patimisco1,3Sun Fangyuan4Wang Chongwu4Qi Jie Wang4,5
 Vincenzo Spagnolo1,3
In this work we report on an innovative sensor box employing two acoustic detection modules connected in series for quartz-enhanced photoacoustic multi-gas detection. One detection module is coupled with an internal distributed-feedback quantum cascade laser (DFB-QCL) emitting at ∼7.719 µm for methane (CH4) sensing, while the second module has been designed to be coupled with an external laser source targeting the absorption features of a specific gas molecule Mx in the infrared spectral range. The sensor box can thus be employed for any application, depending on the CH4/Mx gas combination to be detected. The ∼7.719 µm DFB-QCL also allowed water vapor monitoring. To demonstrate the sensor versatility, we report on the QEPAS-box environmental monitoring application by simultaneously detecting in air methane, which is a greenhouse gas, nitric oxide (NO), an ozone depleting substance, and water vapor. Sensitivity levels of 4.30 mV ppm−1 and 17.51 mV ppm−1 and minimum detection limits of 48 ppb and 11 ppb for methane and nitric oxide detection were achieved, respectively. The sensor box operation was tested by analysing ambient air. Average concentrations of ∼1.73 ppm of CH4, ∼0.134 ppm of NO and 1.8% of H2O were measured.
Recent research on gas sensors shows a strong drive for development of methane (CH4) detectors (Aldhafeeri et al., 2020), based on technologies spanning from semiconductors (Wang et al., 2021) to chemiresistors (Lu et al., 2021), light detection and ranging (LiDAR) (Johnson et al., 2021), dispersion spectroscopy (Chen et al., 2021), gas chromatography (GC) (Sandoval-Bohorquez et al., 2020), tunable laser diode absorption spectroscopy (TDLAS) (Deng et al., 2022), quartz-enhanced photoacoustic spectroscopy (QEPAS) (Giglio et al., 2020), and light-induced thermo-elastic spectroscopy (LITES) (Hu et al., 2020; Xu et al., 2020). Increasing interest on methane sensing arises from the important role played by the simplest alkane in global warming (Badr et al., 1991): methane is one of the main greenhouse gases with a global warming potential (GWP) 21 times higher than carbon dioxide, where GWP measures the molecules heat trapping potential. Atmospheric CH4 reacts with tropospheric OH, prolonging its lifetime, and increasing the radiative forcing. This is known as the CH4 feedback effect (Holmes, 2018). Moreover, methane is fundamental in petroleum industry (Moore et al., 2014), since it is the main fuel source and is also involved in clean energy production via methane reforming to syngas primarily composed of hydrogen (Yentekakis and Dong, 2020). Finally, methane can be used as a biomarker in breath gas analysis (de Lacy Costello et al., 2013). Often, these applications require detection of CH4 together with other chemical species. For example, beyond carbon dioxide, methane and nitrous oxide detection is fundamental to assess the greenhouse-gas balance in atmosphere (Schulze et al., 2009). In oil and gas industry, detection of methane and heavier alkanes with their ratios and isotopes allows the evaluation of reservoir formation for guiding petroleum exploration and production estimate, and the identification of natural gas fugitive emissions (Luo et al., 2022). The detection of methane and hydrogen sulfide in breath, resulting from the metabolization of an excessive amount of hydrogen, is fundamental for the diagnosis of irritable bowel syndrome (Pal and Pradhan, 2020). Detection of methane, together with nitrogen and sulfur compounds in precision agriculture, allows the monitoring of the biodegradation processes (Silva Minini Baiense et al., 2021). More than the listed examples, several other applications require the detection of methane jointly with one or more gas molecules. For this reason, in this work we report on the realization and test of a sensor box designed to allow sensitive and selective real-time detection of methane in conjunction with any gas molecule Mx having absorption features in the infrared spectral range.
Among the four main gas sensing techniques categories, namely analytical-, semiconductor-, electrochemical-, and laser optical absorption (LAS)-based, the latter one has been selected as the most suitable for the CH4-Mx sensor box development, by exploiting the QEPAS technique. The reasons for this choice lie in the fact that, although the combination of gas chromatography and mass spectrometry (GC-MS) offers high sensitivity and selectivity, difficulty in miniaturization make this analytical technique unsuitable for the development of a compact sensor for real-time measurements (Gohlke and McLafferty, 1993). On the other hand, electrochemical sensors are extensively employed for on-field applications but their speed of reaction decreases with temperature, and their performance downgrade with time and reagents (Guth et al., 2009). Contrary to GC-MS, semiconductor sensors are low cost and lightweight, but suffer from low selectivity and sensitivity (Nikolic et al., 2020). In general, LAS-based techniques show minimal drifts, fast response time, selectivity, compactness, and robustness (Wang et al., 2018). In most of the LAS-based techniques, like tunable diode-LAS, wavelength and frequency modulation spectroscopy, cavity ring down spectroscopy or cavity-enhanced LAS, the target molecules are excited with a laser source and the light power exiting the gas absorption cell or cavity is measured by a photodetector, whose responsivity is high and flat just over a few µm-wide spectral range (Li et al., 2013; Wu et al., 2021). Conversely, QEPAS approach consists in exciting the target gas with a modulated infrared laser source and detecting the acoustic waves resulting from the molecule non-radiative energy relaxation by means of a quartz tuning fork (QTF), whose resonance frequency matches the laser modulation one (Patimisco et al., 2018). Therefore, while the molecule excitation depends on the proper selection of the light source, in terms of emission wavenumber and optical power, the signal detection depends on the QTF properties, namely quality factor, elasticity modulus, electric resistance and capacitance, and electrode pattern, which are all independent on the laser characteristics (Patimisco et al., 2017). Thus, QEPAS combines the selectivity of LAS-based spectroscopy and the sensitivity of a sharp resonator-based detection technique, with the advantage of relying on a detector whose responsivity is wavelength independent. This last peculiar feature made QEPAS the leading-edge technique in multi-gas detection (Sampaolo et al., 2021) and allows the detection of an additional gas molecule Mx through the reported sensor by just choosing a laser light source targeting a suitable Mx absorption feature and collimating it into the sensor box.
The box architecture implements a single gas line which allows the gas sample to pass through two acoustic detection modules (ADMs): 1) one coupled with a distributed-feedback quantum cascade laser (DFB-QCL) targeting methane absorption lines at ∼7.719 µm, and 2) a second one set in front of a box aperture for external laser coupling. The designed architecture makes the sensor extremely versatile and suitable for any gas sensing application requiring the detection of methane only or in combination with another gas species.
To validate the sensor operation, we focused on assessing detection performances for both ADMs employing, in addition to the embedded QCL, an external laser operating in the mid-infrared spectral range. With this aim, we report for the first time on the simultaneous QEPAS detection of methane and nitric oxide (NO), which was selected as the Mx molecule because, like methane, it has been demonstrated as a non-invasive biomarker in breath gas analysis (Birrell et al., 2006), and it is fundamental in environmental monitoring (World Bank, 1999). Nitric oxide has a crucial role in atmospheric chemistry and climate, since it regulates the ozone cycle in the atmosphere as well as the formation of atmospheric oxidants. In particular, NO oxidation causes ozone depletion and produces nitrogen dioxide (NO2) and nitrate (NO3) radical (Atkinson, 2000). Commonly, NO is not included in standard air composition due to the high rate constant of the oxidation reaction (Jarvis et al., 2010; Han et al., 2011). However, there are NO traces in polluted air as a result of combustion, with a concentration varying with the pollutant source. In addition, the photolysis of nitrous acid emitted from soils and unvegetated peat surfaces causes the increase of nitric oxide in the atmosphere (Venterea et al., 2005; Bhattarai et al., 2022). Even though the World Health Organization reports a total concentration of NO and NO2 exceeding 260 part-per-billion (ppb) in dense urban areas (Jarvis et al., 2010), Shi et al. measured NO concentration as high as 187 part-per-million (ppm) in volume in bus diesel-engine exhaust (Shi et al., 2017).
In this work, we demonstrated the sensor box operation for environmental monitoring applications by sampling ambient air and simultaneously detecting methane and nitric oxide, while doubly monitoring water vapor concentration.
The realization of the QEPAS sensor required the design of an innovative sensor architecture and a dedicated LabVIEW-based software, aimed at driving the employed devices and processing the QTFs signal. An NI PCIe-6363 DAQ was selected to provide and acquire the analog signals needed in a typical QEPAS experimental set-up. The developed sensor architecture is depicted in Figure 1A and in Supplementary Figure S1A.
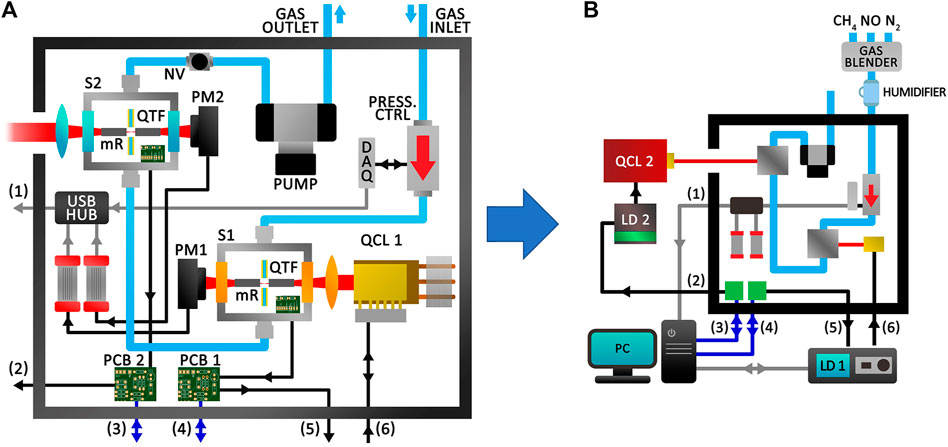
FIGURE 1. (A) Schematic of the developed sensor architecture. Blue arrows represent the cables of the NI PCIe-6363 DAQ, installed in the computer and employed to both generate and acquire signals. USB cables are represented with grey arrows. Black arrows represent cables employed for the distribution of analog signals, both inside and outside the sensor. (B) Schematic of the setup realized for simultaneous detection of methane and nitric oxide. S1-Sensor 1; S2-Sensor two; QTF-Quartz Tuning Fork; mR -Resonator tubes; PM1- Power Meter 1; PM2- Power Meter two; PCB 1-Printed Circuit Board 1; PCB 2-Printed Circuit Board two; QCL 1-Quantum Cascade Laser 1; QCL 2-Quantum Cascade Laser two; DAQ-Data acquisition board; Press. Ctrl-Pressure controller; NV-Needle Valve; LD 1- Laser Driver 1; LD 2-Laser Driver two; PC-Personal Computer. 7–12 µm and 3–5 µm AR coated optical elements in S1 and S2 are represented in orange and blue, respectively.
Two different sensing systems can be identified within the box: a complete CH4 QEPAS sensor, S1, set at the bottom-right of the schematic in Figure 1A, and an Mx QEPAS sensor, S2, to be coupled with an external laser source and set at the top-left of the schematic in Figure 1A in front of an aperture on the box left side panel. The same type of spectrophone, composed of a 12 kHz T-shaped QTF coupled with two optimized resonator tubes (Patimisco et al., 2019), is employed in the two systems. The 12 kHz spectrophone has been demonstrated to be more efficient for slow energy relaxing gas species QEPAS detection, like NO, with respect to the 32 kHz standard one (Giglio et al., 2019). Transimpedance amplifiers, with a feedback resistor of 10 MΩ, convert the QTF piezoelectric currents into voltage signals, further delivered to printed circuit boards, i.e., PCB 1 and PCB 2. These boards are designed to easily route the I/O channel signals of the PCIe-6363 DAQ and are connected to the ports (3) and (4) of the box.
S1 consists of a stainless-steel box, called sensor-head, where optical components are fixed to keep the system compact and aligned (Supplementary Figure S1B). In S1, the laser source is a Thorlabs DFB-QCL emitting at a central wavelength of 7.719 µm, mounted in a high heat load (HHL) package, set on an air-cooled heatsink (QCL 1 in Figure 1A). The full tuning spectral range of the employed QCL is 1295.0–1299.2 cm−1. A multi-conductor cable connects the HHL package pins to the port (6) of the box. A ZnSe lens with a 7–12 µm AR (anti-reflection) coating and a 40 mm focal length focuses the laser beam inside an ADM, through the spectrophone. The ADM is equipped with two ZnSe windows with a 7–12 µm AR coating. S2 consists in a ZnSe lens with a 3–5 µm AR coating and a 75 mm focal length, set in front of the aperture on the box side panel, and an ADM with the same type of spectrophone as in S1. The ADM is equipped with two ZnSe windows, with a 3–5 µm AR coating. In S2 all optical components are mounted with retaining/o-rings and can be replaced with components with different AR coatings, depending on the laser source selected for Mx detection. S2 spectrophone and focusing lens identify an optical axis perpendicular to the aperture and parallel to the box basis. The ADM and lens are mounted on a five- and three-axis stage, respectively, for fine adjustments with respect to the external laser beam. Two optical power meters (PM - Thorlabs S401C) are placed behind the ADMs for laser beam alignment purposes and connected to their USB interfaces (Thorlabs PM100USB). A single gas line allows the gas sample to enter the QEPAS sensor box from an inlet, pass through the two ADMs, and exit the sensor via an outlet. The gas handling system consists of a pressure controller and flow meter (MKS Type 649), interfaced with an NI-DAQ, a needle valve and a diaphragm vacuum pump (KNF N 85.3 KNE). These components ensure the same pressure and flow working conditions in S1 and S2. NI-DAQ and PM USB interfaces are connected to the port (1) of the box through an USB hub. LabVIEW-based subroutines were developed to read the optical power measured by the power meters and manage the pressure controller. In particular, the analog output of the NI-DAQ was employed to provide the reference voltage (i.e., the pressure setpoint) to the pressure controller, while its analog inputs allowed the monitoring of pressure and flow values inside the gas line.
A DFB-QCL emitting at a central wavelength of 5.26 µm was collimated into S2 in the configuration shown in Figure 1B. The 1898.36–1902.31 cm−1 laser tuning range allows targeting of the NO absorption features located at 1900.07 cm−1 and 1900.51 cm−1 (Gordon et al., 2017). An MCQ Instruments Gas Blender GB-103 was employed to generate gas mixtures at a fixed flow rate of 28 sccm. The gas mixture was downstream humidified using a Nafion tube. As shown in Figure 1B, the sensor box was then connected to 1) the outlet of the Nafion humidifier, through the gas inlet; 2) a PC, through port (1); 3) the modulation input of the QCL 2 laser driver, through port (2); 4) the PCIe-6363 DAQ, through ports (3) and (4); 5) the modulation input and the thermoelectric-cooler/current output of the QCL 1 laser driver (Thorlabs ITC4005QCL) through ports (5) and (6), respectively. Finally, the USB interface of QCL 1 laser driver was connected to the PC to set temperature and current values via software.
A LabVIEW subroutine was developed to perform the QTFs electrical characterization, requiring the generation of a sinewave to excite the QTFs and the demodulation of the QTF response at the same excitation frequency. The fundamental resonance frequency (f0) and the quality factor (Q) of the spectrophones were measured before acquiring the QEPAS signals. The normalized resonance curves obtained for S1 and S2 in pure nitrogen at a working pressure of 500 Torr and at a flow rate of 28 sccm are shown in Figures 2A,B.
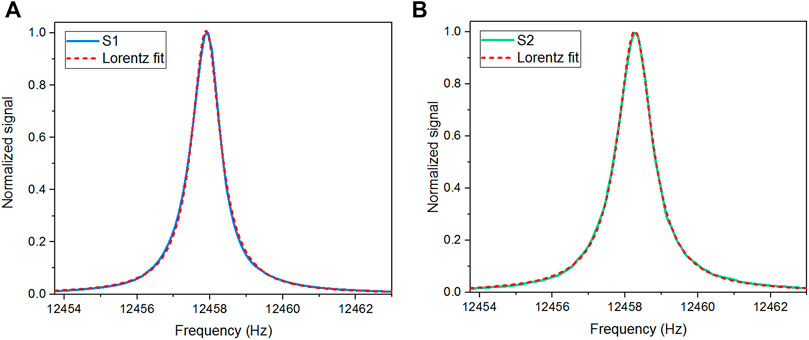
FIGURE 2. Normalized resonance curves of the spectrophone employed in (A) S1 (blue line) and in (B) S2 (green line) measured in pure nitrogen at a working pressure of 500 Torr and at a flow rate of 28 sccm. Lorentzian fit curves are represented with red dashed curves.
The f0 and Q parameters were extracted using a Lorentzian curve to fit the measured data. The fit of the S1 and S2 spectrophone resonance curves returned resonance frequencies of 12,457.89 Hz and 12,458.27 Hz, with quality factors of 12,900 and 10,700, respectively.
QEPAS measurements were performed by sweeping the QCLs emission in selected spectral ranges and employing wavelength modulation and 2f-detection technique. With this aim, a LabVIEW subroutine was developed to modulate S1 and S2 QCL currents at half of the respective spectrophone resonance frequencies while adding a sawtooth ramp. These signals were delivered to the modulation input of LD 1 and LD 2 through ports (5) and (2). The lock-in demodulated the QTFs signal at their resonance frequencies.
In this section, the results achieved employing the developed QEPAS sensor are reported. As a first step, the S1 and S2 responses were investigated by independently operating the sensing systems, in turn. Then, the combined action of the detection modules has been verified and employed to measure methane and nitric oxide concentrations in air samples collected inside our laboratory.
Connected by a single gas line, S1 and S2 shared the same flow rate and working pressure. The latter was set to p = 500 Torr as this operating condition maximized the QEPAS response for the analyte at the lowest concentration, i.e., NO. Non-radiative energy relaxation processes are promoted by water vapor for the selected excited energy levels of both methane and nitric oxide (Dong et al., 2011; Jahjah et al., 2014; Elefante et al., 2020). With the perspective of demonstrating the operation of the developed sensor box for CH4 and NO monitoring in air, the sensor calibration was performed by humidifying all the samples generated by the gas blender downstream, by means of a Nafion humidifier. The water vapor concentration in the gas line was fixed to reproduce the experimental conditions expected for the analysis of ambient air. Using a hygrometer located in the laboratory room, an average H2O concentration of 1.8% in ambient air was calculated. This water vapor level was then fixed in the gas line by setting a flow rate of 28 sccm through the humidifier.
Several absorption features of CH4 and H2O are located within the emission spectrum of the S1 laser source. The best detection range, in terms of absorption line-strengths and spectral isolation from absorption features of the methane, water, and other typical standard air gas components, can be targeted by operating the laser at 20°C. The absorption cross-section of a standard air mixture in this spectral window was simulated using the HITRAN database (Gordon et al., 2017) at 500 Torr and is shown in Figure 3. The CH4 concentration in the HITRAN simulated spectrum was 1.7 ppm, while the H2O concentration was 1.86%. This water vapor level was similar to the one measured inside our laboratory (∼1.8%).
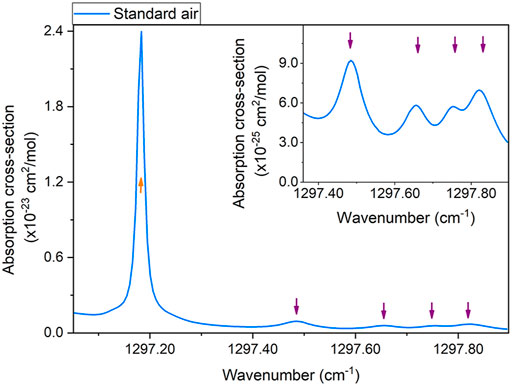
FIGURE 3. Absorption cross-section of standard air in the S1 laser source emission range simulated using HITRAN database (United States model, mean latitude, summer). The inset highlights the spectral region between 1297.36 cm−1 and 1297.90 cm−1. Orange and purple arrows indicate water vapor and methane absorption features, respectively.
The HITRAN simulation shows an intense H2O absorption peak located at 1297.18 cm−1 and four CH4 absorption features located at 1297.48 cm−1, 1297.65 cm−1, 1297.75 cm−1, and 1297.82 cm−1, respectively, as highlighted in the inset of Figure 3. As the most intense one, the CH4 absorption peak located at 1297.48 cm−1 was selected to calibrate the sensor S1 for methane detection. At this wavenumber, a QCL 1 optical power of 48 mW was measured by PM1. The H2O absorption peak located at 1297.18 cm−1 was used to monitor the water vapor level generated by the humidifier in the gas line. The water vapor absorption feature exhibits a Lorentzian-like line-shape with a 0.015 cm−1 width, while the selected methane absorption feature exhibits a broader Voigt-like line-shape with a 0.014 cm−1 Lorentzian width and a 0.053 cm−1 Gaussian width.
The QEPAS spectra collected while targeting H2O and CH4 in a gas sample containing 30 ppm of CH4 and 1.8% of H2O in N2 are shown in Figure 4, as representative.
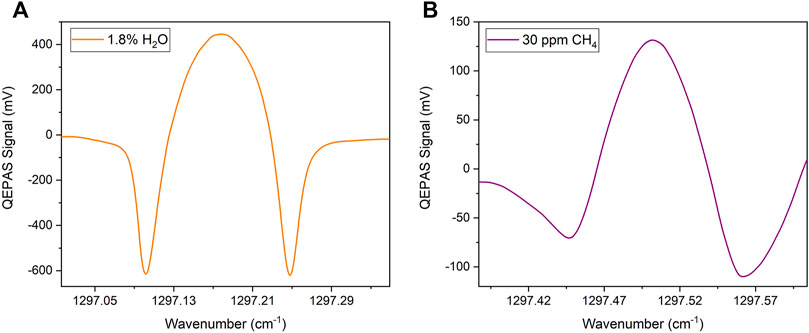
FIGURE 4. 2f-QEPAS spectra collected for (A) H2O at a concentration of 1.8% and (B) CH4 at a concentration of 30 ppm, both in N2.
The spectral scans in Figure 4 were acquired using the same 130 mV peak-to-peak modulation amplitude, selected as the one maximizing the CH4 QEPAS signal. This is the reason why the QEPAS spectral scan of the H2O absorption peak appears overmodulated compared to the 2nd derivative of a Lorentzian lineshape. The asymmetry of negative lobes of the methane spectral scan arises from a slight contribution deriving from the adjacent CH4 absorption feature at 1297.65 cm−1. Peak signals of 446.46 mV and 130.38 mV were measured for concentrations of 1.8% of water vapor and 30 ppm of methane, respectively. The QEPAS signal collected while flowing humidified N2 inside the gas line returned a 1σ noise level of 0.21 mV. Therefore, a signal-to-noise ratio (SNR) of 620 was calculated for CH4 measurements.
Starting from a gas cylinder with a certified concentration of 100 ppm CH4 in N2, several dilutions were generated using the gas blender and keeping the water vapor concentration fixed at 1.8%. The peak signals of the collected CH4 QEPAS spectra were extracted and are shown in Figure 5 as a function of the CH4 concentration.
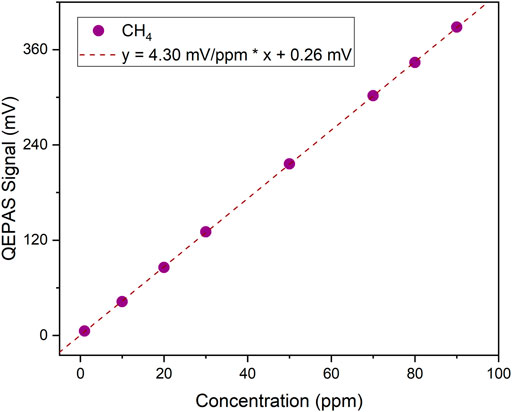
FIGURE 5. QEPAS peak signals as a function of the CH4 concentration (purple dots) and the corresponding best linear fit (purple dashed line).
A linear response of the QEPAS sensor for CH4 detection was observed in the range 1–90 ppm, thus a linear fit was superimposed to the collected data returning a slope of 4.30 mV ppm−1 and an intercept comparable with the noise level. A CH4 minimum detection limit of ∼48 ppb was estimated at 100 ms of integration time, calculated as the expected methane concentration generating a QEPAS signal equal to the noise, i.e., an SNR = 1. An Allan-Werle deviation analysis was performed to estimate the 1σ noise as a function of the lock-in integration time (Giglio et al., 2016). A noise level 0.020 mV at 5 s integration time was achieved, reducing the MDL of one order of magnitude (see Supplementary Figure S2).
Two absorption features of NO and one absorption feature of H2O can be targeted within the emission range of the laser source externally collimated into the sensor S2 (see Figure 2B). As a reference, the absorption cross-section of a gas mixture containing standard air and 500 ppb of NO was simulated using HITRAN database (Gordon et al., 2017) at an operating pressure of 500 Torr. Nitric oxide was not originally included in the standard air sample composition on the HITRAN database, as this gas species does not represent a main constituent of ambient air. Therefore, its spectral contribution was added simulating a specific mixture, whose NO level was set according to the average concentration in polluted areas (World Bank, 1999), although it can vary considerably depending on the pollutant source. As for the data reported in Figure 3, the simulated H2O concentration was 1.86%. The results are shown in Figure 6.
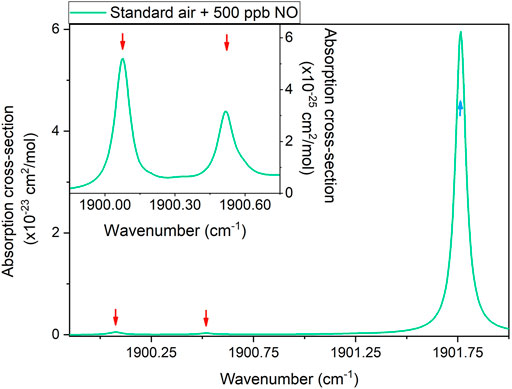
FIGURE 6. Absorption cross-section of modified standard air (United States model, mean latitude, summer enriched with 500 ppb of NO) within the S2 laser source emission range, simulated using HITRAN database. The inset highlights the spectral region between 1899.85 cm−1 and 1900.75 cm−1. Cyan and red arrows indicate water vapor and nitric oxide absorption features, respectively.
The HITRAN simulation returned an intense H2O absorption peak located at 1901.76 cm−1 and two NO absorption features located at 1900.07 cm−1 and 1900.51 cm−1. The peak of the NO absorption feature located at 1900.07 cm−1 was selected to calibrate the sensor S2 for nitric oxide detection. At this wavenumber, an optical power of 17 mW was measured by PM2. The H2O absorption peak located at 1901.76 cm−1 was used to monitor the water vapor level generated by the humidifier inside the gas line. The water vapor and nitric oxide absorption features exhibit Voigt-like line-shapes with comparable Lorentzian (∼0.06 cm−1) and Gaussian (∼0.01 cm−1) widths.
The QEPAS spectra collected targeting H2O and NO in a gas sample containing 5 ppm of NO and 1.8% of H2O in N2 are shown in Figure 7, as representative.
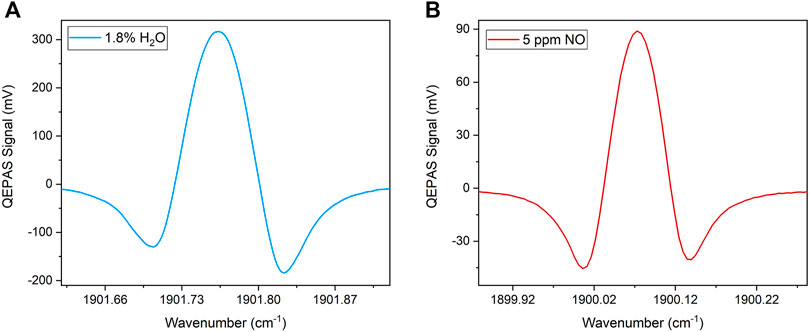
FIGURE 7. 2f-QEPAS spectra collected targeting the absorption features corresponding to (A) 1.8% of H2O and (B) 5 ppm of NO, both in N2.
A 120 mV peak-to-peak modulation amplitude employed for both water vapor and nitric oxide measurements was selected as the one optimizing the NO QEPAS response. In contrast to sensor S1, in sensor S2 the employed modulation returned a similar shape for both the targeted absorption features. Peak signals of 316.79 mV and 88.96 mV were measured for 1.8% of water vapor and 5 ppm of nitric oxide, respectively. The QEPAS signal collected while flowing humidified N2 inside the gas line returned a 1σ noise level of 0.18 mV. Therefore, an SNR of 495 was calculated for NO measurements.
Starting from a gas cylinder with a certified concentration of 10 ppm of NO in N2, several dilutions were generated using the gas blender with a fixed 1.8% water vapor level. The peak signals of the collected NO QEPAS spectra were extracted and are shown in Figure 8.
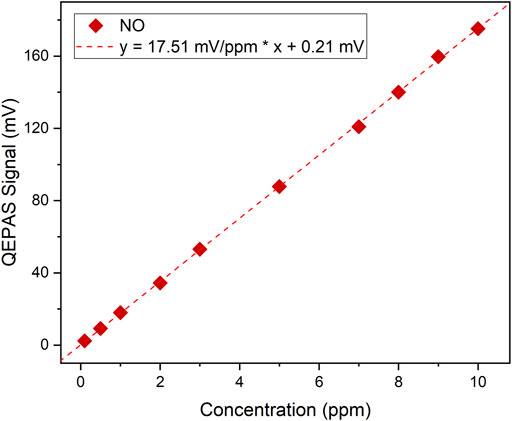
FIGURE 8. QEPAS peak signals as a function of the NO concentration (red diamonds) and the corresponding best linear fit (red dotted line).
A linear fit to the experimental data returns the NO calibration curve with a slope of 17.51 mV ppm−1 and an intercept value comparable with the sensor noise level. As the linear behaviour of sensor S2 was verified, an NO minimum detection limit of ∼11 ppb was estimated at 100 ms of integration time, calculated as the expected nitric oxide concentration generating a QEPAS signal equal to the noise, i.e., an SNR = 1.
As a second step for sensor validation, a simultaneous operation of S1 and S2 was performed. With this aim, two gas mixtures were generated using the gas blender. The gas mixtures were analyzed consecutively while the QEPAS signals generated by both S1 and S2 sensors were collected simultaneously. The results are shown in Figures 9A,B. The QEPAS spectra were acquired employing sawtooth ramps with amplitudes selected to scan the spectral regions reported in Figures 3, 6, and frequencies optimized to start and stop the scans at the same time. The mixtures were composed of a fixed concentration of 1.8% of H2O and 30 ppm of CH4, while the NO concentration in the two samples was 7 ppm (yellow background) and 3 ppm (pink background), respectively.
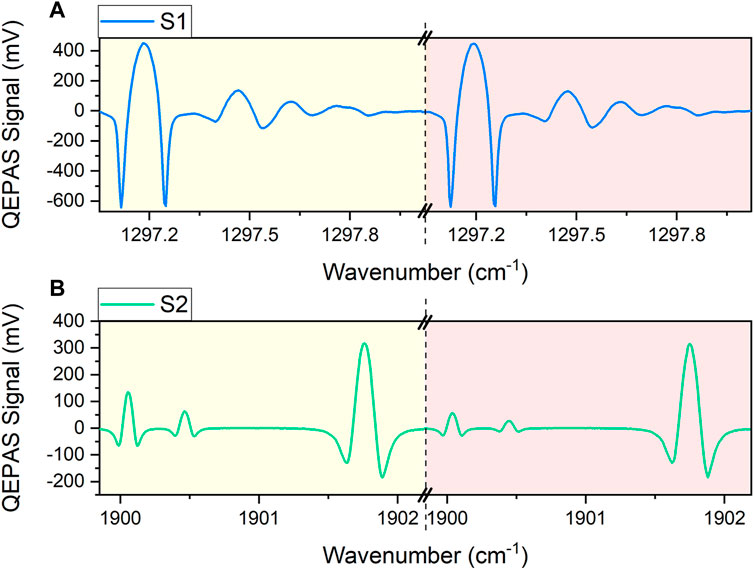
FIGURE 9. QEPAS signals acquired targeting two different gas samples in consecutive acquisitions by simultaneously operating sensors (A) S1 and (B) S2. Spectra of the gas mixture containing 30 ppm of CH4, 1.8% of H2O and 7 ppm of NO, in N2, are shown with a yellow background, while spectra of the gas mixture containing 30 ppm of CH4, 1.8% of H2O and 3 ppm of NO, in N2, are shown with a pink background. The dashed line indicates the end of the sawtooth ramp, corresponding to the change of gas mixture composition.
As in Section 3.1 and Section 3.2, the water vapor concentration was set to a value similar to the one expected in ambient air. The methane and nitric oxide concentrations were selected quite in the middle of the concentration ranges where S1 and S2 linear responsivities were proven, but still at least an order of magnitude greater than their expected values in ambient air. The QEPAS spectral scans collected by sensors S1 and S2 perfectly match the simulations in Figures 3, 6. All the measured peak values are consistent with the results obtained in calibration sections. The performed consecutive acquisitions point out essentially no variations in the H2O and CH4 QEPAS response when varying the NO concentration within the sample, and the QEPAS NO signals scale linearly with the NO concentration in the mixtures as in Section 3.2. Therefore, the S1 and S2 calibrations still apply for mixtures of water, methane, and nitric oxide in nitrogen.
After the validation of the simultaneous operation of the two systems S1 and S2, the QEPAS box operation for methane and nitric oxide atmospheric detection was tested by sampling air from our laboratory. The test operating conditions were the same as for calibration, i.e., pressure p = 500 Torr and flow rate F = 28 sccm. The gas inlet of the QEPAS box was disconnected from the humidifier and laboratory air directly entered the box. A relative humidity of 61% and a temperature of 24°C were measured inside the room using an external hygrometer, thus an absolute concentration of ∼1.8% of water vapor was estimated, similar to the one fixed by the Nafion humidifier during calibration steps. Measurements were performed by setting the sawtooth ramps amplitudes, frequencies and phases optimized to simultaneously scan the water vapor absorption peak by S1 and S2. Seven consecutive spectral scans were acquired. The peak values corresponding to each analyte were extracted from the acquired QEPAS spectra and are shown in Figure 10. The whole measurement lasted about 20 min.
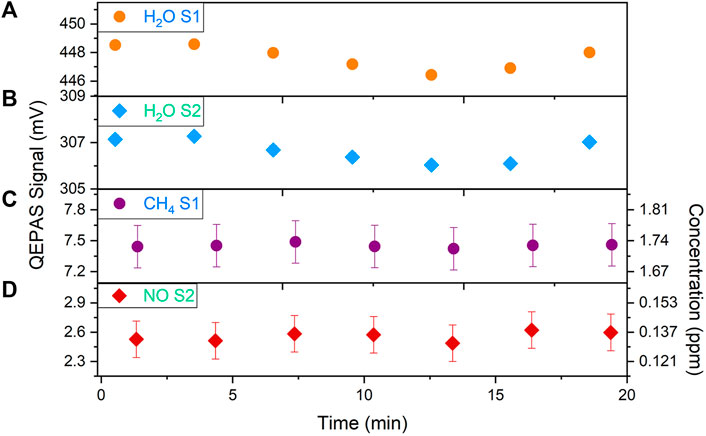
FIGURE 10. QEPAS peak signals extracted by consecutive QEPAS spectra acquired by sampling the air inside the laboratory. Sensor S1 was used to target (A) H2O (orange dots) and (C) CH4 (purple dots), while sensor S2 was used to target (B) H2O (cyan diamonds) and (D) NO (red diamonds). The error bars correspond to the noise fluctuations.
In Figures 10A,B the H2O peak signals measured by S1 and S2 show a slight decrease from 1 to 13 min followed by a slight increase up to the last scan point. The observation of the same trend using two different systems confirms the reliability of the developed sensor. The average H2O QEPAS signals were 447.65 ± 1.08 mV and 306.66 ± 0.63 mV, respectively. A relative fluctuation of the water vapor signal of ∼0.2% was estimated. The average measured CH4 QEPAS signal shown in Figure 10C was 7.45 ± 0.03 mV, corresponding to a CH4 concentration of ∼1.73 ppm inside the room. This value is consistent with the expected methane concentration in atmosphere (EPA USEPA, 2021), which can be taken as a reference due to the absence of other CH4 sources in the environment. The NO peak signals extracted by the QEPAS spectra collected by sensor S2 and shown in Figure 10D highlight the presence of this gas species in the environment, with a stable concentration. The average measured QEPAS signal was 2.56 ± 0.13 mV, corresponding to an NO concentration of ∼0.134 ppm inside the room, in any case lower than the polluted air-values reported in literature (World Bank, 1999; Jarvis et al., 2010; Shi et al., 2017). It is worth noticing that, although the presence of water vapor in air affects the non-radiative energy relaxation processes of both methane and nitric oxide, the peaks extracted from the QEPAS signals acquired for these two gases do not follow the trend of the water vapor. This can be explained by considering that a relative variation of ±0.2% of the water vapor signal produces a negligible effect on the CH4 and NO signal.
A compact QEPAS-based sensor box for simultaneous detection of methane and any targetable gas molecule exhibiting absorption features in the infrared spectral range is reported. The sensor architecture was designed in order to flush the gas sample through the two detection systems exploiting two similar ADMs. The first system, S1, is a complete, rugged QEPAS sensor for methane detection, including a laser source with center emission wavelength of 7.719 µm. The second one, S2, does not include the laser source, which should be selected ad-hoc, depending on the gas molecule to be targeted, and optically coupled through an aperture on the sensor side box panel. Along with the hardware set-up, a dedicated LabVIEW-based software was designed and developed to drive the electronic components and manage the S1 and S2 signals.
The developed sensor was tested for methane and nitric oxide detection in air. S1 and S2 were first calibrated independently. Sensitivities of 4.30 mV ppm−1 and 17.51 mV ppm−1 and minimum detection limits of 48 ppb and 11 ppb at 100 ms lock-in integration time were obtained for S1 and S2, respectively. S1 and S2 also allowed the measurement of the QEPAS signals related to two absorption lines of water. No crosstalk effects were observed when S1 and S2 were operated simultaneously. The QEPAS box was employed to measure the methane and nitric oxide concentration in air, while monitoring the humidity level. During a 20 minutes-long acquisition, the water vapor signal trend exhibited a slight fluctuation, too small to cause variations of methane and nitric oxide signal levels. Average concentrations of 1.73 ppm of CH4, 0.134 ppm of NO and 1.8% of H2O were measured in the laboratory air.
The raw data supporting the conclusion of this article will be made available by the authors, without undue reservation.
AZ, GM: sensor design and development, data acquisition, data analysis, writing the original draft. These authors contributed equally. MG: sensor design and development, data acquisition, data analysis, writing the original draft, funding support. AE: sensor development, revising the manuscript. ASu: sensor development, revising the manuscript, funding support. SF, WC: revising the manuscript. QW: revising the manuscript, funding support. ASa, PP, VS.: supervision, revising the manuscript, funding support.
Authors from Dipartimento Interateneo di Fisica di Bari acknowledge funding from the European Union’s Horizon 2020 Research and Innovation Program under grant agreement No. 101016956 PASSEPARTOUT. MG acknowledges POR PUGLIA FESR-FSE 2014/2020—Asse X—Azione 10.4. Research for Innovation—REFIN. ASu acknowledges the financial support from the European Union’s Horizon 2020 Research and Innovation Program under the Marie Skłodowska-Curie project OPTAPHI, grant No. 860808. QW acknowledges National Research Foundation Singapore Programme (NRF-CRP18-2017–02); National Research Foundation Singapore programme (NRF–CRP19–2017–01); Ministry of Education Tier two programme (MOE-T2EP50120-0009), and A*STAR grant A2090b0144.
The authors declare that the research was conducted in the absence of any commercial or financial relationships that could be construed as a potential conflict of interest.
All claims expressed in this article are solely those of the authors and do not necessarily represent those of their affiliated organizations, or those of the publisher, the editors and the reviewers. Any product that may be evaluated in this article, or claim that may be made by its manufacturer, is not guaranteed or endorsed by the publisher.
Authors from Dipartimento Interateneo di Fisica di Bari acknowledge THORLABS GmbH within the PolySenSe joint-research laboratory.
The Supplementary Material for this article can be found online at: https://www.frontiersin.org/articles/10.3389/fenvc.2022.926233/full#supplementary-material
Aldhafeeri, T., Tran, M.-K., Vrolyk, R., Pope, M., and Fowler, M. (2020). A Review of Methane Gas Detection Sensors: Recent Developments and Future Perspectives. Inventions 5, 28. doi:10.3390/INVENTIONS5030028
Atkinson, R. (2000). Atmospheric Chemistry of VOCs and NOx. Atmos. Environ. 34, 2063–2101. doi:10.1016/S1352-2310(99)00460-4
Badr, O., Probert, S. D., and O'Callaghan, P. W. (1991). Atmospheric Methane: Its Contribution to Global Warming. Appl. Energy 40, 273–313. doi:10.1016/0306-2619(91)90021-O
Bhattarai, H. R., Marushchak, M. E., Ronkainen, J., Lamprecht, R. E., Siljanen, H. M. P., Martikainen, P. J., et al. (2022). Emissions of Atmospherically Reactive Gases Nitrous Acid and Nitric Oxide from Arctic Permafrost Peatlands. Environ. Res. Lett. 17, 024034. doi:10.1088/1748-9326/AC4F8E
Birrell, M. A., McCluskie, K., Hardaker, E., Knowles, R., and Belvisi, M. G. (2006). Utility of Exhaled Nitric Oxide as a Noninvasive Biomarker of Lung Inflammation in a Disease Model. Eur. Respir. J. 28, 1236–1244. doi:10.1183/09031936.00048506
Chen, Y., Soskind, M., McSpiritt, J., Liu, J., Wang, R., Li, N., et al. (2021). Fugitive Methane Detection Using Open-Path Stand-Off Chirped Laser Dispersion Spectroscopy. Opt. Lett. 46, 3005. doi:10.1364/OL.427837
de Lacy Costello, B. P. J., Ledochowski, M., and Ratcliffe, N. M. (2013). The Importance of Methane Breath Testing: A Review. J. Breath. Res. 7, 024001. doi:10.1088/1752-7155/7/2/024001
Deng, B., Sima, C., Xiao, Y., Wang, X., Ai, Y., Li, T., et al. (2022). Modified Laser Scanning Technique in Wavelength Modulation Spectroscopy for Advanced TDLAS Gas Sensing. Opt. Lasers Eng. 151, 106906. doi:10.1016/J.OPTLASENG.2021.106906
Dong, L., Spagnolo, V., Lewicki, R., and Tittel, F. K. (2011). Ppb-Level Detection of Nitric Oxide Using an External Cavity Quantum Cascade Laser Based QEPAS Sensor. Opt. Express 19 (24), 24037–24045. doi:10.1364/OE.19.024037
Elefante, A., Menduni, G., Rossmadl, H., Mackowiak, V., Giglio, M., Sampaolo, A., et al. (2020). Environmental Monitoring of Methane with Quartz-Enhanced Photoacoustic Spectroscopy Exploiting an Electronic Hygrometer to Compensate the H2O Influence on the Sensor Signal. Sensors 20, 2935. doi:10.3390/s20102935
EPA USEPA (2021). Climate Change Indicators: Atmospheric Concentrations of Greenhouse Gases | US EPA. Available at: https://www.epa.gov/climate-indicators/climate-change-indicators-atmospheric-concentrations-greenhouse-gases (Accessed March 9, 2022).
Giglio, M., Elefante, A., Patimisco, P., Sampaolo, A., Sgobba, F., Rossmadl, H., et al. (2019). Quartz-Enhanced Photoacoustic Sensor for Ethylene Detection Implementing Optimized Custom Tuning Fork-Based Spectrophone. Opt. Express 27, 4271. doi:10.1364/oe.27.004271
Giglio, M., Patimisco, P., Sampaolo, A., Scamarcio, G., Tittel, F. K., and Spagnolo, V. (2016). Allan Deviation Plot as a Tool for Quartz-Enhanced Photoacoustic Sensors Noise Analysis. IEEE Trans. Ultrason. Ferroelectr. Freq. Contr. 63, 555–560. doi:10.1109/TUFFC.2015.2495013
Giglio, M., Zifarelli, A., Sampaolo, A., Menduni, G., Elefante, A., Blanchard, R., et al. (2020). Broadband Detection of Methane and Nitrous Oxide Using a Distributed-Feedback Quantum Cascade Laser Array and Quartz-Enhanced Photoacoustic Sensing. Photoacoustics 17, 100159. doi:10.1016/j.pacs.2019.100159
Gohlke, R. S., and McLafferty, F. W. (1993). Early Gas Chromatography/Mass Spectrometry. J. Am. Soc. Mass Spectrom. 4, 367–371. doi:10.1016/1044-0305(93)85001-E
Gordon, I. E., Rothman, L. S., Hill, C., Kochanov, R. V., Tan, Y., Bernath, P. F., et al. (2017). The HITRAN2016 Molecular Spectroscopic Database. J. Quant. Spectrosc. Radiat. Transf. 203, 3–69. doi:10.1016/j.jqsrt.2017.06.038
Guth, U., Vonau, W., and Zosel, J. (2009). Recent Developments in Electrochemical Sensor Application and Technology-A Review. Meas. Sci. Technol. 20, 042002. doi:10.1088/0957-0233/20/4/042002
Han, S., Bian, H., Feng, Y., Liu, A., Li, X., Zeng, F., et al. (2011). Analysis of the Relationship between O3, NO and NO2 in Tianjin, China. Aerosol Air Qual. Res. 11, 128–139. doi:10.4209/aaqr.2010.07.0055
Holmes, C. D. (2018). Methane Feedback on Atmospheric Chemistry: Methods, Models, and Mechanisms. J. Adv. Model. Earth Syst. 10, 1087–1099. doi:10.1002/2017MS001196
Hu, L., Zheng, C., Zhang, Y., Zheng, J., Wang, Y., and Tittel, F. K. (2020). Compact All-Fiber Light-Induced Thermoelastic Spectroscopy for Gas Sensing. Opt. Lett. 45 (7), 1894–1897. doi:10.1364/OL.388754
Jahjah, M., Ren, W., Stefański, P., Lewicki, R., Zhang, J., Jiang, W., et al. (2014). A Compact QCL Based Methane and Nitrous Oxide Sensor for Environmental and Medical Applications. Analyst 139, 2065–2069. doi:10.1039/c3an01452e
Jarvis, D. J., Adamkiewicz, G., Heroux, M.-E., Rapp, R., and Kelly, F. J. (2010). “Nitrogen Dioxide - WHO Guidelines for Indoor Air Quality: Selected Pollutants - NCBI Bookshelf,” in WHO Guidelines for Indoor Air Quality: Selected Pollutants (Geneva: World Health Organization). Available at: https://www.ncbi.nlm.nih.gov/books/NBK138707/(Accessed March 1, 2022).
Johnson, M. R., Tyner, D. R., and Szekeres, A. J. (2021). Blinded Evaluation of Airborne Methane Source Detection Using Bridger Photonics LiDAR. Remote Sens. Environ. 259, 112418. doi:10.1016/J.RSE.2021.112418
Li, J. S., Chen, W., and Fischer, H. (2013). Quantum Cascade Laser Spectrometry Techniques: A New Trend in Atmospheric Chemistry. Appl. Spectrosc. Rev. 48, 523–559. doi:10.1080/05704928.2012.757232
Lu, R. Q., Luo, S. X. L., He, Q., Concellón, A., and Swager, T. M. (2021). Methane Detection with a Tungsten-Calix[4]arene-Based Conducting Polymer Embedded Sensor Array. Adv. Funct. Mat. 31, 2007281. doi:10.1002/ADFM.202007281
Luo, P., Harrist, J., Menduni, G., Mesdour, R., StMichel, N., and Sampaolo, A. (2022). Simultaneous Detection of Methane, Ethane, and Propane by QEPAS Sensors for On-Site Hydrocarbon Characterization and Production Monitoring. ACS Omega 7, 3395–3406. doi:10.1021/acsomega.1c05645
Moore, C. W., Zielinska, B., Pétron, G., and Jackson, R. B. (2014). Air Impacts of Increased Natural Gas Acquisition, Processing, and Use: A Critical Review. Environ. Sci. Technol. 48, 8349–8359. doi:10.1021/ES4053472
Nikolic, M. V., Milovanovic, V., Vasiljevic, Z. Z., and Stamenkovic, Z. (2020). Semiconductor Gas Sensors: Materials, Technology, Design, and Application. Sensors 20, 6694. doi:10.3390/s20226694
Pal, M., and Pradhan, M. (2020). Exhaled Breath CH4 and H2S Sensing Using Mid-IR Quantum Cascade Laser (QCL). Springer Proc. Phys. 249, 83–90. doi:10.1007/978-981-15-6467-3_11
Patimisco, P., Sampaolo, A., Dong, L., Tittel, F. K., and Spagnolo, V. (2018). Recent Advances in Quartz Enhanced Photoacoustic Sensing. Appl. Phys. Rev. 5, 011106. doi:10.1063/1.5013612
Patimisco, P., Sampaolo, A., Giglio, M., dello Russo, S., Mackowiak, V., Rossmadl, H., et al. (2019). Tuning Forks with Optimized Geometries for Quartz-Enhanced Photoacoustic Spectroscopy. Opt. Express 27, 1401. doi:10.1364/oe.27.001401
Patimisco, P., Sampaolo, A., Zheng, H., Dong, L., Tittel, F. K., and Spagnolo, V. (2017). Quartz–Enhanced Photoacoustic Spectrophones Exploiting Custom Tuning Forks: A Review. Adv. Phys. X 2, 169–187. doi:10.1080/23746149.2016.1271285
Sampaolo, A., Patimisco, P., Giglio, M., Zifarelli, A., Wu, H., Dong, L., et al. (2021). Quartz-Enhanced Photoacoustic Spectroscopy for Multi-Gas Detection: A Review. Anal. Chim. Acta 1202, 338894. doi:10.1016/j.aca.2021.338894
Sandoval-Bohorquez, V. S., Rozo, E. A. V., and Baldovino-Medrano, V. G. (2020). A Method for the Highly Accurate Quantification of Gas Streams by On-Line Chromatography. J. Chromatogr. A 1626, 461355. doi:10.1016/J.CHROMA.2020.461355
Schulze, E. D., Luyssaert, S., Luyssaert, S., Ciais, P., Freibauer, A., Janssens, I. A., et al. (2009). Importance of Methane and Nitrous Oxide for Europe’s Terrestrial Greenhouse-Gas Balance. Nat. Geosci. 2, 842–850. doi:10.1038/ngeo686
Shi, C., Wang, D., Wang, Z., Ma, L., Wang, Q., Xu, K., et al. (2017). A Mid-Infrared Fiber-Coupled QEPAS Nitric Oxide Sensor for Real-Time Engine Exhaust Monitoring. IEEE Sens. J. 17, 7418–7424. doi:10.1109/JSEN.2017.2758640
Silva Minini Baiense, K. M., Linhares, F. G., Teves Inácio, C., Sthel, M. S., Vargas, H., and da Silva, M. G. (2021). Photoacoustic-Based Sensor for Real-Time Monitoring of Methane and Nitrous Oxide in Composting. Sensors Actuators B Chem. 341, 129974. doi:10.1016/j.snb.2021.129974
Venterea, R. T., Burger, M., and Spokas, K. A. (2005). Nitrogen Oxide and Methane Emissions under Varying Tillage and Fertilizer Management. J. Environ. Qual. 34, 1467–1477. doi:10.2134/jeq2005.0018
Wang, G., Shen, F., Yi, H., Hubert, P., Deguine, A., Petitprez, D., et al. (2018). Laser Absorption Spectroscopy Applied to Monitoring of Short-Lived Climate Pollutants (SLCPs). J. Mol. Spectrosc. 348, 142–151. doi:10.1016/J.JMS.2018.03.015
Wang, J., Xu, R., Xia, Y., and Komarneni, S. (2021). Ti2CTx MXene: A Novel P-Type Sensing Material for Visible Light-Enhanced Room Temperature Methane Detection. Ceram. Int. 47, 34437–34442. doi:10.1016/J.CERAMINT.2021.08.357
World Bank (1999). “Pollution Prevention and Abatement Handbook, 1998,” in Pollution Prevention and Abatement Handbook, 1998 (Washington, DC: The World Bank). doi:10.1596/0-8213-3638-X
Wu, X., Sang, J., Zhou, S., and Li, J. (2021). High Sensitivity Open‐Path Gas Sensor Based on a Triangular Multi‐pass Cell. Micro Opt. Tech Lett. 63, 2510–2516. doi:10.1002/mop.32949
Xu, L., Liu, N., Zhou, S., Zhang, L., Yu, B., Fischer, H., et al. (2020). Dual-Frequency Modulation Quartz Crystal Tuning Fork-Enhanced Laser Spectroscopy. Opt. Express 28 (4), 5648–5657. doi:10.1364/OE.386205
Keywords: methane detection, infrared spectroscopy, quartz-enhanced photoacoustic spectroscopy, nitric oxide detection, environmental monitoring
Citation: Zifarelli A, Menduni G, Giglio M, Elefante A, Sukhinets A, Sampaolo A, Patimisco P, Fangyuan S, Chongwu W, Wang QJ and Spagnolo V (2022) Compact and Versatile QEPAS-Based Sensor Box for Simultaneous Detection of Methane and Infrared Absorber Gas Molecules in Ambient Air. Front. Environ. Chem. 3:926233. doi: 10.3389/fenvc.2022.926233
Received: 22 April 2022; Accepted: 23 May 2022;
Published: 14 June 2022.
Edited by:
Lingxin Chen, Chinese Academy of Sciences, ChinaReviewed by:
Chuantao Zheng, Jilin University, ChinaCopyright © 2022 Zifarelli, Menduni, Giglio, Elefante, Sukhinets, Sampaolo, Patimisco, Fangyuan, Chongwu, Wang and Spagnolo. This is an open-access article distributed under the terms of the Creative Commons Attribution License (CC BY). The use, distribution or reproduction in other forums is permitted, provided the original author(s) and the copyright owner(s) are credited and that the original publication in this journal is cited, in accordance with accepted academic practice. No use, distribution or reproduction is permitted which does not comply with these terms.
*Correspondence: Marilena Giglio, bWFyaWxlbmEuZ2lnbGlvQHBvbGliYS5pdA==
†These authors have contributed equally to this work
Disclaimer: All claims expressed in this article are solely those of the authors and do not necessarily represent those of their affiliated organizations, or those of the publisher, the editors and the reviewers. Any product that may be evaluated in this article or claim that may be made by its manufacturer is not guaranteed or endorsed by the publisher.
Research integrity at Frontiers
Learn more about the work of our research integrity team to safeguard the quality of each article we publish.