
94% of researchers rate our articles as excellent or good
Learn more about the work of our research integrity team to safeguard the quality of each article we publish.
Find out more
ORIGINAL RESEARCH article
Front. Environ. Chem. , 22 June 2022
Sec. Inorganic Pollutants
Volume 3 - 2022 | https://doi.org/10.3389/fenvc.2022.803944
This article is part of the Research Topic Advances in Metals and Trace Elements Isotopes Measurements, Experiments and Application in Environmental Sciences View all 6 articles
 Viet Quoc Pham1,2*
 Catherine Jeandel1*
 Melanie Grenier1
 Sophie Cravatte1
 Gerard Eldin1Moustafa Belhadj1
 Cyril Germineaud3
 Tu Van Vu2
Significant progress has been made in the last decade on the understanding of the role of the Coral and Solomon Seas as major suppliers of waters and chemical elements to the equatorial Pacific. Yet, the location, depth, and processes of chemical enrichment of these waters remain poorly constrained. Neodymium (Nd) isotopic compositions (
The Equatorial Pacific is an important oceanic area for the atmosphere-ocean carbon dioxide (CO2) exchange. In its eastern part, upwelling and degassing of CO2-rich cold deep waters act as a CO2 source to the atmosphere (Takahashi et al., 1993; Radenac et al., 2012). Besides, while the equatorial surface waters are rich in macronutrients (as NO3− or PO43), the chlorophyll level stay low up to the Galapagos islands (Radenac et al., 2012). Thus, most of the western and central equatorial Pacific is considered as a “High Nutrient Low Chlorophyll” area. This low productivity is explained by the fact that the surface waters are depleted in elements essential for the phytoplankton growth -such as Fe, Ni, Cu, Co, Cd, Zn, also called micronutrients (Pitchford and Brindley, 1999; Ryan et al., 2006; Boyd et al., 2007; Venables and Moore, 2010). These essential elements are lithogenic, i.e., they have a terrestrial source.
Nutrient depletion in the equatorial Pacific surface waters is attributed to the remote locations of their sources. By contrast, the Equatorial UnderCurrent (EUC), a current vein confined in the equatorial band is enriched in macro- and micronutrients (Slemons et al., 2010). The EUC starts at about 200 m depth in the west (at 156°E; Grenier et al., 2011) and progressively upwells while flowing eastwards, to eventually reach the surface in the eastern equatorial “cold tongue” and fertilize the area (Tsuchiya et al., 1989). This dynamic is the main cause of the west-east gradient of productivity. In its western part, the EUC is mostly fed by waters originating from the low-latitude western boundary currents, in majority from the southern hemisphere, from waters flowing along the North Australian and Papua New Guinea coasts (Grenier, 2012; Grenier et al., 2013; Grenier et al., 2014). Because of the high weathering rates and the occurrence of strong boundary currents flowing along these coasts (Milliman, 1995; Cravatte et al., 2011), it is strongly suspected that sediments freshly deposited along the coasts and margins of the southwest Pacific lands are a source of lithogenic elements to the EUC (e.g., Johnson et al., 1999; Lacan and Jeandel, 2001; Filippova et al., 2017; Behrens et al., 2020).
The use of rare earth element concentrations (REE) and neodymium isotopic compositions (Nd-IC) in marine geochemistry has been conducted for more than 30 years (Jeandel, 1993; Sholkovitz et al., 1999; Elderfield et al., 2006; Stichel et al., 2012; Stichel et al., 2015; Fröllje et al., 2016; Behrens et al., 2018a; Behrens et al., 2018b; Lambelet et al., 2018; Amakawa et al., 2019; Pham et al., 2019; Stichel et al., 2020; Rahlf et al., 2021). The isotopic composition of Nd is a very powerful tracer that allows the characterization of the sources of lithogenic elements to the ocean. One of the seven Nd isotopes, 143Nd, is formed by α-decay of 147Sm. The Sm abundance in rocks is strongly linked to their nature and chemical composition. Consequently, its natural abundance varies and depends on the time-integrated Sm/Nd ratio of the rock from which the Nd is derived. This variation is expressed as
where CHUR stands for chondritic uniform reservoir and represents the modelized average earth value, presently 0.512630 ± 11 (2σm,Bouvier et al., 2008).
Several current veins come together to form the EUC. This current is enriched in macro- and micronutrients, properties acquired while flowing along the Southwest Pacific coasts. Boundary Exchange (BE) is suspected to be the enrichment mechanism (Lacan and Jeandel, 2001; Lacan and Jeandel, 2005; Grenier et al., 2013; Behrens et al., 2020). This term was used to state that when a water flows along a margin, its Nd isotopic signature could be modified by Nd inputs released from the benthic sediments even if its Nd concentration does not (or barely) change. This means that Nd release is followed by Nd scavenging, at a time scale that still needs to be determined. One of the basic conditions to observe BE is that, upstream the contact with the margin sediment, the water mass has a different Nd-IC from the Nd-IC of the margin sediment (Arsouze et al., 2007). If both Nd-IC are the same, it does not preclude BE to occur but it is not observable with Nd parameters. However, this definition results from observations and does not designate a specific process as underlined by Lacan and Jeandel, (2005). Instead, Jeandel, (2016) suggests that BE comprises the mechanisms allowing land-to-ocean inputs of elements along the oceanic margins (e.g. reductive or non-reductive sediment dissolution, diagenetic pore water fluxes, processes inside intermediate or benthic nepheloid layer; Homoky et al., 2013; Labatut et al., 2014; Homoky et al., 2016) competing the mechanisms that would subtract elements from the seawater (e.g., via boundary scavenging processes which themselves comprise adsorption or precipitation on resuspended reactive particles or during diagenetic processes). In addition, Abbott (2019) suggested that BE processes are occurring not only along the margins but also in the sediments that line the bottom of the abyss. Boundary Exchange resulting net fluxes should be positive when Nd release from the sediment is greater than Nd removal by scavenging, and negative in the opposite case. The exchanged flux cannot be quantified with the concentration only, it requires the complementary information brought by the isotopes (Jeandel, 2016; Jeandel and Vance, 2018).
Located at the western South Pacific boundary between 10°S and 5°S, the Solomon Sea connects the tropical and equatorial regions (Figure 1). It is a semi-enclosed sea characterized by a complicated bathymetry and a complex circulation, with the convergence of several water masses within strong boundary currents (Lindstrom et al., 1987; Germineaud et al., 2016). Therefore, waters flowing through the Solomon Sea are subject to many potential chemical inputs. Volcanic islands in this region are young and subject to extreme weather conditions favourable to generate substantial lithogenic weathering and transport of weathered products via diffuse surface run-off and rivers such as the Sepik and Fly (Milliman et al., 1999; Sholkovitz et al., 1999). Another possible source of lithogenic material could be attributed to extractive activities: dust originating from mining heap and muddy mine wastes could represent a significant source of terrigenous sediment to the Solomon Sea. Figure 4A displays location of some large mines in islands surrounding the Solomon Sea. Most of these mines are in operation, as for example Lihir mine in Lihir Island (https://www.mining-technology.com/projects/lihir-gold-mine/), Kolosori mine in Isabel Island (https://miningdataonline.com/property/1420/Kolosori-Project.aspx) or Edie Creek in Papua New Guinea (https://www.niuminco.com.au/current-operations.html). Other mines have been closed due to their environmental and societal impacts, e.g.: the Gold Ridge Mine. However, the latter (and others) will likely be exploited again soon due to their resource potential (https://www.abc.net.au/news/2019-10-30/china-cites-early-harvest-benefits-in-guadalcanal-deal/11654596).
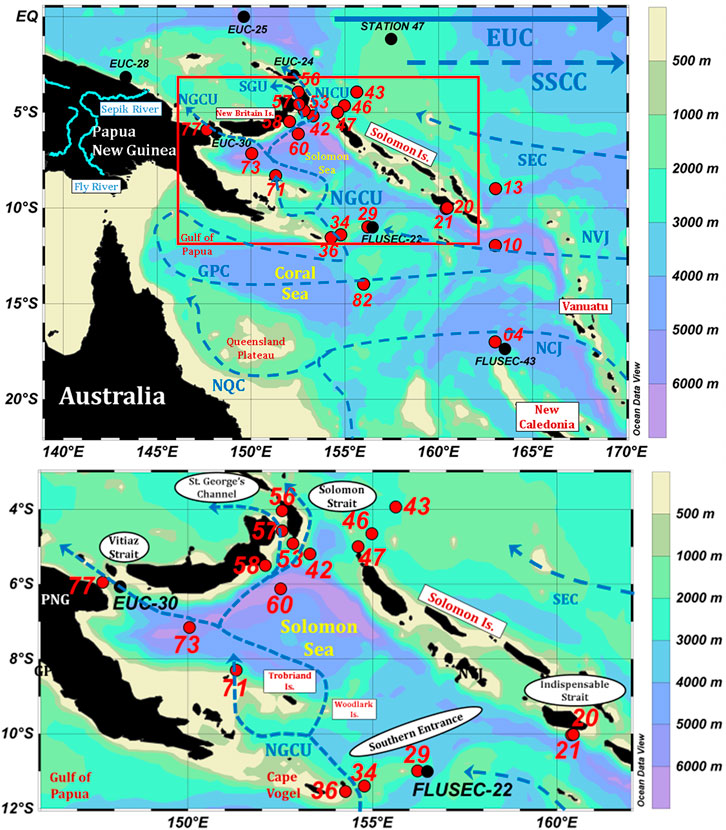
FIGURE 1. Sample location map. The bottom panel zooms in the Solomon Sea, correspond to the red rectangle in the upper panel. PANDORA sampling locations are highlighted by red dots and numbers. Samples analyzed in previous works are reported, highlighted by black circles and station annotation. Those samples belong to five stations corresponding to EUC-Fe and FLUSEC-01 cruises (EUC-24, EUC-25, EUC-28, FLUSEC-22 and FLUSEC-43), studied by Grenier et al. (2013) and one station (Station 47) corresponding to CASSIOPEE cruise, studied by Behrens et al. (unpublished). Dashed arrows represent the main currents flowing in the Southwest Pacific Ocean (Grenier et al., 2011, 2013). EUC, Equatorial Undercurrent; SSCC, South Subsurface Countercurrent; SEC, South Equatorial Current; NVJ, North Vanuatu Jet; NCJ, North Caledonian Jet; NQC, North Queensland Current; GPC, Gulf of Papua Current; NGCU, New Guinea Coastal Undercurrent; NICU, New Ireland Coastal Undercurrent; SGU, St. George’s Undercurrent.
Pham et al. (2019) described and quantified the modification of dissolved REE during the transit of water through the Solomon Sea. These authors identified the basaltic footprint in the dissolved REE enrichment observed in the surface waters. They also revealed a significant Nd enrichment in the lower thermocline layer that further feeds the EUC. However, since the Nd isotopic compositions were not available at the time of this first study, Pham et al. (2019) could not work more closely on the dissolved-particle exchange processes. The present study combines new Nd isotopic composition (Nd-IC,
The PANDORA cruise (GEOTRACES cruise GP12, Ganachaud et al., 2017) took place within the Solomon Sea from June 26th to August 07th, 2012 onboard the R/V L’Atalante (https://www.bodc.ac.uk/geotraces/cruises/programme/). The cruise followed a latitudinal transect along 163°E between 18°S and 9°S to document the westward South Equatorial Current (SEC) branches entering into the Coral Sea, including the North Caledonian and North Vanuatu Jets, NCJ and NVJ, respectively (Kessler and Cravatte, 2013a). After crossing the Indispensable Strait, the cruise surveyed the whole “Southern Entrance” of the Solomon Sea, joined the western area of the Gulf of Papua New Guinea (PNG) between 155° and 161°S along ∼11°S, crossed the Solomon Sea again to document its central part and eventually explored the three exits: Vitiaz Strait, St. George’s Channel and Solomon Strait (Figure 1, Ganachaud et al., 2017).
Samples for Nd-IC and [REE] were collected at 21 stations (twenty filtered and one unfiltered) (Table 1; Ganachaud et al., 2017). The unfiltered samples from station 82 were used for reproducibility tests only. Samples were collected in the core of the water masses encountered at each station using 12 L-Niskin bottles mounted on a CTD/rosette system. As soon as collected, the samples were filtered through 0.45 µm pore size, 47 mm diameter SUPOR® membranes. An aliquot of 0.5 L was transferred into pre-cleaned low-density polyethylene (LDPE) bottles and preserved for dissolved REE analyses, data published in (Pham et al., 2019) and are freely accessible. (https://www.bodc.ac.uk/geotraces/). The remaining volume (11 L) was dedicated to the Nd isotope extraction.
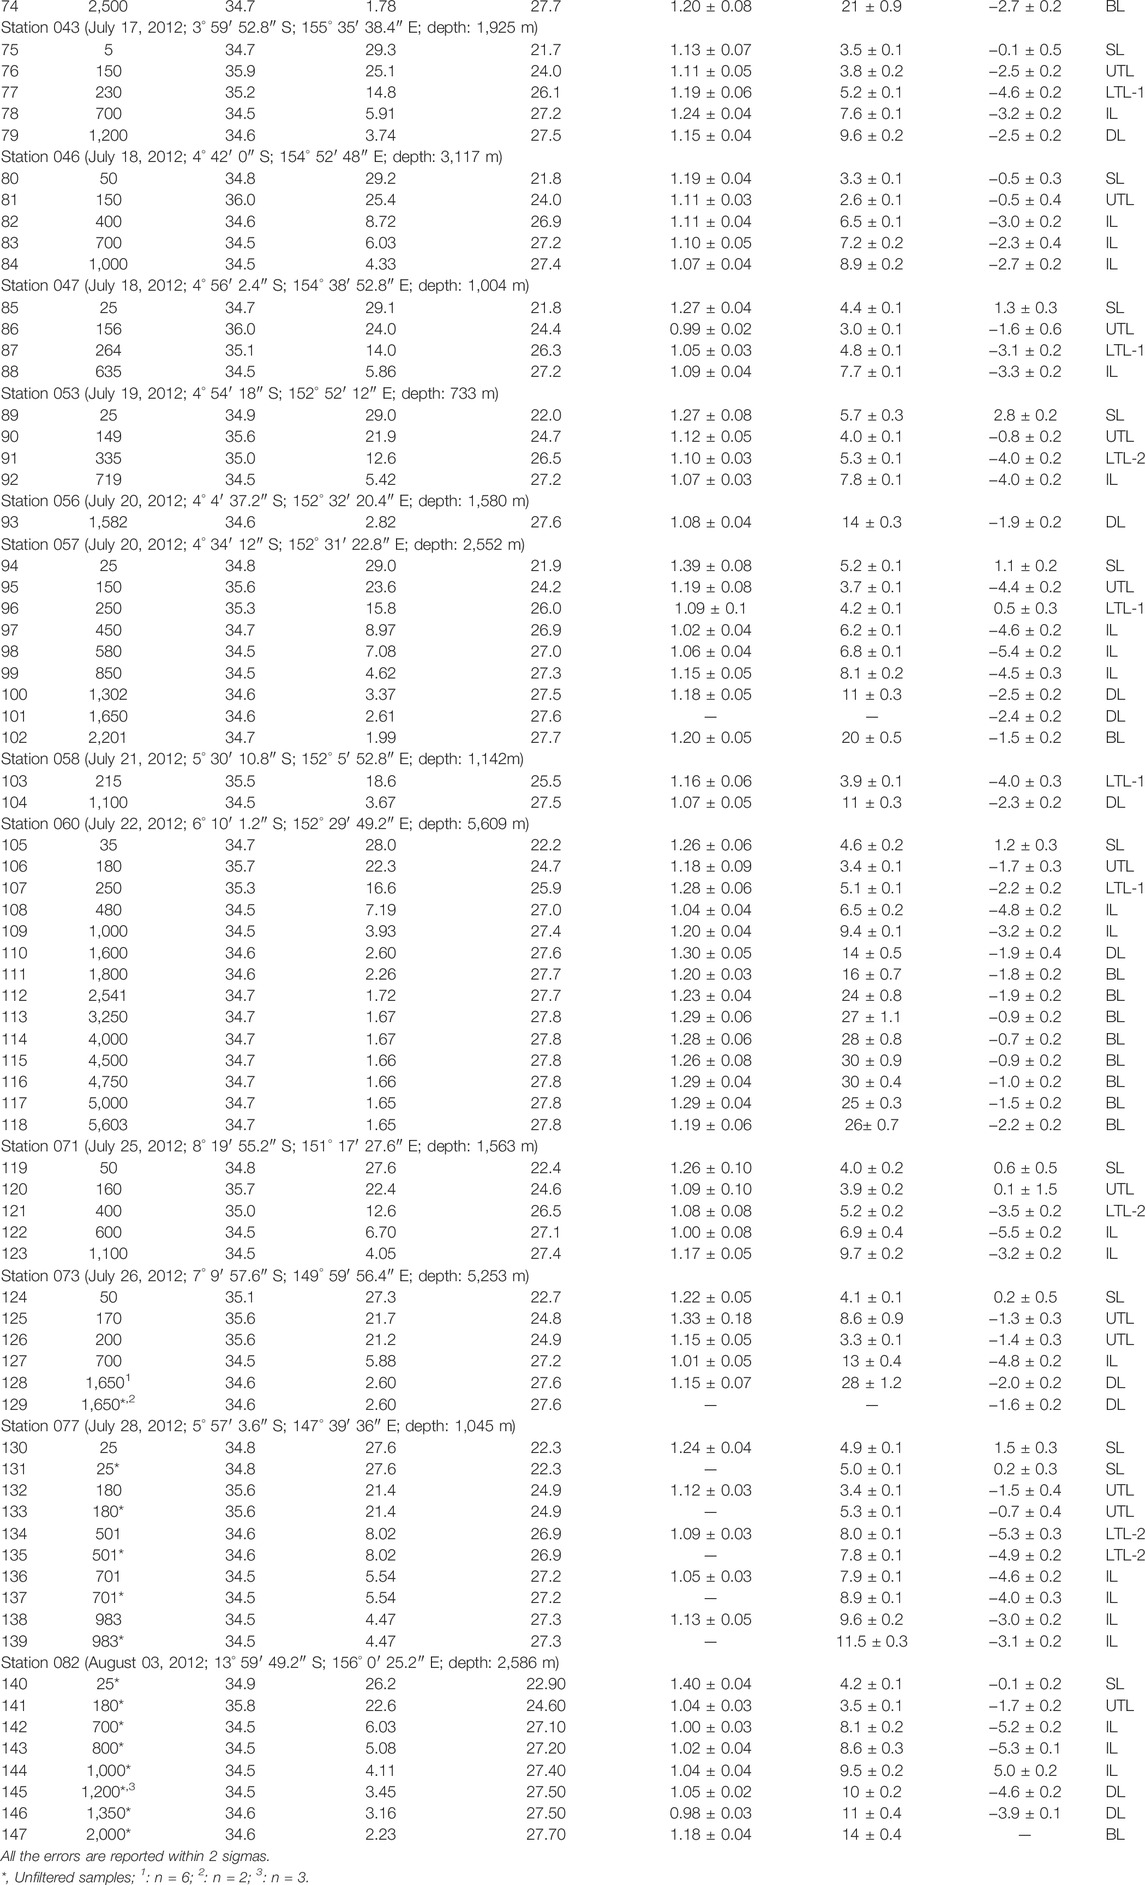
TABLE 1. Location, depth, hydrological properties, Eu anomaly, Nd concentration, Nd-IC (143Nd/144Nd) and
On board, the pH of each sample dedicated to the Nd-IC determination was raised to 3.4–3.7 with the addition of a small volume of suprapur NH4OH (Merck®) prior to be passed through the preconcentration system, made of two pre-cleaned C18 cartridges packed with 300 mg of the complexing mixture of 65% bi (2-ethylhexyl) hydrogen phosphate (HDEHP) and 35% 2-ethylhexyl dihydrogen phosphate (H2MEHP; Shabani et al., 1992; Tachikawa et al., 1999). Samples were pumped through the cartridge at a flow rate of 20 ml/min using a peristaltic pump. The Nd present in the sample was quantitatively adsorbed by the complexing agent while major ions and a large amount of the barium present in seawater were drained (Shabani et al., 1992; Tachikawa et al., 1999). Cartridges were then disconnected from the circuit, sealed with Parafilm®, and stored in a clean plastic bag.
Back to the land-based laboratory, REEs include Nd were eluted from the C18 cartridges. Approximately 5 ml of 0.01 M HCl was first passed through the cartridge at 5 ml/min to remove the remaining major salts including barium. Then, 20 ml of 6 M HCl was passed at the same flow rate to elute the REEs (and/or remaining traces of other elements) into a PTFE vial (Jeandel et al., 1998). The eluted solution was evaporated to almost dryness and 2 ml of aqua regia was added to remove any organic matter. The resulting solution was placed on a hot plate at 120°C overnight and evaporated to dryness. Subsequently, two chemical extractions were performed to purify Nd from other REEs: 1) a chromatographic extraction using a cationic column containing 1.5 ml of Dowex AG50W-X8 resin (200–400 mesh), to separate the REEs from the remaining matrix (Tachikawa et al., 1999), and 2) a separation of Nd from other REEs using a quartz column packed with 400 mg of Ln-spec resin (140–270 mesh; Pin and Santos Zalduegui, 1997). The eluted solution was then evaporated gradually to a small drop of 1–2 µl for the mass spectrometry measurement.
The isotopic compositions of Nd were measured on the Thermo-Ionization Mass Spectrometer (TIMS, Thermo Fisher®) of the Midi-Pyrénées Observatory (OMP) in Toulouse. Sample was cautiously deposited onto a rhenium filament. Once in the TIMS, the Nd isotopes were evaporated and ionized, accelerated by an electric field, deflected according to their mass and detected in Faraday cups. The measurement was performed in static mode and the 143Nd/144Nd ratios were normalized using the 146/144Nd ratio (reference value of 0.7219) to correct for the mass fractionation of the instrument using exponential fractionation law.
Data quality was monitored by analyzing 39 Rennes standards and 15 La Jolla standards during the measurement sessions of our PANDORA samples. The resulting standard average 143Nd/144Nd values were 0.511962 ± 0.000012 and 0.511849 ± 0.000009 (2σ), respectively. The reference values of these standards being 0.511961 ± 0.00001 for Rennes (Chauvel and Blichert-Toft, 2001) and 0.511858 ± 0.000007 for La Jolla (Lugmair et al., 1975), PANDORA sample 143Nd/144Nd measurements were corrected for a machine bias of 0.000006. The internal precision of each TIMS analysis were calculated automatically by the MatSpec software (Finnigan®) and the measurements were reported with 2σ error bar. When the internal measured precision was worse than the external one, its value was assigned to the analyzed Nd-IC. When it was better, the external precision was applied. The consistency of the Nd-IC data was validated by replicate measurements: six filtered samples from station 73 at 1,650 m, two non-filtered from station 73 at 1,650 m and three non-filtered samples from station 82 at 1,200 m. The resulting
Grenier et al. (2013) analyzed samples at stations located in the North Caledonian Jet core (Coral Sea, station Flusec 43- August 2007), at the entrance of the Solomon Sea (Flusec-22, August 2007) and in Vitiaz Strait (EUC-Fe 30, September 2006), allowing us to compare our data with their published values (Figure 2; see Figure 1 for station locations). Comparisons of the
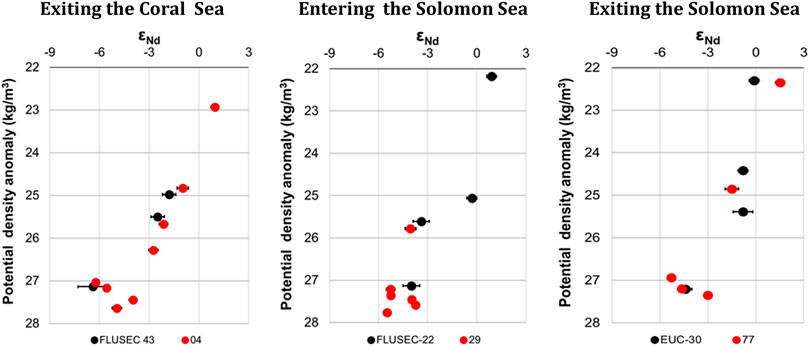
FIGURE 2. Comparison of the
An excellent agreement is observed between the
Note that, although conducted in the same laboratory, Grenier did not follow the same protocol and used older mass spectrometers (both ICP-MS and TIMS). Since there is no cross over station in this area, this good comparison was an important criterion to validate our data. Based on this quality report, these Nd-IC measurements were validated by the GEOTRACES Standard and Intercalibration committee and deposited in the 2021 GEOTRACES Intermediate Data Product (https://geotraces-portal.sedoo.fr/pi/).
The detailed hydrological properties of the waters flowing from the Coral Sea into the Solomon Sea were presented in Pham et al. (2019). The general circulation scheme, current names and locations of the different stations used in this study are provided in Figure 1. The hydrological properties of the different layers are recalled as T-S diagrams in Figure 3, and are used to identify the following layers and water masses, which have different origins, pathways, and properties:
(a) Surface Layer (SL) (
(b) Thermocline layer (TL): this layer displays significant temperature and salinity gradients and includes several water masses. It can be divided into two sublayers: the upper thermocline layer (
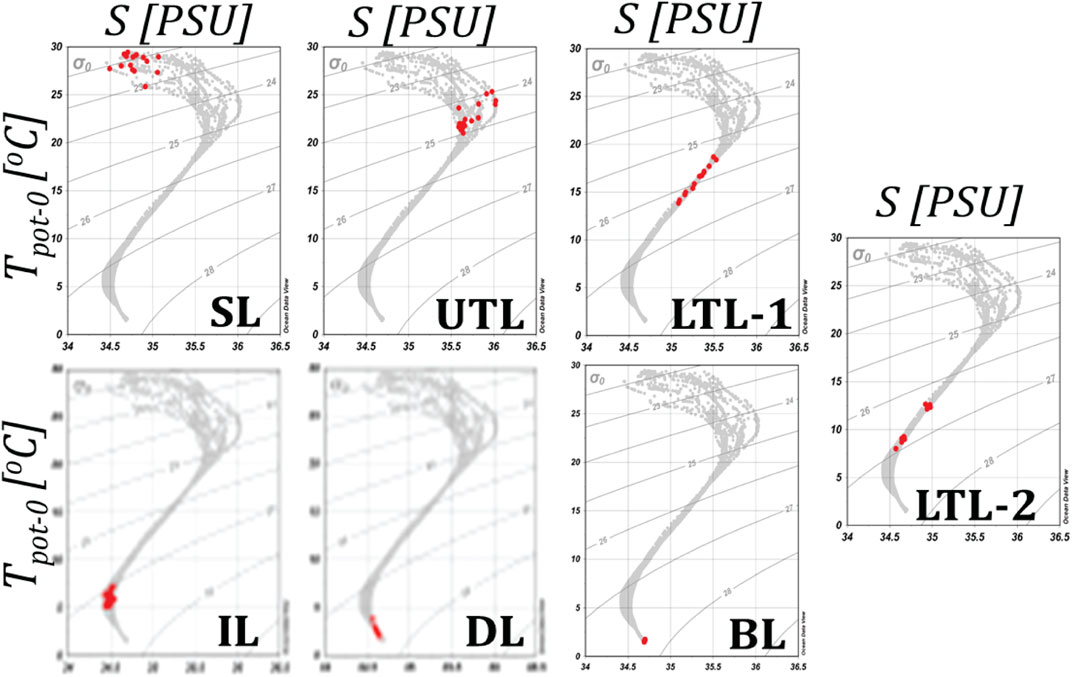
FIGURE 3. Potential temperature (θ) versus salinity (S) plots for the PANDORA stations (grey curves). Samples collected within each specific layer described in section 2.3 are identified by red dots. Potential density anomaly contours are shown as solid grey lines. SL, surface layer; UTL, upper thermocline layer; LTL-1, lower thermocline layer–upper extent; LTL-2, lower thermocline layer–lower extent; IL, intermediate layer; DL, deep layer; BL, bottom layer.
Upper TL (UTL,
Lower TL - Upper extent (LTL-1,
Lower TL - Lower extent (LTL-2,
(c) Intermediate layer (IL,
(d) Deep layer (DL,
(e) Bottom layer (BL,
Geographical maps showing the
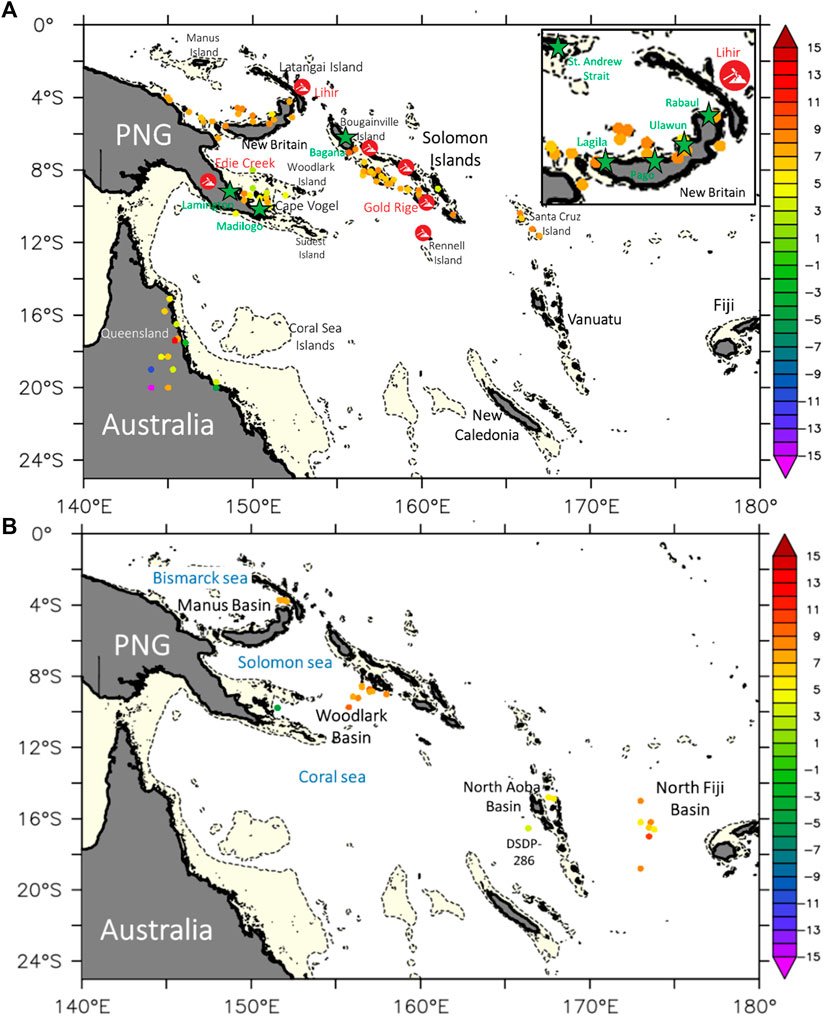
FIGURE 4.
Volcanoes, that are potential sources of fresh basaltic dusts, extracted from the Global Volcanism Program are also reported in Figure 4A (http://volcano.si.edu/gvpvotw.cfm). The most important gold, nickel or bauxite mines are located on the following islands: Papua New Guinea (Eddie Creek), Solomon (Choiseul and Santa Barbara), Guadalcanal, Rennel and finally Lihir that hosts one of the biggest goldmines of the world (Figure 4A). By accelerating the weathering, this anthropogenic activity could also modify the Nd parameters (concentration and IC) of the seawater. The sediment Nd-IC data are still very scarce in this remote area: those we could have identified are reported in Figure 4B. From the north Fiji Basin to the eastern part of Manus Basin, high radiogenic signals are have identified, the highest
Most of the
Neodymium concentration ([Nd]) and Eu anomaly (Eu/Eu*) are taken from Pham et al. (2019). The calculation of the europium anomaly is derived from the gadolinium anomaly expression of Bau et al. (1996); it compares the measured Eu concentration to the neighboring REE Sm and Dy, all normalized to PAAS (Post-Archean Australian Average Shale)1. A positive anomaly (>1.0) suggests an imprint of basaltic material in the Solomon Sea, the highest positive values corresponding to the most recent inputs. Neodymium isotopic composition signatures are reported in Table 1, within ±2σ. In the following, only the significant variations, i.e., those beyond analytical precision, are discussed. Data are first discussed qualitatively according to the water mass distribution outlined in section 3.1 (Figures 5–11). Where possible, land-ocean exchanges are quantified and discussed in section 3.2. The station locations are mentioned in Figure 1.
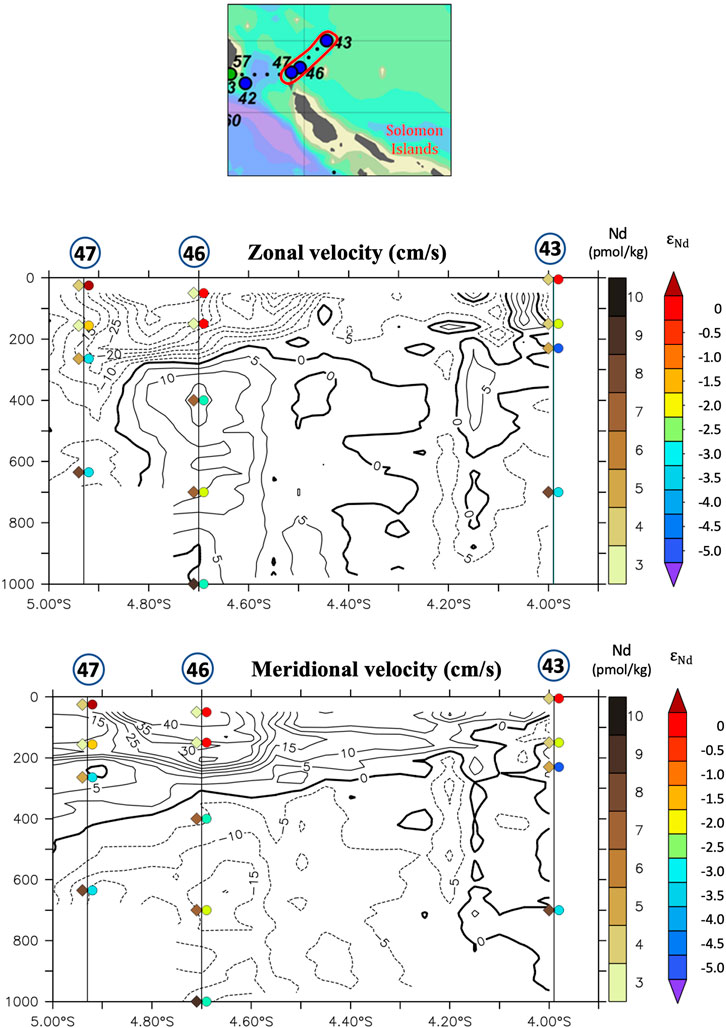
FIGURE 5. Zonal (top) and meridional (bottom) S-ADCP velocity sections from station 43 to station 47 (Germineaud et al., 2016; Cravatte et al., 2011) overlaid with vertical profiles of εNd and Nd concentrations. Yellow color indicates positive current value, representing northward and eastward directions. values and Nd concentrations are reported on the sections by black and red numbers, respectively. Note that the currents here are dominated by tidal variability at semi-diurnal periods, and reverse
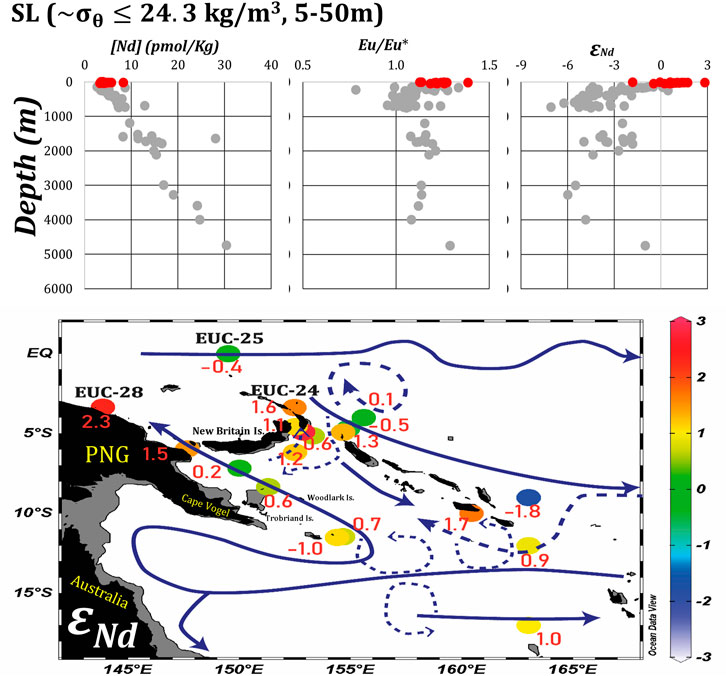
FIGURE 6. Properties and main circulation scheme of the surface waters (5‐50 m). Top: [Nd], Eu anomaly and εNd vertical profiles for PANDORA stations (grey dots); surface layer samples are identified by red dots. Bottom: εNd data of the surface layer (5‐50 m). Main currents are determined from (Ceccarelli et al., 2013) and represented by continuous dark blue arrows. In addition, current anomalies observed during PANDORA and related mesoscale features are represented by dashed arrows. The bathymetry shallower than 50 m is colored in dark grey.
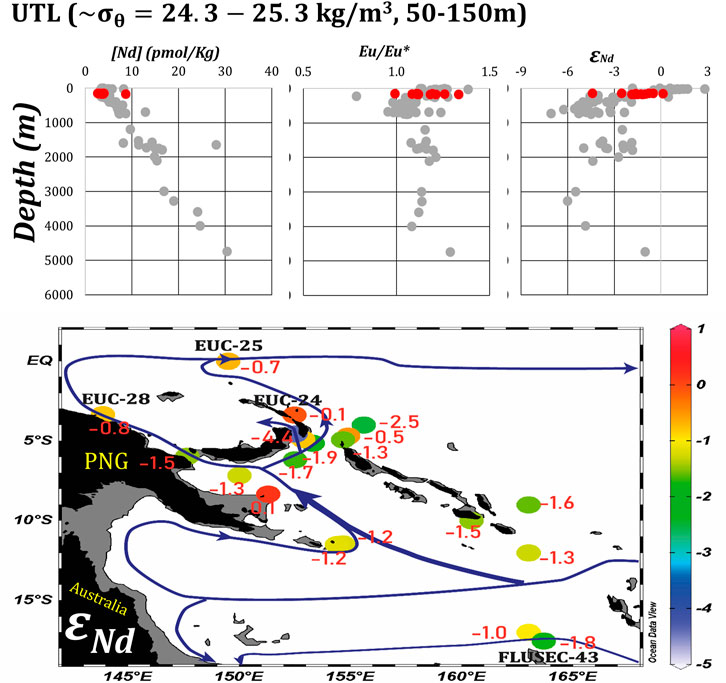
FIGURE 7. As Figure 6 for the Upper Thermocline Layer (24–25.3 kg/m3). The bathymetry shallower than 200 m is colored in dark grey.
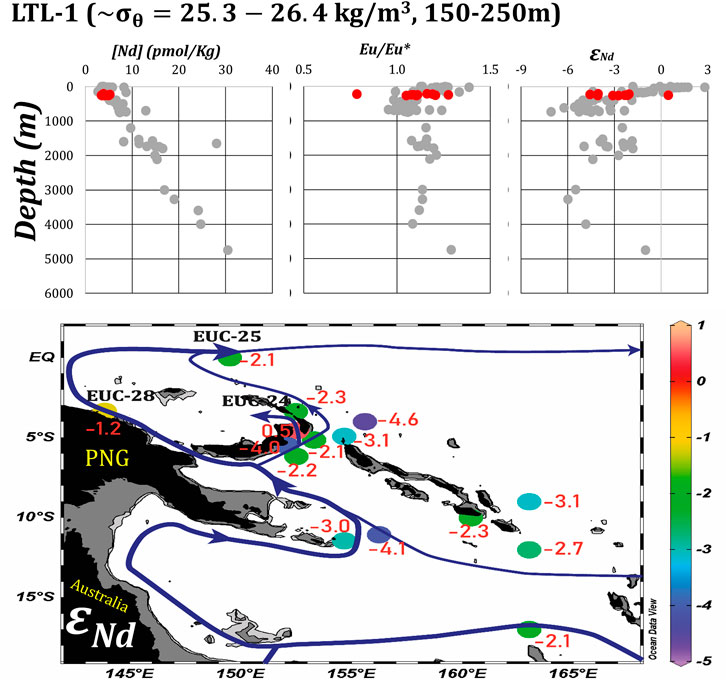
FIGURE 8. As Figure 7 for the Lower Thermocline -Upper extent (25.3–26.4 kg/m3). The bathymetry shallower than 200 m is colored in dark grey and in light grey when shallower than 500 m.
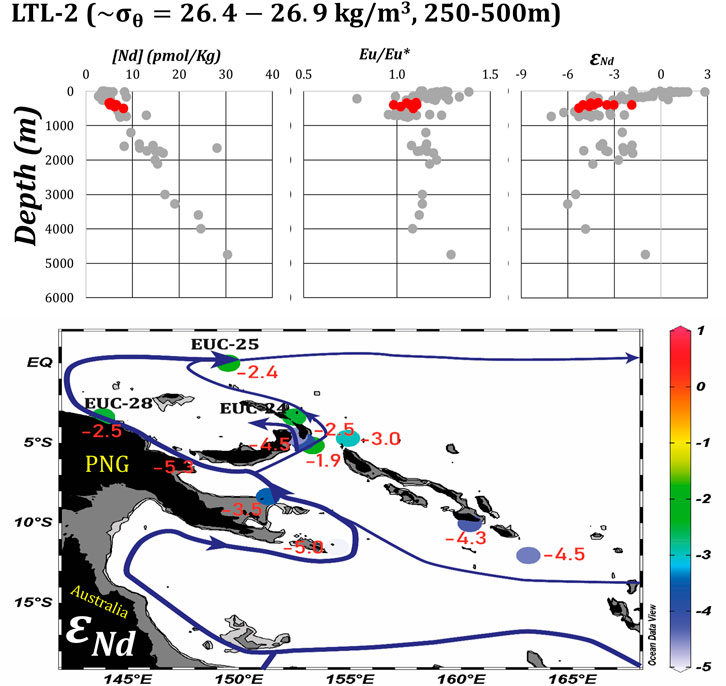
FIGURE 9. As Figure 8 for the Lower Thermocline‐Lower extent (26.4–26.9 kg/m3). The bathymetry shallower than 200 m is colored in dark grey and in light grey when shallower than 500 m.
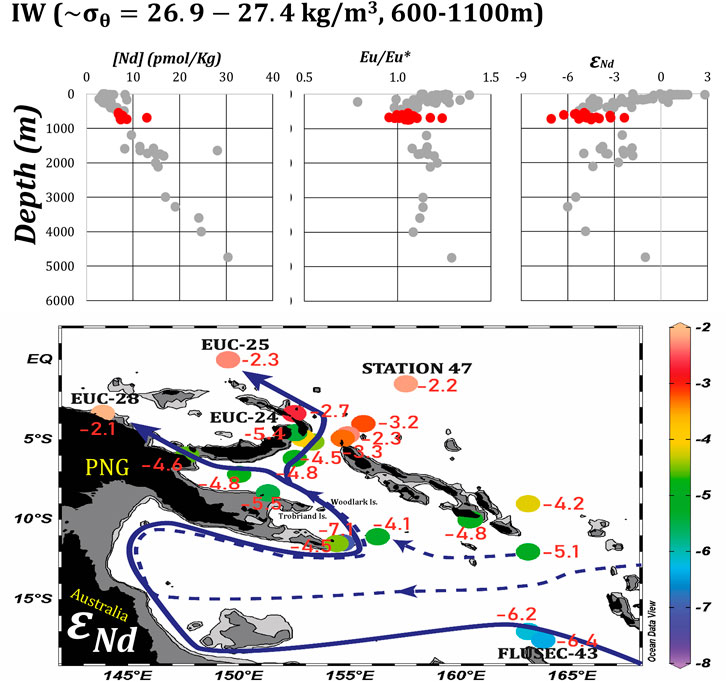
FIGURE 10. As Figure 9 for the intermediate layer (26.9–27.4 kg/m3). The bathymetry shallower than 500 m is colored in dark grey and in light grey when shallower than 1000 m.
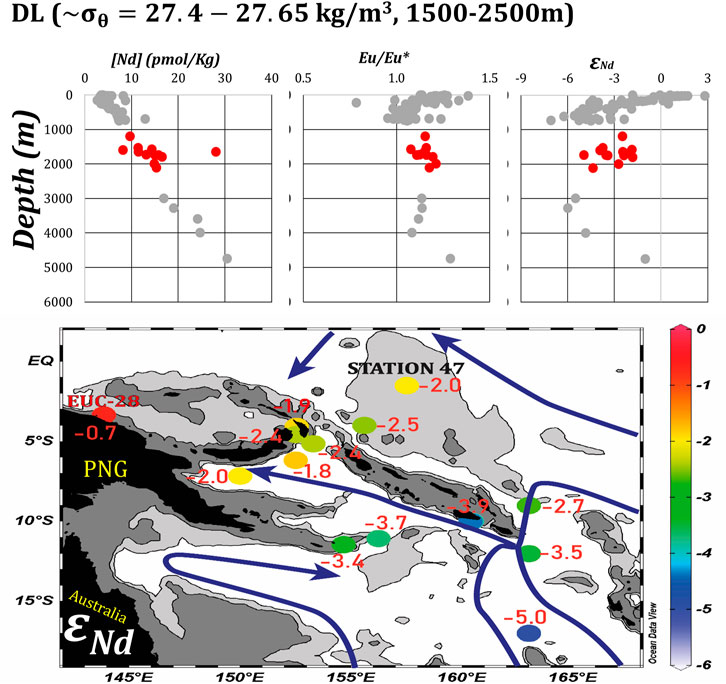
FIGURE 11. As Figure 10 for the deep layer (27.4–27.65 kg/m3). The bathymetry shallower than 1500m m is colored in dark grey and in light grey when shallower than 2500 m.
Surface waters are characterized by a pronounced radiogenic signal (Nd-IC varying from ‒2 to
At the entrance of the Solomon Sea (station 34; Figure 1), Nd-IC and [Nd] of the surface waters display the same values (
Surface waters in the three northern straits are more radiogenic than in the southern entrance, the most radiogenic values (
At the eastern end of the Solomon Strait (stations 46 and 47 in Figure 1),
Nd isotopic signatures are reported in Figures 7–9 for the Upper and Lower Thermocline layers (upper and lower extents), respectively.
Vertical distribution: these layers can be distinguished by their different average Nd-ICs. In the upper thermocline layer (Figure 7),
Horizontal distribution: each layer is characterized by a south-north increase of the
Finally, more radiogenic water is found after passing through the Indispensable Strait (station 21;
The two water masses identified in this layer (600–1,100 m) are the Antarctic Intermediate Water (AAIW) and the Equatorial Pacific Intermediate Water (EqPIW; section 2.3). The Nd-IC ranges from approximately −5.0 at the entrance of the Coral Sea to up to the contrasting value of ‒2.3 north of the Solomon Sea. The [Nd] however, stays relatively constant (∼8 pmol/kg; Figure 9).
In the Coral Sea, the AAIW is transported by the NCJ from North Caledonia to the South West entrance of the Solomon Sea, flowing close to the unradiogenic Queensland coast. This likely explains why the water is slightly more negative at station 34 than at station 4 or even FLUSEC-43; Figure 4A). The higher
Waters are slightly more radiogenic at station 71 (
From the Solomon Sea to the St. George’s Channel and Vitiaz Strait,
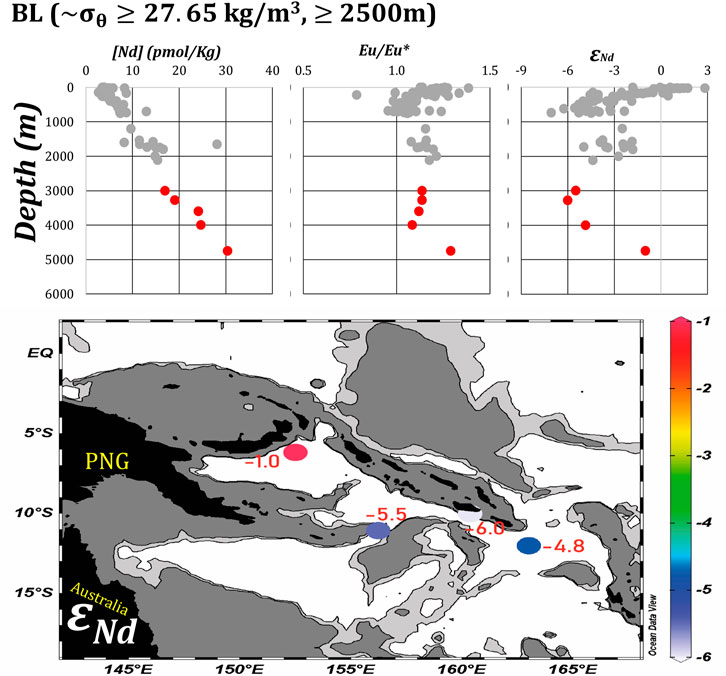
FIGURE 12. As Figure 11 for the bottom layer (≥27.65 kg/m3). The bathymetry shallower than 2500 m is colored in dark grey and in light grey when shallower than 3000 m.
At these depths (1,500–2,500 m), the bathymetry becomes a strong constraint for the circulation, motivating a detailed report of the submarine terrain in Figures 10, 11. A close look at this bathymetry and the water mass properties allowed establishing that UCDW enters the Solomon Sea via two narrow passages at 156°E and 162°E along the southern section (Germineaud et al., 2021). It then exits through St. George’s channel and Solomon strait only, since Vitiaz strait is blocked by the depth of the sill (980 m). Along the south-north pathway of the UCDW (i.e. from the Solomon Sea entrance to the two remaining exits), an increase of both the Nd-IC and [Nd] is observed (Figure 10). These parameters vary from ∼
Only three samples characterize the LCDW but they are worth to be discussed, considering how poorly documented this water mass. From 3,500 m down to the bottom, the Nd-IC signal of LCDW is more negative outside the Solomon Sea with values around ‒6. This contrasts with the radiogenic value of ‒1.0 observed at station 60 in the core of the Solomon Sea. [Nd] also increases from 22 pmol/kg outside the Solomon Sea to 30 pmol/kg at the bottom of station 60. In addition, the oxygen profile of station 60 suggests that relatively ventilated waters are penetrating the Solomon Sea from the south (Ganachaud et al., 2017; Pham et al., 2019). Germineaud et al. (2021) suggested that the lower part of the UCDW can imprint the LCDW and generate its O2-rich signature within the Solomon Sea. However, UCDW
The evolution of the Nd parameters along the different layers reveals different inputs, either very local -as for example in the Indispensable Strait-or on the scale of the whole Solomon Sea -as illustrated by the changes affecting the deep layer. Boundary Exchange quantification requires the following parameters: [Nd], Nd-IC and the water transport of the considered layer. The box model calculations proposed in the following are restricted to two layers -lower extent of lower thermocline layer (LTL-2) and deep layer (DL)- for which we could gather the three parameter values for each entrance and exit sections. We drew two box models, one for the local scale, applied to the LTL-2 and another one for the Solomon Sea scale, applied to the DL (Figure 13). All the water mass transports (W) are estimated by Germineaud et al. (2016) and extended to deeper layers as in Pham et al. (2019). Regarding the sediment taken as external source, we are aware that the sediment comprise various phases (e.g., carbonate-dissolved nano phases, iron oxide, volcanic material, bulk detrital) that are not dissolving at the same rate. In addition, different phases might be characterized by different Nd isotopic signatures (Wilson et al., 2013). This complexity makes it difficult to estimate the fluxes of elements released by the sediments. Yet, the scarcity of the data characterizing the Solomon Sea sediments led us to consider them homogeneous (made of a majority of basalts), with a unique
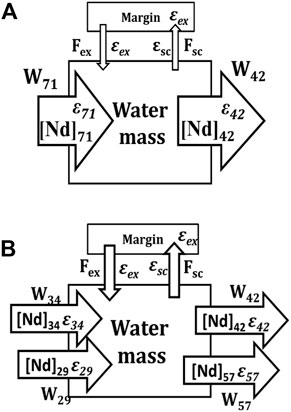
FIGURE 13. Representations of the box models used to calculate the Nd exchanged fluxes at the land-ocean interface for (A) local application (LTL-2) and (B) the whole Solomon Sea (DL). Note that for the latter, Vitiaz Strait is closed.
The eastern branch of the LTL-2 water is likely impacted by BE processes, from station 71 (
Where:
Fnetflux = Fex−Fsc
Fex is the external Nd flux coming from the neighbor island margin.
Fsc is the ‘‘scavenging’’ flux exported from the water mass toward the sediments due to adsorption of dissolved Nd on the particles.
W is the water transport, taken a 1.7 Sv (from the inverse model used in Germineaud et al., 2016).
[Nd]71 and ε71 are the input Nd parameter values.
[Nd]42 and ε42 are the output Nd parameter values
Calculation of Fex and Fsc requires to constrain
Table 2 compiles both the numerical values used in the calculations and the results. For the local box, we estimate an external flux of 7.9 ± 2.0 t(Nd)/yr and a scavenging one of 1.8 ± 2.3 t(Nd)/yr to satisfy both the [Nd] and

TABLE 2. Fluxes calculated from local-LLTW and PANDORA-UCDW box models.
The significant increase of
The “PANDORA box” for UCDW represented in Figure 13B is similar to that described in Pham et al. (2019). The striking feature here is that we have to split the calculation into two parts because the topography prevents water transport below 2,000 m at station 34. The evolution of the Nd parameters within the box follows the Equations 3, 4 below:
Where: Fnet flux = Fex - Fsc
Fex and Fsc: see definition above
[Nd]29; ε29 and [Nd]34; ε34 represent the input Nd parameter values of station 29 and station 34, respectively.
[Nd]42; ε42 and [Nd]57; ε57 represent the output Nd parameter values of station 42 and station 57, respectively.
The only missing Nd parameters data are for the lower extent of UCDW (
The results show similar net flux (42–43 t(Nd)/yr) for both extents of UCDW. Scavenging fluxes are affected by large error bars but they are clearly lower than the external input. The negative value estimated in the upper layer indicates that Nd desorption from the particles is required to balance the Nd concentration variation. The total net flux for the whole UCDW is 105 ± 50 t(Nd)/yr, in which external flux is 86 ± 31 t(Nd)/yr while scavenging flux is ‒19 ± 44 t(Nd)/yr. This net flux value is consistent with the findings of Pham et al. (2019), although better constrained (higher precision). In addition, satisfying the
The estimated external Nd fluxes required to change the isotopic signatures are of 7.9 ± 2.0 t(Nd)/yr in the LTL-2 and 86 ± 31 t(Nd)/yr in the DL. In this section, we compare this required input to the potential external sources for depth around 400 m (LTL-2) and beyond 2,000 m (DL).
At such depths, dust or dissolved river inputs are not likely sources because they affect the surface layer only. The weathered sediments transported by the rivers and deposited on the margins are thus considered. The only solid river discharge that could impact the Solomon Sea is brought by the mountaineous river system located at the Southeast of PNG (e.g., Fly River, Makharm River) with a total sediment discharge flux reaching 400 × 106 t/year (Figures 5, 6 of Milliman, 1995). Considering a Nd concentration of 32 ppm for suspended particulate matter of Fly River water (Sholkovitz, 1996; Sholkovitz et al., 1999), the resulting Nd flux is 12.8 × 10³ t (Nd)/year. Knowing that only ∼10% of sediment is accumulating on the adjacent shelf and less than 3% of the particles would eventually dissolve (Jeandel and Oelkers, 2015), such solid discharge could bring 346t (Nd)/year. This value is much higher than the upper limit of the flux required to enrich LTL-2 and DL. This suggests that this riverine flux brings enough material to contribute to the REE inputs in the layers for which the BE processes could be quantified. The ongoing analyses of the particles will help to further conclude.
Here we report the neodymium isotopic composition of seawater samples collected at 21 stations in the Coral and Solomon seas during the PANDORA cruise (July-August 2012). These data complement the REE concentration dataset reported in Pham et al. (2019). The
Box models allow calculating those external fluxes of 7.9 ± 2.0 t(Nd)/yr and of 86 ± 31 t(Nd)/yr are required to modify the Nd isotopic signatures of part of the thermocline layer and of the deep layer respectively, the latter being mostly composed of DL. The most likely external sources explaining these changes are the sediment deposited on the margins surrounding the Solomon Sea
Contrastingly, the intermediate layer shows the imprint of the negative Nd-IC signal from AAIW that enters the Solomon Sea in the South and keeps a quasi-homogeneous Nd-IC signal across the Solomon Sea (
The land-ocean processes are rapid, particularly dispersed and complex in the Solomon Sea. Indeed, many small-scale
The datasets presented in this study can be found in online repositories. The names of the repository/repositories and accession number(s) can be found in the article/supplementary material.
VP wrote the manuscript with major support from CJ and other supports from MG, SC, CG. VP, CJ, and MB carried out the experiment. MG and CJ conceived the original idea and performed the sampling. SC and CG helped to verify the hydrological context and provide supplementary information about deep water. Gerard Eldin helped supervise the project and provide necessary information about physical oceanography. TV encouraged VP to investigate more about fluxes.
The authors declare that the research was conducted in the absence of any commercial or financial relationships that could be construed as a potential conflict of interest.
All claims expressed in this article are solely those of the authors and do not necessarily represent those of their affiliated organizations, or those of the publisher, the editors and the reviewers. Any product that may be evaluated in this article, or claim that may be made by its manufacturer, is not guaranteed or endorsed by the publisher.
The captain, officers and crew of the R/V L’Atalante are greatly acknowledged. C. Pradoux, Stéphanie Mounic and Mathieu Benoit are thanked for their technical supports. The collaboration with SOPAC/SPC, PI-GOOS, and University of Papua New Guinea was greatly appreciated. We also acknowledge Benjamin Dupont for his volunteering help during the on-board sampling. The accomplishments were made possible through concurrent contributions of national funding agencies. The PANDORA cruise has been co-funded by NSF grant OCE1029487, and by ANR project ANR- 09- BLAN-0233-01 and INSU/LEFE project Solwara (IDAO and CYBER). All the authors whose work contributed to the database GEOTRACES are acknowledged (https://www.bodc.ac.uk/ geotraces/). The International GEOTRACES Programme is possible in part thanks to the support from the U.S. National Science Foundation (Grant OCE-1840868) to the Scientific Committee on Oceanic Research (SCOR). Our great thanks to the research team TIM at LEGOS for their support and encouragement.
Abbott, A. N. (2019). A Benthic Flux from Calcareous Sediments Results in Non-Conservative Neodymium Behavior during Lateral Transport: A Study from the Tasman Sea. Geology 47 (4), 363–366. doi:10.1130/G45904.1
Allen, C. M. (2000). Evolution of a Post-Batholith Dike Swarm in Central Coastal Queensland, Australia: Arc-Front to Backarc? Lithos 51 (4), 331–349. doi:10.1016/S0024-4937(99)00068-7
Amakawa, H., Yu, T.-L., Tazoe, H., Obata, H., Gamo, T., Sano, Y., et al. (2019). Neodymium Concentration and Isotopic Composition Distributions in the Southwestern Indian Ocean and the Indian Sector of the Southern Ocean. Chem. Geol. 511, 190–203. doi:10.1016/j.chemgeo.2019.01.007
Arsouze, T., Dutay, J.-C., Lacan, F., and Jeandel, C. (2007). Modeling the Neodymium Isotopic Composition with a Global Ocean Circulation Model. Chem. Geol. 239 (1–2), 165–177. doi:10.1016/j.chemgeo.2006.12.006
Bau, M., Koschinsky, A., Bau, M., Koschinsky, A., Dulski, P., Hein, J. R., et al. (1996). Comparison of the Partitioning Behaviours of Yttrium, Rare Earth Elements, and Titanium between Hydrogenetic Marine Ferromanganese Crusts and Seawater. Geochimica Cosmochimica Acta 60 (10), 1709–1725. doi:10.1016/0016-7037(96)00063-4
Behrens, M. K., Pahnke, K., Cravatte, S., Marin, F., and Jeandel, C. (2020). Rare Earth Element Input and Transport in the Near-Surface Zonal Current System of the Tropical Western Pacific. Earth Planet. Sci. Lett. 549, 116496. doi:10.1016/j.epsl.2020.116496
Behrens, M. K., Pahnke, K., Paffrath, R., Schnetger, B., and Brumsack, H.-J. (2018a). Rare Earth Element Distributions in the West Pacific: Trace Element Sources and Conservative vs. Non-Conservative Behavior. Earth Planet. Sci. Lett. 486, 166–177. doi:10.1016/j.epsl.2018.01.016
Behrens, M. K., Pahnke, K., Schnetger, B., and Brumsack, H.-J. (2018b). Sources and Processes Affecting the Distribution of Dissolved Nd Isotopes and Concentrations in the West Pacific. Geochimica Cosmochimica Acta 222, 508–534. doi:10.1016/j.gca.2017.11.008
Beier, C., Bach, W., Turner, S., Niedermeier, D., Woodhead, J., Erzinger, J., et al. (2015). Origin of Silicic Magmas at Spreading Centres-An Example from the South East Rift, Manus Basin. J. Petrology 56 (2), 255–272. doi:10.1093/petrology/egu077
Bostock, H. C., Opdyke, B. N., and Williams, M. J. M. (2010). Characterising the Intermediate Depth Waters of the Pacific Ocean Using δ13C and Other Geochemical Tracers. Deep Sea Res. Part I Oceanogr. Res. Pap. 57 (7), 847–859. doi:10.1016/j.dsr.2010.04.005
Bouvier, A., Vervoort, J. D., and Patchett, P. J. (2008). The Lu-Hf and Sm-Nd Isotopic Composition of CHUR: Constraints from Unequilibrated Chondrites and Implications for the Bulk Composition of Terrestrial Planets. Earth Planet. Sci. Lett. 273 (1–2), 48–57. doi:10.1016/j.epsl.2008.06.010
Boyd, P. W., Jickells, T., Law, C. S., Blain, S., Boyle, E. A., Buesseler, K. O., et al. (2007). Mesoscale Iron Enrichment Experiments 1993-2005: Synthesis and Future Directions. Science 315 (5812), 612–617. doi:10.1126/science.1131669
Briqueu, L., Laporte, C., Crawford, A. J., Hasenaka, T., Baker, P. E., and Coltorti, M. (1994). “Temporal Magmatic Evolution of the Aoba Basin, Central New Hebrides Island Arc: Pb, Sr, and Nd Isotopic Evidence for the Coexistence of Two Mantle Components beneath the Arc,” in Proceedings of the Ocean Drilling Program, 134 Scientific Results (Ocean Drilling Program). doi:10.2973/odp.proc.sr.134.019.1994
Chadwick, J., Perfit, M., McInnes, B., Kamenov, G., Plank, T., Jonasson, I., et al. (2009). Arc Lavas on Both Sides of a Trench: Slab Window Effects at the Solomon Islands Triple Junction, SW Pacific. Earth Planet. Sci. Lett. 279 (3–4), 293–302. doi:10.1016/j.epsl.2009.01.001
Chauvel, C., and Blichert-Toft, J. (2001). A Hafnium Isotope and Trace Element Perspective on Melting of the Depleted Mantle. Earth Planet. Sci. Lett. 190 (3–4), 137–151. doi:10.1016/S0012-821X(01)00379-X
Cravatte, S., Ganachaud, A., Duong, Q.-P., Kessler, W. S., Eldin, G., and Dutrieux, P. (2011). Observed Circulation in the Solomon Sea from SADCP Data. Prog. Oceanogr. 88 (1–4), 116–130. doi:10.1016/j.pocean.2010.12.015
Delcroix, T., Radenac, M. H., Cravatte, S., Alory, G., Gourdeau, L., Léger, F., et al. (2014). Sea Surface Temperature and Salinity Seasonal Changes in the Western Solomon and Bismarck Seas. Bismarck Seas. J. Geophys. Res. Oceans 119 (4), 2642–2657. doi:10.1002/2013JC009733
Elderfield, H., Bacon, M. P., Liss, P. S., Whitfield, M., and Burton, J. D. (1988). The Oceanic Chemistry of the Rare-Earth Elements. Phil. Trans. R. Soc. Lond. A 325 (1583), 105–126. doi:10.1098/rsta.1988.0046
Ewart, A., Chappell, B. W., and Menzies, M. A. (1988). An Overview of the Geochemical and Isotopic Characteristics of the Eastern Australian CainozoicVolcanic Provinces. J. Petrology Special_Volume (1), 225–273. doi:10.1093/petrology/Special_Volume.1.225
Filippova, A., Frank, M., Kienast, M., Rickli, J., Hathorne, E., Yashayaev, I. M., et al. (2017). Water Mass Circulation and Weathering Inputs in the Labrador Sea Based on Coupled Hf-Nd Isotope Compositions and Rare Earth Element Distributions. Geochimica Cosmochimica Acta 199, 164–184. doi:10.1016/j.gca.2016.11.024
Fröllje, H., Pahnke, K., Schnetger, B., Brumsack, H.-J., Dulai, H., and Fitzsimmons, J. N. (2016). Hawaiian Imprint on Dissolved Nd and Ra Isotopes and Rare Earth Elements in the Central North Pacific: Local Survey and Seasonal Variability. Geochimica Cosmochimica Acta 189, 110–131. doi:10.1016/j.gca.2016.06.001
Ganachaud, A., Cravatte, S., Sprintall, J., Germineaud, C., Alberty, M., Jeandel, C., et al. (2017). The Solomon Sea: its Circulation, Chemistry, Geochemistry and Biology Explored during Two Oceanographic Cruises. Elem. Sci. Anth 5 (0), 33. doi:10.1525/elementa.221
Germineaud, C. (2016). Circulation Océanique et Variabilité en Mer des Salomon. (Doctoral thesis, Universite Toulouse 3 -Paul Sabatier). Retrieved from http://www.these.fr/.
Germineaud, C., Cravatte, S., Sprintall, J., Alberty, M. S., Grenier, M., and Ganachaud, A. (2021). Deep Pacific Circulation: New Insights on Pathways through the Solomon Sea. Deep Sea Res. Part I Oceanogr. Res. Pap. 171, 103510. doi:10.1016/j.dsr.2021.103510
Germineaud, C., Ganachaud, A., Sprintall, J., Cravatte, S., Eldin, G., Alberty, M. S., et al. (2016). Pathways and Water Mass Properties of the Thermocline and Intermediate Waters in the Solomon Sea. J. Phys. Oceanogr. 46 (10), 3031–3049. doi:10.1175/jpo-d-16-0107.1
Grenier, M., Cravatte, S., Blanke, B., Menkes, C., Koch-Larrouy, A., Durand, F., et al. (2011). From the Western Boundary Currents to the Pacific Equatorial Undercurrent: Modeled Pathways and Water Mass Evolutions. J. Geophys. Res. 116 (12), C12044. doi:10.1029/2011JC007477
Grenier, M., Jeandel, C., and Cravatte, S. (2014). From the Subtropics to the Equator in the Southwest Pacific: Continental Material Fluxes Quantified Using Neodymium Data along Modeled Thermocline Water Pathways. J. Geophys. Res. Oceans 119 (6), 3948–3966. doi:10.1002/2013JC009670
Grenier, M., Jeandel, C., Lacan, F., Vance, D., Venchiarutti, C., Cros, A., et al. (2013). From the Subtropics to the Central Equatorial Pacific Ocean: Neodymium Isotopic Composition and Rare Earth Element Concentration Variations. J. Geophys. Res. Oceans 118 (2), 592–618. doi:10.1029/2012JC008239
Grenier, M. (2012). Le role du Pacifique Tropical Sud-Ouest dans la Fertilisation DuPacifique Quatorial: Couplage Dynamique et Multi-Traceur. (Doctoral thesis, Universite Toulouse 3 -Paul Sabatier). Retrieved from http://www.these.fr/.
Handler, M. R., Bennett, V. C., and Carlson, R. W. (2005). Nd, Sr and Os Isotope Systematics in Young, Fertile Spinel Peridotite Xenoliths from Northern Queensland, Australia: A Unique View of Depleted MORB Mantle? Geochimica Cosmochimica Acta 69 (24), 5747–5763. doi:10.1016/j.gca.2005.08.003
Hegner, E., and Smith, I. E. M. (1992). Isotopic Compositions of Late Cenozoic Volcanics from Southeast Papua New Guinea: Evidence for Multi-Component Sources in Arc and Rift Environments. Chem. Geol. 97 (3–4), 233–249. doi:10.1016/0009-2541(92)90078-J
Homoky, W. B., John, S. G., Conway, T. M., and Mills, R. A. (2013). Distinct Iron Isotopic Signatures and Supply from Marine Sediment Dissolution. Nat. Commun. 4 (1), 1–10. doi:10.1038/ncomms3143
Homoky, W. B., Weber, T., Berelson, W. M., Conway, T. M., Henderson, G. M., van Hulten, M., et al. (2016). Quantifying Trace Element and Isotope Fluxes at the Ocean-Sediment Boundary: A Review, Phil. Trans. R. Soc. A. 374, 20160246. doi:10.1098/rsta.2016.0246
Jeandel, C., Arsouze, T., Lacan, F., Téchiné, P., and Dutay, J.-C. (2007). Isotopic Nd Compositions and Concentrations of the Lithogenic Inputs into the Ocean: A Compilation, with an Emphasis on the Margins. Chem. Geol. 239 (1–2), 156–164. doi:10.1016/j.chemgeo.2006.11.013
Jeandel, C. (1993). Concentration and Isotopic Composition of Nd in the South Atlantic Ocean. Earth Planet. Sci. Lett. 117 (3–4), 581–591. doi:10.1016/0012-821X(93)90104-H
Jeandel, C., and Derek, V. (2018). New Tools, New Discoveries in Marine Geochemistry. Elements 14 (6), 379–384. doi:10.2138/gselements.14.6.379
Jeandel, C., and Oelkers, E. H. (2015). The Influence of Terrigenous Particulate Material Dissolution on Ocean Chemistry and Global Element Cycles. Chem. Geol. 395, 50–66. doi:10.1016/j.chemgeo.2014.12.001
Jeandel, C. (2016). Overview of the Mechanisms that Could Explain the 'Boundary Exchange' at the Land-Ocean Contact. Phil. Trans. R. Soc. A 374, 20150287. doi:10.1098/rsta.2015.0287
Jeandel, C., Thouron, D., and Fieux, M. (1998). Concentrations and Isotopic Compositions of Neodymium in the Eastern Indian Ocean and Indonesian Straits. Geochimica Cosmochimica Acta 62 (15), 2597–2607. doi:10.1016/S0016-7037(98)00169-0
Johnson, K. S., Chavez, F. P., and Friederich, G. E. (1999). Continental-shelf Sediment as a Primary Source of Iron for Coastal Phytoplankton. Nature 398, 697–700. doi:10.1038/19511
Kamenetsky, V. S., Binns, R. A., Gemmell, J. B., Crawford, A. J., Mernagh, T. P., Maas, R., et al. (2001). Parental Basaltic Melts and Fluids in Eastern Manus Backarc Basin: Implications for Hydrothermal Mineralisation. Earth Planet. Sci. Lett. 184 (3–4), 685–702. doi:10.1016/S0012-821X(00)00352-6
Kawabe, M., and Fujio, S. (2010). Pacific Ocean Circulation Based on Observation. J. Oceanogr. 66 (3), 389–403. doi:10.1007/s10872-010-0034-8
Kessler, W. S., and Cravatte, S. (2013a). ENSO and Short-Term Variability of the South Equatorial Current Entering the Coral Sea. J. Phys. Oceanogr. 43, 956–969. doi:10.1175/JPO-D-12-0113.1
Kessler, W. S., and Cravatte, S. (2013b). Mean Circulation of the Coral Sea. J. Geophys. Res. Oceans 118, 6385–6410. doi:10.1002/2013JC009117
Labatut, M., Lacan, F., Pradoux, C., Chmeleff, J., Radic, A., Murray, J. W., et al. (2014). Iron Sources and Dissolved-Particulate Interactions in the Seawater of the Western Equatorial Pacific, Iron Isotope Perspectives. Glob. Biogeochem. Cycles 28, 1044–1065. doi:10.1002/2014GB004928
Lacan, F., and Jeandel, C. (2005). Neodymium Isotopes as a New Tool for Quantifying Exchange Fluxes at the Continent-Ocean Interface. Earth Planet. Sci. Lett. 232 (3–4), 245–257. doi:10.1016/j.epsl.2005.01.004
Lacan, F., and Jeandel, C. (2001). Tracing Papua New Guinea Imprint on the Central Equatorial Pacific Ocean Using Neodymium Isotopic Compositions and Rare Earth Element Patterns. Earth Planet. Sci. Lett. 186 (3–4), 497–512. doi:10.1016/S0012-821X(01)00263-1
Lambelet, M., Flierdt, T., Butler, E. C. V., Bowie, A. R., Rintoul, S. R., Watson, R. J., et al. (2018). The Neodymium Isotope Fingerprint of Adélie Coast Bottom Water. Geophys. Res. Lett. 45 (2011), 247256–247311. doi:10.1029/2018GL080074
Lindstrom, E., Lukas, R., Fine, R., Firing, E., Godfrey, S., Meyer, G., et al. (1987). The Western Equatorial Pacific Ocean Circulation Study. Nature 330, 533–537. doi:10.1038/330533a0
Lugmair, G. W., Scheinin, N. B., and Marti, K. (1975). Sm-Nd Age and History of Apollo 17 Basalt 75075: Evidence for Early Differentiation of the Lunar Exterior. LPSC 2, 1419–1429. Available at: https://ui.adsabs.harvard.edu/abs/1975LPSC....6.1419L/abstract.
McCartney, P. (1979). Subantarctic Mode Water. Woods Hole Ceanographic Institution Contribution 3773, 103–119.
Milliman, J. D. (1995). Sediment Discharge to the Ocean from Small Mountainous Rivers: The New Guinea Example. Geo-Marine Lett. 15 (3–4), 127–133. doi:10.1007/BF01204453
Milliman, J., Farnsworth, K., and Albertin, C. (1999). Flux and Fate of Fluvial Sediments Leaving Large Islands in the East Indies. J. Sea Res. 41, 97. doi:10.1016/s1385-1101(98)00040-9
Nohara, M., Hirose, K., Eissen, J. P., Urabe, T., and Joshima, M. (1994). The North Fiji Basin Basalts and Their Magma Sources: Part II. Sr-Nd Isotopic and Trace Element Constraints. Mar. Geol. 116 (1–2), 179–195. doi:10.1016/0025-3227(94)90175-9
Orsi, A. H., and Nowlin, W. D. (1995). On the Meridional Extent and Fronts of the Antarctic Circumpolar Current, 42 Deep Sea Research Part I: Oceanographic Research Papers. Deep Sea Res. Part I Oceanogr. Res. Pap. 42, 641. doi:10.1016/0967-0637(95)00021-W
Orsi, A. H., Johnson, G. C., and Bullister, J. L. (1999). Circulation, Mixing, and Production of Antarctic Bottom Water. Prog. Oceanogr. 43 (1), 55–109. doi:10.1016/S0079-6611(99)00004-X
Pham, V. Q., Grenier, M., Cravatte, S., Michael, S., Jacquet, S., Belhadj, M., et al. (2019). Dissolved Rare Earth Elements Distribution in the Solomon Sea. Chem. Geol. 524 (May), 11–36. doi:10.1016/j.chemgeo.2019.05.012
Pin, C., and Santos Zalduegui, J. F. (1997). Sequential Separation of Light Rare-Earth Elements, Thorium and Uranium by Miniaturized Extraction Chromatography: Application to Isotopic Analyses of Silicate Rocks. Anal. Chim. Acta 339 (1–2), 79–89. doi:10.1016/S0003-2670(96)00499-0
Pitchford, J., and Brindley, J. (1999). Iron Limitation, Grazing Pressure and Oceanic High Nutrient-Low Chlorophyll (HNLC) Regions. J. Plankton Res. 21 (3), 525–547. doi:10.1093/plankt/21.3.525
Qu, T., Gao, S., Fukumori, I., Fine, R. A., and Lindstrom, E. J. (2009). Origin and Pathway of Equatorial 13°C Water in the Pacific Identified by a Simulated Passive Tracer and its Adjoint*. J. Phys. Oceanogr. 39, 1836–1853. doi:10.1175/2009JPO4045.1
Qu, T., Gao, S., Fukumori, I., Fine, R. A., and Lindstrom, E. J. (2008). Subduction of South Pacific Waters. Geophys. Res. Lett. 35, L02610. doi:10.1029/2007GL032605
Qu, T., and Lindstrom, E. J. (2002). A Climatological Interpretation of the Circulation in the Western South Pacific. J. Phys. Oceanogr. 32 (9), 2492–2508. doi:10.1055/s-2007-989442
Radenac, M.-H., Léger, F., Singh, A., and Delcroix, T. (2012). Sea Surface Chlorophyll Signature in the Tropical Pacific during Eastern and Central Pacific ENSO Events. J. Geophys. Res. 117 (4), a–n. doi:10.1029/2011JC007841
Rahlf, P., Laukert, G., Hathorne, E. C., Vieira, L. H., and Frank, M. (2021). Dissolved Neodymium and Hafnium Isotopes and Rare Earth Elements in the Congo River Plume: Tracing and Quantifying Continental Inputs into the Southeast Atlantic. Geochimica Cosmochimica Acta 294, 192–214. doi:10.1016/j.gca.2020.11.017
Reid, J. L. (1997). On the Total Geostrophic Circulation of the Pacific Ocean: Flow Patterns, Tracers, and Transports. Prog. Oceanogr. 39 (4), 263–352. doi:10.1016/S0079-6611(97)00012-8
Robinson, S., Ivanovic, R., van de Flierdt, T., Blanchet, C. L., Tachikawa, K., Martin, E. E., et al. (2021). Global Continental and Marine Detrital εNd: An Updated Compilation for Use in Understanding Marine Nd Cycling. Chem. Geol. 567, 120119. doi:10.1016/j.chemgeo.2021.120119
Rudnick, R. L., McDonough, W. F., McCulloch, M. T., and Taylor, S. R. (1986). Lower Crustal Xenoliths from Queensland, Australia: Evidence for Deep Crustal Assimilation and Fractionation of Continental Basalts. Geochimica Cosmochimica Acta 50 (6), 1099–1115. doi:10.1016/0016-7037(86)90391-1
Ryan, J. P., Ueki, I., Chao, Y., Zhang, H., Polito, P. S., and Chavez, F. P. (2006). Western Pacific Modulation of Large Phytoplankton Blooms in the Central and Eastern Equatorial Pacific. J. Geophys. Res. 111 (2), a–n. doi:10.1029/2005JG000084
Schuth, S., Münker, C., König, S., Qopoto, C., Basi, S., Garbe-Schönberg, D., et al. (2009). Petrogenesis of Lavas along the Solomon Island Arc, SW Pacific: Coupling of Compositional Variations and Subduction Zone Geometry. J. Petrology 50 (5), 781–811. doi:10.1093/petrology/egp019
Schuth, S., Rohrbach, A., Münker, C., Ballhaus, C., Garbe-Schönberg, D., and Qopoto, C. (2004). Geochemical Constraints on the Petrogenesis of Arc Picrites and Basalts, New Georgia Group, Solomon Islands. Contrib. Mineral. Pet. 148 (3), 288–304. doi:10.1007/s00410-004-0604-0
Shabani, M. B., Akagi, T., and Masuda, A. (1992). Preconcentration of Trace Rare-Earth Elements in Seawater by Complexation with Bis(2-Ethylhexyl) Hydrogen Phosphate and 2-Ethylhexyl Dihydrogen Phosphate Adsorbed on a C18 Cartridge and Determination by Inductively Coupled Plasma Mass Spectrometry. Anal. Chem. 64 (7), 737–743. doi:10.1021/ac00031a008
Sholkovitz, E. R. (1996). A Compilation of the Rare Earth Element Composition of Rivers, Estuaries and the Oceans. WHOI Tech- Nical Report, 72. WHOI-96-13(November).
Sholkovitz, E. R., Elderfield, H., Szymczak, R., and Casey, K. (1999). Island Weathering: River Sources of Rare Earth Elements to the Western Pacific Ocean. Mar. Chem. 68 (1–2), 39–57. doi:10.1016/S0304-4203(99)00064-X
Slemons, L. O., Murray, J. W., Resing, J., Paul, B., and Dutrieux, P. (2010). Western Pacific Coastal Sources of Iron, Manganese, and Aluminum to the Equatorial Undercurrent. Glob. Biogeochem. Cycles 24 (3), a–n. doi:10.1029/2009GB003693
Sokolov, S., and Rintoul, S. (2000). Circulation and Water Masses of the Southwest Pacific: WOCE Section P11, Papua New Guinea to Tasmania. J. Mar. Res. 58, 223–268. doi:10.1357/002224000321511151
Speckbacher, R., Behrmann, J., Nagel, T., Stipp, M., and Mahlke, J. (2012). Fluid Flow and Metasomatic Fault Weakening in the Moresby Seamount Detachment, Woodlark Basin, Offshore Papua New Guinea. Geochem. Geophys. Geosyst. 13 (11). doi:10.1029/2012GC004407
Stichel, T., Frank, M., Rickli, J., and Haley, B. A. (2012). The Hafnium and Neodymium Isotope Composition of Seawater in the Atlantic Sector of the Southern Ocean. Earth Planet. Sci. Lett. 317-318, 282–294. doi:10.1016/j.epsl.2011.11.025
Stichel, T., Hartman, A. E., Duggan, B., Goldstein, S. L., Scher, H., and Pahnke, K. (2015). Separating Biogeochemical Cycling of Neodymium from Water Mass Mixing in the Eastern North Atlantic. Earth Planet. Sci. Lett. 412, 245–260. doi:10.1016/j.epsl.2014.12.008
Stichel, T., Kretschmer, S., Geibert, W., Lambelet, M., Plancherel, Y., Rutgers Van Der Loeff, M., et al. (2020). Particle-Seawater Interaction of Neodymium in the North Atlantic. ACS Earth Space Chem. 4 (9), 1700–1717. doi:10.1021/acsearthspacechem.0c00034
Tachikawa, K., Jeandel, C., and Roy-Barman, M. (1999). A New Approach to the Nd Residence Time in the Ocean: the Role of Atmospheric Inputs. Earth Planet. Sci. Lett. 170 (4), 433–446. doi:10.1016/S0012-821X(99)00127-2
Takahashi, T., Olafsson, J., Goddard, J. G., Chipman, D. W., and Sutherland, S. C. (1993). Seasonal Variation of CO2 and Nutrients in the High-Latitude Surface Oceans: A Comparative Study. Glob. Biogeochem. Cycles 7 (4), 843–878. doi:10.1029/93gb02263
Talley, L. D. (2007). Hydrographic Atlas of the World Ocean Circulation Experiment (WOCE) Volume 2: Pacific Ocean. Southampton: WOCE International Project Office.
Tomczak, M., and Godfrey, J. S. (2003). Regional Oceanography: An Introduction. 2nd ed. Newdelh, India: Daya Publishing House.
Tomczak, M., and Hao, D. (1989). Water Masses in the Thermocline of the Coral Sea. Deep Sea Res. Part A. Oceanogr. Res. Pap. 36 (10), 1503–1514. doi:10.1016/0198-0149(89)90054-X
Tsimplis, M. N., Bacon, S., and Bryden, H. L. (1998). The Circulation of the Subtropical South Pacific Derived from Hydrographic Data. J. Geophys. Res. Oceans 103 (C10), 21443–21468. doi:10.1029/98JC01881
Tsuchiya, M., Lukas, R., Fine, R. A., Firing, E., and Lindstrom, E. (1989). Source Waters of the Pacific Equatorial Undercurrent. Prog. Oceanogr. 23 (Issue 2), 101–147. doi:10.1016/0079-6611(89)90012-8
Tsuchiya, M. (1981). The Origin of the Pacific Equatorial 13°C Water. J. Phys. Oceanogr. 11 (6), 794–812. doi:10.1175/1520-0485(1981)011<0794:tootpe>2.0.co;2
Venables, H., and Moore, C. M. (2010). Phytoplankton and Light Limitation in the Southern Ocean: Learning from High-Nutrient, High-Chlorophyll Areas. J. Geophys. Res. 115 (C2), C02015. doi:10.1029/2009jc005361
Warren, B. A. (1973). Transpacific Hydrographic Sections at Lats. 43°S and 28°S: the SCORPIO Expedition—II. Deep Water. Deep Sea Res. Oceanogr. Abstr. 20 (1), 9–38. doi:10.1016/0011-7471(73)90040-5
Wilson, D. J., Piotrowski, A. M., Galy, A., and Clegg, J. A. (2013). Reactivity of Neodymium Carriers in Deep Sea Sediments: Implications for Boundary Exchange and Paleoceanography. Geochimica Cosmochimica Acta 109, 197–221. doi:10.1016/j.gca.2013.01.042
Keywords: neodymium isotopic composition, rare earth elements, Solomon Sea, GEOTRACES, boundary exchange quantification
Citation: Pham VQ, Jeandel C, Grenier M, Cravatte S, Eldin G, Belhadj M, Germineaud C and Vu TV (2022) Neodymium Isotopic Composition and Rare Earth Element Concentration Variations in the Coral and Solomon Seas. Front. Environ. Chem. 3:803944. doi: 10.3389/fenvc.2022.803944
Received: 28 October 2021; Accepted: 05 May 2022;
Published: 22 June 2022.
Edited by:
David Amouroux, UMR5254 Institut des Sciences Analytiques et de Physico-Chimie pour l’Environnement et les Matériaux (IPREM), FranceReviewed by:
Torben Stichel, Alfred Wegener Institute Helmholtz Centre for Polar and Marine Research (AWI), GermanyCopyright © 2022 Pham, Jeandel, Grenier, Cravatte, Eldin, Belhadj, Germineaud and Vu. This is an open-access article distributed under the terms of the Creative Commons Attribution License (CC BY). The use, distribution or reproduction in other forums is permitted, provided the original author(s) and the copyright owner(s) are credited and that the original publication in this journal is cited, in accordance with accepted academic practice. No use, distribution or reproduction is permitted which does not comply with these terms.
*Correspondence: Catherine Jeandel, Y2F0aGVyaW5lLmplYW5kZWxAbGVnb3Mub2JzLW1pcC5mcg==; Viet Quoc Pham, dmlldHBxQGlldHZuLnZu
Disclaimer: All claims expressed in this article are solely those of the authors and do not necessarily represent those of their affiliated organizations, or those of the publisher, the editors and the reviewers. Any product that may be evaluated in this article or claim that may be made by its manufacturer is not guaranteed or endorsed by the publisher.
Research integrity at Frontiers
Learn more about the work of our research integrity team to safeguard the quality of each article we publish.