 Marc-Simon Bahr1,2*†
 Marcus Wolff1‡
- 1Heinrich Blasius Institute of Physical Technologies, Hamburg University of Applied Sciences, Hamburg, Germany
- 2School of Computing, Engineering and Physical Sciences, University of the West of Scotland, Scotland, United Kingdom
Photoacoustic spectroscopy (PAS) is typically used for the detection of trace gases. In this way, mixtures of short-chain hydrocarbons such as methane, ethane or propane can be analyzed with detection limits in the range of parts per million (ppm) or parts per billion (ppb) or even below. However, there are a number of applications where highly concentrated mixtures need to be analyzed. In some cases even the isotopologic composition of certain hydrocarbons needs to be determined. Examples can be found in natural gas production and planetary research. We present PAS-based isotopologic analyses of two digit percentage-level methane concentrations in nitrogen. The investigation allows conclusions to be drawn about the extent to which PAS is suitable for an isotopologic analysis of undiluted natural gas-like mixtures.
1 Introduction
While in recent years carbon dioxide (CO2) was primarily proclaimed as the driver of global warming, methane (CH4) as a greenhouse gas has now become a central component of climatic research processes (Nisbet et al., 2021). This is due in particular to the fact that methane has an up to 34 times higher global warming potential compared to CO2 (Jacobson, 2021). In this context, it may become extraordinarily important that the isotopologic composition of methane differs depending on the emission source. A sensitive and selective detection of the two main isotopologues, 12CH4 and 13CH4, whose natural abundances are 98.9% and 1.1%, respectively, could allow it to determine whether methane traces originate from biogenic or anthropogenic sources (Schwietzke et al., 2016). The fact that anthropogenic sources tend to a have slightly higher 13CH4 content can help identify and contain them and, thus, reduce the associated contribution to climate change (Schroll et al., 2020).
Other applications require the analysis of samples with high methane concentration. An example is the natural gas production. Raw natural gas contains between 75 and 99% methane, 1–15% ethane and 1–10% propane. However, the exact composition plays a decisive role for numerous industrial applications. Changes in the energy content, which is strongly dependent on the different alkane fractions, must be compensated by adjusting certain production parameters (Leicher et al., 2017). Temperature-sensitive processes can be controlled, for example, by adjusting the oxygen content of a mixture (Mukhopadhyay and Sen, 2019).
Furthermore, the 13C/12C concentration ratio of natural gas allows conclusions to be drawn about the type of gas and its source (Fuex, 1977). Shale gas, for instance, exhibits a specific 13C/12C ratio. It is depleted in its 13CH4 share in comparison to other types of natural gas. Due to the fact that the fracking technique implicates increased methane emissions into the atmosphere, its identification is of utmost importance (Howarth, 2019). Furthermore, the isotope ratio can be used to determine the shale porosity and permeability. These parameters, amongst others, determine the most suitable conveyor technique. The data can also help to optimize the shale stimulation treatment, saving cost and water and thus protecting the environment. Furthermore, the isotope ratio represents an important parameter for the horizontal drilling control (Zhang and Krooss, 2001).
Another application that requires the isotopologic analyses of high methane concentrations can be found in planetary and cometary research. The investigation of the atmospheric composition of planets such as Neptune, Titan and Uranus delivers important information about their formation and evolution (Fletcher et al., 2009; Moses et al., 2020). Astronomic theories, e.g. the core accretion and collapse model (Pollack et al., 1996) which explains the formation scenario of the Solar System, could be confirmed in that way.
The isotopologic “signature” of methane, i.e. the concentration ratio of 12CH4 and 13CH4, is usually expressed as the deviation from the Pee Dee Belemnite standard in per mill (parts per thousand). This
where
A very established and precise method for the analysis of gas mixtures is gas chromatography (GC). This technique allows molecular components to be separated by means of a separation column. The individual molecules are sequentially released from the separation column with a time delay, the so-called retention time, and subsequently detected by a detector, e.g., a flame ionization detector. The resulting chromatogram shows which types of molecules were present in the sample and their respective concentrations (Poole, 2021). However, since different isotopologues of the same molecule do hardly differ in their retention time, an isotope analysis by GC is not possible. In order to achieve this, GC is combined with mass spectrometry. The so-called isotope-ratio mass spectrometry (IRMS) represents the gold standard for isotope analyses (Sessions, 2006).
An alternative to IRMS could be photoacoustic spectroscopy (PAS) (Palzer, 2020). PAS is mainly suitable for the detection of trace gases but has been shown to enable the identification and quantification of methane isotopologues in the single-digit per mill range (Giglio et al., 2022) down to the parts per million (ppm) range (Loh and Wolff, 2019). The latter corresponds to typical concentrations in the atmosphere (van Amstel, 2012).
To the best of our knowledge, we investigate for the first time the applicability of PAS for isotopologic analysis of highly concentrated methane samples. We present first measurements of 13CH4/12CH4 mixtures in nitrogen with concentrations of 25–70% and 0.28–3.00%, respectively, under laboratory conditions. The measurement results are then evaluated using cross-validation in conjunction with Partial Least Squares Regression (PLSR). This process is also used for sensor calibration. Chapter 2 shows the relevant methane absorption spectra and describes the experimental setup and the measurement procedure. The third chapter presents the resulting measurements, which are subsequently discussed in Chapter 4.
2 Methods and material
2.1 12CH4 and 13CH4 absorption spectra
The isotopologic analysis has been performed using a spectrally tunable interband cascade laser (ICL) emitting in the spectral range of the fundamental vibration of 12CH4 and 13CH4. Figure 1 shows the absorption spectra of the two isotopologues at room temperature (296 K) and atmospheric pressure (1,013.25 hPa) (HITRAN on the Web, 2022). The optimum center wavelength of the laser has been determined using a mathematical algorithm (Bahr et al., 2022). Figure 2 displays the Q-branches of the fundamental vibrational absorption together with the tuning range of the laser, represented by the yellow box.
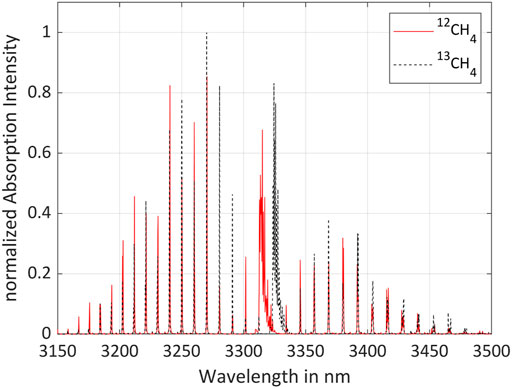
FIGURE 1. Fundamental vibrational absorption spectra of 12CH4 and 13CH4 (Gordon et al., 2022).
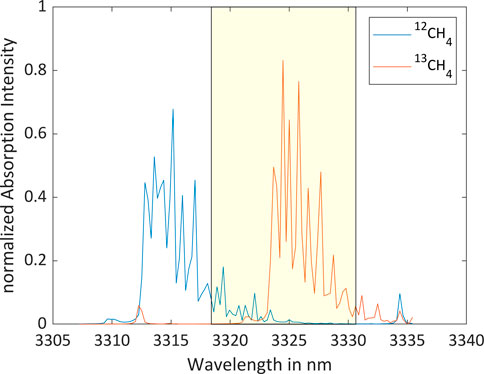
FIGURE 2. Q-branches of the fundamental vibrational absorption spectra of 12CH4 and 13CH4 (Gordon et al., 2022) together with the tuning range of the ICL (yellow box).
2.2 Measurement setup
The measurement setup is schematically shown in Figure 3. The ICL 3272 used in this investigation was manufactured by nanoplus GmbH (Gerbrunn, Germany). It exhibits a center wavelength of 3,323 nm with a spectral linewidth below 20 MHz. The laser can be operated at temperatures between 20 and 30°C. Stimulated emission occurs with electric currents between 19 and 120 mA. The ICL is operated using the Thorlabs (Newton, MA/United States) laser diode driver TLD001 and its temperature is controlled by the Thorlabs controller TTC001. The laser current can be set with an accuracy of 10 µA. The noise level is below 3 µA rms. The ICL chip has been installed in a TO66 housing including a Peltier element and a temperature sensor for temperature regulation. The laser provides single-mode emission that is spectrally continuously tunable between 3,318.41 nm and 3,330.64 nm. The maximum output power is approximately 15 mW. The laser beam passes centrally through the cylindrically symmetrical photoacoustic cell. The custom-made cell is designed according to the established H geometry featuring a longitudinal resonance around 3 kHz (Nodov 1978). The resonance tube is 60 mm long with a diameter of 6 mm and the buffer volumes at both ends of the cell have each a length of 30 mm and a diameter of 24 mm, resulting in a total absorption length of 120 mm. The photoacoustics signal is detected by the analog microphone ROM-2235P-HD-R from PUI Audio (Fairborn, OH/United States) which is mounted in the center of the cell with the membrane flush with the inner wall. It exhibits a diameter of 5.8 mm and a detection sensitivity of -35 ± 3 dB at 1 kHz and 50 cm distance. The Ametek/Signal Recovery lock-in amplifier DSP LIA (Berwyn, IL/United States) performs the phase-sensitive detection of the microphone signal. The Owon (Zhangzhou, China) function generator AG 1022 provides the frequency reference for the ICL modulation and the lock-in detection. The entire experimental setup is controlled using a MATLAB script on a PC. The PLSR algorithm including the leave-one-out cross-validation is implemented in a MATLAB script and performed by the PC.
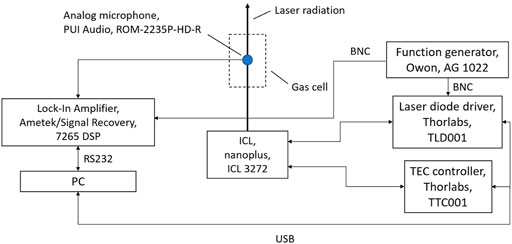
FIGURE 3. Experimental setup.
The gas flow system is schematically shown in Figure 4. Gas is provided in three containers:
(1) CH4 of natural isotopologue abundance (1 L geometric volume, 12 bar filling pressure, purity: 4.5, distributor: Westfalen AG),
(2) 13CH4 (416 ml geometric volume, 2.3 bar filling pressure, purity: 99%, distributor: Merck/Sigma Aldrich),
(3) N2 (10 L geometric volume, 200 bar filling pressure, purity: 5.0, distributor: Westfalen AG).
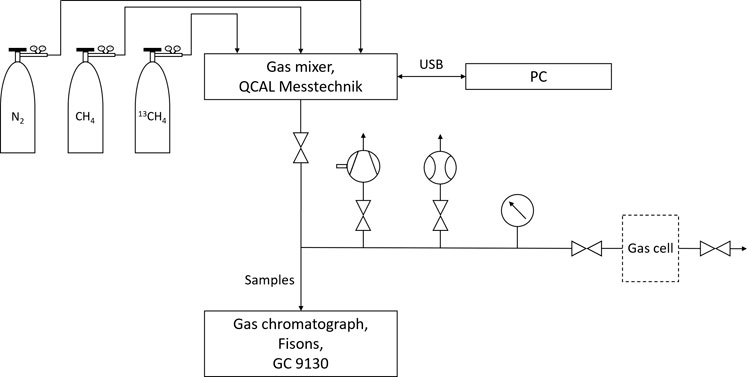
FIGURE 4. Gas flow system.
Mixtures are generated using the 6 Channel Gas mixer from QCAL (Munich, Germany) which is controlled by a PC. The maximum relative error of the mixture concentrations, specified by the manufacturer, is up to 2%. To ensure the correctness of the mixer performance, all compositions are analyzed by the gas chromatograph 9130 from Fisons (Ipswich, United Kindgom). The photoacoustic measurements were performed under static conditions after the gas mixtures were injected into the gas cell.
2.3 Measurement procedure
Photoacoustic spectroscopy is based on the absorption of modulated radiation and the subsequent conversion of the absorbed energy by collisions into a thermal wave and consequently into a pressure wave. This sound wave can be amplified taking advantage of an acoustic resonance of the sample cell and is usually detected by a microphone (Demtröder, 2007; Demtröder, 2013).
The ICL applied in this investigation is directly injection-current modulated at a constant operation temperature of 20°C. The current consists of one part that is continuously tuned between 75 and 120 mA covering a spectral range of approximately 12 nm and a second, sinusoidally modulated part that is responsible for the generation of the PA signal. The latter exhibits a modulation amplitude of 1.24 mA which corresponds to a spectral range of approximately 0.1 nm.
The frequency of the reference signal fed into the lock-in amplifier equals the resonance frequency of the measurement cell. This leads to a 1
The acoustic resonance of a sample cell depends sensitively on the speed of sound. Due to the significant mass difference, doubling or tripling a methane concentration of 25% in an N2 matrix considerably changes the speed of sound resulting in a large shift of the cell’s resonance frequency (Selvaraj et al., 2019). Figure 5 illustrates this phenomenon. It shows the PA signal as function of the modulation frequency for (total) methane concentrations of 26.25%, 52.25%, 73.00% and 100.00%. Shifts in the resonant frequency due to temperature fluctuations of a few degrees Celsius are comparatively negligible. The subsequent analytical measurements were all performed at a modulation frequency of 3,187 Hz.
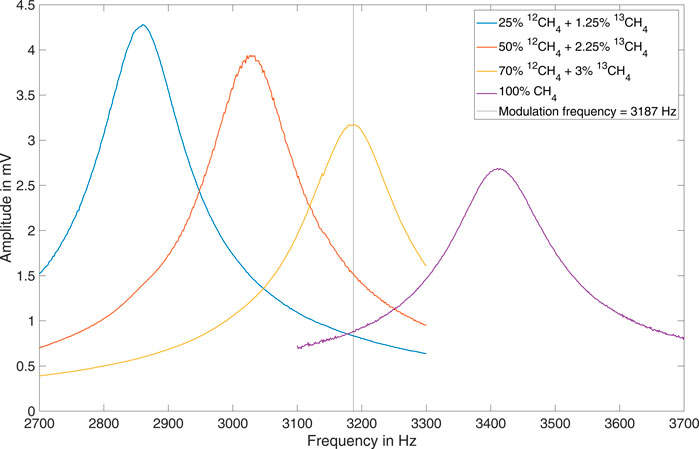
FIGURE 5. Photoacoustics signal as function of the modulation frequency for different mixtures.
Over a large range, the PA signal is proportional to the concentration of the absorbing molecules. However, if the absorption is extremely strong, as in the case of the fundamental asymmetric stretching ν3 of methane, and/or the concentration of the absorbing species is very high, saturation occurs and deviations from this linear relationship arise (Menduni et al., 2022). In Figure 5 it can be observed that the PA signal at the respective resonance frequency decreases as the methane concentration increases from 26.25% to 100.00%. The reason for this is twofold. Firstly, the majority of the absorption takes place in an increasingly shorter path length behind the entrance window. As a consequence, the overlap between the longitudinal mode and the intensity distribution of the laser will be weaker and the cell resonance is stimulated less effectively (Baumann et al., 2006; Baumann et al., 2007). The linear dependency between concentration and photoacoustic signal that applies in the ppm and ppb range is then no longer observable. For methane concentrations in the single digit percentage level the photoacoustic signal still increases with increasing concentration, however the dependence is non-linear (Zeninari et al., 2016). If concentrations are in the high percentage range, as shown in Figure 5, there is a reduction in amplitude with further increasing concentration.
This phenomenon is superimposed by a second effect. The photoacoustic signal generation is based on the transfer of internal energy of excited molecules (mainly vibration but also rotation) into kinetic energy of neighboring molecules (translation) via inelastic collisions. Therefore, the composition of the gas matrix significantly affects the relaxation dynamics and thus the photoacoustic response. Due to the high purity of the gas samples, the controlled laboratory environment and the evacuable gas flow system it is not expected that water vapor or other impurities play a major role in the relaxation process. Since there are no significant differences between the relaxation times of the two methane isotopologues, the 13CH4/12CH4 ratio should also not have a substantial influence on the photoacoustic signal (Giglio et al., 2022). As no efficient vibro-vibrational (V-V) transition between the ν3 state of CH4 (CH4*) and N2 exists, only three non-radiative relaxation channels are possible (Schilt et al., 2006):
(1) CH4*-N2 collision followed by a vibro-translational (V-T) transition. This relaxation channel represents the main source of the PA signal if N2 is present in the mixture.
(2) CH4*-CH4 collision followed by V-V transitions. This relaxation channel does not contribute to the PA signal.
(3) CH4*-CH4 collisions followed by a V-T transition. This relaxation channel represents an additional source of the PA signal. The respective signal is phase-shifted in relation to the CH4*-N2 signal. If no N2 is present in the mixture, it is the only source of the PA signal.
In our analytical measurements we are varying the (total) methane concentration between 25 and 73%. This changes the number of nitrogen molecules available for the according V-T collisions considerably and thus determines the efficiency of the photoacoustic signal generation.
The evaluation algorithm responsible for the sensor calibration has to be able to compensate the changing dependencies originating from the effectivity of the acoustic resonance stimulation as well as the matrix effects arising from changes in the gas composition.
3 Results
Table 1 lists the nine isotopologue mixtures that were investigated. The residual gas to 100% was always N2. The 12CH4 concentrations were chosen to cover the two-digit percentage range as complete as possible. The choice of 13CH4 concentrations was severely restricted due to the flow limitations of the gas mixer. Figures 6–8 show the respective photoacoustic spectra, i.e. the PA signal as function of the average laser current. All measurements were taken at a sample temperature of 26°C and a pressure of 1,016 hPa.
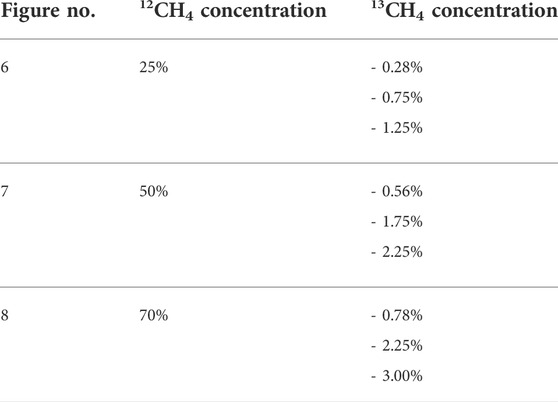
TABLE 1. 12CH4 and 13CH4 concentrations of the nine investigated mixtures (rest: N2).
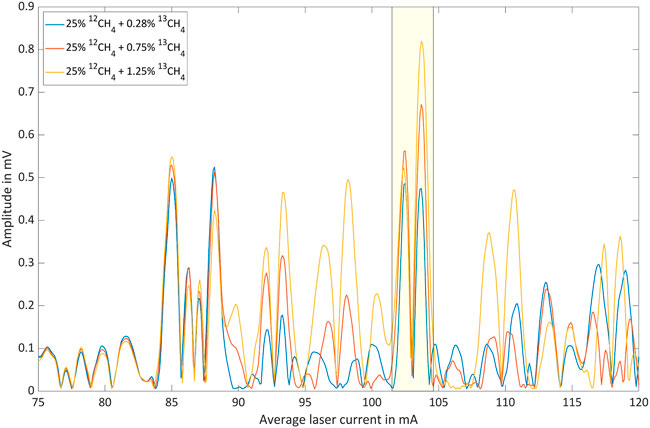
FIGURE 6. Photoacoustic signal as function of the average laser current for 25% 12CH4 with three different 13CH4 shares in nitrogen.
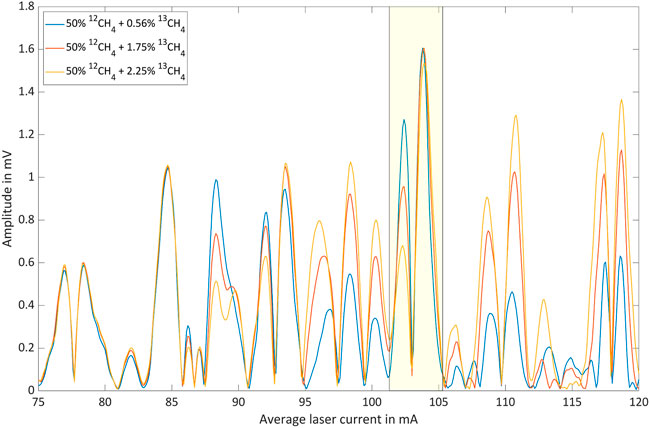
FIGURE 7. Photoacoustic signal as function of the average laser current for 50% 12CH4 with three different 13CH4 shares in nitrogen.
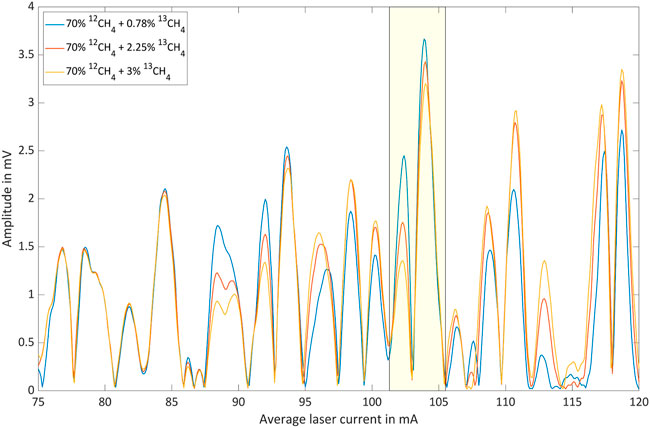
FIGURE 8. Photoacoustic signal as function of the average laser current for 70% 12CH4 with three different 13CH4 shares in nitrogen.
Considering the complexity of the collected spectra a sensor calibration in the form of a quantitative multivariate approach is implemented to validate the methane isotopologue concentrations and to test the suitability of the method. In particular, Partial Least Squares Regression (PLSR) proved to be applicable for determining the concentrations of mixture components from photoacoustic spectra (Loh and Wolff, 2020; Saalberg and Wolff, 2018). Figure 9 shows the true and the predicted methane isotopologue concentrations, after a leave-one-out cross-validation based on PLSR was applied to all nine investigated mixtures. The mixture numbers in Figure 9 correspond to the order given in Table 1. The absolute root-mean-square-errors for the predicted 12CH4 and 13CH4 concentrations were calculated to 3.08% and 0.29%, respectively.
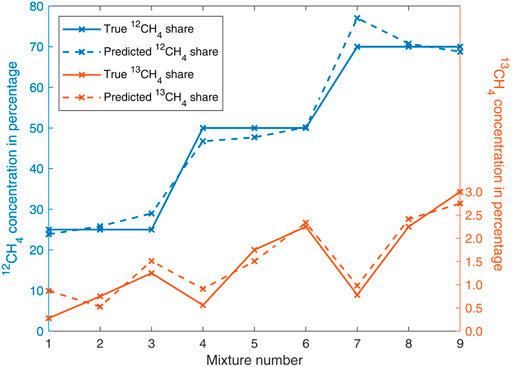
FIGURE 9. Evaluation of the investigated methane isotopologue mixtures by leave-one-out cross-validation based on PLSR.
4 Discussion
Figures 6–8 show wavelength-modulated photoacoustic spectra that were measured using the single modulation frequency (1
The spectral tuning range of the laser was selected using an optimization algorithm in such a way that not only characteristic absorption lines of both isotopologues are accessible, but that these lines also have absorption strengths of the same order of magnitude around the isotopologue ratio of interest (natural abundance). The latter is important as it ensures that the signal levels are comparable.
The spectral region associated with average laser currents between 75 mA and 85 mA is clearly dominated by 12CH4 lines. This is illustrated by the fact that the according peaks are only weakly dependent on the 13CH4 concentration. However, the dependence of the photoacoustic signal on the 12CH4 concentration is significant. The spectral region associated with average laser currents between 85 mA and 120 mA, on the other hand, is obviously characterized by 13CH4 absorption. However, 12CH4 exhibits a considerable contribution in this range leading to a base-signal that increases with increasing 12CH4 concentration. The 13CH4 concentration dependent signal inversion, which is for instance observable between 25% and 50% 12CH4 around 103 mA, marked by yellow boxes, can be explained as a result of two opposing effects:
(1) Increasing signal with increasing concentration due to higher absorption.
(2) Decreasing signal with increasing concentration due to less effective stimulation of cell resonance (see subsection 2.3).
The inversion can only be observed at selected average laser currents because the phenomenon requires a specific combination of absorption path length, absorption coefficient and concentration, in which the contributions of the two isotopologues add up.
In conclusion it can be stated that, even though the number of investigated mixtures of the two main methane isotopologues 12CH4 and 13CH4 is, with nine samples, quite limited and the error of the gas mixer used is significant, the measurements displayed in Figures 6–8 and the evaluation based on PLSR displayed in Figure 9 prove to a satisfactory extent that photoacoustic spectroscopy is a suitable method for the isotopologic analysis of highly concentrated methane. The accuracy of the sensor can be considerably improved by adding more measurements to the training data of the PLSR algorithm. The presented results with samples in the high double-digit percentage range make it appear possible to analyze undiluted natural gas samples. However, the presence of other hydrocarbons would make this task significantly more challenging. In any case, it is important to consider the resonance frequency shift associated with concentration changes.
Data availability statement
The original contributions presented in the study are included in the article/supplementary material, further inquiries can be directed to the corresponding author.
Author contributions
Writing, original draft preparations: M-SB; writing—review and editing: MW. Both authors contributed to manuscript revision, read, and approved the submitted version.
Funding
This research was funded by the German Federal Ministry for the Environment, Nature Conservation and Nuclear Safety, Grant No. 67KI2075. We acknowledge support for the article processing charge by the Open Access Publication Fund of Hamburg University of Applied Sciences.
Conflict of interest
The authors declare that the research was conducted in the absence of any commercial or financial relationships that could be construed as a potential conflict of interest.
Publisher’s note
All claims expressed in this article are solely those of the authors and do not necessarily represent those of their affiliated organizations, or those of the publisher, the editors and the reviewers. Any product that may be evaluated in this article, or claim that may be made by its manufacturer, is not guaranteed or endorsed by the publisher.
References
Bahr, M.-S., Baumann, B., and Wolff, M. (2022). Determining the most suitable spectral range for TDLS – A quantitative approach. J. Quantitative Spectrosc. Radiat. Transf. 286, 108216. doi:10.1016/j.jqsrt.2022.108216
Bahr, M.-S., and Wolff, M. (2021). Interferometric technique for the spectral characterization of high frequency current-modulated mid-infrared semiconductor lasers. Photonics 8 (10), 443. doi:10.3390/photonics8100443
Baumann, B., Kost, B., Groninga, H., and Wolff, M. (2006). Eigenmode analysis of photoacoustic sensors via finite element method. Rev. Sci. Instrum. 77 (4), 044901. doi:10.1063/1.2186808
Baumann, B., Wolff, M., Kost, B., and Groninga, H. (2007). Finite element calculation of photoacoustic signals. Appl. Opt. 46 (7), 1120–1125. doi:10.1364/ao.46.001120
Demtröder, W. (2013). Laserspektroskopie 2: Experimentelle techniken. 6th edn. Berlin, Heidelberg: Springer Berlin Heidelberg. [Online]. Available at: https://books.google.de/books?id=Z5IhBAAAQBAJ.
Demtröder, W. (2007). Laserspektroskopie: Grundlagen und Techniken. 5th edn. Berlin, Heidelberg: Springer-Verlag Berlin Heidelberg. [Online]. Available at: https://books.google.de/books?id=AhckBAAAQBAJ.
ETDEWEB (1995). “Reference and intercomparison materials for stable isotopes of light elements,” in Proceedings of a consultants meeting held in Vienna, 1–3. December 1993 [Online]. Available at: https://www.osti.gov/etdeweb/biblio/195611.
Fletcher, L. N., Orton, G. S., Teanby, N. A., Irwin, P., and Bjoraker, G. L. (2009). Methane and its isotopologues on saturn from cassini/CIRS observations. Icarus 199 (2), 351–367. doi:10.1016/j.icarus.2008.09.019
Fuex, A. (1977). The use of stable carbon isotopes in hydrocarbon exploration. J. Geochem. Explor. 7, 155–188. doi:10.1016/0375-6742(77)90080-2
Giglio, M., Olivieri, M., Sukhinets, A., Di Gioia, M., Elefante, A., Menduni, G., et al. (2022). “Measurement of the methane isotopologues relaxation rate exploiting quartz-enhanced photoacoustic spectroscopy”, in Quantum Sensing and Nano Electronics and Photonics XVIII. San Francisco, United States: SPIE/International Society for Optical Engineering, 56. 1/22/2022 - 2/28/2022.
Gordon, I. E., Rothman, L. S., Hargreaves, R. J., Hashemi, R., Karlovets, E. V., Skinner, F. M., et al. (2022). The HITRAN2020 molecular spectroscopic database. J. Quantitative Spectrosc. Radiat. Transf. 277, 107949. [Online]. doi:10.1016/j.jqsrt.2021.107949
HITRAN on the Web (2022). HITRAN on the Web. [Online]. Available at: https://hitran.iao.ru/(Accessed July 12, 2022).
Howarth, R. W. (2019). Ideas and perspectives: Is shale gas a major driver of recent increase in global atmospheric methane? Biogeosciences 16 (15), 3033–3046. [Online]. doi:10.5194/bg-16-3033-2019
Jacobson, M. Z. (2021). 100% clean, renewable energy and storage for everything. Cambridge: Cambridge University Press.
Leicher, J., Giese, A., Görner, K., Werschy, M., Krause, H., and Dörr, H. (2017). Natural gas quality fluctuations – surveys and statistics on the situation in Germany. Energy Procedia 120, 165–172. doi:10.1016/j.egypro.2017.07.161
Loh, A., and Wolff, M. (2020). Multivariate analysis of photoacoustic spectra for the detection of short-chained hydrocarbon isotopologues. Mol. (Basel, Switz. 25, 2266–2269. doi:10.3390/molecules25092266
Loh, A., and Wolff, M. (2019). “Photoacoustic detection of short-chained hydrocarbon isotopologues,” in 7th international symposium on sensor science (Basel Switzerland: MDPI), 23.
Menduni, G., Zifarelli, A., Sampaolo, A., Patimisco, P., Giglio, M., Amoroso, N., et al. (2022). High-concentration methane and ethane QEPAS detection employing partial least squares regression to filter out energy relaxation dependence on gas matrix composition. Photoacoustics 26, 100349. doi:10.1016/j.pacs.2022.100349
Moses, J. I., Cavalié, T., Fletcher, L. N., and Roman, M. T. (2020). Atmospheric chemistry on Uranus and Neptune, Philosophical Trans. Ser. A, Math. Phys. Eng. Sci. 378 (2187), 20190477.
Mukhopadhyay, A., and Sen, S. (2019). Fundamentals of combustion engineering [online]. Milton: Chapman and Hall/CRC. Available at: https://search.ebscohost.com/login.aspx?direct=true&scope=site&db=nlebk&db=nlabk&AN=2036012.
Nisbet, E. G., Dlugokencky, E. J., Fisher, R. E., France, J. L., Lowry, D., Manning, M. R., et al. (2021). Atmospheric methane and nitrous oxide: Challenges alongthe path to net zero. Phil. Trans. R. Soc. A 379 (2210), 20200457. doi:10.1098/rsta.2020.0457
Nodov, E. (1978). Optimization of resonant cell design for optoacoustic gas spectroscopy (H-type). Appl. Opt. 17 (7), 1110–1119. doi:10.1364/ao.17.001110
Palzer, S. (2020). Photoacoustic-based gas sensing: A review. Sensors (Basel, Switz. 20, 2745–2749. doi:10.3390/s20092745
Pollack, J. B., Hubickyj, O., Bodenheimer, P., Lissauer, J. J., Podolak, M., and Greenzweig, Y. (1996). Formation of the giant planets by concurrent accretion of solids and gas. Icarus 124 (1), 62–85. [Online]. doi:10.1006/icar.1996.0190
Poole, C. (2021). Gas chromatography. Second Edition. [Online], Amsterdam, Elsevier. Available at: https://www.sciencedirect.com/science/book/9780128206751.
Saalberg, Y., and Wolff, M. (2018). Multivariate analysis as a tool to identify concentrations from strongly overlapping gas spectra. Sensors (Basel, Switz. 18 (5), 1562. doi:10.3390/s18051562
Schilt, S., Besson, J.-P., and Thévenaz, L. (2006). Near-infrared laser photoacoustic detection of methane: The impact of molecular relaxation. Appl. Phys. B 82 (2), 319–328. [Online]. doi:10.1007/s00340-005-2076-y
Schroll, M., Keppler, F., Greule, M., Eckhardt, C., Zorn, H., and Lenhart, K. (2020). The stable carbon isotope signature of methane produced by saprotrophic fungi. Biogeosciences 17 (14), 3891–3901. [Online]. doi:10.5194/bg-17-3891-2020
Schwietzke, S., Sherwood, O. A., Bruhwiler, L. M. P., Miller, J. B., Etiope, G., Dlugokencky, E. J., et al. (2016). Upward revision of global fossil fuel methane emissions based on isotope database. Nature 538 (7623), 88–91. [Online]. doi:10.1038/nature19797
Selvaraj, R., Vasa, N. J., and Shiva Nagendra, S. M. (2019). Off-resonant photoacoustic spectroscopy for analysis of multicomponent gas mixtures at high concentrations using broadband vibrational overtones of individual gas species. Appl. Opt. 58 (15), 4118–4126. doi:10.1364/ao.58.004118
Sessions, A. L. (2006). Isotope-ratio detection for gas chromatography. J. Sep. Sci. 29 (12), 1946–1961. [Online]. doi:10.1002/jssc.200600002
van Amstel, A. (2012). Methane. A review. J. Integr. Environ. Sci. 9 (1), 5–30. doi:10.1080/1943815x.2012.694892
Zeninari, V., Vallon, R., Risser, C., and Parvitte, B. (2016). Photoacoustic detection of methane in large concentrations with a helmholtz sensor: Simulation and experimentation. Int. J. Thermophys. 37 (1), 7–11. [Online]. doi:10.1007/s10765-015-2018-9
Keywords: photoacoustic spectroscopy, interband cascade laser, natural gas, 12CH4, 13CH4
Citation: Bahr M-S and Wolff M (2022) PAS-based isotopologic analysis of highly concentrated methane. Front. Environ. Chem. 3:1029708. doi: 10.3389/fenvc.2022.1029708
Received: 27 August 2022; Accepted: 21 October 2022;
Published: 14 November 2022.
Edited by:
Vincenzo Spagnolo, Politecnico di Bari, ItalyReviewed by:
Andrea Zifarelli, University of Bari Aldo Moro, ItalyGustavo A. Zelada-Guillén, National Autonomous University of Mexico, Mexico
Copyright © 2022 Bahr and Wolff. This is an open-access article distributed under the terms of the Creative Commons Attribution License (CC BY). The use, distribution or reproduction in other forums is permitted, provided the original author(s) and the copyright owner(s) are credited and that the original publication in this journal is cited, in accordance with accepted academic practice. No use, distribution or reproduction is permitted which does not comply with these terms.
*Correspondence: Marc-Simon Bahr, bWFyYy1zaW1vbi5iYWhyQGhhdy1oYW1idXJnLmRl
†These authors share first authorship
‡These authors share senior authorship