
94% of researchers rate our articles as excellent or good
Learn more about the work of our research integrity team to safeguard the quality of each article we publish.
Find out more
ORIGINAL RESEARCH article
Front. Environ. Archaeol., 11 March 2025
Sec. Landscape and Geological Processes
Volume 4 - 2025 | https://doi.org/10.3389/fearc.2025.1464315
 Paulramasamy Morthekai1*
 Malika Singhal2,3
 Suchinder K. Sharma4
 Sudhakar Sivasubramaniam5
 Muthalankurichi Kamarasu6
 Priyanka Singh1,7
 Naveen Chauhan2
 Kamlesh Kumar1
 Sheikh Ali Nawaz1
 Nitesh Khonde1
By 2019, a long brick platform with some structures was exposed when the Thamirabarani River, the southernmost river in the city of Thirunelveli, dried up. The civic society rejoiced at the discovery of the exposed structure as it was thought to be the palace of the first capital city of the Pandya dynasty, an ancient Tamil dynasty of southern India. Two bricks were removed from the structure to determine their ages using the luminescence dating method, and their geochemical composition was analyzed using the X-ray fluorescence method. The bricks were composed of mud that underwent intermediate silicate weathering. High values of anomalous fading rate were observed from both the fine-grain polymineral (9.5–10.5%.decade−1) and coarse-grain K-feldspar (15.5%.decade−1), and this could be attributed to the significant presence of sanidine phase of K-feldspar. The fading corrected luminescence ages (1430–1530 CE) based on the coarse grain K-feldspar of the bricks placed the structure historically in the period of the Vijayanagar Empire, where the Late Pandyas had some autonomy in the south. These age estimates could resolve the hypothesis that the structure was not made by the Early Pandyas (400 BCE−300 CE). This study also reports discrepant ages for coarse quartz grains samples (1,689 CE; ± 10 years, 1 σ) and two fine polymineral grains samples (1634 CE; ± 90 years and 1699 CE; ± 30 years) compared to the age of the coarse K-feldspar grains samples. This discrepancy requires further investigation.
The Pandyas Dynasty reigned in southeastern Tamil Nadu, the southernmost Indian State, for more than 2,000 years from as early as the 4th century BCE until the 17th century CE. The Tamil literature suggests that they shifted their capital cities to Korkai, Madurai, and Tenkasi at various periods (Foote, 1883; Manoranjithamoni, 2012; Ganapathy, 2015). However, considering that Korkai had indeed been one of the capital cities of Pandyas is debatable (Nilakanta Sastri, 1929). Indeed, Madurai and Tenkasi had palaces, whereas no such buildings were ever discovered in Korkai. Thus, this leads to the question regarding material evidence to support (or reject) the Early Pandyas (400 BCE−300 CE) ruling from Korkai.
While usual summer and winter monsoons fill the Thamirabarani River (also known as Tambraparni and Porunai), in 2019, a submerged structure built using bricks was exposed as the river dried, owing to poor monsoon rainfall. The structure was located near Authoor, a small town in Thoothukudi District, Tamil Nadu, India (Figure 1), 1.5 km away from Korkai (to the north side) and 3 km from the Bay of Bengal (to the east), where the river confluences with the sea (Figure 2). The structure was found in the middle (Figures 3A–E) and at the right bank (Figure 3F) of the river (flowing toward the Bay of Bengal; Figure 2). There were stone pillars with Hindu deities found near these parts of the structure in the middle of the river (Figures 3C, D), and they could either belong to Nayak period (1529–1736 CE) or to the Vijayanagara Empire (1336–1565 CE) period (Pathy, 2013; Mahalingam, 2015). Meanwhile, it was believed by the locals to be the long-awaited evidence of the existence of the palace of the Early Pandyas.
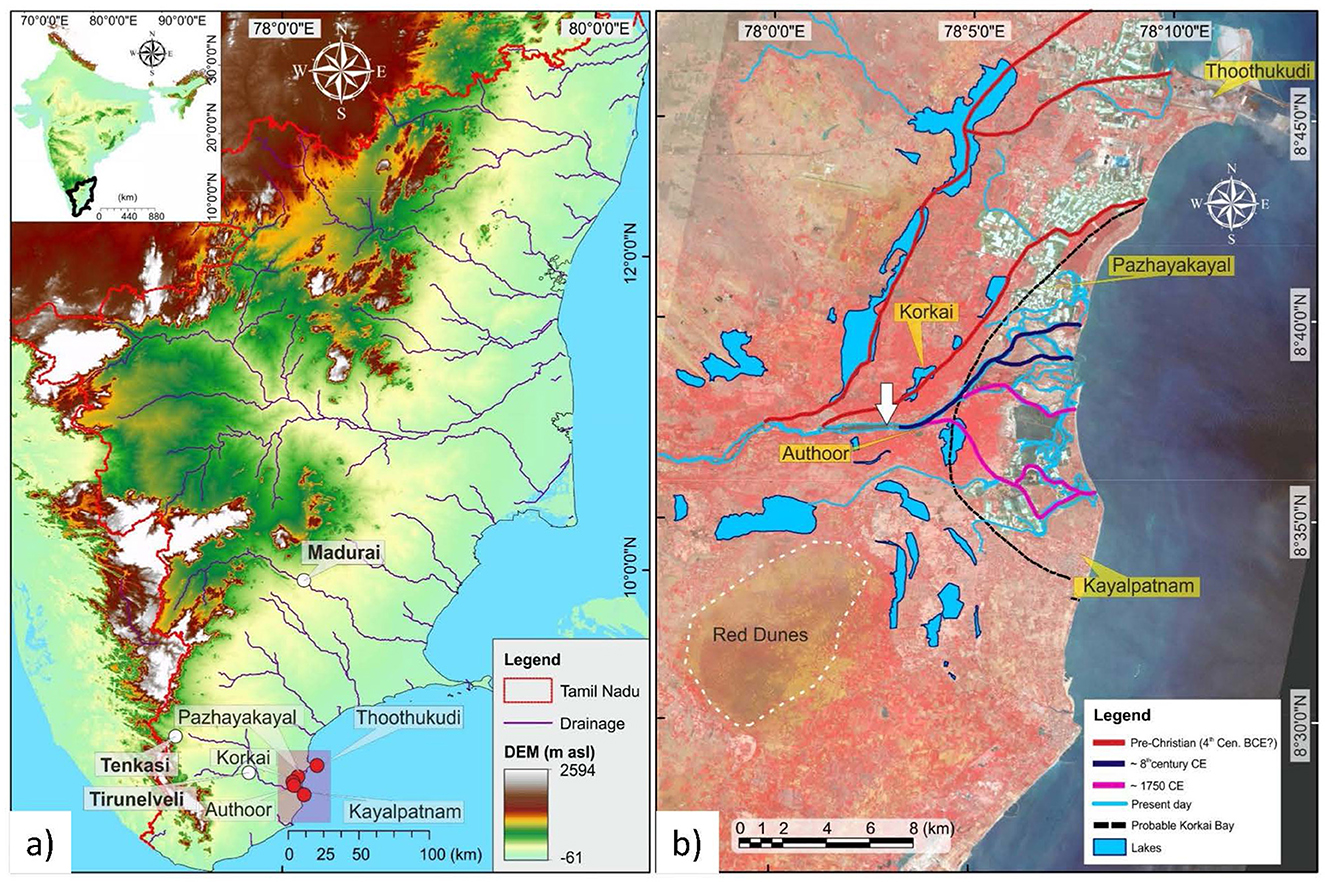
Figure 1. The location of study area (A) and the archaeologically important sites around the study area (B). Pazhayakayal and Korkai were ports earlier, and Thoothukudi is the present port. White arrow indicates the study site. In (B) was modified after Gupta and Rajani (2023). Relevant places are indicated.
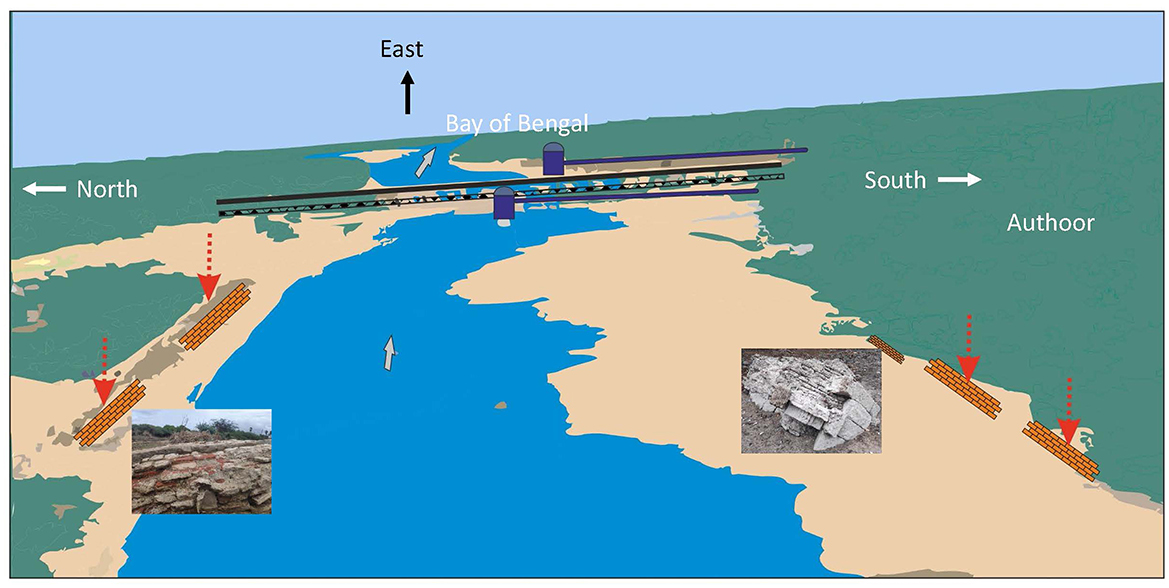
Figure 2. The schematic diagram that shows the brick structures that appeared in the Thamirabarani River.
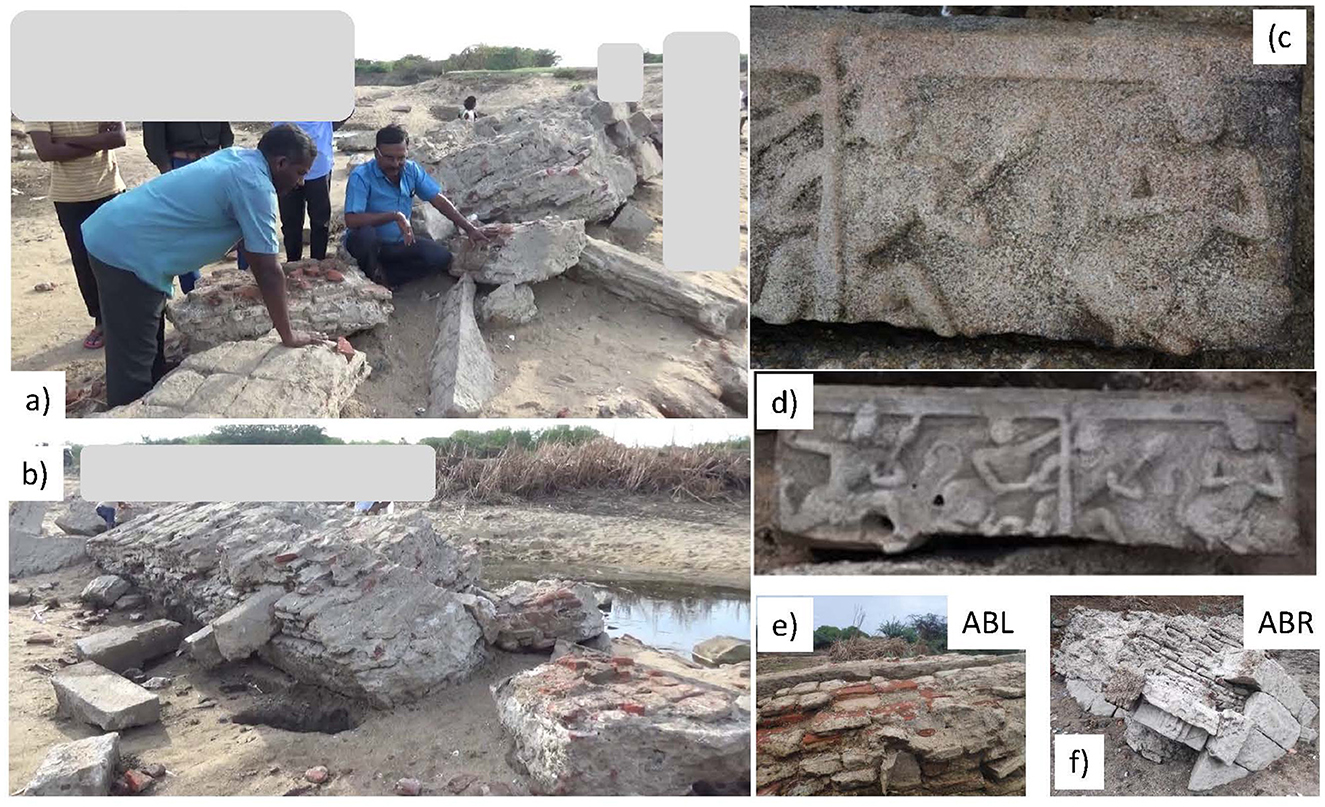
Figure 3. Brick structures (A, B), stone sculptures (C, D) and the samples used in this study [(E) middle of the river and (F) the right side of the river]. Except the authors (PM and MK—in squad position), others faces are not shown.
Therefore, this raised two questions: what was the actual age of the structure, and what was its exact nature and relation to the river? Indeed, the entire stretch of the structure in Thamirabarani River was not exposed except at the sides (Figure 3); therefore, it was unclear whether the structure was part of a ruined palace, temple, bridge, irrigation check dam, or bathing step. Korkai was a port city till at least 302 BCE-130 CE, according to Megasthanese, author of the Periplus of the Erythraean Sea, and Ptolemy (Caldwell, 1877, 1881; Foote, 1883; Arunachalam et al., 2006). At present, Korkai is located 5 km inland from the present-day coast to the east, with the Thamirabarani River to the south. This river had different course in earlier times (4th century BCE—red line, 8th century CE—dark blue line, 1750 CE—purple line, and at present—light blue line) and it had shown a southward migration with time based on remote sensing study (Arunachalam et al., 2006).
While the question about the nature of the structure remains open, this paper deals with the determination of the age, which would help to determine whether it was built by the Early Pandyas or not. Therefore, to resolve the debate, we took samples from the exposed structure in order to estimate the age using luminescence dating methods and study the geochemical composition.
Two full bricks from the structure (typically of 2–3 m3; Figure 3) were used in this study. One brick was from the structure in the middle of the river (ABL, Figures 2, 3E) and the other was on the right side of the river (ABR, Figure 3F). Both of them were of same dimension (20 cm, 13 cm, 3.5 cm; lbh). From the bricks, we collected samples for luminescence dating and X-ray fluorescence (XRF) measurements. To understand the detailed mineralogical composition and crystallinity of the samples used for luminescence dating, powder X-ray diffraction (pXRD) patterns were measured on the extracted coarser grains of quartz and K-feldspar.
The light-exposed outer layer (~1 cm) of the bricks was removed in the Luminescence Dating Laboratory (LumDL) of the Birbal Sahni Institute of Paleosciences (BSIP) in a subdued red light environment. The part of the brick that was unexposed to light was used for dose measurement using luminescence, while the exposed part was used for dose rate estimation.
The brick unexposed to light was gently crushed using an agate mortar and pestle without disturbing the original grain size distribution. The crushed samples were treated with 1N hydrochloric acid (HCl) to remove carbonates and 35% hydrogen peroxide to remove organic materials. The finer grains that were stuck to the coarser grains were deflocculated using 0.01N sodium oxalate. The fine-grained fraction (4–11 μm) of the polymineral was extracted using the settling method based on Stokes' law in an acetone medium (15 cm column) by allowing it to settle for 1.5 min (<11 μm) and 15 min (>4 μm). This fine-grain fraction (1 ml) was deposited on cleaned aluminum discs (9.6 mm) in a flat-bottom vial (6 cm) with acetone (2 ml). Dried aliquots were used to measure the dose using the fine-grained polymineral method. Fine grain polymineral fractions were extracted from both brick samples.
Polymineral grains larger than 11 μm (settled before 1.5 min in acetone medium) were oven dried and sieved to obtain a 90–150 μm portion. The heavy mineral fraction was extracted from this sieved portion using Franz Magnetic Laboratory Separator (LB 1) at 0.5 Ampere current, and subsequently, quartz and bulk feldspar fractions were separated at 1.5 Ampere with a typical flow rate of 2–3 g.min−1, tilt of 17° and slope of 25° (Porat, 2006). Quartz grains were etched using 40% hydrofluoric acid (HF) for 80 min to remove the outer 20–25 μm layer, allowing the ambient alpha dose rate to be ignored in further calculations. These etched quartz grains were treated with 40% HCl for 30 min to remove any spurious luminescent fluoride precipitates and then wet sieved to remove any < 90μm quartz. The oven-dried quartz grains were mounted as a monolayer on silicone-oiled stainless steel (SS) discs, which were used as aliquots (medium size; 3 mm) to measure the dose using the coarse quartz grain method. Only coarse quartz grains for the sample from the middle of the river (ABL) were sufficiently available for measurements. The purity of quartz was checked by measuring the IRSL of the quartz samples and calculating the IR percentage depletion ratio (IRpDR; Ali et al., 2022).
K-feldspar grains (floating grains) were separated from the bulk feldspar fraction (separated using a magnetic separator at 1.5 Ampere) using sodium polytungstate of density 2.58 g/cm−3. The K-feldspar grains were then etched using diluted (10%) HF for 80 min, followed by concentrated HCl for 30 min, for reasons similar to the treatment of quartz. Grains sized <90 μm were wet-sieved, and >90 μm were oven-dried. Medium-sized SS aliquots were prepared with the K-feldspar grains and used for dose measurements, applying the coarse K-feldspar grain method. Coarse K-feldspar grains were sufficiently available in the ABL sample only. Overall, the ABL sample was measured using fine-grained polyminerals (ABL PM), coarse-grained quartz (ABL Qz), and K-feldspar (ABL KF), whereas only fine-grained polyminerals (ABR PM) were measured for the ABR.
The light-exposed parts of the samples were crushed using a Retsch disc mill (RS-200) and used to measure the concentrations of uranium, thorium, potassium, and major oxides in these samples.
The dose rate was computed by measuring the concentrations of uranium, thorium, and potassium using a high-purity Ge gamma spectrometer calibrated using the NUSSY standard (Preusser and Kasper, 2001). The crushed samples were stored in airtight plastic boxes for a minimum of 20 days to allow 222Rn (half-life = 3.82 days), a radioactive daughter in the 238U decay series, to reach secular equilibrium with its immediate parent, 226Ra. This equilibrium is necessary because crushing the samples caused radon, a gas, to escape, disrupting the secular equilibrium. The gamma spectra of NUSSY and the background were obtained over a counting time of 4 days. The samples and subsequent background were obtained after counting for 7–8 and 12 h, respectively. The concentrations of uranium, thorium, and potassium were determined by comparing the background-subtracted NUSSY and sample spectra. Assuming secular equilibrium between the radioactive daughters and parents in the uranium and thorium series, the concentrations of uranium and thorium were calculated by averaging the concentrations of their respective radioactive daughter elements (226Ra, 214Pb, and 214Bi for the uranium series and 212Pb, 228Ac, and 208Tl for the thorium series) in the samples (Singh et al., 2024). The alpha efficiency (a-value) for the fine grain polymineral was assumed to be 0.08 ± 0.04 (no unit) for dose rate calculation (Kreutzer et al., 2014). The concentration of internal potassium (Kint) was assumed to be 12.5 ± 0.5% (Huntley and Baril, 1997). For quartz, the attenuation factors of Brennan et al. (1991) and Guerin et al. (2012) were used for alpha and beta particles, respectively. For K-feldspar, they were from Bell (1980) and Mejdahl (1979) for alpha and beta particles, respectively. The conversion factors of Adamiec and Aitken (1998) were applied. The water content of ABL was measured to be 0.97%. Assuming the bricks, at least ABL, were in the water most of the time, the water content was assumed to be 5 ± 2%. Considering the thickness of the structure (Figure 3), the gamma dose rate does not need any geometric correction. As the brick was taken from one layer below the multi-layered brick structure of the size of 2–3 m3 and considering the effective water column variation with time, 30 cm was considered as depth of the sample below the surface for dose rate computation. The cosmic ray dose rate was computed using the latitude, longitude, altitude, and depth of the samples (Prescott and Hutton, 1994). Finally, the dose rate was calculated using DRAC, a freely available online calculator (Durcan et al., 2015).
All luminescence measurements and beta irradiation were performed using a Risoe TL/OSL Reader TA-20 (Lapp et al., 2015). A calibrated beta source (90Sr/90Y) was used to irradiate the samples. The dose rates were 0.089 Gy.s−1 and 0.062 Gy.s−1 for the SS and Al discs, respectively at BSIP, and 0.045 Gy.s−1 for the SS discs at the Physical Research Laboratory, Ahmedabad (PRL). Infrared-stimulated luminescence (IRSL) signal was used to estimate the dose of the fine-grained polymineral and coarse K-feldspar grains, whereas blue stimulated luminescence (OSL) signal was used for the coarse quartz grains.
The IRSL50°C; 200°C and IRSL50°C; 250°C (the first subscripted value indicates the stimulation temperature and the second one indicates the preheat temperature) were measured respectively from a preheated polymineral (to 200°C) or K-feldspar (to 250°C) sample by stimulating with infrared (IR) photons (850 ± 40 nm) at 50°C. Thus, IR stimulated signals were detected in the violet-blue range using combined BG-39 and Corning 7–59 filters in front of the photo-multiplier tube (PMT; PDM 9107Q-AP-TTL-03). Preheat plateau tests (from 175 to 275°C at 25°C interval) and dose recovery tests were done to check the efficiency of the dose measurement protocol.
The post IR IRSL was also measured from the coarse K-feldspar grains, but the measurement of this signal was not possible for the fine polymineral grains due to our laboratory specific logistic reasons. The pIR IRSL290°C; 320°C signal was measured after a IRSL (IRSL50°C; 320°C) measurement on a preheated K-feldspar (to 320°C) sample by stimulating with IR photons and detecting photons in the violet-blue range. This was done in PRL. A dose recovery test was carried out on this signal as well.
The OSL signal was measured on the quartz sample by stimulating with blue photons (470 ± 20 nm) at 125°C, and detecting UV photons using a Hoya U-340 filter of 7.5 mm size in front of the same PMT. A preheat plateau test (from 180 to 260°C at 20°C interval) was carried out to optimize the preheating temperature and a dose recovery test was done as well. As the sample was a heated material, the preheat plateau tests were carried out on the fresh aliquots with natural dose in them and three aliquots were used per preheat temperature. However, due to the unavailability of samples, 6 of already used aliquots were used for the dose recovery tests by recovering a known dose of 1.2 Gy.
A single-aliquot regenerative (SAR) dose protocol was used to estimate the equivalent dose (De; Gy) for all three types of samples (Murray and Roberts, 1998; Murray and Wintle, 2000). The dose response curve (DRC) was constructed using sensitivity-corrected IRSL (PM and KF) or OSL (Quartz) for five laboratory doses, including three increasing doses with one repetition and one zero dose. Aliquots were accepted for De estimation if they had a recycling ratio within 10% of unity, a relative test dose error within 10%, and recuperation within 5%. The fading-uncorrected De was estimated by interpolating the natural IRSL (Ln/Tn) onto the DRC.
The IRSL signal fades over time (Wintle, 1973; Visocekas et al., 1994) and occasionally does the quartz OSL as well (Tsukamoto et al., 2007), so this fading needs to be corrected. The fading rate of the IRSL (from fine-grained polymineral), IRSL50°C; 320°C and pIR IRSL290°C; 320°C (from coarse-grained K-feldspar) and OSL (from coarse-grained quartz) were measured using the single-aliquot regenerative-dose protocol (Auclair et al., 2003) and the fading rate parameter, ρ′–a dimensionless number—was obtained by fitting the data using the fading equation of Huntley (2006). Fading was corrected using the Huntley and Kars Method (Huntley, 2006; Kars et al., 2008). In this method, each point (Lx/Tx) in the DRC used for De estimation was corrected for fading that occurred during the respective irradiation times (in minutes at 0.062–0.089 Gy.s−1 in BSIP, and at 0.045 Gy.s−1 in PRL) of the laboratory dose using ρ′. This corrected DRC is called the unfaded DRC. Each data point of the unfaded DRC was further adjusted to account for fading that would have occurred if the laboratory dose had been administered at a natural dose rate (in thousands of years at 4–6 Gy.ka−1), resulting in what was called the natural DRC. The fading-corrected De was calculated by interpolating Ln/Tn onto the natural DRC (Morthekai et al., 2011; Biswas et al., 2013; Singh et al., 2023). The representative De for age calculation was optimized using the central age model (CAM; Singh et al., 2023). Error in the fading corrected age was calculated by error propagation (quadrature addition of fractional errors of De and dose rate) and an added component. The added component was the increase in the error between the fading corrected and un-corrected age as obtained from the Luminescence package of R using calc_Huntley2006() and calc_CentralDose() methods sequentially (Kreutzer et al., 2018; R Core Team, 2020).
The ages were synthesized using two methods. The first method was based on conventional statistical methods. The equations provided below were used to calculate the mean and standard deviation of the synthesized age, and from these values, the age range was established.
and
where μ and σ are the mean and standard deviation of two given ages of a and b, respectively. Likewise any number of ages can be subsequently added, and the order of the ages to be combined does not matter. The second method involves modeling within a Bayesian framework. ChronoModel v2.0 18, a free software for hierarchical Bayesian modeling, was used to synthesize the ages (Banks, 2015; Binder et al., 2017; Lanos and Philippe, 2017; Lanos and Dufresne, 2019). The requirement for synthesis is that the ages must be independent to some extent. The structure was created within the age uncertainties at a particular time, representing the Event (only one) here. The posterior age estimates and variances were verified by checking the convergence of Markov chains to equilibrium (History plots) and the correlation between successive values in the Markov chain (Autocorrelation). All calculations were conducted in calendar years, with the reference year being 2019 CE.
The X-ray diffraction spectra were measured on the extracted quartz and K-feldspar grains to study the phase of quartz (whether it is α- or β-quartz) and K-feldspar. The powder X-ray diffraction patterns were measured on a Rigaku instrument (MiniFlex 600) having Cu-target that emits wavelength of 1.54060 Å (Sharma et al., 2024). The scan speed was 0.01°/s over a 2θ range of 10 to 80°. The pXRD patterns were analyzed using Crystal Impact Match software (https://www.crystalimpact.de/match/), and the mineralogical compositions were quantified.
The major oxides were measured using XRF to determine the geochemical compositions of the samples. The samples were initially ground to ~200 μm mesh using a Retsch Disc mill (RS-200). The powdered samples were oven-dried (~100°C for 12 h) and pressed into pellets (Stork et al., 1987; Khanna et al., 2009). The analysis was performed using the Wavelength Dispersive X-Ray Fluorescence (WD-XRF) model: Axios max, 4 KW, PANalytical made at BSIP, Lucknow. The precision and accuracy of sample preparation and instrumental performance were checked using international reference standards for sediments (e.g., COQ-1, BCR-2, SGR-1b, Sco-1, JSP-2, RGM-2, and DGH). The accuracy of measurement was better than 2–5%, and the precision was <2%.
Three types of results were obtained in this study: the age of the brick-made structure, the phase nature of quartz and K-feldspar grains extracted from the bricks, and the geochemical composition of the bricks from the structure.
The measured concentrations of uranium, thorium, and potassium, computed dose rates, and De are listed in Table 1. Coarse grains received 56% dose rate from beta particles and 39% from gamma rays whereas fine grains, in addition to these, also received around 20% of the dose rate from alpha particles (Supplementary Table S1). The high thorium concentration in the sample might be due to the presence of monazite and sillimanite in the nearby beach sands of this region (Lakshmi et al., 2019; Abishek et al., 2022).
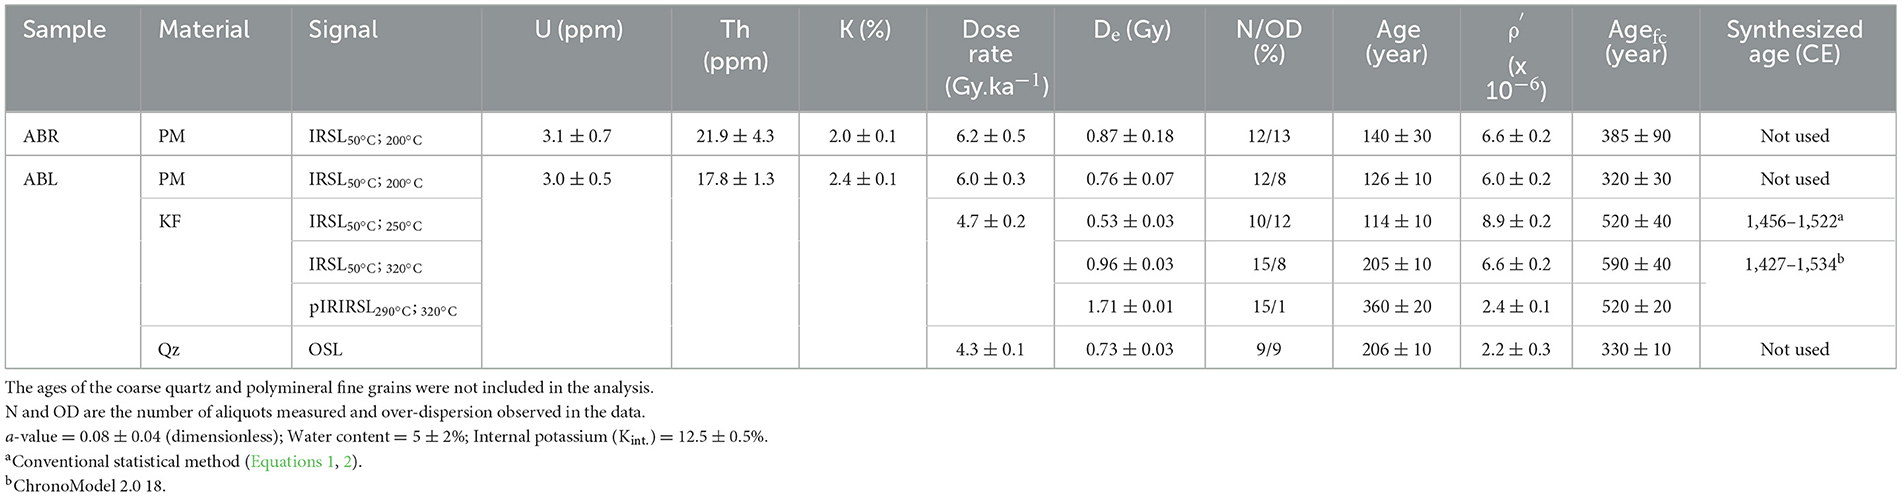
Table 1. Required parameters that were measured and calculated for final age estimation after fading correction.
Quartz was not contaminated by IRSL signals, as inferred from IRpDR values of <2% (Supplementary Figure S1). A De-plateau was observed between the preheating temperatures of 220–260°C for coarse quartz grains (Figure 4A), and hence 240°C was selected for further De analyses and age calculation. For the IRSL50°C signal of the coarse grain K-feldspar, no De-plateau was observed for the preheat temperature range of 175–275°C (Figure 4B). This is contrary to what has been observed by Murray et al. (2009). However, such an increase with the preheat temperature was observed on polymineral fine grains by Zhang et al. (2015). For their sample, Zhang et al. also observed a decreasing fading rate with increasing preheat temperature, and consequently, a fading-corrected age plateau was observed in the range of 180–320°C. The dose recovery tests using coarse quartz and K-feldspar grains (using IRSL50°C; 200°C, pIR IRSL50°C; 320°C and pIR IRSL290°C; 320°C) recovered the laboratory administered dose (1.2 Gy) within 10% (Figure 4C).
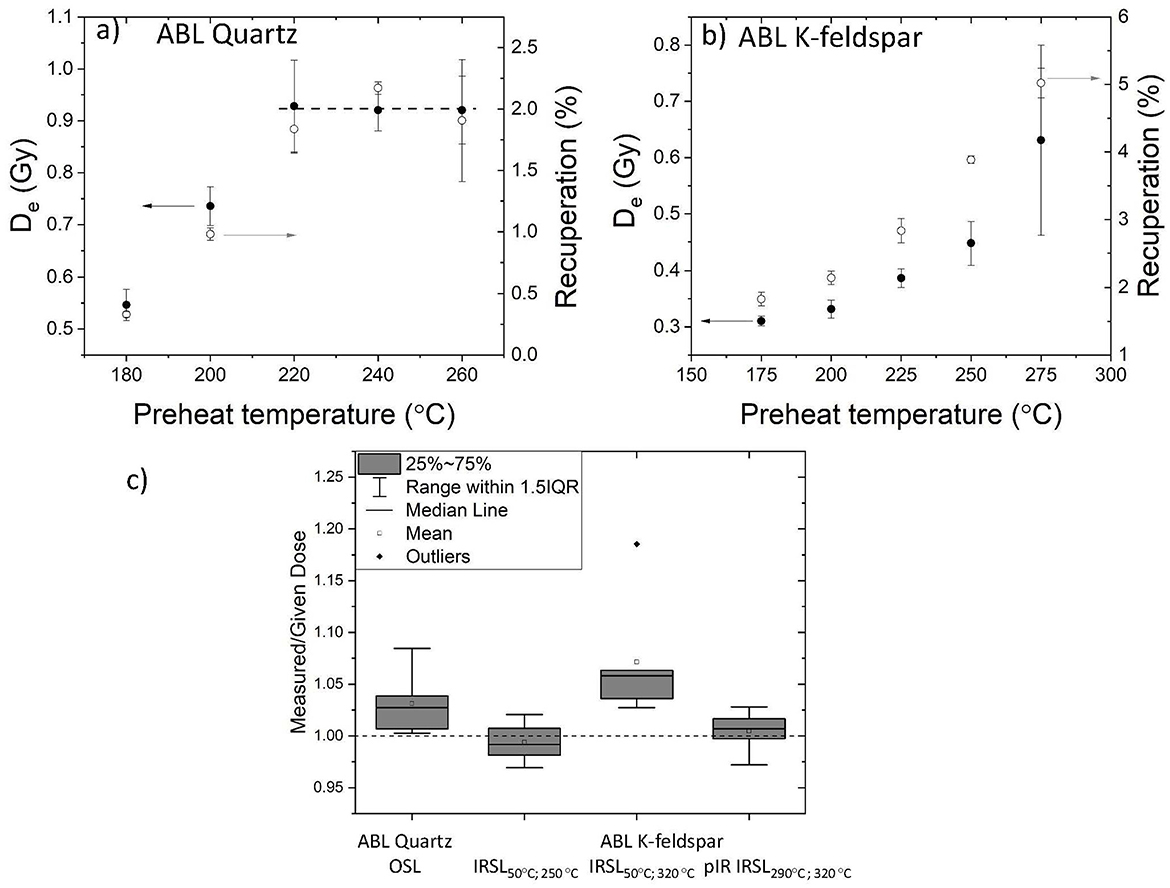
Figure 4. Preheat plateau test results using coarse grain quartz OSL (A) and IRSL of coarse grain K-feldspar (B). The aliquots were not bleached and hence the dose was natural. Each point is the average of three aliquots. (C) Dose recovery test results with preheat temperature of 240°C for quartz OSL, 250°C for K-feldspar IRSL50°C and 320°C for IRSL50°C and pIR IRSL290°C.
Both the measured ages (Age) and fading corrected ages (Agefc) are provided along with the respective fading parameter, ρ′ (Table 1). The measured dose response curves (DRC) were standardized and given in Figure 5A. The DRC of ABR PM was not shown in this figure, but it was indistinguishable from that of ABL PM. Till around 1.5 Gy, all the signals grow indistinguishably with dose, and both IRSL50°C; 320°C and pIR IRSL290°C; 320°C from K-feldspar slightly deviates after that dose (Figure 5A). The observed fading rate in both samples was high, particularly for the K-feldspar samples (Figure 5B, Table 1). The commonly known fading rate parameter, g-value (directly proportional to ρ′) for tc = 1 h (Huntley and Lamothe, 2001) varied from 9.6 ± 0.2%·decade−1 (APL PM, IRSL50°C; 200°C) to 15.5 ± 0.2%·decade−1 (ABL KF, IRSL50°C; 250°C) with an intermediate value of 10.4 ± 0.2%·decade−1 for ABR PM using IRSL50°C; 200°C. Interestingly, the supposedly stable signals such as pIR IRSL290°C; 320°C of K-feldspar and OSL of quartz exhibited fading at a rate of 3.4 ± 0.2%.decade−1 and 3.1 ± 1.3%.decade−1, respectively. Such high fading rates resulted in fading corrected ages that were more than 2.5 times the measured fine grain polymineral ages (Supplementary Figures S2A, B, S3A, B) and ~4.5 times the measured age for the coarse grain K-feldspar (Figure 6A, Table 1, Supplementary Figure S3D). High values of fading rate of IRSL signals both from polymineral and K-feldspar, and fading of otherwise stable quartz OSL signal as if it were a volcanic quartz (Tsukamoto et al., 2007), demand explanation. The pXRD pattern of coarse grain K-feldspar revealed the presence of ~46% sanidine in it (Figure 7, Supplementary Figure S4A), which is a high temperature and hence disordered K-feldspar phase whose luminescence fades rapidly (Li et al., 2016). However, the pXRD pattern of quartz grains revealed that no presence of β-quartz (phase transition after heating beyond 574.3°C) was observed (Figure 7, Supplementary Figure S4B).
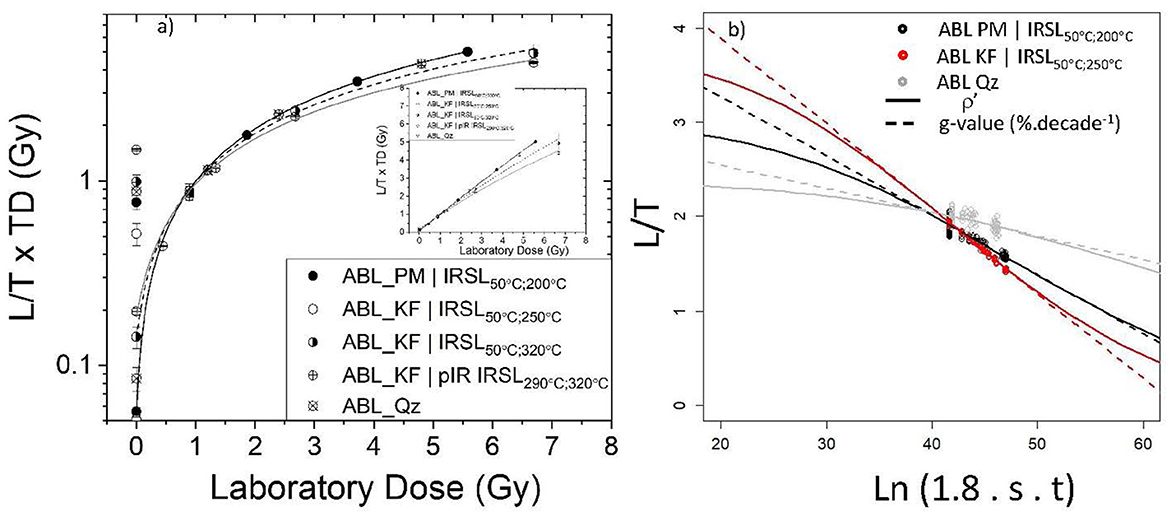
Figure 5. (A) Dose response curves (standardized) of ABL samples using five signals as indicated. (B) Fading rate measurements, and their fitting to the logarithmic function (Huntley and Lamothe, 2001) to calculate the g-value (%·decade−1), and Huntley function (Huntley, 2006) to calculate ρ′. ABL PM, ABL, KF, and ABL Qz—samples from the middle of the river measured using fine-grained polymineral, K-feldspar, and quartz, respectively; ABR PM, samples from the right side of the river measured using fine-grained polymineral.
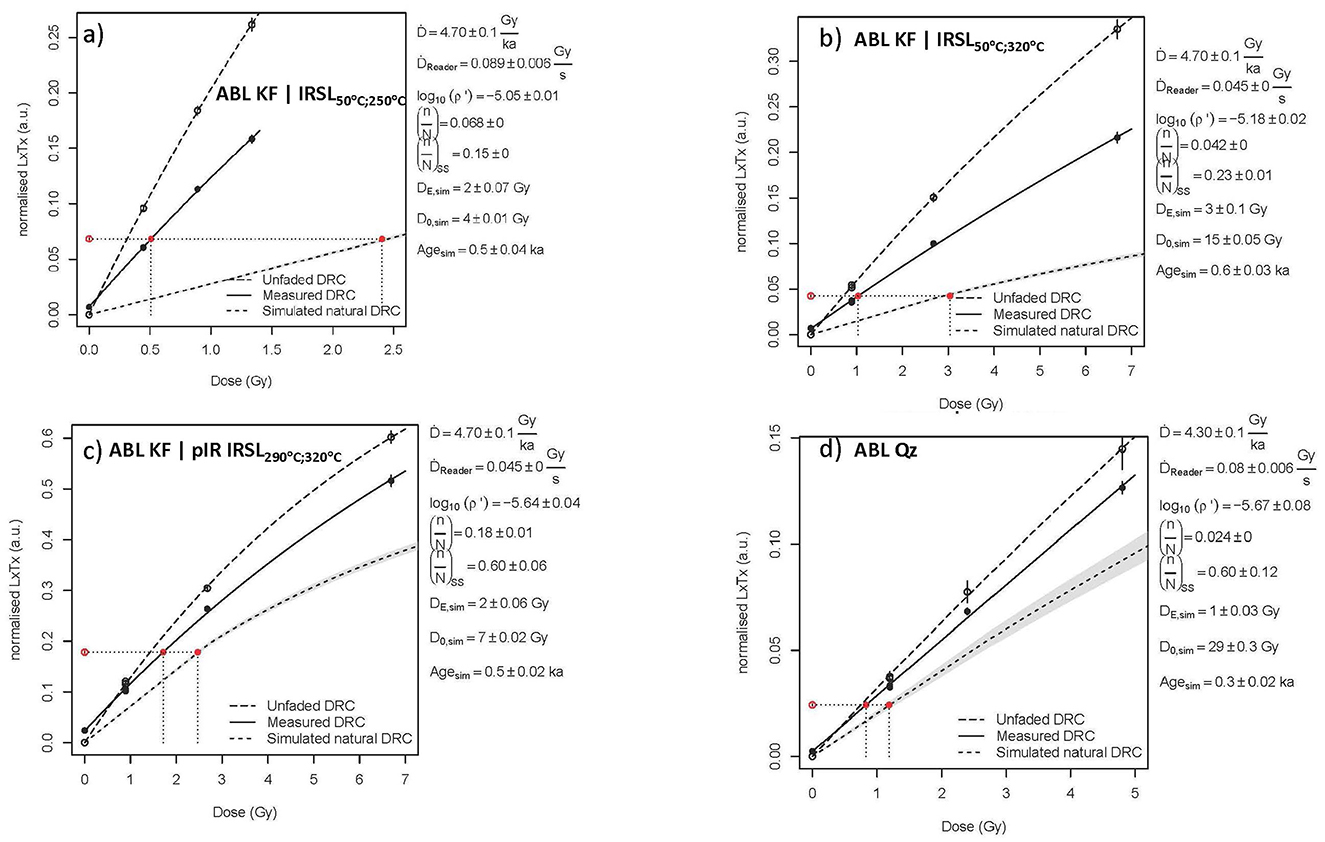
Figure 6. Fading correction by Huntley (2006); Kars et al. (2008) method for coarse K-feldspar grains using (A) IRSL50°C; 250°C, (B) IRSL50°C; 320°C, (C) pIR IRSL290°C; 320°C, and (D) coarse quartz grains OSL of ABL. These are the outputs after the method/command of calc_Huntley2006() as implemented in Luminescence package of R.
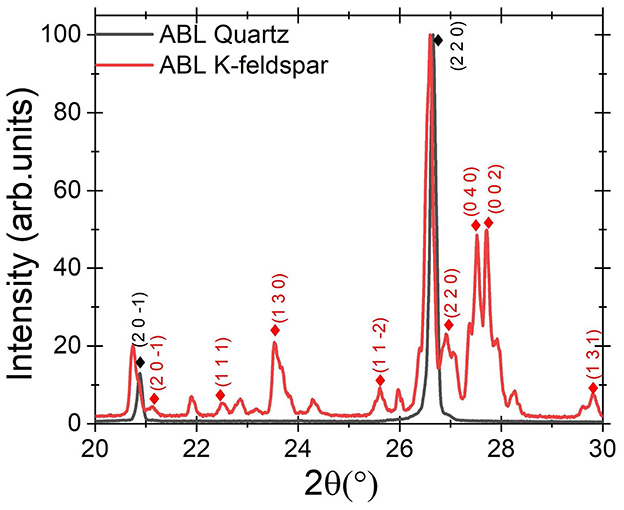
Figure 7. XRD spectra measured from quartz and K-feldspar in the ABL sample. The hkl planes indicated in black and red numerals indicate the presence of α-quartz and sanidine, respectively. The proportion of α-quartz and sanidine are given in Supplementary Figures S4A, B.
The IRSL signals measured after preheating to 320°C i.e., pIR IRSL290°C; 320°C and IRSL50°C; 320°C from the K-feldspar grains of ABL yielded fading corrected ages of 520 ± 20 years and 590 ± 40 years, respectively (Figures 6C, B, Table 1). Both these ages are not significantly different from the fading corrected age of IRSL50°C; 250°C of ABL KF i.e., 520 ± 40 years, and thus validates the fading correction procedure despite large values of fading rate (Table 1). As the bricks had been heated with a variable temperature range of 500 to 1,000°C while baking in the kiln (Krishnan and Hegde, 1988), the unbleachable luminescence signal would be near to nil and hence the age using pIR IRSL290°C; 320°C might be correct. Thus, the consistency of three corrected ages obtained by different signals (fading corrected ages being 1.4 times, 2.9 times, and 4.5 times the measured age for pIR IRSL290°C; 320°C, IRSL50°C; 320°C and IRSL50°C; 250°C, respectively; Supplementary Figures S3D–F) increases the reliability of the age of ABL.
The ages of both fine grain polymineral (320 ± 30 years) and coarse grain quartz (330 ± 10 years; Figure 6D, Table 1) were significantly younger compared to the coarse grain K-feldspar ages (Table 1). A similar age (385 ± 90 years) of ABR (using IRSL50°C; 200°C) as to that of ABL using both quartz OSL and polymineral fine grain (IRSL50°C; 200°C) warrants our attention. There must be a systematic offset that caused underestimation, and that needs to be addressed. Probably the pIR IRSL290°C; 320°C measurement on fine grain polymineral samples will help, and it is a future endeavor as there is no sample now left. Regarding quartz age, there is one report where almost 50% underestimation of quartz ages (fine grain) was observed, compared to the polymineral ages, and there is no conclusive reason for this unusual behavior (Perić et al., 2021). In that study, the possible reasons were the thermal and a-thermal (anomalous fading) instability, difference in the natural and laboratory growth curves (Perić et al., 2021). If these ages (of quartz and fine grain polymineral; around 340 years) were correct, then adequate reasons are to be sought to discard the ages of coarse grain K-feldspar of around 540 years, which would be even more difficult. Until further investigation shows the ages of fine grain polymineral and coarse grain quartz are correct, these ages are not included in the final calculation.
So, excluding coarse-grain quartz ages of ABL and both the fine grain polymineral ages of ABL and ABR, all the ages of coarse grain K-feldspar of ABL were synthesized to one age using: a) conventional statistical method (1456–1522 CE); and b) ChronoModel (1427–1534 CE). These age ranges are within 95% confidence (Supplementary Figure S5, Table 1). It should be noticed that the assumption of independent ages necessary to apply ChronoModel is not strictly true here since the three ages were calculated with the same dose rate.
Similar ages, however lower due to a systematic error in the De measurement protocol, for the bricks collected from the structures found both at the right side (ABR; 385 ± 90 years) and the middle of the river (ABL; 320 ± 30 years) using fine grain polymineral (fading corrected), suggest that both the structures were most probably contemporaneous. This, in turn, implies that these two structures were constructed at the same time, thereby excluding the possibility of reworking by rivers from elsewhere. The similar geochemical composition (Table 2, Figure 8) of the bricks from both locations further supports the inference that these structures were not reworked from elsewhere but were likely parts of a single structure. Had both the bricks (ABL and ABR) been made from different places and came to the present location by reworking, the geochemical compositions of the mud most probably would be different unless they were brought from shorter distance. Thus, the contemporaneity of the studied two bricks and their similar geochemical composition and moderately weathered nature of the constituting mud suggest these bricks are part of a single structure.

Table 2. Weight percentage of major oxides measured from XRF are tabulated.
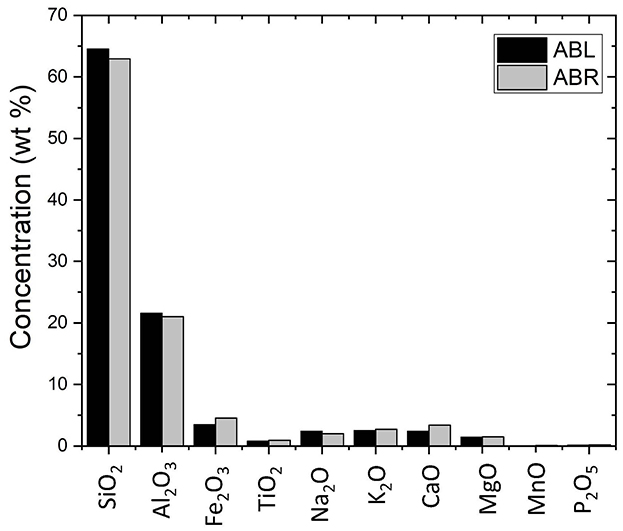
Figure 8. Concentration of major oxides (in wt%) from samples from both the middle of the river and the right side of the river.
The round off synthesized age estimate (1430–1530 CE) situates the structure historically within the Vijayanagar Empire in Tamil Nadu. Although Harihara and Bukka established Vijayanagar Empire in Madurai with the help of their General Kampanna by defeating Madurai Sultanate by the year 1378 CE, the Late Pandyas had some hold in the Tirunelveli region (the study region). They (Late Pandyas) were not fighting with the Vijayanagar Empire but having peace treaties during this time. One of the Late Pandya kings, named Parakrama, renovated the central shrine and the mandapas of a temple in Kutralam of Tirunelveli region by 1387 CE (Nilakanta Sastri, 1929). In another instance, another king named Jatavarman Kulasekhara claimed to have rebuilt a temple at Ilanji of Tirunelveli region and founded a new Brahmin village during 1395–1396 CE (Nilakanta Sastri, 1929). Although not many records are available for other Late Pandyan kings, there are copper plates showing that they ruled this region till before 1675 CE (Nilakanta Sastri, 1929). Based on our results and the above records, we can be sure that the brick structure of this study might have been made by the Late Pandyas. Despite discrepancies between the quartz, polymineral, and K-feldspar ages, the chronological constraints provided by this study are sufficient to reject the hypothesis that this structure dates back to the Early Pandyas (400 BCE−300 CE).
Although the exposed brick structure in the middle of Thamirabarani River turned out not to be of Early Pandyas based on multiple luminescence ages of coarse K-feldspar grain from the bricks, the ages using quartz and fine grain polymineral are poorly understood, and it calls for further investigation. However, a consistent and precise set of ages (1430–1530 CE) from coarse grain K-feldspar from the bricks attribute the structure to Late Pandyas who were involved in constructions during Vijayanagar Empire in southern India, even after the decline of the Pandyas since 1335 CE. With the evidence we have, it is difficult to discern whether the structure is a ruined palace, temple, bridge, irrigation check dam, or bathing steps. Further, the actual dimension, lateral connectivity, and extension of these structures need to be investigated through the subsurface geophysical surveys, which will help us to know whether it was built across the river or outside of the course of river in the past.
The original contributions presented in the study are included in the article/Supplementary material, further inquiries can be directed to the corresponding author.
Written informed consent was obtained from the individual(s) for the publication of any potentially identifiable images or data included in this article.
PM: Conceptualization, Data curation, Formal analysis, Methodology, Project administration, Resources, Supervision, Writing – original draft. MS: Data curation, Formal analysis, Writing – review & editing. SKS: Data curation, Formal analysis, Visualization, Writing – review & editing. SS: Resources, Writing – review & editing. MK: Resources, Writing – review & editing. PS: Data curation, Formal analysis, Writing – review & editing. NC: Data curation, Supervision, Writing – review & editing. KK: Data curation, Methodology, Writing – review & editing. SN: Visualization, Writing – review & editing. NK: Methodology, Writing – review & editing.
The author(s) declare that no financial support was received for the research, authorship, and/or publication of this article.
We thank the Director of Birbal Sahni Institute of Palaeosciences for approving this project (BSIP/PROJECTS/2019/L-2478 dated 29.03.2019), its execution and publication (BSIP/RDCC/Publication no. 29/2024-25). We thank Mr. Ishwar Shukla and Dr. Amrit Pal Chadda for their assistance with luminescence sample preparation, measurements, and X-ray fluorescence measurements. We thank Mr. Shubhajit Ghosh and Ms. Prachita Arora for their help in making better visualization. We sincerely thank the reviewers for their comments and suggestions that improved the content and readability of this manuscript.
The authors declare that the research was conducted in the absence of any commercial or financial relationships that could be construed as a potential conflict of interest.
All claims expressed in this article are solely those of the authors and do not necessarily represent those of their affiliated organizations, or those of the publisher, the editors and the reviewers. Any product that may be evaluated in this article, or claim that may be made by its manufacturer, is not guaranteed or endorsed by the publisher.
The Supplementary Material for this article can be found online at: https://www.frontiersin.org/articles/10.3389/fearc.2025.1464315/full#supplementary-material
SUPPLEMENTARY FIGURE S1 | OSL with IRSL and OSL without IRSL, and the IRSL itself are plotted for one aliquot of ABL coarse quartz grain for a dose of 0.9 Gy.
SUPPLEMENTARY FIGURE S2 | Fading correction by Huntley (2006) and Kars et al. (2008) method for the fine grain polymineral of both ABL (A) and ABR (B).
SUPPLEMENTARY FIGURE S3 | Radial plots showing the measured (black points) and fading corrected (red points) ages of (A) ABR PM, (B) ABL PM, (C) ABL Quartz and, IRSL50°C; 250°C (D), IRSL50°C; 320°C (E) and pIR IRSL290°C; 320°C (F) signals measured from K-feldspar of ABL .
SUPPLEMENTARY FIGURE S4 | Quantification of the mineralogical composition as measured from the XRD spectra of (A) K-feldspar and (B) quartz. Quantification was done by Match software (Match! - Phase Analysis using Powder Diffraction, Crystal Impact - Dr. H. Putz & Dr. K. Brandenburg GbR, Kreuzherrenstr. 102, 53227 Bonn, Germany, https://www.crystalimpact.de/match.).
SUPPLEMENTARY FIGURE S5 | Synthesis of three age estimates of coarse grain K-feldspar of ABL using three distinctive IRSL signals. The synthesized age estimate is shown at the top, and the bottom three ages were the inputs.
SUPPLEMENTARY Table S1 | Alpha, beta, gamma, and internal dose rates are given. The cosmic ray dose rate was 0.21 ± 0.02 Gy/ka.
Abishek, S. R., Ravindran, A., and Kingston, J. (2022). “Heavy mineral separation and identification in parts of southeast coastal area, Tamil Nadu, India,” IIP Proceedings, Vol. 2, 23–35.
Adamiec, G., and Aitken, M. J. (1998). Dose-rate conversion factors: update. Ancient TL 16, 37–50. doi: 10.26034/la.atl.1998.292
Ali, S. N., Priyanka, S., Prachita, A., Pinkey, B. A., and Morthekai, P. (2022). Luminescence dating of the late pleistocene glacial and glacio-fluvial sediments in the Central Himalaya, India. Quat. Sci. Rev. 284:107464. doi: 10.1016/j.quascirev.2022.107464
Arunachalam, B., Sukumar, B., and Sukumar, A. (2006). Reconstruction of the ancient Port, Korkai in Tuttukkudi District of Tamil Nadu. Curr. Sci. 91, 278–280.
Auclair, M., Lamothe, M., and Huot, S. (2003). Measurement of anomalous fading for feldspar IRSL using SAR. Radiat. Meas. 37, 487–492. doi: 10.1016/S1350-4487(03)00018-0
Banks, W. E. (2015). Constructing chronologies for the late middle paleolithic and upper paleolithic: limitations and means to overcome them. World Archaeol. 47, 585–600. doi: 10.1080/00438243.2015.1052544
Bell, W. T. (1980). Alpha dose attenuation in quartz grains for thermoluminescence dating. Ancient TL 4:5. doi: 10.26034/la.atl.1980.039
Binder, D., Battentier, J., Delhon, C., and Sénépart, I. (2017). In pursuit of a missing transition: the mesolithic and neolithic radiocarbon chronology at la font-aux-pigeons rockshelter. Antiquity 91, 605–620. doi: 10.15184/aqy.2017.65
Biswas, R. H., Williams, M. A. J., Raj, R., Juyal, N., and Singhvi, A.K. (2013). Methodological studies on luminescence dating of volcanic ashes. Quat. Geochronol. 17, 14–25. doi: 10.1016/j.quageo.2013.03.004
Brennan, B. J., Lyons, R. G., and Phillips, S. W. (1991). Attenuation of alpha particle track dose for spherical grains. International Journal of Radiation Applications and Instrumentation. Part D. Nuclear Tracks and Radiat. Meas.18, 249–253. doi: 10.1016/1359-0189(91)90119-3
Caldwell, R. (1881). A political and general history of the District of Tinnevelly in the Presidency of Madras. Madras.
Durcan, J. A., King, G. E., and Duller, G. A. T. (2015). DRAC: dose rate and age calculator for trapped charge dating. Quat. Geochronol. 28, 54–61. doi: 10.1016/j.quageo.2015.03.012
Foote, R. B. (1883). “On the geology of the Madura and Tinnevelly districts,” in Memoirs of the Geological Survey of India (Calcutta: Geological Survey of India).
Guerin, G., Mercier, N., Nathan, R., Adamiec, G., and Lefrais, Y. (2012). On the use of the infinite matrix assumption and associated concepts: a critical review. Radiat. Meas. 47:8. doi: 10.1016/j.radmeas.2012.04.004
Gupta, E., and Rajani, M. B. (2023). Late holocene morphodynamic evolution of Thamirabarani delta and Thoothukudi tombolo in South India: insights from integrated analysis of early cartographic documents and satellite images. J. Coast. Conserv 27:3. doi: 10.1007/s11852-023-00932-4
Huntley, D., and Baril, M. R. (1997). The K content of the K-feldspars being measured in optical dating or in thermoluminescence dating. Ancient TL 15:3. doi: 10.26034/la.atl.1997.271
Huntley, D. J. (2006). An explanation of the power-law decay of luminescence. J. Phys. Condens. Matter 18, 1359–1365. doi: 10.1088/0953-8984/18/4/020
Huntley, D. J., and Lamothe, M. (2001). Ubiquity of anomalous fading in K-feldspars and the measurement and correction for it in optical dating. Can. J. Earth Sci. 38, 1093–1106. doi: 10.1139/e01-013
Kars, R. H., Wallinga, J., and Cohen, K. M. (2008). A new approach towards anomalous fading correction for feldspar IRSL dating—tests on samples in field saturation. Radiat. Meas. 43, 786–790. doi: 10.1016/j.radmeas.2008.01.021
Khanna, P. P., Saini, N. K., Mukherjee, P., and Purohit, K. K. (2009). An appraisal of ICP-MS technique for determination of REEs: long term QC assessment of silicate rock analysis. Himalayan Geol. 30, 95–99.
Kreutzer, S., Burow, C., Dietze, M., Fuchs, M. C., Schmidt, C., Fischer, M., et al. (2018). Luminescence: Comprehensive Luminescence Dating Data Analysis. R package version 0.8.6.
Kreutzer, S., Schmidt, C., Dewitt, R., and Fuchs, M. (2014). The a-value of polymineral fine grain samples measured with the post-IR IRSL protocol. Radiat. Meas. 69, 18–29. doi: 10.1016/j.radmeas.2014.04.027
Krishnan, K. A., and Hegde, K. T. M. (1988). Chemical and Petrographic Studies in Pottery of Harappa Culture in Gujarat. J. M. S. Univ. Baroda 35, 27–56.
Lakshmi, K. S., Meenakshisundaram, V., and Punniyakotti, J. (2019). Effect of natural radioactivity content in the beach sands along the east coast of Tamil Nadu, India, due to tsunami. Radiat. Prot. Environ. 42, 22–27. doi: 10.4103/rpe.RPE_9_19
Lanos, P., and Dufresne, P. (2019). ChronoModel version 2.0: Software for Chronological Modelling of Archaeological Data using Bayesian Statistics. Available online at: https://chronomodel.com/
Lanos, P., and Philippe, A. (2017). Hierarchical Bayesian modeling for combining dates in archaeological context. J. Soc. Fr. Stat. 158, 72–88.
Lapp, T., Kook, M., Murray, A. S., Thomsen, K. J., Buylaert, J. P., and Jain, M. (2015). A new luminescence detection and stimulation head for the Risø TL/OSL reader. Radiat. Meas. 81, 178–184. doi: 10.1016/j.radmeas.2015.02.001
Li, B., Roberts, R. G., Brumm, A., Guo, Y., Hakim, B., Ramli, M., et al. (2016). IRSL dating of fast-fading sanidine feldspars from Sulawesi, Indonesia. Ancient TL 34, 1–13. doi: 10.26034/la.atl.2016.503
Mahalingam, A. (2015). Artistic expansion under the Vijayanagar—Nayaks in Tamil Nadu (C. E. 1529–1736). J. Soc. Humanity Res. 3:4.
Manoranjithamoni, C. (2012). History of Tamil Nadu—Upto 1565 A.D. Tirunelveli, Tamil Nadu, India: Dave-Beryl Publications.
Mejdahl, V. (1979). Thermoluminescence dating: beta-dose attenuation in quartz grains. Archaeometry 21, 61–72. doi: 10.1111/j.1475-4754.1979.tb00241.x
Morthekai, P., Jain, M., Cunha, P. P., Azevedo, J. M., and Singhvi, A. K. (2011). An attempt to correct for the fading in million year old basaltic rocks. Geochronometria 38, 223–230. doi: 10.2478/s13386-011-0033-6
Murray, A. S., Buylaert, J. P., Thomsen, K. J., and Jain, M. (2009). The effect of preheating on the IRSL signal from feldspar. Radiat. Meas.44, 554–559. doi: 10.1016/j.radmeas.2009.02.004
Murray, A. S., and Roberts, R. G. (1998). Measurement of the equivalent dose in quartz using a regenerative-dose single-aliquot protocol. Radiat. Meas.29, 503–515. doi: 10.1016/S1350-4487(98)00044-4
Murray, A. S., and Wintle, A. G. (2000). Luminescence dating of quartz using an improved single-aliquot regenerative-dose protocol. Radiat. Meas. 32, 57–73. doi: 10.1016/S1350-4487(99)00253-X
Nilakanta Sastri, K. A. (1929). The Pandyan Kingdom. From the earliest times to the sixteenth century. London: Luzac and Co.
Pathy, G. A. K. R. (2013). The architecture and the pillars of temples under Vijayanagar—Nayaka: a study. Aayvagam Int. J. Multidiscip. Res. 1:6.
Perić, Z. M., Marković, S. B., Filyó, D., Thiel, C., Murray, A. S., Gavrilov, M. B., et al. (2021). Quartz OSL and polymineral post IR–IRSL dating of the PoŽarevac loess–palaeosol sequence in north–eastern Serbia. Quat. Geochronol. 66:101216. doi: 10.1016/j.quageo.2021.101216
Porat, N. (2006). Use of magnetic separation for purifying quartz for luminescence dating. Ancient TL 24, 33–36. doi: 10.26034/la.atl.2006.394
Prescott, J. R., and Hutton, J. T. (1994). Cosmic ray contributions to dose rates for luminescence and ESR dating: large depths and long-term time variations. Radiat. Meas.23, 497–500. doi: 10.1016/1350-4487(94)90086-8
Preusser, F., and Kasper, H. U. (2001). Comparison of dose rate determination using high-resolution gamma spectrometry and inductively coupled plasma-mass spectrometry. Ancient TL 19, 19–23. doi: 10.26034/la.atl.2001.329
Sharma, A., Chouhan, M., and Sharma, S. K. (2024). Band gap modulation in Zn2TiO4 spinels for efficient UV-A persistent luminescence. Appl. Sci. 14:4456. doi: 10.3390/app14114456
Singh, P., Ali, S. N., Prakash, K., and Morthekai, P. (2023). Efficacy of fading correction to date late quaternary higher central himalayan lacustrine sediment. J. Sci. Res. 67:5. doi: 10.37398/JSR.2023.670402
Singh, P., Sarangi, V., Bhushan, R., Ali, N. S., Agrawal, S., Tiwari, P., et al. (2024). Presence and implications of petrogenic organic carbon in High Himalayan Crystalline lake sediment. Radiocarbon. doi: 10.1017/RDC.2024.87
Stork, A. L., Smith, D. K., and Gill, J. B. (1987). Evaluation of geochemical reference standards by x-ray fluorescence analysis. Geostandards Newslett. 11, 107–113. doi: 10.1111/j.1751-908X.1987.tb00013.x
Tsukamoto, S., Murray, A. S., Huot, S., Watanuki, T., Denby, P. M., and Bøtter-Jensen, L. (2007). Luminescence property of volcanic quartz and the use of red isothermal TL for dating tephras. Radiat. Meas.42, 190–197. doi: 10.1016/j.radmeas.2006.07.008
Visocekas, R., Spooner, N. A., Zink, A., and Blanc, P. (1994). Tunnel afterglow, fading and infrared emission in thermoluminescence of feldspars. Radiat. Meas.23, 377–385. doi: 10.1016/1350-4487(94)90067-1
Wintle, A. G. (1973). Anomalous fading of thermo-luminescence in mineral samples. Nature 245:143. doi: 10.1038/245143a0
Keywords: Luminescence dating, IRSL, OSL, brick, Pandya dynasty, Vijayanagar Empire, South India
Citation: Morthekai P, Singhal M, Sharma SK, Sivasubramaniam S, Kamarasu M, Singh P, Chauhan N, Kumar K, Nawaz SA and Khonde N (2025) Investigating historical attribution: luminescence dating of bricks from a submerged structure in southeastern India. Front. Environ. Archaeol. 4:1464315. doi: 10.3389/fearc.2025.1464315
Received: 13 July 2024; Accepted: 18 February 2025;
Published: 11 March 2025.
Edited by:
Aditi K. Dave, Université de Lausanne, SwitzerlandReviewed by:
Chantal Tribolo, Centre National de la Recherche Scientifique (CNRS), FranceCopyright © 2025 Morthekai, Singhal, Sharma, Sivasubramaniam, Kamarasu, Singh, Chauhan, Kumar, Nawaz and Khonde. This is an open-access article distributed under the terms of the Creative Commons Attribution License (CC BY). The use, distribution or reproduction in other forums is permitted, provided the original author(s) and the copyright owner(s) are credited and that the original publication in this journal is cited, in accordance with accepted academic practice. No use, distribution or reproduction is permitted which does not comply with these terms.
*Correspondence: Paulramasamy Morthekai, bW9ydGhla2FpQGdtYWlsLmNvbQ==
Disclaimer: All claims expressed in this article are solely those of the authors and do not necessarily represent those of their affiliated organizations, or those of the publisher, the editors and the reviewers. Any product that may be evaluated in this article or claim that may be made by its manufacturer is not guaranteed or endorsed by the publisher.
Research integrity at Frontiers
Learn more about the work of our research integrity team to safeguard the quality of each article we publish.