 Min Xu1
 Wanyan Zeng
95% of researchers rate our articles as excellent or good
Learn more about the work of our research integrity team to safeguard the quality of each article we publish.
Find out more
BRIEF RESEARCH REPORT article
Front. Energy Res. , 17 February 2025
Sec. Sustainable Energy Systems
Volume 13 - 2025 | https://doi.org/10.3389/fenrg.2025.1540577
This article is part of the Research Topic Advanced Technologies for High-quality Development of Distribution Systems with Distributed Energy Resources View all 4 articles
This paper proposes a multi-grade reactive power utilization evaluation strategy for distribution networks with high renewables to identify the devices with low-grade utilization efficiency. Firstly, a suitability assessment indicator is presented to quantify the mismatch degree between reactive power demand and compensation capacity in distribution substations, and then a Kantorovich distance-based scenario reduction method is used to obtain typical reactive power load curves from historical data. Furthermore, influence factors on reactive power planning are investigated for distribution networks with different penetration level of renewable energy sources. Finally, considering zonal differences in load types and network structures, a multi-grade utilization evaluation strategy is proposed to identify inefficient reactive power equipment under various operating conditions. Comparative case studies have validated the superior performance of the proposed strategy for better utilization of reactive power compensation equipment.
With the increasing penetration of renewable energy sources (RESs) connected to distribution networks, reactive power imbalance and voltage fluctuation problems have become increasingly prominent due to the intermittency and fluctuation of RESs (Kroposki, 2017). Various reactive power compensation equipment, including capacitor banks, static var compensator (SVC) and static var generator (SVG), have been extensively used to improve the voltage profile and power loss of distribution networks (Li et al., 2005; Salih and Chen, 2015). However, affected by the stochastic bidirectional power flow, these reactive power compensation devices always fail to meet the fluctuating reactive power demand with low utilization efficiency (Jhala et al., 2019; Xu et al., 2017). So far, lots of power equipment utilization evaluation methods, such as load factor (He et al., 2018), capacity-load ratio (Rani et al., 2024) and life cycle utilization rate (Hu et al., 2015; Ye et al., 2018), have been reported to identify the transformers and electrical feeders with low-grade utilization efficiency (Shi et al., 2017; Utlu and Hepbasli, 2007a). With the high-level integration of RESs in distribution networks, utilization evaluation methods for reactive power compensation equipment have not been involved (Li et al., 2020; Magdy et al., 2018; Bejestani et al., 2014). Consequently, this study aims to offer insightful perspectives and discussions on the evaluation of multi-grade reactive power utilization in distribution networks with high shares of RESs.
The main contributions of this study are twofold as listed: (1) A suitability assessment indicator is presented to quantify the mismatch degree between reactive power demand and compensation capacity in distribution substations, and a Kantorovich distance-based scenario reduction method is used to obtain typical reactive power demand curves from historical data; (2) Influence factors on reactive power planning are investigated for distribution networks with different penetration level of renewable energy sources, and a multi-grade evaluation method is proposed for identifying reactive power compensation equipment with low utilization efficiency.
Due to issues with reactive power demand and voltage exceeding normal ranges in substations, it is necessary to propose a suitability assessment indicator to evaluate the degree of matching between reactive power allocation and reactive power demand (Liu et al., 2014). The suitability assessment indicator is defined as the ratio of the reactive power mismatch area to the area provided by compensation equipment (Li et al., 2005). The reactive power demand of a substation
where
To reduce the computational costs for the 365 days-long analysis of historical data from the substation, a Kantorovich distance-based scenario reduction method is employed to generate a set of typical reactive power demand curves for calculating the suitability assessment indicator (do Prado and Qiao, 2018), as shown in Figure 1A. The Iterative Self-organizing Data Analysis Techniques Algorithm (ISODATA) is applied to group the 365 days of reactive power demand curves into distinct clusters (Lin et al., 2017; Li et al., 2024; Cao et al., 2024). For the i-th cluster set
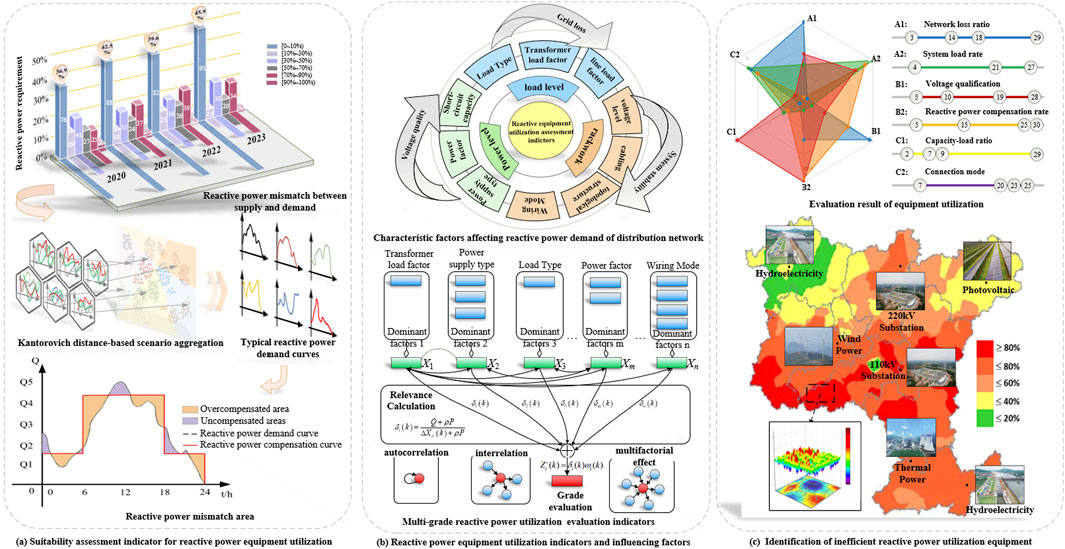
Figure 1. Suitability assessment and multi-grade utilization evaluation of reactive power.
Based on the Kantorovich distance-based scenario reduction method described above, the set of demand curves is generated for enhancing computational efficiency and extracting the typical operating characteristics in the substation. Considering the discrete voltage regulation behavior of capacitors, a stepwise compensation curve can be generated based on capacitor switching taps and the average value between adjacent taps. The capacitor switching tap
where
In recent years, some zones have faced challenges such as weak network structures, limited power supply capacity, inefficient reactive power compensation equipment, and a high idle rate of capacitors (Rani et al., 2024; Zhou et al., 2018; Keane et al., 2010; Keane and O’Malley, 2007). And existing standards primarily focus on individual standards such as reactive power allocation, power factor, and voltage qualification rate (Utlu and Hepbasli, 2007a; Utlu and Hepbasli, 2007b). Therefore, it is essential to establish a comprehensive and effective of the utilization evaluation strategy for reactive power compensation equipment in preventing prolonged equipment idleness and enhancing the utilization of reactive power compensation equipment. Moreover, the levels and fluctuations of reactive power demand in substations directly affect the utilization of reactive power compensation equipment (Qin et al., 2010). Considering characteristic factors such as power source and load types, grid structure, key parameters are presented to accurately analyze the reactive power demand of distribution networks with varying proportions of RESs, such as short-circuit capacity, voltage level, topology, and power factor, as shown in Figure 1B.
The utilization evaluation strategy of reactive power compensation equipment includes several key indicators: the suitability, the idle rate, the switching uniformity, and the capacity utilization rate. The suitability
where
The capacity utilization rate is only a positive indicator. Therefore, it is necessary to normalize and align the directions of all indicators to ensure consistency in the evaluation process. A balanced and comprehensive method is employed to determine the weights of four indicators by combining the entropy weight method and the Criteria Importance Through Intercriteria Correlation (CRITIC) method. The Technique for Order Preference by Similarity to an Ideal Solution (TOPSIS) method is then used to rank the utilization efficiency based on the proximity of the evaluation objects to the ideal target (Arce et al., 2015). The final calculation results are converted to a 0–100 range with a linear scaling method, and rounded up to the nearest integer to obtain the utilization evaluation standards (Guo et al., 2013). Considering zonal differences in load types and grid structures, the demand for reactive power equipment utilization can generally be classified into four types: commercial areas, industrial areas, residential areas, and rural areas. The commercial areas exhibits stable daily load with prominent morning and evening peaks; the industrial areas has complex and volatile loads, significantly influenced by production schedules and equipment operation, resulting in high dynamic randomness; the residential areas shows obvious daily load fluctuations, with prominent morning and evening peaks and lower loads during midday and nighttime; the rural areas experience strong seasonal load fluctuations, significantly affected by external factors such as busy and slack farming seasons and climatic conditions. These distinct characteristics lead to regionalized reactive power demands in each area, posing different requirements for the configuration and utilization rates of reactive power equipment. The four types can be further subdivided into high or low proportions of RESs, thereby setting out multi-grade evaluation standards for the utilization rate of reactive power compensation equipment. The score for low efficiency in reactive power equipment utilization is defined as below 40. Thus, a multi-grade evaluation strategy can be employed for different zones to identify reactive power compensation equipment with low utilization efficiency, as shown in Figure 1C.
To highlight the advantages of the proposed reactive power demand calculation method in improving voltage compensation effectiveness compared to other traditional calculation methods, a 110 kV substation in Gansu Province, China, is selected as the study object for comparative analysis in terms of meeting voltage compliance requirements. The specific topology is shown in Figure 2A. The main transformer is of type SSZ10-31500/110. Branch 3-4 and branch 4-5 are both overhead lines (JL/G1A-120), with lengths of 42.8 km and 40.1 km, respectively. The power base value is set at 100 MVA, and the voltage limits for nodes are defined as 1.05 p.u. and 0.95 p.u. The voltage distribution results for the substation over a year are analyzed under three cases, as illustrated in Figures 2B–D: without capacitor compensation; with capacitor compensation based on the reactive power demand calculated by the traditional calculation method; with capacitor compensation referring to the reactive power demand obtained by the proposed method.

Figure 2. Topology and voltage distribution comparison for a 110 kV substation.
The per-unit voltage distribution without capacitor compensation is shown in Figure 2B. The results of node voltages falling below 0.95 p.u. indicate that the absence of reactive power compensation leads to voltage distribution noncompliance at the substation, thereby compromising the stability of the power system. Over-limit voltage issues persist at certain nodes in Figure 2C, indicating that the reactive power demand calculated by the traditional method as the capacitor compensation value improves overall voltage levels but fails to address variations in reactive power demand effectively. Additionally, the traditional method oversimplifies transformer losses and does not ensure the power factor remains within the acceptable range. The reactive power demand calculated by the proposed method in Equations 1–3 for capacitor compensation demonstrates all node voltages remain within the qualified range of 0.95–1.05 p.u., as shown in Figure 2D. In contrast to the traditional method, the proposed method precisely matches reactive power demand to enhance voltage compliance rates and operational stability, providing more reliable and scientifically grounded guidance for reactive power compensation. Consequently, the proposed method ensures that all node voltages simultaneously remain within the acceptable range, meeting both operational needs and voltage quality requirements.
Four cases are employed for analyzing various types of zones to further verify the effectiveness of the proposed suitability assessment indicator evaluation model. Case 1 and Case 4 apply the proposed ISODATA clustering method combined with the Kantorovich distance-based scenario reduction method. Case 2 employs only the ISODATA clustering method, while Case 3 applies the k-means method. Cases 1–3 adopt the proposed reactive power demand calculation method, whereas Case 4 implements the traditional method. The comparative results to evaluate suitability assessment indicators for various zone types are presented in Table 1.
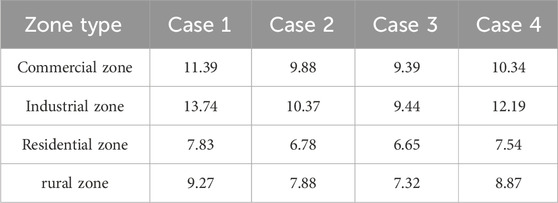
Table 1. Suitability assessment indicators for various zone types in four cases.
From the above table, Case 1 demonstrates significantly higher suitability in zone types compared to other cases. This indicates that the proposed evaluation model effectively captures reactive power demands by accounting for a wide range of operating conditions and power flow scenarios, accurately reflecting the matching degree between reactive power demands and compensation capacities under diverse scenarios, such as peak loads, valley loads, and seasonal fluctuations. Compared with Case 2 and Case 3, the proposed ISODATA clustering method demonstrates better performance in addressing irregular reactive power demand data and dynamically adjusting the number of clusters. Cases 2 and 3 both rely on a single or a few typical operating conditions for reactive power balance calculations, such as maximum or minimum load, simplifying the actual reactive power demand and resulting in generally lower calculation values. Compared with Case 4, Case 1 not only more accurately captures variations in reactive power demands of substations under diverse operating conditions and closely aligns with actual operating characteristics, but also identifies potential mismatch issues through higher suitability.
The suitability in the industrial zone is higher than other zones due to significant and complex load fluctuations driven by large inductive loads, such as motors and heavy machinery. Frequent equipment start-ups and shutdowns during production processes lead to rapid changes in load, causing large fluctuations in the reactive power demand curve. In contrast, residential zones exhibit relatively low overall loads with minimal fluctuations, resulting in a smooth reactive power demand curve and the lowest suitability among all zones. The suitability in commercial and rural zones falls between that of industrial and residential zones. Commercial zones demonstrate relatively high suitability but slightly lower than industrial zone. The load in commercial areas primarily comes from equipment such as lighting, air conditioners and elevators with smaller fluctuations than those in industrial zone. The load in rural areas is relatively dispersed with longer transmission lines. Particularly during agricultural production seasons, the application of irrigation systems and electric machinery leads to significant load fluctuations, increasing the suitability and causing sharp variations in demand.
In order to validate the effectiveness of the evaluation strategy for multi-grade reactive power utilization, three cases for a comparative analysis of zonal applicability are designed in the present study. Case 5 implements the proposed method described in this study. In Case 6, ignoring the impacts of renewable energy penetration and load types, each zone is scored and ranked separately with the same indicator weights. In Case 7, similar to Case 5, indicator weights are customized based on zonal characteristics, but all zones are scored and ranked together. This section selects eight distinct low-efficiency zones (A-H) identified from Case 1, representing high and low renewable energy penetration in commercial, industrial, residential, and rural areas. The utilization efficiency evaluation results for these areas under the other cases are shown in Table 2, with ranking scores provided in parentheses.
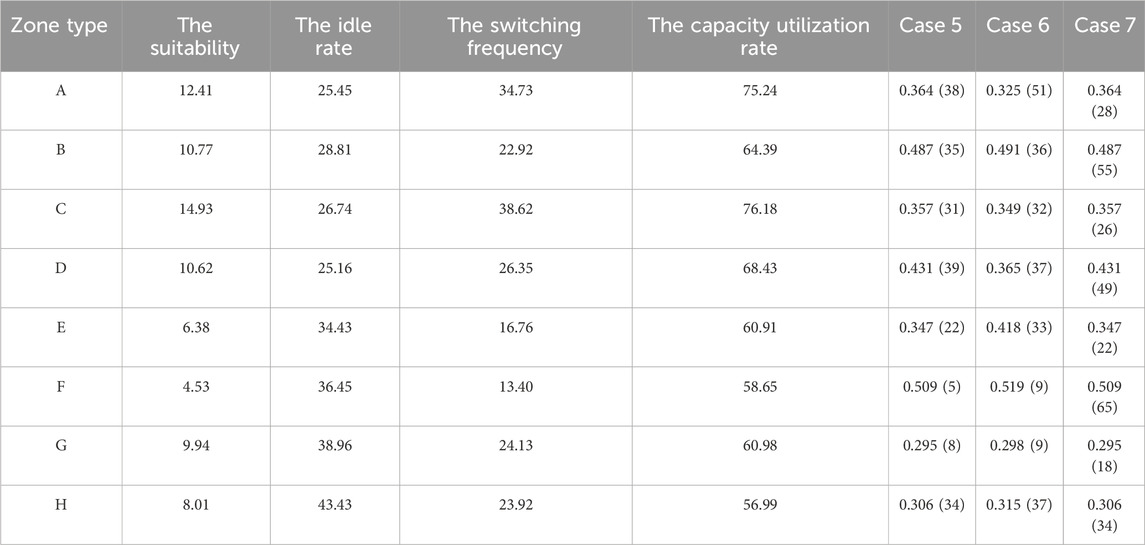
Table 2. Zonal applicability of reactive power utilization and scores under different cases.
It can be observed that high proportions of RESs lead to significant fluctuations in reactive power demand, characterized by lower idle rates and higher values in other indicators. In Case 5, the customized weights tailored to zonal characteristics provide a balanced evaluation, thereby accurately reflecting the utilization efficiency across different zones. However, in Case 7, despite employing zonal-specific weights, the unified scoring and ranking approach introduces discrepancies in the relative rankings of certain areas, leading to some areas still exhibiting higher utilization rates. Notably, zones B, D, and F are identified as having high-efficiency reactive power equipment utilization rates under this approach. Compared to Case 5, identical weights for all zones neglects the varying emphasis on indicators across different areas, resulting in high utilization rates for zone A in Case 6.
A comprehensive overview of multi-grade reactive power utilization evaluation for distribution networks with high renewables is presented in this paper, the key findings of this paper can be summarized as follows: 1) The proposed suitability assessment indicator is presented to evaluate the degree of matching between reactive power allocation and demand under various typical operating conditions, reflecting actual reactive power demand characteristics and resulting in slightly higher suitability; 2) The multi-grade reactive power utilization evaluation strategy is established to accurately categorizes inefficient utilization rates of reactive power equipment in different zones, thereby providing valuable insights for the refinement of allocation strategies for reactive power equipment; 3) The further research will focus on diversified flexibility resources integration into active distribution networks.
The data analyzed in this study is subject to the following licenses/restrictions: This study involves confidential information. Requests to access these datasets should be directed to Wanyan Zeng, 1452582007@qq.com.
MX: Writing–original draft, Investigation. WY: Writing–original draft, Conceptualization. WZ: Writing–original draft, Writing–review and editing, Methodology. TL: Writing–original draft. ZW: Writing–original draft. QD: Conceptualization, Data curation, Methodology, Writing–review and editing.
The author(s) declare that no financial support was received for the research, authorship, and/or publication of this article.
Authors MX, WY, TL, and ZW were employed by Development Division of State Grid Gansu Electric Power Company.
The remaining authors declare that the research was conducted in the absence of any commercial or financial relationships that could be construed as a potential conflict of interest.
The authors declare that no Generative AI was used in the creation of this manuscript.
All claims expressed in this article are solely those of the authors and do not necessarily represent those of their affiliated organizations, or those of the publisher, the editors and the reviewers. Any product that may be evaluated in this article, or claim that may be made by its manufacturer, is not guaranteed or endorsed by the publisher.
Arce, M. E., Saavedra, Á., Míguez, J. L., and Granada, E. (2015). The use of grey-based methods in multi-criteria decision analysis for the evaluation of sustainable energy systems: a review. Renew. Sustain. Energy Rev. 47, 924–932. doi:10.1016/j.rser.2015.03.010
Bejestani, A. K., Annaswamy, A., and Samad, T. (2014). A hierarchical transactive control architecture for renewables integration in smart grids: analytical modeling and stability. IEEE Trans. Smart Grid 5, 2054–2065. doi:10.1109/TSG.2014.2325575
Cao, Y., Zhou, B., Chung, C. Y., Zhou, K., Zhu, L., and Shuai, Z. (2024). Resilience-oriented coordinated topology reconfiguration of electricity and drainage networks with distributed mobile emergency resources. IEEE Trans. Smart Grid 16, 786–800. doi:10.1109/TSG.2024.3419086
do Prado, J. C., and Qiao, W. (2018). A stochastic decision-making model for an electricity retailer with intermittent renewable energy and short-term demand response. IEEE Trans. Smart Grid 10, 2581–2592. doi:10.1109/TSG.2018.2805326
Golshani, A., Sun, W., Zhou, Q., Zheng, Q. P., and Hou, Y. (2017). Incorporating wind energy in power system restoration planning. IEEE Trans. Smart Grid 10, 16–28. doi:10.1109/TSG.2017.2729592
Guo, Y., Pan, M., Fang, Y., and Khargonekar, P. P. (2013). Decentralized coordination of energy utilization for residential households in the smart grid. IEEE Trans. smart grid 4, 1341–1350. doi:10.1109/TSG.2013.2268581
He, Y., Chen, Y., Yang, Z., Liu, L., and He, H. (2018). A review on the influence of intelligent power consumption technologies on the utilization rate of distribution network equipment. Prot. Control Mod. Power Syst. 3, 18. doi:10.1186/s41601-018-0092-2
Hu, Z. L., Zhang, Y. J., Li, C. B., Li, J., Cao, Y., Luo, D., et al. (2015). Utilization efficiency of electrical equipment within life cycle assessment: indexes, analysis and a case. Energy 88, 885–896. doi:10.1016/j.energy.2015.07.041
Jhala, K., Natarajan, B., and Pahwa, A. (2019). The dominant influencer of voltage fluctuation (DIVF) for power distribution system. IEEE Trans. Power Syst. 34, 4847–4856. doi:10.1109/TPWRS.2019.2915566
Kaloudas, C. G., Ochoa, L. F., Marshall, B., Majithia, S., and Fletcher, I. (2017). Assessing the future trends of reactive power demand of distribution networks. IEEE Trans. Power Syst. 32, 4278–4288. doi:10.1109/TPWRS.2017.2665562
Keane, A., Ochoa, L. F., Vittal, E., Dent, C. J., and Harrison, G. P. (2010). Enhanced utilization of voltage control resources with distributed generation. IEEE Trans. Power Syst. 26, 252–260. doi:10.1109/TPWRS.2009.2037635
Keane, A., and O’Malley, M. (2007). Optimal utilization of distribution networks for energy harvesting. IEEE Trans. Power Syst. 22, 467–475. doi:10.1109/TPWRS.2006.888959
Krishnamurthy, D., Uckun, C., Zhou, Z., Thimmapuram, P. R., and Botterud, A. (2017). Energy storage arbitrage under day-ahead and real-time price uncertainty. IEEE Trans. Power Syst. 33, 84–93. doi:10.1109/TPWRS.2017.2685347
Kroposki, B. (2017). Integrating high levels of variable renewable energy into electric power systems. J. Mod. Power Syst. Clean Energy 5, 831–837. doi:10.1007/s40565-017-0339-3
Li, F., Pilgrim, J. D., Dabeedi, C., Chebbo, A., and Aggarwal, R. K. (2005). Genetic algorithms for optimal reactive power compensation on the national grid system. IEEE Trans. Power Syst. 1, 524–529. doi:10.1109/PESS.2002.1043292
Li, L., Hu, X., Chen, J., Wu, R., and Chen, F. (2024). Embedded scenario clustering for wind and photovoltaic power, and load based on multi-head self-attention. Prot. Control Mod. Power Syst. 9, 122–132. doi:10.23919/PCMP.2023.000296
Li, Y., Wang, C., and Li, G. (2020). A mini-review on high-penetration renewable integration into a smarter grid. Front. Energy Res. 8. doi:10.3389/fenrg.2020.00084
Lin, S., Li, F., Tian, E., Fu, Y., and Li, D. (2017). Clustering load profiles for demand response applications. IEEE Trans. Smart Grid 10, 1599–1607. doi:10.1109/TSG.2017.2773573
Liu, L., Li, H., Xue, Y., and Liu, W. (2014). Reactive power compensation and optimization strategy for grid-interactive cascaded photovoltaic systems. IEEE Trans. Power Electron. 30, 188–202. doi:10.1109/TPEL.2014.2333004
Magdy, G., Mohamed, E. A., Shabib, G., Elbaset, A. A., and Mitani, Y. (2018). Microgrid dynamic security considering high penetration of renewable energy. Prot. Control Mod. Power Syst. 3, 23. doi:10.1186/s41601-018-0093-1
Qin, W., Wang, P., Han, X., and Du, X. (2010). Reactive power aspects in reliability assessment of power systems. IEEE Trans. Power Syst. 26, 85–92. doi:10.1109/TPWRS.2010.2050788
Rani, P., Parkash, V., and Sharma, N. K. (2024). Technological aspects, utilization and impact on power system for distributed generation: a comprehensive survey. Renew. Sustain. Energy Rev. 192, 114257. doi:10.1016/j.rser.2023.114257
Salih, S. N., and Chen, P. (2015). On coordinated control of OLTC and reactive power compensation for voltage regulation in distribution systems with wind power. IEEE Trans. Power Syst. 31, 4026–4035. doi:10.1109/TPWRS.2015.2501433
Shi, R., Fan, X., and He, Y. (2017). Comprehensive evaluation index system for wind power utilization levels in wind farms in China. Renew. Sustain. Energy Rev. 69, 461–471. doi:10.1016/j.rser.2016.11.168
Utlu, Z., and Hepbasli, A. (2007a). A review on analyzing and evaluating the energy utilization efficiency of countries. Renew. Sustain. energy Rev. 11, 1–29. doi:10.1016/j.rser.2004.12.005
Utlu, Z., and Hepbasli, A. (2007b). A review and assessment of the energy utilization efficiency in the Turkish industrial sector using energy and exergy analysis method. Renew. Sustain. Energy Rev. 11, 1438–1459. doi:10.1016/j.rser.2005.11.006
Xu, X., Ya, Z., Shahidehpour, M., Wang, H., and Chen, S. (2017). Power system voltage stability evaluation considering renewable energy with correlated variabilities. IEEE Trans. Power Syst. 33, 3236–3245. doi:10.1109/TPWRS.2017.2784812
Ye, L., Hu, Z., Li, C., Zhang, Y., Yang, Z., Jiang, S., et al. (2018). The reasonable range of life cycle utilization rate of distribution network equipment. IEEE Access 6, 23948–23959. doi:10.1109/ACCESS.2018.2803840
Keywords: distribution networks, reactive power utilization, renewable energy, multi-grade evaluation, reactive power compensation equipment
Citation: Xu M, Yao W, Zeng W, Li T, Wang Z and Dou Q (2025) A multi-grade reactive power utilization evaluation method for distribution networks with high renewables. Front. Energy Res. 13:1540577. doi: 10.3389/fenrg.2025.1540577
Received: 06 December 2024; Accepted: 28 January 2025;
Published: 17 February 2025.
Edited by:
Quan Sui, Zhengzhou University, ChinaReviewed by:
Ziqing Zhu, Hong Kong Polytechnic University, Hong Kong SAR, ChinaCopyright © 2025 Xu, Yao, Zeng, Li, Wang and Dou. This is an open-access article distributed under the terms of the Creative Commons Attribution License (CC BY). The use, distribution or reproduction in other forums is permitted, provided the original author(s) and the copyright owner(s) are credited and that the original publication in this journal is cited, in accordance with accepted academic practice. No use, distribution or reproduction is permitted which does not comply with these terms.
*Correspondence: Wanyan Zeng, MTQ1MjU4MjAwN0BxcS5jb20=
Disclaimer: All claims expressed in this article are solely those of the authors and do not necessarily represent those of their affiliated organizations, or those of the publisher, the editors and the reviewers. Any product that may be evaluated in this article or claim that may be made by its manufacturer is not guaranteed or endorsed by the publisher.
Research integrity at Frontiers
Learn more about the work of our research integrity team to safeguard the quality of each article we publish.