 Zhikuan Zhu1
 Michael C. Tucker
94% of researchers rate our articles as excellent or good
Learn more about the work of our research integrity team to safeguard the quality of each article we publish.
Find out more
METHODS article
Front. Energy Res., 07 April 2025
Sec. Hydrogen Storage and Production
Volume 13 - 2025 | https://doi.org/10.3389/fenrg.2025.1530464
This article is part of the Research TopicAdvanced Water Splitting Technologies Development: Best Practices and Protocols Volume IIView all 7 articles
This study focuses on establishing a standardized dynamic operation protocol for testing Solid Oxide Electrolysis Cells (SOECs), highlighting their potential in dynamic energy applications due to their high efficiency, flexibility, and adaptability to dynamic conditions. Detailed documentation of sample preparation, selection of sealing materials, design of test equipment, testing parameters and cautions for dynamic cell testing is provided. This work aims to address gaps in the existing literature which lacks comprehensive guidance on, and discuss common pitfalls related to, dynamic testing.
SOECs have several advantages as an energy conversion technology. Operating SOECs at elevated temperatures enables much of the energy required for water splitting to be supplied as heat rather than electricity. This endothermic nature lowers the electrical input needed, potentially reducing operating cost when suitable heat sources (e.g., industrial waste heat) are available. Consequently, high-temperature electrolysis can offer improved overall efficiency and cost-effectiveness (Ni et al., 2008; Laguna-Bercero, 2012; Tucker, 2020). However, given the variability and intermittency of input power, and fluctuating electricity prices signals (Hauch et al., 2020), SOEC systems need to handle dynamic conditions, including rapid shifts in input power, gas composition, and temperature. This adaptability is crucial for their effective use in a future powered by dynamic energy sources.
The stability of solid oxide cells under dynamic conditions was studied by several groups. The degradation mechanisms of cells under varying humidity conditions were investigated (Kim et al., 2013; Lee et al., 2014). The effects and parameters that influence the redox cycling of the Ni-ceramic electrode were reviewed (Klemensø et al., 2006; Pihlatie et al., 2007; Sarantaridis and Atkinson, 2007; Iwanschitz et al., 2009). The performance of the cell under cycling between SOFC and SOEC modes was thoroughly examined (Chen et al., 2015; Wendel et al., 2015; Gómez and Hotza, 2016). Additionally, the degradation mechanisms due to various thermal cycling conditions were extensively studied (Ivers-Tiffée et al., 2001; Tucker, 2017; Shin et al., 2021). Reports on the impact of on-and-off cycles as well as power cycling on cell integrity were also presented (Hanasaki et al., 2014; Schefold et al., 2020).
Although there are published articles on dynamic operation as shown above, most do not provide detailed experimental protocols such as sealing materials selection, test rig and set-up design, cautions and common issues. This lack of comprehensive guidance makes it challenging to successfully conduct reproducible experiments.
To fill this gap, this protocol provides standardized procedures and suggested equipment for dynamic testing of SOECs. We detail the sample preparation procedures and discuss strategies for selecting appropriate sealing materials. The designs of the equipment and set-up are comprehensively outlined. Additionally, we describe the testing protocol for different cycling tests, including steam content switching, redox cycling, mode cycling, thermal cycling and power cycling. This protocol has been utilized with both conventional anode-supported cells (ASCs) and metal-supported cells (MS-SOCs) (Zhu et al., 2024), and is easily adapted to electrolyte-supported cells (ESCs) thereby enhancing its utility across different SOEC configurations.
This protocol focuses specifically on dynamic testing of SOEC button cells. We anticipate it can be extended to larger cells and stacks. Previous procedures and protocols for SOEC testing include important information on safety, training, data collection, hardware set-ups, and common issues. Also protocols for cell assembly, current collector attachment, mounting on test rig, and sealing are available. Specifically, the reader is referred to protocols in this journal covering steam supply, leak testing, button cell testing, and MS-SOEC operation (Chou et al., 2022; Shen et al., 2022; Zhang et al., 2022; Priest et al., 2023).
The Ni-YSZ-supported button cells used in the development of these protocols were prepared by Pacific Northwest National Laboratory (PNNL), and similar cells are available commercially from many global vendors. The ASC layers are: a coarse porous Ni current collection layer, a coarse porous Ni-YSZ thick support layer, a fine porous Ni-YSZ functional layer, a dense YSZ electrolyte, a GDC barrier layer, a LSCF-GDC electrode, and a LSCF current collection layer. Platinum and nickel meshes were affixed to the oxygen and hydrogen sides of the cell using platinum paste (Heraeus 6,926) and NiO paste (PNNL), respectively. These meshes acted as current collectors. Alumina paste (Ceramabond 552, Aremco) was used for sealing as shown in Figure 1A.
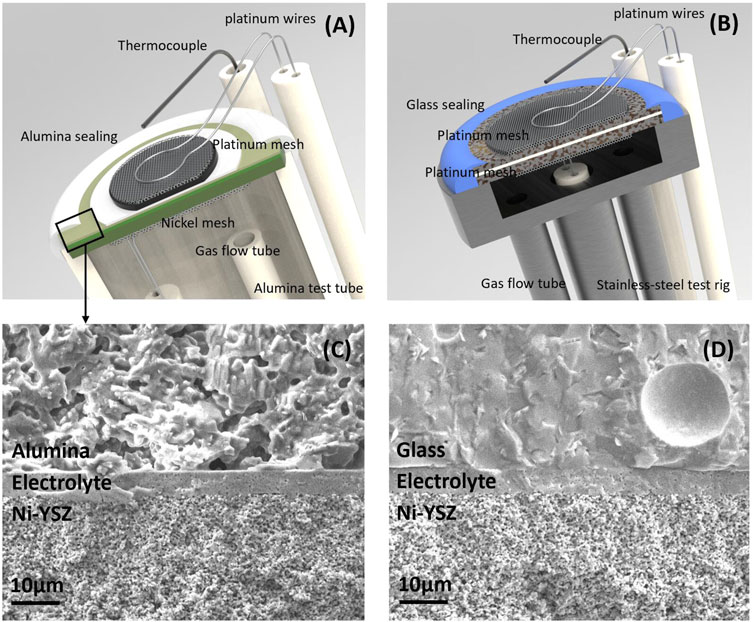
Figure 1. Cell, seal, and test rig. Schematic of (A) ASC test set-up, (B) MS-SOC test set-up. Microstructure comparison of (C) Alumina paste and (D) Glass paste cured on ASC electrolytes surface in marked area.
MS-SOCs were fabricated with a thin ceramic ScSZ electrolyte, ScSZ scaffold backbone layers, and symmetric stainless-steel supports on both sides. The oxygen side was infiltrated with LSCF and SDC, and the fuel/steam side was infiltrated with SDCN. Details of cell preparation can be found in our previous work (Tucker et al., 2007; Shen et al., 2022). Prior to installation, platinum mesh current collectors were attached to both electrodes via spot welding, and 4 platinum wires were utilized for electrical connections. The cells were then mounted on a 410 stainless-steel test rig, using glass paste (GM31107, Schott) Figure 1B.
Sealing materials are essential in SOEC tests, as they isolate hydrogen from oxygen to avoid combustion, and maintain high purity of the exhaust streams. An ideal sealing material should possess a thermal expansion coefficient compatible with the materials of the cells and test rigs. It must exhibit high chemical stability in both oxidizing and reducing environments and avoid reactions with other components. Additionally, seals must provide electrical insulation at operating temperatures to prevent short circuits and maintain physical durability to ensure longevity, particularly in thermal cycles, gas leakages, or other demanding conditions.
Glass-ceramic sealants are widely utilized in SOEC applications, each type tailored to specific applications and working temperatures based on their compositions. In our studies, Schott GM31107 was chosen for testing MS-SOEC at temperatures up to 750°C and demonstrated effective performance with 410 stainless-steel test rigs. In this situation, the thermal expansion coefficients of the cell, seal, and test rig are well matched, minimizing stress during thermal excursions. The OCV remained stable during thermal, redox cycling and steam cycling. The sealant preparation involved mixing glass powder with an ink vehicle (Fuel Cell Materials) at a 4:1 weight ratio. After milling, the mixture was applied using a syringe along the edges of the cell on the test rig before immediately sintering in a tube furnace. The glass was sintered at 725°C for 2 h, then the temperature was reduced to 700°C for operation, with a typical ramp-up rate of 10 min-1. It is crucial not to leave the cell at room temperature for a long time, as the glass paste can diffuse into the porous electrodes and degrade performance.
For anode-supported cells, sealing glasses perform well under constant temperatures. Schott GM018354 was mixed in a ratio of 6 parts glass powder to 1 part 3.3% cellulose in terpineol and 0.1 parts ethanol. This mixture was sintered at 850°C for 2 h and then cooled to 750°C for operation (Priest et al., 2023). However, discrepancies in the thermal expansion coefficients between the glass and the alumina test rig led to cell cracking during cooling to room temperature. To address this issue, alumina paste (Ceramabond 552, Aremco) was employed to enable thermal cycling experiments. After 2 h of rolling the bottle on a jar mill to ensure mixing, the paste was applied along the edges of the cell using a syringe, dried for 1 h, and additional layers were added, repeating the process 3 or 4 times. The alumina paste was dried at 90 °C for 2 h and sintered at 260 °C for another 2 h before ramping up to the operational temperature. The resulting OCV was about 10 mV lower than that achieved with glass bonding, due to the porous microstructure of the alumina seal, compared in Figures 1C, D. Alumina paste offers advantages such as fast room temperature drying and effective bonding, facilitating easy application and wire connection set-ups. After cooling, the cell remained intact, maintaining stable OCV during thermal cycling. Unlike glass paste which is alkali-free, alumina pastes might influence cell performance negatively over extended periods, due to volatilization of alkali elements and subsequent electrode poisoning, especially in the presence of Cr-containing thermocouple sheaths, heating elements, or other hardware (Cruse et al., 2007). Based on our tests, alumina effectively functions up to 1,000 h. For longer-term testing, the porous structure may be compromised by high humidity, leading to a drop in OCV.
The set-up developed for gas delivery enables rapid switching between two gas feeds, shown in Figure 2. From left to right, the arrangement includes H2 (top) and N2 (bottom) tanks, three flow meters, one-way check valves, pressure release valves, water bubblers in oil baths to set humidity level, switching valve, an alumina test tube, and a tube furnace. The check valves prevent damage to the flow meters from backflow of water from the bubbler. The pressure release valves safeguard both the cell and water bubbler from high pressure. The cycling set-up is controlled by a programmable valve (VICI Valco Instruments EUD-44UWE with HVEB heated valve enclosure) that manages four gas flows: high humidity H2 input, low humidity H2 input, gas output to the cell, and gas vent. This valve allows rapid gas switching with millisecond switch duration and negligible flow disruption, with frequency and duration controlled via a programmable controller (e.g., Theben TR-622-top-2 24V). At all times, one gas stream is directed to the cell set-up and the other is directed to the vent. Switching between the gas streams is nearly instantaneous. Separate water bubblers for each H2 humidification level are required for this approach to switch between two streams, each at steady state. This eliminates any transients and gets as close to a ‘square wave’ as possible.
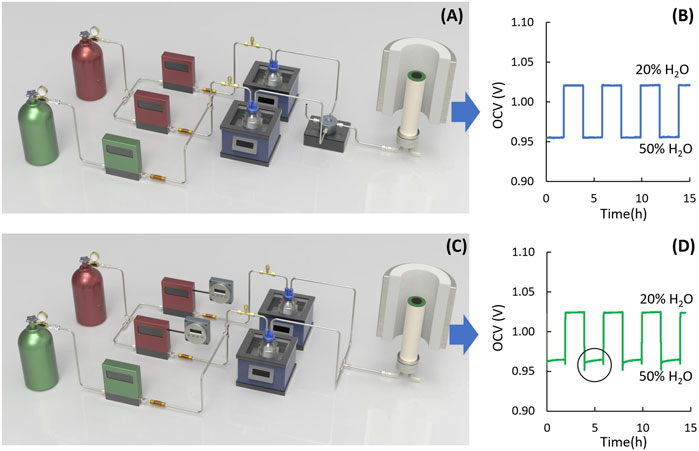
Figure 2. Comparison of gas switching systems. (A, C) Schematic of gas switching system and (B, D) OCV for steam content changing between 20% and 50% for (A, B) programmable switch valve, and (C, D) digital timer.
This set-up is versatile, suitable for steam cycling tests, redox cycling tests, and mode cycling tests. In steam cycling tests, the water bubbler temperatures are adjusted to generate different humidity levels. This bubbler set-up can maintain a stable OCV and current density up to 75% H2O and 25% H2 (stability is challenging to achieve for higher steam content). For redox cycling tests, one water bubbler is set for humidified N2, then the cell is alternately fed humidified H2 and N2. Given that oxidation via steam typically takes longer than reduction, and only partial oxidation of the cell may be desired, the set-up also allows for varying hold times for the oxidizing and reducing gases. For mode cycling, the bubblers are set for different steam contents in fuel cell mode and electrolysis mode. The gas switching can then be synchronized with voltage switching.
The advantages of this set-up include rapid gas switching capabilities. Not only can the hold time and gas humidification levels be preset, but also the start and stop times, eliminating the need for manual adjustment during testing. The switch valve is robust, tested for over 10,000 h without failure. However, the valve is costly and the requirement for continuous operation of two gas lines leads to higher operating cost and H2 waste. Also, the valve is fitted with a unique heater to prevent condensation, requiring an additional temperature controller.
An alternative design with lower equipment and gas consumption costs, uses inexpensive digital timers to manage gas flow, Figure 2C. It can be set before testing and only one humidified H2 line is active at a time, reducing gas consumption compared to the valve system. The digital timer (e.g., Intermatic DT620) is significantly less expensive and easier to operate. The timer cost is tens of USD, compared a few thousand USD for the valve plus heating elements. However, the output tubes from the bubblers are connected, which can lead to gas migration between the bubblers and tubing, causing slow shift in humidification level and OCV at the cell, Figure 2D. Inexpensive timers may also time-drift over long tests, requiring periodic resetting. To prevent gas interruption, it is recommended to include a short (∼1 min) overlap during gas line switching, during which both gas lines flow to the cell simultaneously. This leads to a temporary increase of gas flow rate and causes current variations, as illustrated in Figure 2D within the circle, but prevents gas starvation. Note that the timers turn the mass flow controllers on/off, so this setup only works with controllers that automatically start flowing upon power-on (such as Omega FMA Series). Also, transients due to the MFC start-up should be expected, such as PID control overshoot.
Note that for safety in either set-up, switching between H2 and air or O2 would require an additional inert-gas purge between the oxidizing and reducing gases to prevent any risk of hydrogen combustion within the test set-up. In order to maintain high humidity during gas flow, the stainless-steel tube was wrapped with heating tape, alumina fiber, and aluminum foil. The heating tape was set to 110°C. If the water bottle caps are made of plastic, they should be checked regularly for potential leaks caused by cracking, which can occur when operating in a high-temperature environment for an extended period of time.
This setup is also convenient for reducing the NiO to Ni before cell operation. For ASC reduction, a mixture of 90% N2 and 10% H2 is used. After 4 h, once the OCV stabilizes, the H2 concentration is gradually increased to 25%, 50%, and finally pure H2, with 30 min holds at each concentration. The OCV stabilizes at 1.1 V within a temperature range of 700 °C–750 °C. For MS-SOCs with infiltrated catalysts, the line should be purged with pure N2 for 15 min, and after stabilizing the OCV, the feed can be switched directly to pure H2, as infiltrated catalysts reduce quickly without impacting the electrode scaffold.
In real-world operation, interruption of the steam supply or fluctuations in steam content may occur. Steam cycling switching between high- and low-humidity conditions in the fuel side simulates steam fluctuation. Different temperatures were set on two oil baths to create different humidity levels at the fuel electrode, and OCV was monitored during steam content switching, Figure 3A. The set-up needs only 15 s to stabilize the humidity in the fuel side, Figure 3B. Most stainless-steel tubes used in the system are 1/4-inch diameter, except the tube between the valve and the test rig, which is 1/8-inch diameter and should be as short as possible. This reduces the volume of gas between the outlet of the valve and the cell, thereby reducing the purge time and increasing the response speed.
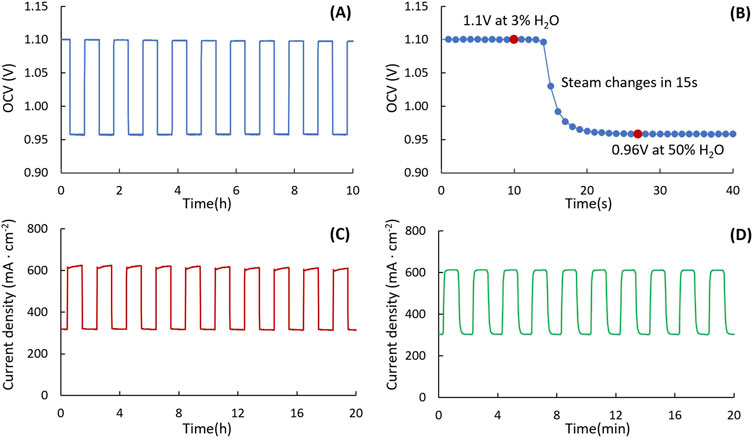
Figure 3. Steam content switching. (A) Long-term and (B) zoomed-in OCV change for switch valve system during steam content switching between 3% and 50%. Current density variation during steam content switching between 20% and 50% with (C) 1 h hold time and (D) 1 min hold time (750°C and 1.3 V).
The humidity hold time can be set from ∼1 min to hours. Figures 3C, D show examples of current density following gas switching between 20% and 50% humidification, for hold times of 1 h and 1 min. This set-up can also set high humidity and low humidity with different hold times to simulate a range of scenarios. For example, 1 h for high humidity and 1 min for low humidity could be set to simulate short interruptions of the steam supply.
During steam content switching, potentiostatic operation is preferred over galvanostatic operation. Constant current may cause high overpotential under low humidity, which may damage the cell. During steam cycling testing, the upper limit of the applied voltage was set in the range 1.3 V–1.5 V. The humidity range was set from 3% up to 75%, with a corresponding oil bath temperature from room temperature to 92°C. Temperature higher than 92°C causes noisy data due to incomplete humidification in the bubbler and condensation at cold spots. To avoid pressure fluctuations, the flow controllers for pure H2 should also be set at different flow rates so that the final output flow rates of humidified gas are the same.
In the absence of H2, steam reacts with Ni to form NiO. This may occur during a loss of hydrogen recirculation or a steam surge, e.g., if a plug of condensed water is flashed to steam. To simulate this situation, redox cycling can be performed by alternating between 50% humidified H2 and 50% humidified N2 on the steam side.
In contrast to conventional redox cycling which uses air to oxidize the Ni electrode, oxidation by steam leads to slower oxidation, as indicated by the slow OCV drop during the redox cycle for an MS-SOEC (Figure 4A). After 3.5 h of oxidation, the OCV stabilized at 0.15 V, confirming complete oxidation of Ni to NiO. Subsequently, the gas was switched back to humidified H2, and the OCV quickly recovers.
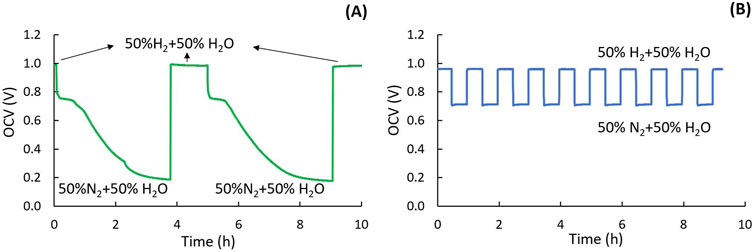
Figure 4. Redox cycling. (A) OCV during oxidation (H2O/N2) and reduction (H2/H2O) holds for MS-SOEC and (B) OCV indicates cell and seal integrity during partial-oxidation redox cycling for ASC.
Partial redox cycling can also be implemented to prevent electrolyte cracking due to volume expansion when Ni oxidizes to NiO. It is critical to revert the gas from humidified N2 to H2 before Ni is fully oxidized to prevent permanent damage. The optimal duration of humidified N2 exposure and redox cycle hold times should be established for each cell type to maintain stable OCV values. Figure 4B shows the OCV change during partial redox cycling between 50% humidified H2 and 50% humidified N2 with 30 min hold time (in contrast to the several hours required for complete oxidation).
Mode cycling involves switching the cell between SOFC and SOEC modes, which can provide energy storage or load-leveling services by adapting to fluctuations in energy demand and supply. For experimental convenience, most mode cycling and reversible operation tests are conducted under a fixed condition of 50% humidified H2, which is favorable for SOEC operation. However, operating under 3% humidified H2 in SOFC mode can generate a higher current density, as illustrated in Figure 5A. To match the electrical mode cycling to relevant gas compositions, it is beneficial to integrate steam cycling, setting 3% humidified H2 during SOFC mode and switching to 50% humidification during SOEC mode, using a gas switching system. As depicted in Figure 5B, 1.5 V is set for SOEC and 0.7 V for SOFC, with a 30 min hold time. Also, the hold times for SOFC and SOEC do not necessarily need to be the same and can be adjusted to reflect expected demand.
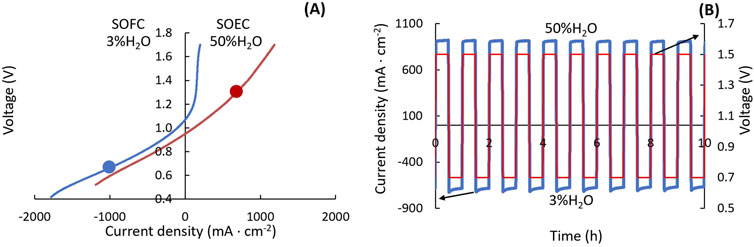
Figure 5. Mode switching. (A) IV polarization curves for ASC at 750°C under 3% H2O-humidified H2 (blue) and 50% H2O-humidified H2 (red). (B) Current density variation (blue) under mode cycling between SOFC at 0.7 V and SOEC at 1.5 V (red), with voltage and steam content switched simultaneously.
Several considerations are crucial during mode cycling tests. Voltage loading should gradually change with humidity to prevent mass transfer limitations at the beginning of SOEC mode. Both low and high humidity gas tubes should be heated downstream of the bubblers to prevent water condensation on the low humidity side, which could cause noise during data collection. Unlike other tests where cells usually undergo a break-in period at SOEC for 100–200 h before beginning the cycling test, cells for mode cycling should be thoroughly broken in under both SOEC and SOFC modes alternately for 200–400 h. This approach is essential because SOEC and SOFC operations trigger different formation and degradation mechanisms, and breaking in the cell under only one mode would stabilize performance solely in that condition.
Temperature variations are pronounced during SOEC operation, particularly at startup, shutdown, and in emergency stops. Also, temperature fluctuation happens due to changes in electrical input and output demands, including reversible operation. Thermal cycling is essential to identify potential failure modes such as delamination of layers, crack formation, or other physical changes that could lead to cell failure. Rapid temperature changes can induce thermal stress due to differing thermal expansion coefficients within the cell materials, seal, and test rig. MS-SOCs with symmetrical structure and robust mechanical properties of the porous metal support, exhibit high thermal cycling tolerance. In contrast, ASCs are less tolerant due to the brittle nature of ceramics and their asymmetrical design. When using a glass seal on an alumina rig, the cells frequently crack during cooling. To enable thermal cycling without failure of the cells, ceramic sealing paste (Aremco 552) is utilized, as discussed above in Section 3.1. Below are two types of tests for thermal cycling.
Start-up and shutdown operations in SOEC systems can impose significant mechanical stresses on the cell. Rapid heating and cooling leads to thermal gradients, causing stress due to differing thermal expansion rates of cell components. This test aims to simulate temperature variations during start-up and cooldown. The high temperature limit is set at the operating temperature (typically in the range 600°C–900°C), while the low limit is set at 150 °C to prevent water condensation inside the test rig, which could damage the cell. The furnace is set to cycle mode. The ramp-up rate for MS cells can exceed 30 °C s-1 so the furnace can be heated at full power, with natural cooldown, Figure 6A. For ASCs, the ramp rates are kept below 5 °C min-1. OCV is monitored throughout the thermal cycling, with a minimum of 50 cycles to assess cell tolerance.
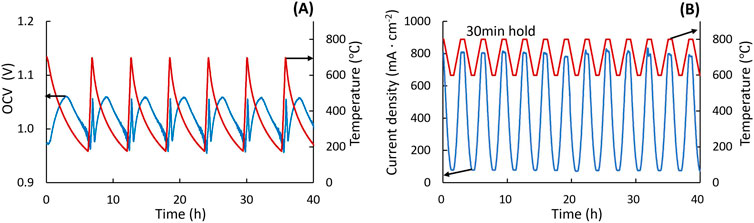
Figure 6. Thermal cycling. (A) MS-SOEC: OCV (blue) and temperature ramps (red) during cycling between 150°C and 700°C. (B) ASC: current density (blue) at 1.3 V during temperature ramps (red) between 600°C and 800°C.
This test simulates temperature fluctuation under working conditions. The temperature is ramped up and down following the ramp rates discussed above, while holding voltage constant (e.g., at 1.3 V). A 30 min hold time is set at the upper and lower temperature limits to stabilize cell performance. Potentiostatic operation avoids extreme overpotentials that would occur at the lower end of the temperature range during galvanostatic operation. The high temperature limit should be determined separately, based on degradation rate during isothermal operation at various upper limit temperatures. For example, multiple ASCs were operated at 1.3V and 50/50 H2/H2O at 750°C, 800°C, or 850°C. Accelerated degradation was observed at 850 °C, so the upper limit for thermal cycling was set to 800°C. The lower temperature limit was set at 600 °C to avoid high impedance at lower temperatures and maintain adequate current flow. For an ASC, the current density fluctuated from 75 mA cm-2–750 mA cm-2 during thermal cycling, Figure 6B.
Monitoring OCV is critical during thermal cycling tests, as a decrease in OCV indicates potential cell cracking or seal failure. A thermocouple should be placed as close to the cell as possible, and temperature changes should be recorded throughout the testing process. If the natural furnace cooling rate is lower than the desired cooling rate, a ventilation hole can be introduced in the top of the furnace. If an OCV drop is observed, the test should be stopped to prevent H2 combustion in the furnace. Parameters such as ramp-up rate, cycling range, temperature hold time, and total cycle numbers are adjustable based on different cell types and set-ups.
Power cycling tests, which involve voltage or current cycling, are essential for assessing the performance and durability of SOECs under dynamic conditions. These rapid fluctuations in electrical input, driven by variable renewable energy sources, can significantly impact cell durability. Furthermore, exposure to high voltage can induce microstructural degradation, potentially compromising cell longevity. Thus, evaluating cell performance across a range of input power variations is crucial.
Prior to initiating power cycling tests, it is essential to establish a high voltage threshold to ensure that any observed degradation is attributable to variable loading rather than excessive voltage levels. For instance, potentiostatic operation with 50/50 H2/H2O at 1.3 V, 1.5 V, 1.7 V, and 1.9 V at 750°C on ASCs determined that 1.5 V is the upper limit beyond which accelerated degradation is observed. Of course, higher voltage limits may be utilized during power cycling, but then the degradation may be influenced by both the cycling and the exposure to high overpotential.
An on-and-off switching test was conducted by alternating the voltage between 1.5 V and OCV with a 30 min hold time. During this cycling, variations in current density were monitored, as shown in Figure 7A. A rapid power fluctuation test was performed by alternating the voltage between 1.3 V and 1.5 V with a 1-min hold time, Figure 7B. The current density was observed to respond immediately to voltage changes, fluctuating between approximately 650 mA cm-2 and 950 mA cm-2.
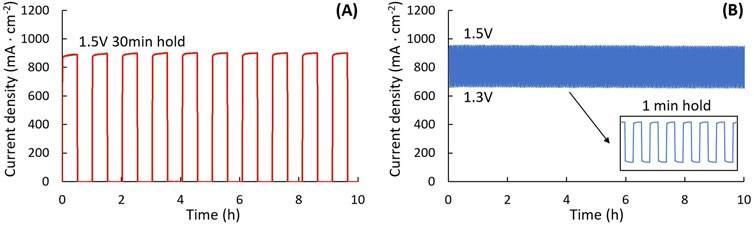
Figure 7. Power cycling. Current density during (A) on-and-off test with 30 min hold time, and (B) voltage cycling between 1.3 V and 1.5 V with 1 min hold time. ASC, 750°C, 50:50 H2:H2O.
Power cycling tests are relatively straightforward compared to other assessments. Power cycling can generally be performed easily with any programmable potentiostat. All parameters, including voltage or current range, hold time, and total test cycles, can be set using electrochemical testing software. These parameters may vary depending on the cell type and the specific objectives of the test. The voltage limits should be chosen based on the steam content (and resulting OCV), and experimental goals. Current density will fluctuate for both voltage-controlled and current-controlled cycling, and the steam consumption rate and utilization should be estimated over the range of current densities encountered to avoid complications from steam starvation. It is essential to set safe voltage and current limits prior to testing to prevent damage in the event of unexpected short circuit, which could generate excessive heat and damage the cell. Additionally, monitoring temperature fluctuations during power cycling is also advisable. This can be achieved by attaching a thin thermocouple to the surface of the electrolyte on the air side near the electrode. Alumina paste can be used to securely attach the thermocouple to the cell outside the active area, ensuring accurate temperature readings throughout the test.
The power cycling tests described previously cycle with frequencies on the order of 10−2 to 10−4 Hz. In contrast, pulse width modulation control of SOECs involves cycling at much faster timescales, on the order of 1 Hz or higher. The duty cycle, which is the percentage of the time that the device is switched on, can be utilized to adjust the total power of the cell. This control method allows for part-load operation at a fixed operating point, and can be harnessed in many useful manners. For example, the PWM approach enables cell operation at the thermal neutral voltage which maintains both thermal balance and high efficiency while decreasing the average current consumed. Thus, sub-second PWM controls allows for adjustment of the average operating power and hydrogen production, while the instantaneous power will cycle between fully on and off. In addition, the duty cycle can be easily adjusted, allowing the cell to quickly adjust the average power consumed, which is extremely useful for load following applications. For example, the cell can be rapidly switched on and off at 1 Hz with a duty cycle of 90%. To decrease average power, the cell can be turned down to a 50% duty cycle, or even 10% to match supply. This can be evaluated both from a power consumption perspective and a hydrogen production volume perspective, either of which can be valuable control methods depending on the operating goals.
As with power cycling tests, PWM tests can be performed with a programable potentiostat, however, the capability to switch voltage/current accurately at higher frequencies may vary between models and manufacturers. If capable, a potentiostat, such as the Solartron CellTest 1470e, can produce a square wave between the desired voltages. Alternatively, the cell can be controlled by making and breaking the electrical connection to a power supply with a solid-state relay. A signal generator can provide the control voltage to the relay to accurately control the frequency and duty cycle. At higher frequencies, higher acquisition rates on the order of 1 kSa/s (kilo Samples per second) are required to accurately capture the waveforms, however post processing of the data can greatly reduce the data storage requirements. Python scripts can down sample the curves or reduce each cycle to a maximum and minimum current density for long duration tests.
Before starting the cycling tests, it is essential to conduct baseline tests to understand the initial performance characteristics of the cells. The temperature of furnaces and oil baths, and gas flow rate should be calibrated before testing. OCV should be recorded during the whole cycling testing when voltage or current are not controlled. I-V and EIS measurements should be acquired between each test phase to quantify cell degradation. All the data including current, power, hydrogen production and consumption rate, impedance should be normalized by active area of the cell. All the electrochemical measurements in this work were conducted using a VMP3 multi-channel potentiostat with current booster (Biologic). Data was recorded and processed by EC-Lab software. Microstructural evaluation (e.g., SEM, TEM, EDS, XRD) is valuable for correlating observed performance changes with electrode or electrolyte degradation. For example, comparing the microstructure of a post-tested cell with a baseline cell would allow isolation and identification of morphological changes—such as electrode coarsening, delamination, or interface fracturing.
The original contributions presented in the study are included in the article/supplementary material, further inquiries can be directed to the corresponding author.
ZZ: Writing–original draft, Writing–review and editing. WG: Writing–review and editing. NK: Writing–review and editing. MT: Writing–original draft, Writing–review and editing.
The author(s) declare that financial support was received for the research and/or publication of this article. The authors gratefully acknowledge research support from the HydroGEN Advanced Water Splitting Materials Consortium, established as part of the Energy Materials Network under the U.S. Department of Energy, Office of Energy Efficiency and Renewable Energy, Hydrogen and Fuel Cell Technologies Office, under Contract Number DE-AC02-05CH11231. This material is based upon work supported by the U.S. Department of Energy’s Office of Energy Efficiency and Renewable Energy (EERE) under the H2NEW Consortium, award number DE-AC02-05CH11231. This work was funded in part by the U.S. Department of Energy under contract no. DE-AC02-05CH11231.
The authors acknowledge Boxun Hu, Fengyu Shen and Grace Lau for experimental assistance, Ruofan Wang and Martha Welander for establishing the initial test set-ups, and Jeremy Hartvigsen and Micah Casteel for helpful discussion. The authors acknowledge the other national labs in the H2NEW consortium, including NREL and PNNL for their assistance and support throughout this work. PNNL provided the ASCs used in this work. This document was prepared as an account of work sponsored by the United States Government. While this document is believed to contain correct information, neither the United States Government nor any agency thereof, nor the Regents of the University of California, nor any of their employees, makes any warranty, express or implied, or assumes any legal responsibility for the accuracy, completeness, or usefulness of any information, apparatus, product, or process disclosed, or represents that its use would not infringe privately owned rights. Reference herein to any specific commercial product, process, or service by its trade name, trademark, manufacturer, or otherwise, does not necessarily constitute or imply its endorsement, recommendation, or favoring by the United States Government or any agency thereof, or the Regents of the University of California.
The authors declare that the research was conducted in the absence of any commercial or financial relationships that could be construed as a potential conflict of interest.
The author(s) declare that no Generative AI was used in the creation of this manuscript.
All claims expressed in this article are solely those of the authors and do not necessarily represent those of their affiliated organizations, or those of the publisher, the editors and the reviewers. Any product that may be evaluated in this article, or claim that may be made by its manufacturer, is not guaranteed or endorsed by the publisher.
The views and opinions of authors expressed herein do not necessarily state or reflect those of the United States Government or any agency thereof or the Regents of the University of California. This manuscript has been authored by an author at Lawrence Berkeley National Laboratory under Contract No. DE-AC02-05CH11231 with the U.S. Department of Energy. This manuscript was authored in part by the Idaho National Laboratory, operated by Battelle Energy Alliance, LLC under Contract No. DE-AC07-05ID14517 with the U.S. Department of Energy. The U.S. Government retains, and the publisher, by accepting the article for publication, acknowledges, that the U.S. Government retains a non-exclusive, paid-up, irrevocable, world-wide license to publish or reproduce the published form of this manuscript, or allow others to do so, for U.S. Government purposes.
Chen, K., Liu, S.-S., Ai, N., Koyama, M., and Jiang, S. P. (2015). Why solid oxide cells can be reversibly operated in solid oxide electrolysis cell and fuel cell modes? Phys. Chem. Chem. Phys. 17 (46), 31308–31315. doi:10.1039/c5cp05065k
Chou, Y.-S., Hardy, J., and Marina, O. A. (2022). Leak test for solid oxide fuel cells and solid oxide electrolysis cells. Front. Energy Res. 10, 945788. doi:10.3389/fenrg.2022.945788
Cruse, T. A., Ingram, B. J., Liu, D.-J., and Krumpelt, M. (2007). Chromium reactions and transport in solid oxide fuel cells. ECS Trans. 5 (1), 335–346. doi:10.1149/1.2729015
Gómez, S. Y., and Hotza, D. (2016). Current developments in reversible solid oxide fuel cells. Renew. Sustain. Energy Rev. 61, 155–174. doi:10.1016/j.rser.2016.03.005
Hanasaki, M., Uryu, C., Daio, T., Kawabata, T., Tachikawa, Y., Lyth, S. M., et al. (2014). SOFC durability against standby and shutdown cycling. J. Electrochem. Soc. 161 (9), F850–F860. doi:10.1149/2.0421409jes
Hauch, A., Küngas, R., Blennow, P., Hansen, A. B., Hansen, J. B., Mathiesen, B. V., et al. (2020). Recent advances in solid oxide cell technology for electrolysis. Science 370 (6513), eaba6118. doi:10.1126/science.aba6118
Ivers-Tiffée, E., Weber, A., and Herbstritt, D. (2001). Materials and technologies for SOFC-components. J. Eur. Ceram. Soc. 21 (10-11), 1805–1811. doi:10.1016/s0955-2219(01)00120-0
Iwanschitz, B., Sfeir, J., Mai, A., and Schütze, M. (2009). Degradation of SOFC anodes upon redox cycling: a comparison between Ni/YSZ and Ni/CGO. J. Electrochem. Soc. 157 (2), B269. doi:10.1149/1.3271101
Kim, S.-D., Seo, D.-W., Dorai, A. K., and Woo, S.-K. (2013). The effect of gas compositions on the performance and durability of solid oxide electrolysis cells. Int. J. hydrogen energy 38 (16), 6569–6576. doi:10.1016/j.ijhydene.2013.03.115
Klemensø, T., Appel, C., and Mogensen, M. (2006). In situ observations of microstructural changes in SOFC anodes during redox cycling. Electrochem. solid-state Lett. 9 (9), A403. doi:10.1149/1.2214303
Laguna-Bercero, M. A. (2012). Recent advances in high temperature electrolysis using solid oxide fuel cells: a review. J. Power sources 203, 4–16. doi:10.1016/j.jpowsour.2011.12.019
Lee, Y.-H., Muroyama, H., Matsui, T., and Eguchi, K. (2014). Degradation of nickel–yttria-stabilized zirconia anode in solid oxide fuel cells under changing temperature and humidity conditions. J. Power Sources 262, 451–456. doi:10.1016/j.jpowsour.2014.03.031
Ni, M., Leung, M. K., and Leung, D. Y. (2008). Technological development of hydrogen production by solid oxide electrolyzer cell (SOEC). Int. J. hydrogen energy 33 (9), 2337–2354. doi:10.1016/j.ijhydene.2008.02.048
Pihlatie, M., Kaiser, A., Larsen, P. H., and Mogensen, M. (2007). Dimensional behaviour of Ni-YSZ anode supports for SOFC under RedOx cycling conditions. ECS Trans. 7 (1), 1501–1510. doi:10.1149/1.2729255
Priest, C. M., Gomez, J. Y., Kane, N. J., Hartvigsen, J. L., Wang, L., Ding, D., et al. (2023). Challenges in practical button cell testing for hydrogen production from high temperature electrolysis of water. Front. Energy Res. 11, 1278203. doi:10.3389/fenrg.2023.1278203
Sarantaridis, D., and Atkinson, A. (2007). Redox cycling of Ni-based solid oxide fuel cell anodes: a review. Fuel cells 7 (3), 246–258. doi:10.1002/fuce.200600028
Schefold, J., Brisse, A., Surrey, A., and Walter, C. (2020). 80,000 current on/off cycles in a one year long steam electrolysis test with a solid oxide cell. Int. J. Hydrogen Energy 45 (8), 5143–5154. doi:10.1016/j.ijhydene.2019.05.124
Shen, F., Welander, M. M., and Tucker, M. C. (2022). Metal-supported solid oxide electrolysis cell test standard operating procedure. Front. Energy Res. 10, 817981. doi:10.3389/fenrg.2022.817981
Shin, J.-S., Saqib, M., Jo, M., Park, K., Park, K. M., Ahn, J. S., et al. (2021). Degradation mechanisms of solid oxide fuel cells under various thermal cycling conditions. ACS Appl. Mater. and interfaces 13 (42), 49868–49878. doi:10.1021/acsami.1c13779
Tucker, M. C. (2017). Durability of symmetric-structured metal-supported solid oxide fuel cells. J. Power Sources 369, 6–12. doi:10.1016/j.jpowsour.2017.09.075
Tucker, M. C. (2020). Progress in metal-supported solid oxide electrolysis cells: a review. Int. J. hydrogen energy 45 (46), 24203–24218. doi:10.1016/j.ijhydene.2020.06.300
Tucker, M. C., Lau, G. Y., Jacobson, C. P., DeJonghe, L. C., and Visco, S. J. (2007). Performance of metal-supported SOFCs with infiltrated electrodes. J. Power Sources 171 (2), 477–482. doi:10.1016/j.jpowsour.2007.06.076
Wendel, C., Kazempoor, P., and Braun, R. (2015). Novel electrical energy storage system based on reversible solid oxide cells: system design and operating conditions. J. Power Sources 276, 133–144. doi:10.1016/j.jpowsour.2014.10.205
Zhang, Y., Xu, N., Tang, Q., Gibbons, W., and Huang, K. (2022). Evaluation of steam supply performance: steamer vs. bubbler. Front. Energy Res. 10, 963777. doi:10.3389/fenrg.2022.963777
Keywords: SOEC, standard operating procedure, sealing material, dynamic testing, cycling
Citation: Zhu Z, Gibbons WT, Kane NJ and Tucker MC (2025) Dynamic testing of solid oxide electrolysis cells standard operating procedure. Front. Energy Res. 13:1530464. doi: 10.3389/fenrg.2025.1530464
Received: 20 November 2024; Accepted: 21 March 2025;
Published: 07 April 2025.
Edited by:
Chengxiang Xiang, California Institute of Technology, United StatesReviewed by:
Atul Jamale, University of Aveiro, PortugalCopyright © 2025 Zhu, Gibbons, Kane and Tucker. This is an open-access article distributed under the terms of the Creative Commons Attribution License (CC BY). The use, distribution or reproduction in other forums is permitted, provided the original author(s) and the copyright owner(s) are credited and that the original publication in this journal is cited, in accordance with accepted academic practice. No use, distribution or reproduction is permitted which does not comply with these terms.
*Correspondence: Michael C. Tucker, bWN0dWNrZXJAbGJsLmdvdg==
Disclaimer: All claims expressed in this article are solely those of the authors and do not necessarily represent those of their affiliated organizations, or those of the publisher, the editors and the reviewers. Any product that may be evaluated in this article or claim that may be made by its manufacturer is not guaranteed or endorsed by the publisher.
Research integrity at Frontiers
Learn more about the work of our research integrity team to safeguard the quality of each article we publish.