 Jianhong Xu
 Hao Wang
95% of researchers rate our articles as excellent or good
Learn more about the work of our research integrity team to safeguard the quality of each article we publish.
Find out more
ORIGINAL RESEARCH article
Front. Energy Res. , 14 February 2025
Sec. Energy Storage
Volume 13 - 2025 | https://doi.org/10.3389/fenrg.2025.1528691
Introduction: To investigate the degradation behavior of energy storage batteries during grid services, we conducted a cyclic aging test on LiFePO4 battery modules.
Methods: Incorporating variables such as grid duty, temperature and depth of discharge, we analyzed the capacity degradation and operational patterns in different grid- storage interaction modes by examining aspects of capacity retention, discharge quantity, incremental capacity, and differential voltage.
Results: Our findings indicate that battery degradation is higher during peak shaving compared to frequency regulation. Heat and deep charging and discharging modes accelerates battery aging.
Discussion: The primary source of performance degradation in LiFePO4 batteries is Li loss.
In the context of global initiatives to mitigate carbon emissions, the power grid is experiencing a transformative epoch marked by an escalated integration of renewable energy sources (Ijeoma et al., 2024; Uddin et al., 2018; Christodoulides et al., 2024). This paradigm shift, while propelling the universal adoption of clean energy, concurrently injects a greater uncertainty to the power system (Choi et al., 2021). Additionally, the gradual decommissioning of thermal power units has strained the system’s flexibility resources (Lin et al., 2024; Chen, 2023). This is particularly evident in the areas of peak shaving (PS) and frequency regulation (FR), where the system faces unprecedented pressure (Rosewater and Ferreira, 2016).
To effectively address this challenge, large-scale battery energy storage systems (BESSs) have risen to prominence as a pivotal technology for fortifying the reliability and security of the evolving power infrastructure (Parag and Sovacool, 2016; Liu et al., 2019). Among different maturity levels of BESSs, lithium-ion batteries dominate, accounting for over 70% of deployments globally. LiFePO4 batteries, in particular, are widely used in energy storage power stations due to their high energy density, stability, and safety features (Kim et al., 2015; Orikasa et al., 2013). Industry benchmarks mandate that for 220Ah energy storage batteries, the current rate should not exceed 0.5 C during standard PS and FR operations to uphold operational integrity (Panda et al., 2022). Nonetheless, there is a lack of specific analysis regarding this operational scheme. There is an imperative need to delve into systematic experimental research that dissects the degradation and aging dynamics of energy storage batteries across diverse grid interaction scenarios, pinpointing the principal factors that govern their service life. These research findings will provide a solid scientific foundation and decision support for the effective and safe integration of energy storage power stations into the grid regulation system.
Lithium-ion batteries are complex and dynamic electrochemical systems where their health status is determined by a combination of internal and external factors. Internal factors involve the degradation and failure of the battery material system, including a series of changes in the cathode, anode, electrolyte, and related component materials, leading to a reduction in battery performance and a decline in residual capacity. External influencing factors include ambient temperature, charge/discharge current, depth of discharge (DOD), charge/discharge voltage, and cycle count (Li et al., 2024a; Li et al., 2024b). These external factors accelerate battery aging by affecting the internal factors. Over time or under different working conditions, complex physical and chemical reactions occur within the battery’s electrode material system, manifesting externally as the aging phenomena of lithium-ion batteries. Based on the consequences of different electrochemical phenomena, battery aging modes can be categorized into three types: conductivity loss (CL), loss of lithium inventory (LLI), and loss of active material (LAM) (Han et al., 2024). Conductivity loss is caused by incidents such as collector corrosion and binder decomposition, directly leading to an increase in the ohmic internal resistance of lithium batteries. Loss of lithium inventory is caused by phenomena such as lithium plating and dendrite growth, solid electrolyte interface (SEI) film growth and decomposition, and electrolyte decomposition, which not only leads to a reduction in the maximum available capacity of the battery but also results in an increase in the SEI film resistance and charge transfer resistance. Loss of active material is caused by phenomena such as the fragmentation of electrode active material particles, structural decay, dissolution of transition metals, and binder decomposition, leading to a decrease in the amount of lithium ions that the electrode can accommodate, resulting in capacity loss. Loss of active material can be further divided into four categories: lithium-containing positive and negative active material loss (LAMliPE), lithium-free positive and negative active material loss (LAMdiPE), lithium-containing negative active material loss (LAMliNE), and lithium-free negative active material loss (LAMdeNE).
For lithium-ion batteries, extensive research has been conducted on cycle life and aging mechanisms. Wang et al. found that ultra-high-speed discharge cycles rapidly degrade high-power capacity without affecting normal current capacity (Wang et al., 2021). Ouyang et al. reported significant lithium inventory loss during high current cycling in 18650-type batteries, impacting thermal safety (Ouyang et al., 2020). Liang et al. showed that temperature fluctuations affect capacity degradation in 2.3 Ah LiFePO4 batteries, with optimal performance at moderate temperatures (Liang et al., 2021). Wu et al. observed severe degradation in LiFePO4 batteries at low temperatures and varying charging rates (Wu et al., 2020). Kim et al. demonstrated that operational temperature and compressive force influence degradation pathways in LiFePO4 batteries, as seen through electrochemical impedance spectroscopy (EIS) (Kim et al., 2021). Kim et al. found that Li-Iron Phosphate batteries maintain good aging stability under different cycling conditions (Kim et al., 2022). Ganesan et al. reported that a 15°C temperature difference between cells can cause a 5% system capacity loss, highlighting temperature and multiplication rate as crucial factors in battery performance (Ganesan et al., 2016). These studies underscore the significant impact of charging rates, temperatures, and operational conditions on lithium-ion battery aging, offering valuable insights for enhancing battery life and performance.
The aforementioned works show a growing grasp of the challenge of exploring lithium-ion batteries degradation mechanisms, but as shown in Table 1, there are still some shortcomings:
(1) Most existing studies focus on constant-current and constant-voltage (CC-CV) charging and discharging conditions, primarily investigating small-capacity single cells (Friesen et al., 2016; Baure et al., 2019; Crawford et al., 2021). There is a lack of research on the operational status and aging characteristics of large lithium-ion battery modules from an energy storage perspective, especially for grid services such as peak shaving and frequency regulation, which cannot reflect the actual operation of energy storage power stations.
(2) Due to the diverse functional roles and working environments, the operational requirements of BESSs are more complex (Song et al., 2022; Yang et al., 2011). Accurate definition and standardization of grid services are essential for advancing scientific understanding of battery performance and system safety. However, such tests are resource-intensive and time-consuming (Slimane et al., 2024), typically necessitating the use of specific equipment, operating instructions, and continuous cycling for a minimum of 6 months. As a result, the aging analysis of energy storage battery based on real-world scenarios represents a significant challenge in terms of the resources required.
(3) Although some research groups have made their battery test datasets publicly available (Dubarry and Liaw, 2009; Dubarry et al., 2017; Dubarry and Devie, 2018; Hayman et al., 2023), real-world performance data from industry BESSs is not yet fully accessible. This, coupled with the variability of available data in terms of scale, test conditions, and format, poses significant challenges for performance comparison and modeling. Currently, extensive testing of lithium-ion batteries continues to focus on the electric vehicle sector (Mitici et al., 2023; Vetter et al., 2005; Crawford et al., 2018).
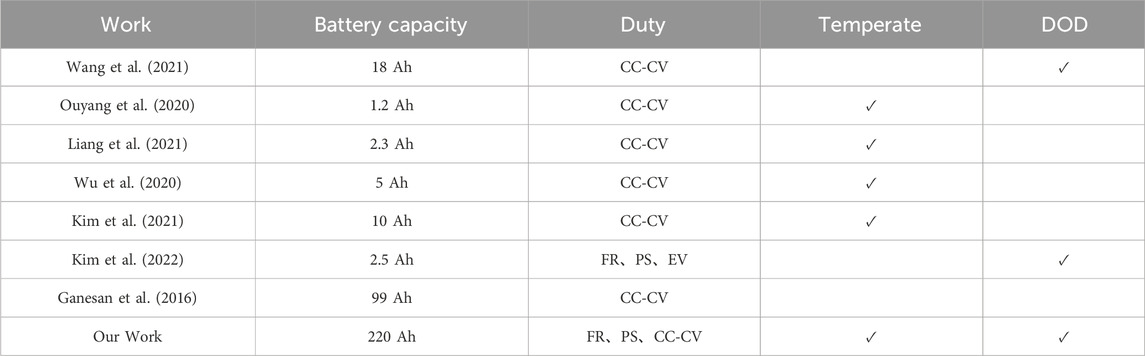
Table 1. Summary of statistical features based on lithium battery aging test.
In light of these issues, we designed and implemented a series of cyclic aging experiments for high capacity LiFePO4 battery modules, simulating actual operational scenarios of an energy storage power station. Our approach introduced diverse battery aging factors, including grid duty, temperature, depth of discharge, during the experimental process and adhered strictly to real charging and discharging protocols from BESSs, aiming to accurately capture the dynamic performance of the battery modules in real-world applications. Over a 16-month continuous test, we systematically analyzed the aging characteristics of battery modules and their resulting performance differences, subjecting the aging mechanism in the battery cycling process and the discrepancy in battery aging under different working conditions to a quantitative analysis based on the characteristic parameters of decay curves, incremental capacity curve, differential voltage curve. The dataset accumulated from this comprehensive work is expected to provide a valuable empirical basis for subsequent modeling studies, cost-benefit analyses, and the optimization and upgrading of energy storage technologies.
The battery module used in the test consists of eight 220Ah BYD gradient utilization LiFePO4 batteries connected in series, measuring 555 mm × 430 mm × 154 mm (including the casing), with a nominal capacity of 220 (±10%) Ah and a nominal voltage of 25.6 V. The flow diagram of overall experiment is shown in Figure 1.
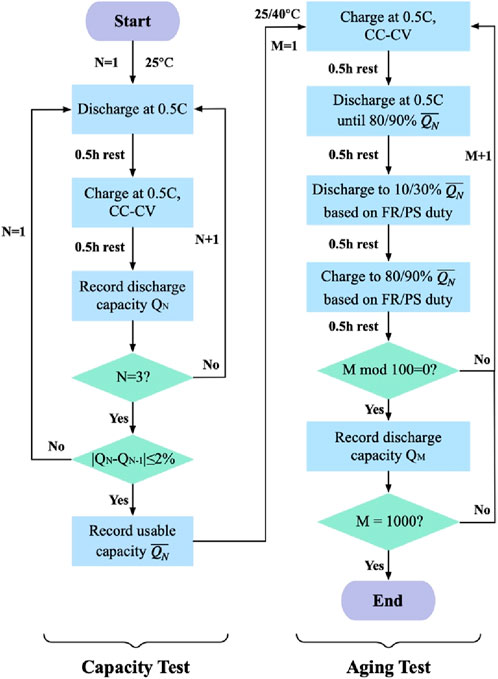
Figure 1. Flow diagram of capacity test and aging test.
The experimental setup, shown in Figure 2, includes the energy feedback system, thermostat, data recorder, battery management system, and upper computer. We employed the Byte BT60V300AC2 battery test system with dual channels, allowing simultaneous testing of two battery modules under different grid services. The test system is placed in a thermostat, maintaining a constant ambient temperature of 25°C or 40°C as required. A constant current charge/discharge test is used to determine the actual capacity of the battery module and calibrate the state of charge (SOC). The specific parameters for each step, including PS/FR duty current, resting time, and cycling conditions, are set through the upper computer test software. The upper computer monitoring system is then used to obtain real-time data on current, voltage, and temperature.
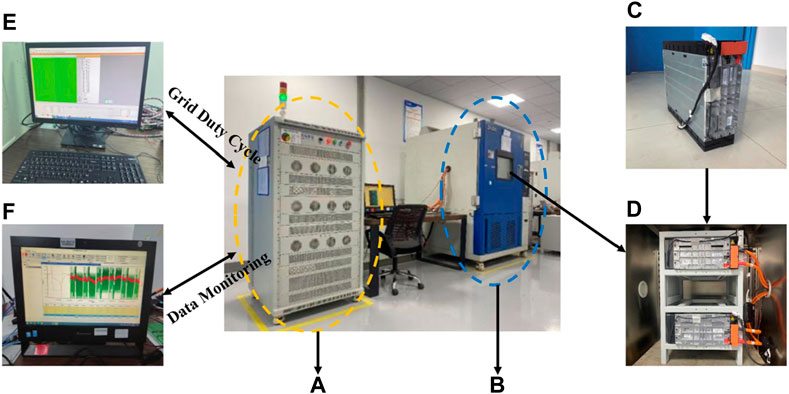
Figure 2. Experimental environment and equipment. (A) Battery Tester. (B) Thermostat Set Temperature (25°C/40°C). (C) Battery Module. (D) Placement in a thermostat. (E) Upper Computer Test Software (Duty, DOD, Cutoff Voltage) Set Grid Service. (F) Upper Computer Monitoring System Data Monitoring (Discharge Capacity, SOC, Voltage).
During the selection process, all battery modules were charged and discharged three times, with the discharge quantities and their arithmetic averages recorded to ensure accuracy (Nishimura et al., 2008; Kumtepeli and Howey, 2022). Batteries with a deviation of less than 2% across the three discharges were considered. Ultimately, six battery modules with similar voltage and capacity were selected for the subsequent tests.
The experimental procedure involved setting up six groups based on grid duties (PS, FR), ambient temperature (25°C, 40°C), and depth of discharge (DOD) (SOC 10%–90%, 30%–80%), as detailed in Table 2. The batteries were placed in a constant temperature environment and left to stabilize for 30 min to ensure the surface temperature matched the set value (Ren et al., 2019). According to the actual peak shaving and frequency regulation grid service of a storage power station in China, we extract the current command and input it to the upper computer for cyclic duty. Example profiles are shown in Figure 3. The corresponding operational command are as follows:
(1) Peak shaving conditions (Figure 3A): (a) Constant current charging at 0.5 C to a cutoff voltage; (b) Resting for 30 min; (c) Constant current discharging at 0.5 C to a cutoff voltage; (d) Resting for 30 min; (e) Repeating the above steps for 1,000 charging/discharging cycles, with discharge capacity recorded every 100 cycles.
(2) Frequency regulation conditions (Figure 3B): (a) Based on instantaneous rate changes, charge at an average rate of 0.5 C to a cutoff voltage; (b) Rest for 30 min; (c) Based on instantaneous rate changes, discharge at an average rate of 0.5 C to a cutoff voltage; (d) Resting for 30 min; (e) Repeating the above steps for 1,000 charging/discharging cycles, with discharge capacity recorded every 100 cycles.
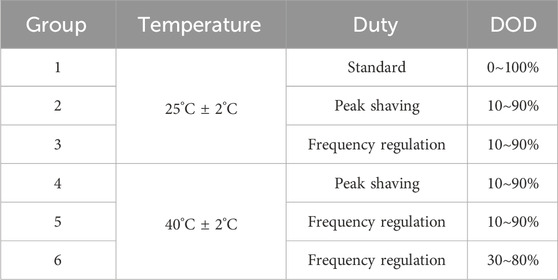
Table 2. Grid service test descriptions.
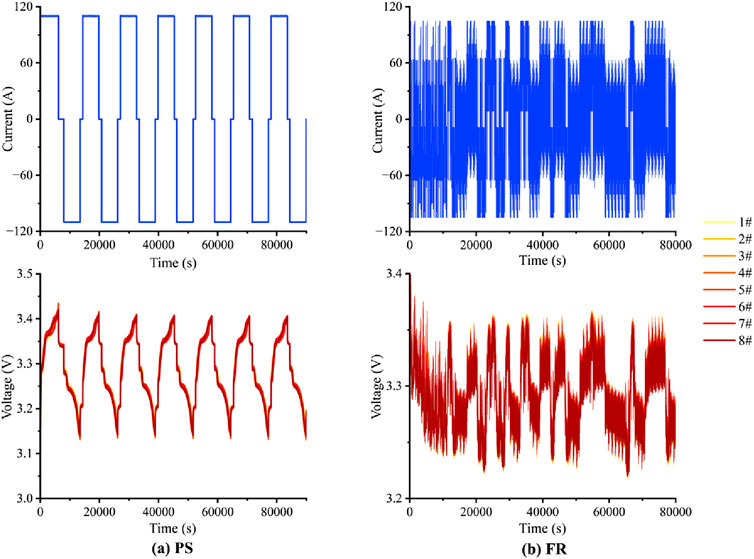
Figure 3. Example of current and voltage profiles of peak shaving (PS) and frequency regulation (FR) cycles.
Considering the actual operational scenarios of electrochemical energy storage system where batteries are continuously in service, we uniformly set a 30-min rest period after each charge-discharge cycle to mitigate the effects of hysteresis caused by internal ohmic resistance, polarization resistance, electrochemical polarization, and concentration polarization. This rest period allows for the uniform distribution of electrolytes within the battery.
The senescence of lithium batteries is invariably coupled with a diminishment in their service life, evident through a reduction in actual capacity relative to their nominal specification (Nowak and Winter 2018). The employment of lithium batteries is inextricably linked to side reactions that induce irreversible modifications to the battery’s capacity equilibrium. Figure 4 presents the comparative discharge curves of six battery modules before and after 1,000 cycles under different conditions. In all test scenarios, both platform voltage and usable capacity degrade to varying degrees. Notably, the impact of grid service demands, especially under the duress of elevated temperatures and peak shaving (PS) conditions, exacerbates the decline in both battery capacity and platform voltage, surpassing the magnitude of degradation observed under standard (ST) conditions.
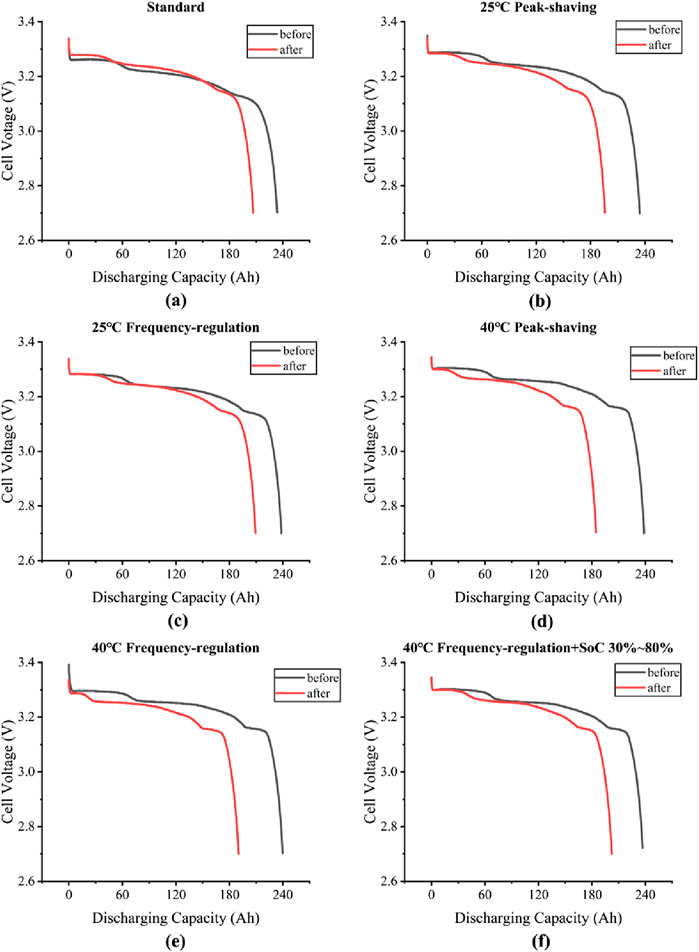
Figure 4. Discharge curves under different conditions before and after battery module cycling.
Capacity loss over time may not accurately reflect battery performance due to the varying energy consumption in each duty cycle. Figures 5, 6 illustrate the capacity loss and total discharged energy for all cycles during the test period. Figure 5 delineates a general trend of diminishing maximum available capacity in tandem with the escalation of duty cycles, with the velocity of this decline exhibiting variability among the distinct experimental groups. Compared to the ST test, batteries subjected to FR and shallow DOD demonstrate a more favorable retention of capacity, while PS service is associated with a more pronounced loss of capacity.
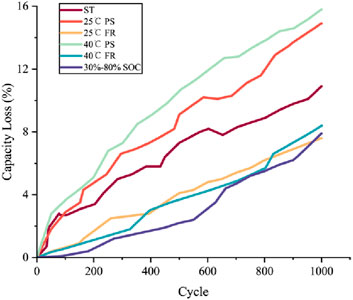
Figure 5. Comparison of capacity loss.
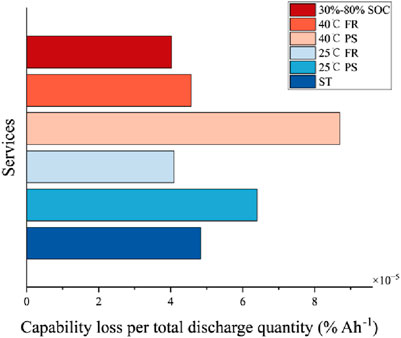
Figure 6. Comparison of total discharge energy utilized.
Throughout the curve of capacity decay, an intriguing phenomenon of capacity rejuvenation is observed. This is characterized by an abrupt surge in capacity in the succeeding cycle, prior to a precipitous drop. Such an occurrence can be attributed to the decomposition of unstable compounds that arise from the charging and discharging cycles during the period of repose. This decomposition liberates additional Li+, which in turn enhances the energy yield in the subsequent cycle (Boerner et al., 2017; Tobishima et al., 2000).
Figure 6 further compares the percentage of discharges among the services. The FR test provided a relatively larger cumulative discharge energy due to the higher volatility of the power signal, resulting in greater energy throughput within the fixed SOC operating interval (Galatro et al., 2020).
To investigate the influence of different grid duties on the aging of large-capacity batteries, aging tests were conducted under various grid services. Figure 7 illustrates the aging curves of batteries at different temperatures for PS and FR conditions with a SOC of 10%–90%. To further quantify the aging trend, we performed a linear fitting analysis on the relationship between the state of health (SOH) and total discharge capacity for the four test modules, as detailed in Table 3. The fitting results indicate that, at the same temperature and DOD, the aging rate of batteries under PS service is significantly faster than under FR. The battery aging decay ratio between the PS and FR modules is 1.81 at 25°C and 1.92 at 40°C. This difference is attributed to the higher average current rate in FR, which leads to more frequent de-embedding of Li + ions, accelerating the decline of active material (Hasan and Serra Altinoluk, 2023). Consequently, the degree of battery aging is higher for PS than for FR.
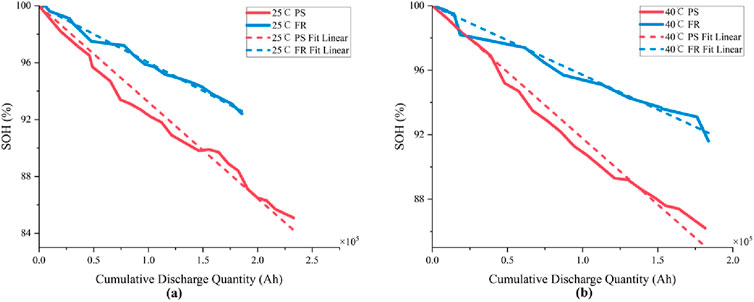
Figure 7. Aging curves of batteries under different grid duties.
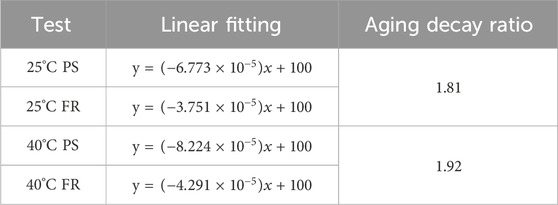
Table 3. Linear fitting results for PS/FM services.
Figure 8 illustrates the aging curves of batteries at normal and high temperatures under different grid duties with a SOC from 10% to 90%. The linear fitting results are presented in Table 4. Under PS services, the battery aging decay ratio between the 25°C module and the 40°C module is 0.82. For FR, the aging decay ratio is 0.87. These results indicate that, for the same service and DOD, batteries age faster at higher temperatures. This is because increased temperatures enhance the diffusion speed of charged ions within the battery, allowing chemical reactions to occur more fully (Wang et al., 2011). However, operating a lithium battery at too high a temperature can lead to internal expansion, reduced electrolyte concentration, slower movement of Li+ in the electrolyte, and increased polarization (Schauser et al., 2022), all of which accelerate aging.
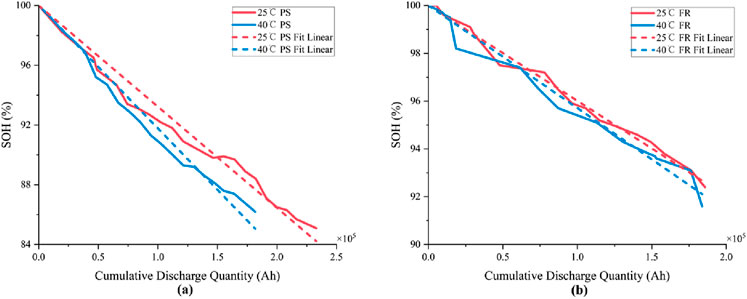
Figure 8. Aging curves of batteries under normal/high temperature.
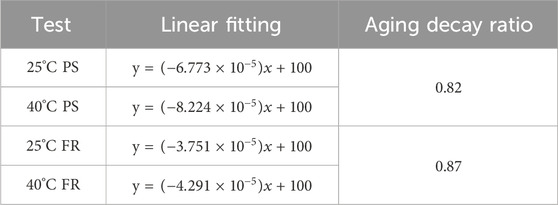
Table 4. Linear fitting results for switching services.
To further analyse the effect of DOD on battery aging, Figure 9 compares battery aging at 40°C under FR services with DODs of 10%–90% and 30%–80%. At deeper DOD, the increased reactivity of electrode materials, along with greater heat generation and stress, results in more significant capacity loss during cyclic charging and discharging (Lu et al., 2017). However, these batteries also exhibit better aging stability, as indicated in Table 5 by an aging decay ratio of 1.2 between DODs of 10%–90% and 30%–80%. Therefore, a shallow charging and discharging operation mode under high temperature and FR conditions can effectively mitigate battery aging.
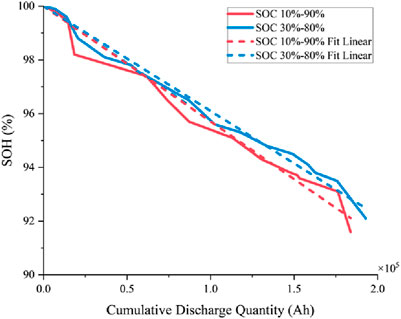
Figure 9. Aging curves of batteries under different DOD.
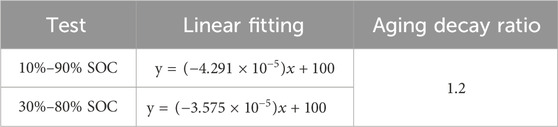
Table 5. Linear fitting results for different DOD.
Incremental capacity analysis (ICA) is a widely used non-destructive method for assessing the SOH of lithium-ion batteries (Zheng et al., 2018). It involves differentiating the change in battery capacity and voltage over a sufficiently short time interval. The IC is calculated by Equation 1.
The IC curve reveals many features related to the aging mechanism, such as peak position, peak height, and IC peak area, which help characterize the internal state of the battery (Pastor-Fernández et al., 2017). In practical applications, it is easier to obtain stable voltage-capacity data during charging rather than discharging. To generate an IC curve from a charging curve, a fixed value must be set for the voltage interval between two sampling points. An interval that is too small results in a poorly smoothed IC curve, while one that is too large leads to a loss of information. In this work, the voltage interval is fixed at 30 mV.
Figure 10 presents the IC curves for 1,000 cycles across five test groups, with the horizontal axis representing battery terminal voltage and the vertical axis representing incremental capacity. The test battery exhibits three IC peaks (①, ②, and ③), which characterize changes in electrode active material and Li + inventory. The electrochemical processes occurring throughout the charging process can be divided into two steps. The first step contains four electrochemical reactions, which are as follows: C6-LiC72, LiC72-LiC36, LiC36-LiC18, and LiC18-LiC12. The overall presentation is C6-LiC12, which corresponds to the entirety of the peak ①-peak ② process on the IC curve. The second step is LiC12-LiC6, which corresponds to peak ③ on the IC curve.
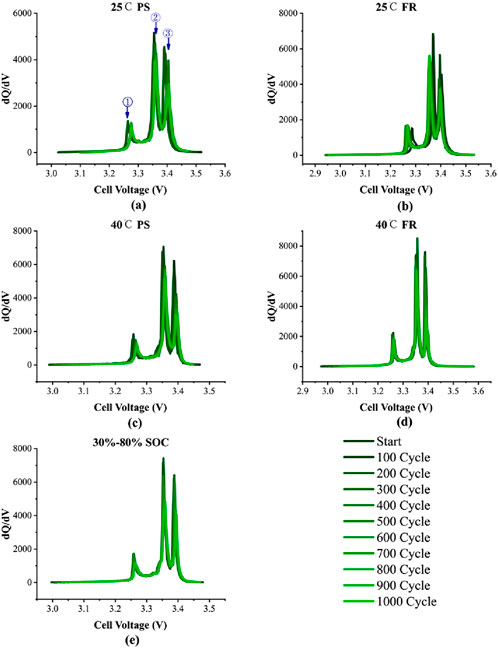
Figure 10. The IC curve under different cycle times.
As shown in Figure 10, the characteristics of the IC curves of batteries tested under different operating conditions vary. It is observed that the heights of the three distinct peaks across the five battery groups exhibit a concurrent decline throughout the cycling process. In contrast, the FR group demonstrates a notable stability in the position of its peaks, which implies that the specific electrochemical reactions corresponding to these peaks occur at consistent voltages. The IC curves of the PS group progressively migrate towards higher voltages. This rightward shift about voltage plateau may indicate an increase in battery’s internal resistance and a reduction in capacity.
In terms of the amplitude of decay, the peak ③ decay is the most significant, and peak ② decay is also accelerated after 300 cycles. It can be reasonably deduced that the aging of the graphite anode and the loss of irreversible lithium ions are the primary factors contributing to the battery’s decay process, which is accompanied by an intensification of the battery’s side reactions. In the initial cycling stage, the formation of a SEI film at the negative electrode is a consequence of the battery’s activation process (Yoshida et al., 2003). As the duration of cycling aging is extended, the SEI film increases in thickness gradually. While the SEI film serves to safeguard the electrochemical reaction between the graphite anode and the battery’s electrolyte, the expansion and transformation of the SEI film, coupled with the generation of lithium deposition phenomena (Jaguemont et al., 2016), give rise to the most pronounced peak ③ degradation. Concurrently, the direct side reaction between the battery’s graphite anode and the electrolyte is intensified, thereby precipitating a graphite stripping phenomenon. Following 300 aging cycles, the battery’s performance degradation increases, as evidenced by an elevated irreversible lithium-ion loss (Wang et al., 2019).
By analyzing the positions of the peaks in the IC curves, we obtained the statistics of the peak values presented in Figure 11. After 1,000 cycles, the loss rates for the normal temperature and PS cycle batteries for P1, P2, and P3 are 20.8%, 23.8%, and 48.7%. For the normal temperature and FR cycle batteries, the loss rates for P1, P2, and P3 are 7.9%, 23.9%, and 19.9%. Under high temperature and PS cycle conditions, the loss rates for P1, P2, and P3 are 44.1%, 33.9%, and 53.3%. For high temperature and FR cycle batteries, the loss rates for P1, P2, and P3 are 31.1%, 15.6%, and 57.8%. Additionally, for high temperature and shallow DOD cycle batteries, the loss rates for P1, P2, and P3 are 20.9%, 38.3%, and 36.5%. These IC peak loss rates corroborate the conclusion that heat and PS services significantly accelerate battery degradation. Concurrently, the peak ③ exhibits the most pronounced loss rate, substantiating the hypothesis that irreversible lithium-ion depletion is the paramount driver of battery degradation.
Figure 11. Variation of battery IC peak value under different cycle times.
Differential voltage analysis (DVA) is similar to ICA in that it derives the open-circuit voltage (OCV) curve obtained by charging and discharging at a low constant current rate (Lewerenz and Sauer, 2017). However, while ICA focuses on the capacity-voltage relationship, DVA examines the phase equilibrium within the battery, with troughs in the DV curve corresponding to peaks in the IC curve (Zhang et al., 2020). The DV is calculated by Equation 2:
Figure 12 illustrates the variations in DV curves for LiFePO4 batteries over multiple cycles under different tests. The horizontal span of the DV curve’s valley delineates the amount of Li + intercalated into or deintercalated from the electrode material during the phase transition. Upon subjecting the battery to cyclic aging, an alteration in the DV curve is anticipated. Should there be a depletion of active material without a concomitant loss of lithium inventory, the interval between the DV curve’s peaks at the respective electrodes will diminish. Conversely, if a diminution of lithium inventory occurs in the absence of active material loss, a similar reduction in the peak-to-peak distance of the positive and negative electrodes will be observed (Wang and Whitacre, 2021).
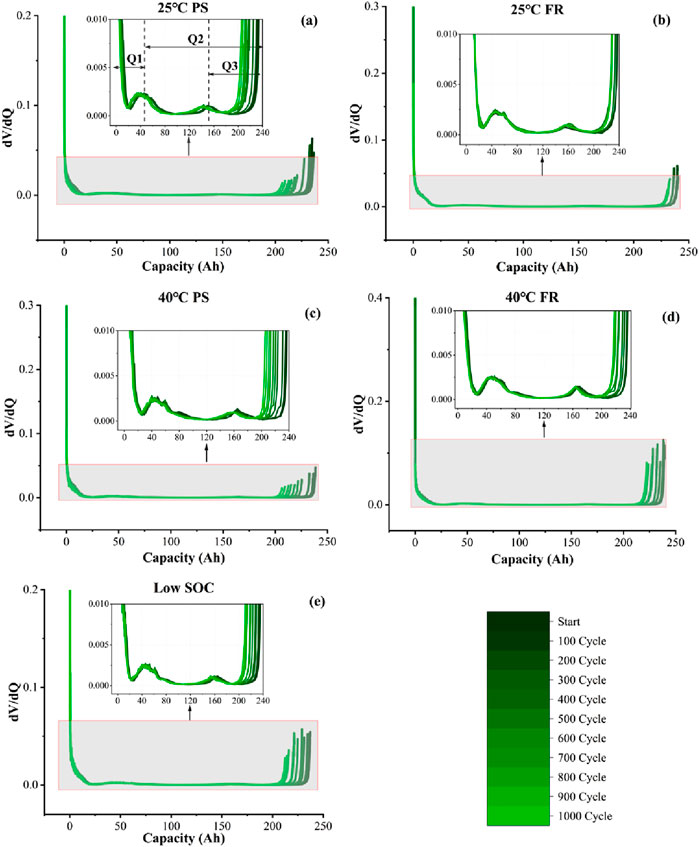
Figure 12. The DV curves under different cycle times.
As Figure 12 shown, three distinct troughs are discernible in each DV curve. The most pronounced trough is situated within the 80 to 160 Ah capacity interval, indicating a significant phase transition or reaction. Subsequently, a secondary trough is evident near the 200 Ah capacity mark. The least pronounced trough emerges around the 25 Ah capacity. Traditionally, the DV curve is partitioned into three sections, namely Q1, Q2, and Q3, in accordance with the distribution of characteristic troughs (Keil and Jossen, 2017). The curve characteristics at the two extremities of the Q1 segment are predominantly governed by the anode material. The Q2 portion amalgamates the characteristic information of both the cathode and anode materials, and is capable of reflecting the matching relationship between them. Consequently, it can manifest the loss of active lithium. Meanwhile, the curve characteristics at the two ends of the Q3 part are primarily controlled by the cathode, which can effectively reveal the loss of active material at the positive electrode. During the initial 200 cycles, the DV curve troughs maintain a relatively stable profile, reflecting the stabilization of the battery’s internal chemical reaction state as a result of the activation process. Upon reaching the 300-cycle, an obvious shift in the secondary troughs is observed, migrating towards the low-capacity region. This is evidenced by the reduction in Q3. It indicates that the internal chemical reaction of the battery is progressively weakening, resulting in a loss of the lithium inventory. This ultimately leads to a reduction in the quantity of Li + returned to the negative electrode, and a gradual decline in the battery’s storage capacity. During the intermediate and latter phases of the cycling process, the remaining troughs in the DV curve exhibit a similar migration, signifying a reduction in the capacities associated with Q1 and Q2. This observation implies a substantial loss of active material from the negative electrode. A thorough comparison across various operational conditions indicates that the attenuation is more severe in the high-temperature testing groups (Figures 12C, D) compared to the room-temperature groups (as shown in Figures 12A, B). It is hypothesized that the elevated temperature environment exacerbates the side reactions at the electrolyte-electrode interface, thereby accelerating the degradation process. Additionally, the SEI film on the negative electrode surface progressively thickens and consume a significant quantity of active lithium, which in turn precipitates the rapid deterioration of the battery’s electrochemical performance.
By analyzing the positions of the peaks in the DV curves shown in Figure 13, we can derive the values of Q1, Q2, and Q3. After 1,000 cycles, the loss rates of Q1, Q2, and Q3 for the batteries cycled under normal temperature and PS conditions are 25.8%, 8.6%, and 16.7%. For batteries under normal temperature and FR conditions, the loss rates are 2.6%, 3.8%, and 19.1%. Under high temperature and PS conditions, the loss rates are 20.8%, 11.5%, and 38.7%, while for high temperature and FR conditions, the loss rates are 11.1%, 10.2%, and 23.1%. Finally, for high temperature and shallow DOD conditions, the loss rates are 6.1%, 7.5%, and 18.4%. The loss rate of Q1, which is representative of the anode active material, is reduced at elevated temperatures and in the peaking environment in comparison to other conditions. Conversely, the loss rate of Q3, which is representative of the cathode active material, is elevated and is more influenced by the heat transfer conditions. Overall, the capacity loss of LFP modules is primarily derived from LLI and lithium consuming side reactions.
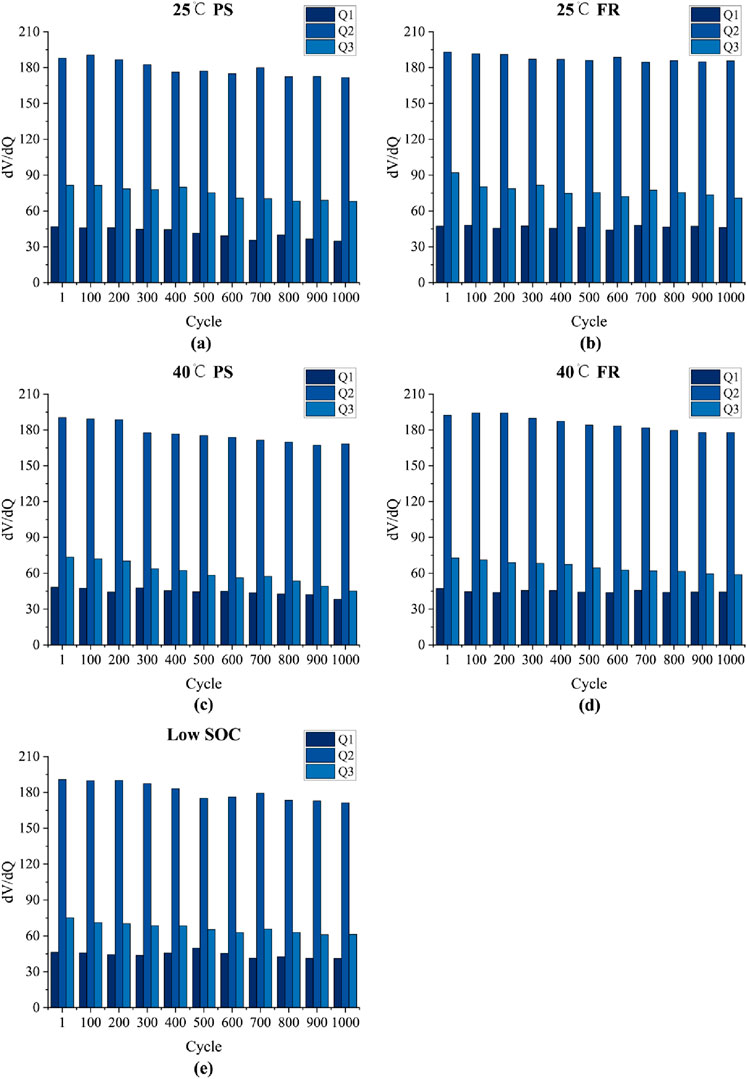
Figure 13. Variation of DV distance with different number of cycles.
In this study, we examined LiFePO4 batteries for energy storage, focusing on their aging characteristics under various grid services, ambient temperatures, and DOD through a cyclic aging test spanning over 16 months. Our goal was to provide insights into the safety management of lithium batteries. The main conclusions and battery management strategy are as follows:
(1) Peak shaving accelerates battery aging compared to frequency regulation, primarily due to the higher average current rate in PS mode under the same total discharge capacity. At 25°C and an SOC of 10%–90%, the aging decay ratio of the battery under PS and FR is 1.81. At 40°C, this ratio increases to 1.92. Experimental results for batteries switched between different conditions also indicate higher aging rates under PS than FR. In consideration of the polarization effect, it is advised that the battery be permitted to stand for a period exceeding 10–15 min following the completion of charging and discharging cycles, at least twice a day. In FM mode, due to the frequent alternation between charging and discharging or variable power operation, the static time can be extended appropriately.
(2) A high-temperature environment enhances the diffusion speed of charged ions and increases polarization inside the battery, thereby accelerating aging. The decay ratios for batteries in PS and FR at high and normal temperatures are 1.22 and 1.15. In operation, it is recommended that the ambient temperature be maintained at 25°C, and that the maximum temperature not exceed 35°C. Furthermore, it is advised that the temperature of the LiFePO4 battery should not exceed 35°C and cannot beyond 55°C, and that the temperature consistency deviation should not exceed 5°C.
(3) LiFePO4 batteries exhibit better aging stability across different SOC operating intervals. The shallow DOD mode helps mitigate battery aging. Under 40°C and FR conditions, the decay ratio between deep and shallow DOD reaches 1.65. It is recommended that the depth of discharging be less than 60% to refrain from utilizing batteries within the high SOC range, and that the SOC operating range be 20%–80% for PS and FR. Furthermore, the SOC should be calibrated on a periodic basis.
(4) Analysis of differential curves under five cycling conditions reveals that the performance degradation of LiFePO4 batteries mainly stems from the loss of active lithium ions, accompanied by the loss of the negative electrode active material.
In the development of power grid, the BESSs have the potential to formulate a more adaptable operation mode and switching strategy, which is contingent upon the diverse conditions of the power grid, such as peak-load hours, off-peak hours, and frequency fluctuations. By leveraging the strategies presented in this work, the charging and discharging power as well as energy management in each mode can be optimized. Moreover, through the battery management system (BMS) for real-time access to battery temperature, SOC, and other information, the BESS can explore the integration path of the thermal management system and the BMS. This enables timely temperature control and power regulation, ensuring that the battery is maintained within the optimal temperature range and the appropriate charge-discharge depth range. Further, the service life of the battery is prolonged, and the stability of the system operation is enhanced.
Although the commercial batteries tested may not represent the industry’s cutting edge, the initial 16-month evaluation has elucidated the differential impacts of various factors on battery aging. This understanding is crucial for a comprehensive grasp of battery pack and module performance and provides valuable reference information. Moving forward, we will continue testing until the main objectives of battery life cycle assessment and end-of-life standards are achieved, and make the results publicly available. We are also committed to further characterizing the effects of heat management and module degradation processes, along with conducting scientific research and detailed reporting.
The original contributions presented in the study are included in the article/supplementary material, further inquiries can be directed to the corresponding author.
JX: Conceptualization, Methodology, Writing–review and editing. HL: Formal Analysis, Investigation, Methodology, Software, Validation, Visualization, Writing–original draft. SH: Conceptualization, Data curation, Supervision, Writing–review and editing. HW: Funding acquisition, Investigation, Writing–review and editing.
The author(s) declare that financial support was received for the research, authorship, and/or publication of this article. This work was supported by the Key R&D Program of Zhejiang (No. 2024C01058) and the National Key R&D Program of China (2023YFC3009900).
Authors JX, HL, SH, and HW were employed by Hangzhou Gold Electronic Equipment Inc.
The author(s) declare that no Generative AI was used in the creation of this manuscript.
All claims expressed in this article are solely those of the authors and do not necessarily represent those of their affiliated organizations, or those of the publisher, the editors and the reviewers. Any product that may be evaluated in this article, or claim that may be made by its manufacturer, is not guaranteed or endorsed by the publisher.
Baure, G., Devie, A., and Dubarry, M. (2019). Battery durability and reliability under electric utility grid operations: path dependence of battery degradation. J. Electrochem Soc. 10, 1593. doi:10.1149/2.0971910jes
Boerner, M., Friesen, A., Gruetzke, M., Stenzel, Y. P., Brunklaus, G., Haetge, J., et al. (2017). Correlation of aging and thermal stability of commercial 18650-type lithium ion batteries. J. Power Sources 3422, 382–392. doi:10.1016/j.jpowsour.2016.12.041
Chen, J. (2023). Optimize configuration of multi-energy storage system in a standalone microgrid. Front. Energy Res. 11, 1283859. doi:10.3389/fenrg.2023.1283859
Choi, D., Shamim, N., Crawford, A., Huang, Q., Vartanian, C. K., Viswanathan, V. V., et al. (2021). Li-ion battery technology for grid application. J. Power Sources 511, 230419. doi:10.1016/j.jpowsour.2021.230419
Christodoulides, P., Capuder, T., and Georgiou, G. S. (2024). Editorial: optimization of energy autonomy in buildings with renewable energy sources and battery storage. Front. Energy Res. 12, 1387315. doi:10.3389/fenrg.2024.1387315
Crawford, A. J., Choi, D., Balducci, P. J., Subramanian, V. R., Viswanathan, C. V., et al. (2021). Lithium-ion battery physics and statistics-based state of health model. J. Power Sources 501, 230032. doi:10.1016/j.jpowsour.2021.230032
Crawford, A. J., Huang, Q., Kintner-Meyer, M. C. W., Zhang, J. G., Reed, D. M., Sprenkle, V. L., et al. (2018). Lifecycle comparison of selected Li-ion battery chemistries under grid and electric vehicle duty cycle combinations. J. Power Sources 380, 185–193. doi:10.1016/j.jpowsour.2018.01.080
Dubarry, M., and Devie, A. (2018). Battery durability and reliability under electric utility grid operations: representative usage aging and calendar aging. J. Energy Storage 18, 185–195. doi:10.1016/j.est.2018.04.004
Dubarry, M., Devie, A., Stein, K., Tun, M., Matsuura, M., and Rocheleau, R. (2017). Battery Energy Storage System battery durability and reliability under electric utility grid operations: analysis of 3 years of real usage. J. Power Sources 338, 65–73. doi:10.1016/j.jpowsour.2016.11.034
Dubarry, M., and Liaw, B. Y. (2009). Identify capacity fading mechanism in a commercial LiFePO4 cell. J. Power Sources 194, 541–549. doi:10.1016/j.jpowsour.2009.05.036
Friesen, A., Horsthemke, F., Monnighoff, X., Brunklaus, G., Krafft, R., Börner, M., et al. (2016). Impact of cycling at low temperatures on the safety behavior of 18650-type lithium ion cells: combined study of mechanical and thermal abuse testing accompanied by post-mortem analysis. J. Power Sources 1, 11. doi:10.1016/j.jpowsour.2016.09.120
Galatro, D., Al-Zareer, M., Da, S. C., et al. (2020). Thermal behavior of lithium-ion batteries: aging, heat generation, thermal man-agement and failure. Front. Heat. Mass Tran 1, 18. doi:10.5098/hmt.14.17
Ganesan, N., Basu, S., Hariharan, K. S., Kolake, S. M., Song, T., Yeo, T., et al. (2016). Physics based modeling of a series parallel battery pack for asymmetry analysis, predictive control and life extension. J. Power Sources 322, 57–67. doi:10.1016/j.jpowsour.2016.05.005
Han, X., Lu, L., Zheng, Y., Feng, X., Li, Z., Li, J., et al. (2024). A review on the key issues of the lithium ion battery degradation among the whole life cycle. eTransportation 1, 100005. doi:10.1016/j.etran.2019.100005
Hasan, M., and Serra Altinoluk, H. (2023). Current and future prospective for battery controllers of solar PV integrated battery energy storage systems. Front. Energy Res. 11, 1139255. doi:10.3389/fenrg.2023.1139255
Hayman, D., Dufek, E. J., Mukherjee, P. P., Sholklapper, T., and Love, C. T. (2023). Editorial: establishing standards for battery data and pathways towards its validation. Front. Energy Res. 11, 1271196. doi:10.3389/fenrg.2023.1271196
Ijeoma, M. W., Lewis, C. G., Chen, H., Chukwu, B. N., and Carbajales-Dale, M. (2024). Technical, economic, and environmental feasibility assessment of solar-battery-generator hybrid energy systems: a case study in Nigeria. Front. Energy Res. 12, 1397037. doi:10.3389/fenrg.2024.1397037
Jaguemont, J., Loïc, B., Venet, P., et al. (2016). Lithium-ion battery aging experiments at subzero temperatures and model develop-ment for capacity fade estimation. IEEE T Veh. Technol. 65, 4343. doi:10.1109/TVT.2015.2473841
Keil, P., and Jossen, A. (2017). Calendar aging of NCA lithium-ion batteries investigated by differential voltage analysis and coulomb tracking. J. Electrochem Soc. 164, A6066–A6074. doi:10.1149/2.0091701jes
Kim, J. H., Kwak, E., and Oh, K. Y. (2021). Degradation pathways dependency of a lithium iron phosphate battery on temperature and compressive force. Int. J. Energ Res. 45, 6888–6906. doi:10.1002/er.6280
Kim, N., Shamim, N., Crawford, A., et al. (2022). Comparison of Li-ion battery chemistries under grid duty cycles. J. Power Sources 1, 11. doi:10.1016/j.jpowsour.2022.231949
Kim, Y., Jeoungm, T., Nam, S., Lee, S. H., Kim, J. C., and Lee, S. G. (2015). Structural and electrical properties of lithium-ion rechargeable battery using the LiFePO4/carbon cathode material. J. Nanosci. Nanotechno 15, 2436–2440. doi:10.1166/jnn.2015.10261
Kumtepeli, V., and Howey, D. A. (2022). Understanding battery aging in grid energy storage systems. Joule 6, 2250–2252. doi:10.1016/j.joule.2022.09.014
Lewerenz, M., and Sauer, D. U. (2017). Differential voltage analysis as a tool for analyzing inhomogeneous aging: a case study for LiFePO4/graphite cylindrical cells. J. Power Sources 57, 67. doi:10.1016/j.jpowsour.2017.09.059
Li, W., Bao, Z., Gao, Q., Du, Q., and Jiao, K. (2024a). Investigation of novel pulse preheating strategies for lithium-ion batteries at subzero temperature based on a multi-level CFD platform. eTransportation 19, 100307. doi:10.1016/j.etran.2023.100307
Li, W., Bao, Z., Gao, Q., Wang, J., Du, Q., and Jiao, K. (2024b). Insights into lithium plating characteristics enable plating-free heating strategy for bidirectional pulse utilizing a refined physics-based model. Int. J. Heat. Mass Tran 238, 126440. doi:10.1016/j.ijheatmasstransfer.2024.126440
Liang, J., Gan, Y., Yao, M., and Li, Y. (2021). Numerical analysis of capacity fading for a LiFePO4 battery under different current rates and ambient temperatures. Int. J. Heat. Mass Tran 165, 120615. doi:10.1016/j.ijheatmasstransfer.2020.120615
Lin, X., Meng, W., Yu, M., Yang, Z., Luo, Q., Rao, Z., et al. (2024). Environmental impact analysis of lithium iron phosphate batteries for energy storage in China. Front. Energy Res. 12, 1361720. doi:10.3389/fenrg.2024.1361720
Liu, T., Liu, Q., Lei, J., and Sui, J. (2019). A new solar hybrid clean fuel-fired distributed energy system with solar thermochemical conversion. J. Clean. Prod. 213, 1011–1023. doi:10.1016/j.jclepro.2018.12.193
Lu, Z., Yu, X., Zhang, L., Meng, X., Wei, L., and Jin, L. (2017). Experimental investigation on the charge-discharge performance of the commercial lithium-ion batteries. Energy Procedia 143, 21–26. doi:10.1016/j.egypro.2017.12.642
Mitici, M., Hennink, B., Pavel, M., and Dong, J. (2023). Prognostics for lithium-ion batteries for electric vertical take-off and landing aircraft using data-driven machine learning. Energy AI 12, 100233. doi:10.1016/j.egyai.2023.100233
Nishimura, S. I., Kobayashi, G., Ohoyama, K., Kanno, R., Yashima, M., and Yamada, A. (2008). Experimental visualization of lithium diffusion in LixFePO4. Nat. Mater 7, 707–711. doi:10.1038/NMAT2251
Nowak, S., and Winter, M. (2018). The role of cations on the performance of lithium ion batteries: a quantitative analytical approach. Acc. Chem. Res. 51, 265–272. doi:10.1021/acs.accounts.7b00523
Orikasa, Y., Maeda, T., Koyama, Y., Murayama, H., Fukuda, K., Tanida, H., et al. (2013). Transient phase change in two phase reaction between LiFePO4 and FePO4 under battery operation. Chem. Mater. 25, 1032–1039. doi:10.1021/cm303411t
Ouyang, D., Weng, J., Chen, M., Liu, J., and Wang, J. (2020). Experimental analysis on the degradation behavior of overdischarged lithium-ion battery combined with the effect of high-temperature environment. Int. J. Energ Res. 44, 229–241. doi:10.1002/er.4898
Panda, S., Mohanty, S., Rout, P. K., and Sahu, B. K. (2022). A conceptual review on transformation of micro-grid to virtual power plant: issues, modeling, solutions, and future prospects. Int. J. Energ Res. 46, 7021–7054. doi:10.1002/er.7671
Parag, Y., and Sovacool, B. K. (2016). Electricity market design for the prosumer era. Nat. Energy 1, 16032. doi:10.1038/nenergy.2016.32
Pastor-Fernández, C., Uddin, K., Chouchelamane, G. H., Widanage, W. D., and Marco, J. (2017). A comparison between electrochemical impedance spectroscopy and incremental capacity-differential voltage as Li-ion diagnostic techniques to identify and quantify the effects of degradation modes within battery management systems. J. Power Sources 360, 301–318. doi:10.1016/j.jpowsour.2017.03.042
Ren, D., Hsu, H., Li, R., Feng, X., Guo, D., Han, X., et al. (2019). A comparative investigation of aging effects on thermal runaway behavior of lithium-ion batteries. eTransportation 2, 100034. doi:10.1016/j.etran.2019.100034
Rosewater, D., and Ferreira, S. (2016). Development of a frequency regulation duty-cycle for standardized energy storage performance testing. J. Energy Storage 7 (286), 286–294. doi:10.1016/j.est.2016.04.004
Schauser, N. S., Lininger, C. N., Leland, E. S., and Sholklapper, T. Z. (2022). An open access tool for exploring machine learning model choice for battery life cycle prediction. Front. Energy Res. 10, 1058999. doi:10.3389/fenrg.2022.1058999
Slimane, A., Ahmed, S., Ali, A., Mesbahi, T., and Boné, R. (2024). Data-driven strategy for state of health prediction and anomaly detection in lithium-ion batteries. Energy AI 17, 100413. doi:10.1016/j.egyai.2024.100413
Song, Z., Nazir, M. S., Cui, X., Hiskens, I. A., and Hofmann, H. (2022). Benefit assessment of second-life electric vehicle lithium-ion batteries in distributed power grid applications. J. Energy Storage 56, 105939. doi:10.1016/j.est.2022.105939
Tobishima, S., Hirai, T., and Yamaki, J. (2000). Safety and capacity retention of lithium ion cells after long periods of storage. J. Appl. Electrochem 30, 405–410. doi:10.1023/A:1003992027121
Uddin, K., Dubarry, M., and Glick, M. B. (2018). The viability of vehicle-to-grid operations from a battery technology and policy perspective. Energy Policy 113, 342–347. doi:10.1016/j.enpol.2017.11.015
Vetter, J., Novák, P., Wagner, M. R., Veit, C., Möller, K. C., Besenhard, J., et al. (2005). Ageing mechanisms in lithium-ion batteries. J. Power Sources 147, 269–281. doi:10.1016/j.jpowsour.2005.01.006
Wang, C., Liu, Z., Sun, Y., Gao, Y., and Yan, P. (2021). Aging behavior of lithium titanate battery under high-rate discharging cycle. Energies 14, 5482. doi:10.3390/en14175482
Wang, H., Frisco, S., Gottlieb, E., Yuan, R., and Whitacre, J. F. (2019). Capacity degradation in commercial Li-ion cells: the effects of charge protocol and temperature. J. Power Sources 426, 67–73. doi:10.1016/j.jpowsour.2019.04.034
Wang, H., and Whitacre, J. F. (2021). Inhomogeneous aging of cathode materials in commercial 18650 lithium ion battery cells. J. Energy Storage 35, 102244. doi:10.1016/j.est.2021.102244
Wang, J., Liu, P., Hicks-Garner, J., Sherman, E., Soukiazian, S., Verbrugge, M., et al. (2011). Cycle-life model for graphite-LiFePO4 cells. J. Power Sources 196, 3942–3948. doi:10.1016/j.jpowsour.2010.11.134
Wu, X., Wang, W., and Du, J. (2020). Effect of charge rate on capacity degradation of LiFePO4 power battery at low temperature. Int. J. Energ Res. 44, 1775–1788. doi:10.1002/er.5022
Yang, Z., Zhang, J., Kintner-Meyer, M. C. W., Lu, X., Choi, D., Lemmon, J. P., et al. (2011). Electrochemical energy storage for green grid. Chem. Rev. 111, 3577–3613. doi:10.1021/cr100290v
Yoshida, H., Imamura, N., Inoue, T., and Komada, K. (2003). Capacity loss mechanism of space lithium-ion cells and its life estimation method. Electrochemistry 71, 1018–1024. doi:10.5796/electrochemistry.71.1018
Zhang, Y., Wang, Q., Liaw, B., Nagpure, S. C., Dufek, E. J., and Dickerson, C. C. (2020). Cell degradation quantification-a performance metric-based approach. J. Phys-Energy 2, 034003. doi:10.1088/2515-7655/ab979b
Keywords: li-ion batteries, battery energy storage system, grid, aging, frequency regulation, peak shaving
Citation: Xu J, Li H, Hua S and Wang H (2025) Experimental investigation of grid storage modes effect on aging of LiFePO4 battery modules. Front. Energy Res. 13:1528691. doi: 10.3389/fenrg.2025.1528691
Received: 15 November 2024; Accepted: 27 January 2025;
Published: 14 February 2025.
Edited by:
Linhao Fan, Tianjin University, ChinaReviewed by:
Wending Pan, The University of Hong Kong, Hong Kong SAR, ChinaCopyright © 2025 Xu, Li, Hua and Wang. This is an open-access article distributed under the terms of the Creative Commons Attribution License (CC BY). The use, distribution or reproduction in other forums is permitted, provided the original author(s) and the copyright owner(s) are credited and that the original publication in this journal is cited, in accordance with accepted academic practice. No use, distribution or reproduction is permitted which does not comply with these terms.
*Correspondence: Hao Wang, d2FuZ2hhb0BjaGluYS1nb2xkLmNvbQ==
Disclaimer: All claims expressed in this article are solely those of the authors and do not necessarily represent those of their affiliated organizations, or those of the publisher, the editors and the reviewers. Any product that may be evaluated in this article or claim that may be made by its manufacturer is not guaranteed or endorsed by the publisher.
Research integrity at Frontiers
Learn more about the work of our research integrity team to safeguard the quality of each article we publish.