 Gao Xiaochen1
 Zhao Xin
 Xie Haixiang
 Zhang Ningyu
- 1School of Electrical Engineering, Southeast University, Nanjing, China
- 2State Grid Jiangsu Electric Power Co., Ltd. Research Institute, Nanjing, China
To address the issue of curtailment in wind and photovoltaic power due to high penetration of distributed renewable energy sources in multi-partition distribution networks, and to enhance operational efficiency and voltage quality, a day-ahead and intra-day scheduling strategy based on Phase Shifting Transformer (PST) loop-closing device is proposed. The day-ahead scheduling model aims to maximize the benefits from loop-closing operations by incorporating errors from new energy and load forecasts. Robust optimization techniques are employed to solve this model, resulting in the determination of the optimal loop-closing line. For intra-day scheduling, the focus is on minimizing the weighted sum of curtailment rate, voltage deviation rate, and network loss, thereby optimizing reactive power distribution and ensuring full utilization of renewable energy. Second-order cone programming is applied to the objectives and constraints to ensure convergence and expedite the solution process. Simulation results on an improved IEEE 33 bus test system demonstrate that the proposed day-ahead and intra-day scheduling strategy effectively leverages the voltage regulation and power flow control capabilities of PST loop-closing devices. This approach not only ensures the safety of the distribution network but also facilitates cross-regional integration of distributed renewable energy, reduces operational costs, and enhances overall network performance.
1 Introduction
With the increasing penetration of distributed renewable energy sources into distribution networks, the temporal mismatch between their output and load demand has intensified, exacerbating the “duck curve” phenomenon (Yang, 2022). This leads to situations where periods of high renewable energy output can cause reverse flows of net load, potentially resulting in line overloads, voltage limit violations, and subsequent curtailment of solar and wind energy (Xu B. et al., 2023; Hu et al., 2020). Consequently, effectively managing the integration of high-penetration distributed renewable energy sources (DRES) through day-ahead and intra-day scheduling has become critical.
Current approaches to enhance the absorption of renewable energy in distribution networks include: utilizing market mechanisms to encourage proactive user responses to fluctuations in renewable energy output (Samadi et al., 2014), integrating energy storage systems and developing interactive strategies that encompass generation, network, load, and storage (Shen et al., 2015), and modifying line structures to resolve congestion (Li et al., 2018). Additionally, to address the uncertainty associated with distributed renewable energy sources, a day-ahead robust optimization model has been proposed to minimize operational costs (Li et al., 2024). Literature (Cong et al., 2019) proposes a two-stage coordinated control for distribution networks, optimizing network losses and absorption rates through network reconfiguration day-ahead and mitigating the impact of renewable energy randomness intra-day. Furthermore, the literature (Wang and Liu, 2022) incorporates the variability of electric vehicles, establishing a day-ahead and intra-day scheduling model that enhances renewable energy absorption while optimizing economic benefits for electric vehicle charging stations.
Previous studies predominantly address single distribution network partitions. However, actual distribution network is comprised of multiple partitions through interconnection lines. When one partition experiences curtailment of solar or wind power, resources from other partitions can be utilized, enabling cross-zone absorption of distributed new energy through loop-closing operation. Literatures (Gan et al., 2015; Wu et al., 2013) discuss the advantages of loop-closing operation, which allows unified management and scheduling of power resources across different partitions, thereby improving overall operational economy and reliability. Fault location and protection control within the context of loop-closing operation have been explored in the literature (Xue, 2020; Huang et al., 2019), ensuring that reliable performance of the whole distribution network is maintained.
Recent studies have explored loop-closing operations utilizing Soft Open Points (SOP). Curtailment penalties for wind and solar energy in day-ahead optimization objectives are introduced in the literature (Wang et al., 2024), with SOP being used to enhance active power transmission and reactive power compensation, thereby improving voltage distribution and facilitating distributed photovoltaic integration. Literature (Zheng and Shi, 2019) demonstrates that SOP-based loop-closing operation can rapidly respond to new energy fluctuations and achieve precise power flow control, effectively addressing low voltage issues under heavy loads and high voltage problems within renewable energy integration. Thus, closed loop operation for distributed new energy absorption shows feasibility and advantages; however, the high cost of numerous power electronic devices in SOP structures remains a challenge (Xu et al., 2024). Consequently, there is a need to investigate more cost-effective and technologically advanced loop-closing devices.
Phase Shifting Transformer (PST) loop-closing device can effectively compensate for the voltage phase angle difference across both sides of a line, reduce inrush currents during loop closing, and control line flow (Li et al., 2021; Xu et al., 2022). Literature (Yang et al., 2022) proposes an improved structure based on PST, highlighting its efficacy in addressing voltage imbalances across the line. Literature (Xu Z. et al., 2023) outlines the advantages of PST loop-closing device, noting its flexibility in controlling line flow, ease of operation and maintenance, and significant economic benefits. Hence, PST loop-closing device has promising application prospects, and optimizing its day-ahead and intra-day scheduling strategies can substantially enhance the integration of DRES (Li et al., 2024).
In summary, this paper proposes a day-ahead and intra-day optimization scheduling strategy for distribution network with high permeability new energy based on PST loop-closing device. Initially, a mathematical model is developed based on the structure of PST loop-closing device. Subsequently, a comprehensive optimization scheduling model is proposed: in the day-ahead stage, robust optimization is employed to determine loop-closing line and corresponding periods; while in the intra-day stage, loop-closing periods and PST settings are adjusted to optimize the reactive power distribution. The model is then relaxed to second-order cone programming to accelerate the solution process. Finally, the effectiveness of the proposed strategy is validated using an improved IEEE 33 bus distribution network.
2 Phase shifting transformer loop-closing device model
As shown in Figure 1A, the PST loop-closing device is installed on the interconnection line between different distribution network partitions and is controlled by switches. S and L denote the two ends of the PST. This device can be modeled as an equivalent impedance zpst in series with an ideal transformer with a complex ratio
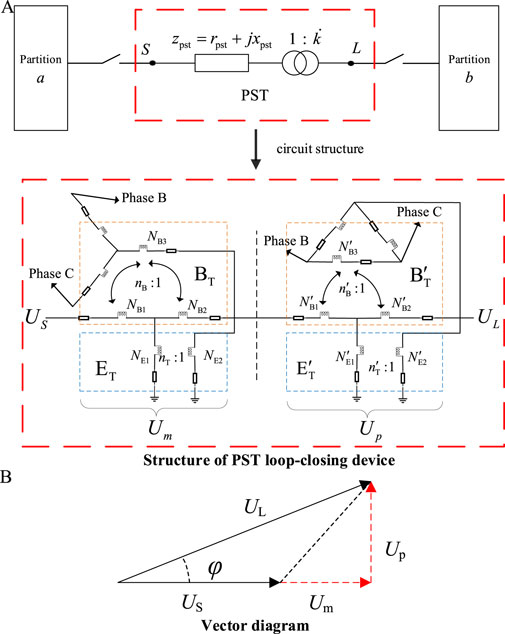
Figure 1. PST loop-closing device. (A) Structure. (B) Voltage vector.
Figure 1B illustrates the voltage vector relationship for the PST. US and UL denote the voltages at the start and end of the line, respectively, while UM and UP are used for magnitude and phase adjustment, respectively. From these relationships, the mathematical model can be derived as follows:
where
3 Day-ahead and intra-day optimization scheduling based on PST loop-closing devices
This dissertation examines distribution networks characterized by high penetration of renewable energy sources. Given that distribution networks are divided into multiple partitions, variations in renewable energy generation and load profiles across these regions are prevalent. Consequently, there may be instances where certain partitions experience surplus renewable energy generation, resulting in curtailment, while others with high demand could still accommodate additional renewable energy. In such scenarios, employing loop-closing operation in distribution network becomes a cost-effective scheduling strategy. Accordingly, this paper proposes a day-ahead and intra-day optimization scheduling strategy based on PST loop-closing devices to facilitate the cross-partition absorption of distributed renewable energy. The operational framework is illustrated in Figure 2.
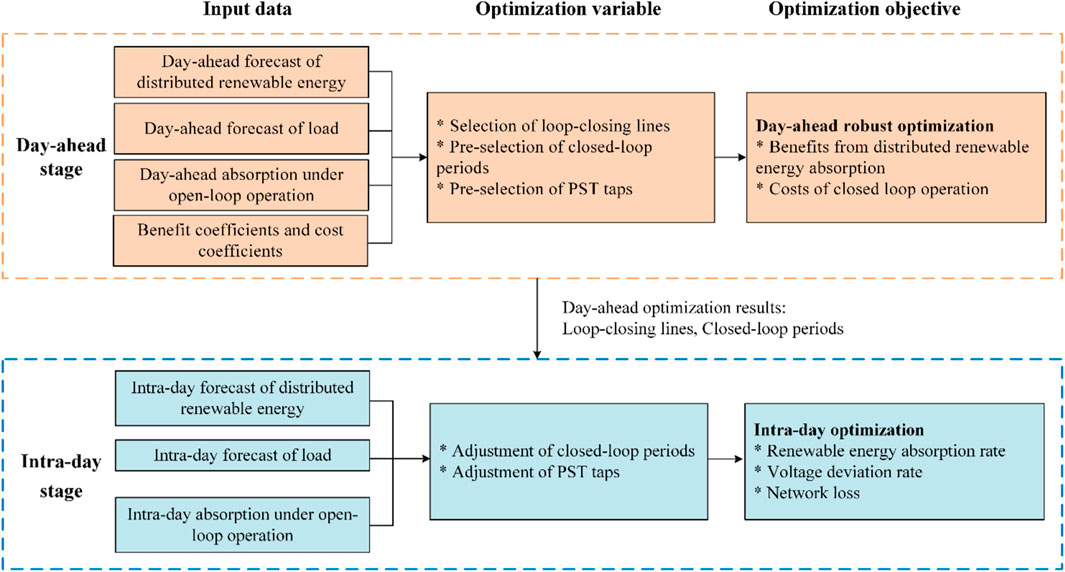
Figure 2. Framework of day-ahead and intra-day scheduling model.
In the day-ahead stage, closed loop lines are determined based on 24-h forecast results, with a focus on optimizing the economic efficiency from loop-closing operations while accounting for forecast errors. Corresponding closed-loop periods and PST settings are preliminarily selected. In the intra-day stage, the closed loop lines planned in the day-ahead stage are maintained. Rolling optimization is applied using updated forecast results to adjust the loop-closing time and PST settings, thereby optimizing the operational state of the distribution network while ensuring effective integration of renewable energy.
3.1 Day-ahead robust optimization model
3.1.1 Objective function
The day-ahead optimization is based on the 24-h forecast results with 1-h intervals, aiming to maximize the benefits from enhanced absorption and minimize the costs of closed loop operation of distribution networks. This process helps determine the lines that need to be interconnected and identifies the corresponding time periods, thereby providing a reference for intra-day optimization. The objective function is expressed as follows:
where
3.1.1.1 Benefits from renewable energy absorption
The increase in renewable energy absorption is quantified as the difference between the amount of renewable energy that can be absorbed under closed loop operation and in the initial open-loop state. The benefits from renewable energy absorption are derived from this increase.
where
3.1.1.2 Costs of closed loop operation
The costs of closed loop operation primarily include switch operation costs, phase shifter adjustment costs, and the operational loss costs of PST during closed-loop periods.
where
3.1.2 Constraint
3.1.2.1 Distflow power flow constraint
where
3.1.2.2 Safety constraints
The safety constraints primarily include voltage magnitude, branch current, renewable generation output and reverse power flow limits.
where
3.1.2.3 Loop-closing current constraint
where
3.1.2.4 PST settings constraint
where
3.1.2.5 Loop-closing operation frequency limit
where
3.1.3 Two-stage robust optimization model
Robust optimization addresses uncertainty factors by ensuring that the desired objective is achieved even under the worst-case scenarios within the uncertainty bounds. This paper employs a two-stage robust optimization approach that thoroughly considers uncertainties in renewable energy output and load forecasts.
The two-stage robust optimization model is formulated as follows:
where x and y represent the decision variables of the first stage and the second stage, respectively; c represents the parameters corresponding to the decision variable y; α represents the uncertainty variables; Ωα represents the set of uncertainty variables; F(x, α) represents the feasible region of the second-stage decision variable y given x and α; D, K, F, G and Ia are the constraint coefficient matrices; d and h are the constant vectors corresponding to the constraints.
For this paper, given the uncertainty in distributed renewable energy output and deviations in load forecast, the uncertainty set Ωα for wind and solar output, as well as load forecasts, is defined as follows:
where
The above model is structured into inner and outer layers. The outer layer addresses the first-stage problem, with the objective of maximizing the operational revenue from the distribution network closed loop operation. The first-stage decision variable x, encompasses the selection of the loop-closing lines and the PST taps. The inner min-max problem tackles the second-stage problem, aiming to identify the worst operational scenario. The second-stage decision variable y, primarily involves adjusting the settings of PST. The feasible region of y varies with different uncertain variables α and x.
To solve this two-stage robust optimization problem, it can be decomposed into a master problem and a sub-problem. By decomposing (Equation 15), the master problem is formulated as follows:
where l represents the current iteration number; k represents the total number of iterations;
Using strong duality theory, this sub-problem is transformed into a maximization model for solution. Dual variables are introduced for various constraints as follows:
Where λ, γ, ν and π are the dual variables corresponding to each constraint. Consequently, the sub-problem can be transformed into the following form:
Since the variables in the equation are bi-linear, the uncertainty variables, with their fluctuation ranges as given in (Equation 16), can also be expressed in the following form:
where αi denotes the ith uncertainty variable, αi,max and αi,min denote its upper and lower limits, respectively; πi represents the dual variable of αi, while ηi represents the auxiliary variable for αi. This dissertation aims to determine the optimal solution under the worst-case scenario, taking into account the uncertainties in renewable energy and load output. The worst-case scenario typically arises at the extreme values of these fluctuations. Thus, ηi is set to either 0 or 1. The big M method is employed, which can be linearized into the following expression:
where κi represents a continuous auxiliary variable for αi, and M is a large positive number.
3.1.4 Solution methodology
This dissertation employs the Columns and Constraints Generation (C&CG) algorithm for solving the problem. The core principle of C&CG involves alternately generating columns and constraints, iteratively solving both the main problem and its sub-problems to progressively enhance solution quality until the optimal solution is obtain or predetermined termination conditions are met (Zeng and Zhao, 2013). Given that the objective of the day-ahead optimization is a max function, the main problem in the C&CG algorithm determines the upper bound of the objective, while the sub-problem updates the lower bound. The primary steps of the solution process are as follows:
Step 1: Set the lower bound LB = −∞ and upper bound UB = +∞, initialize iteration count k = 1, randomly generate initial scenarios, and set convergence criterion ε.
Step 2: Solve the primary problem, determine decision variables xk and objective function value zk, and update the upper bound UB = min {UB, zk}.
Step 3: Substitute xk into the sub-problem, determine the worst-case scenario uk, decision variables yk, and their corresponding objective function value cTyk, and update the lower bound LB = max {LB, cTyk}.
Step 4: Evaluate the convergence criterion UB−LB≤ε. If satisfied, terminate the loop and output scheduling results, decision variables, and objectives; otherwise, proceed to the next step.
Step 5: Let k = k + 1, add cutting plane constraints z ≥ cTyk−1, return to step 2, and repeat this process until the convergence condition is met.
3.2 Intra-day optimization model
The intra-day optimization is performed based on more accurate ultra-short-term forecasts and involves rolling optimization. While maintaining the loop-closing line determined by the day-ahead optimization, the intra-day optimization adjusts the PST taps to meet the loop-closing inrush current constraints, ensure the absorption rate of distributed renewable energy, and optimize system network losses and voltage deviation. The objective function can be represented as:
Where Pqd represents the curtailment rate of distributed renewable energy; Ploss represents the network losses; Vpy represents the voltage deviation rate; PDG,t,sum represents the total output of distributed renewable energy sources at time t; PDG,i,t represents the absorbable amount of ith distributed renewable energy at time t; ri,t represents the resistance of the ith interconnection line at time t; Pi,t represents the active power of the ith interconnection line at time t; Qi,t represents the reactive power the ith interconnection line at time t; Vi,t represents the voltage of bus on the right side of the ith interconnection line at time t; VN represents the rated voltage; σ1, σ2 and σ3 represent weighting coefficients. In this dissertation, they are set to 0.4, 0.3, and 0.3 respectively. These coefficients can be adjusted according to specific requirements in practical applications.
The constraints for intraday optimization include (Equations 2–14). Additionally, there is the intra-day closed-loop period correction constraint:
Where
3.3 Second-order cone transformation of the model
The objective function and constraints in this paper involve numerous nonlinear models, which are non-convex and difficult to solve, often leading to local optima. This paper employs second-order cone optimization to reformulate these nonlinear models into linear equations, facilitating easier convergence of the objective function and accelerating the solution process while ensuring optimal results (Chowdhury et al., 2023; Liu et al., 2014). The revised model is equivalent to a mixed-integer linear programming problem, which can be directly solved using commercial solvers.
In the day-ahead optimization model, the objective function in Equation 1 is replaced with:
By substituting the quadratic terms in the objective function (Equation 17) by replacing
The constraints in Equations 2–5, 8, 9 are linearized by replacing
4 Case study
This paper adapts the IEEE 33 bus test system using data from a real distribution network, as shown in Figure 3. The network consists of three grid partitions (Bus 1-Bus 15, Bus 16-Bus 23, and Bus 24- Bus 33, designated as Partition 1–3, respectively). There are five interconnection lines between these partitions. Based on the characteristics of renewable energy and load, three of them include PST loop-closing devices, specifically Line 12–26, 15–19, and 23–33. Partition 1 and 2 are equipped with distributed photovoltaic generation, while Partition 3 contains one distributed PV and one dispersed wind turbine. The total penetration rate in the model reaches 97% based on installed capacity.
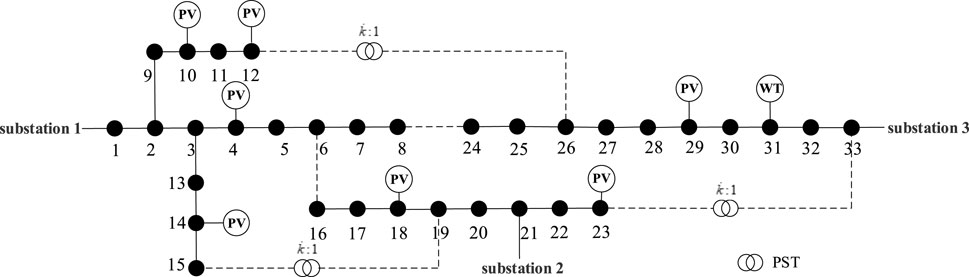
Figure 3. Improved IEEE 33 bus test system.
4.1 Analysis of day-ahead optimization result
To set up the day-ahead stage, the load forecast deviation to within ±5%. The following three scenarios are selected for verification:
Scenario 1: The proposed strategy is implemented, and the error between the day-ahead forecast and actual data for distributed renewable energy does not exceed 5%.
Scenario 2: The proposed strategy is implemented, and the error between the day-ahead forecast and actual data for distributed renewable energy does not exceed 10%.
Scenario 3: A deterministic method based on forecast data is applied, with the error between the day-ahead forecast and actual data for distributed renewable energy not exceeding 5%.
The day-ahead forecasts of renewable generation and load for each zone in Scenario 1 are shown in Figures 4–6. The different colored dashed lines represent the upper and lower limits of the fluctuation range for renewable energy and load. The load demand in each partition corresponds to the characteristics of the respective zone. It is evident that throughout the day, all three partitions experience renewable generation exceeding load. Notably, Partition 1 faces the most severe issue, with PV output exceeding load by 300% at 13:00. Further analysis reveals that since PV are primarily installed at the end of the feeders, accommodating all the renewable energy would lead to voltage violations at Bus 11 and 12. At the same time, the end nodes in Partition 3 have heavier loads and lower distributed renewable output, indicating some remaining absorption capacity. This analysis highlights that due to the uneven distribution of renewable energy and load across the network partitions, issues such as line current overloads, voltage violations, or curtailment of wind and solar energy may arise. Effective and reasonable loop-closing operation in the distribution network could potentially address these absorption challenges.
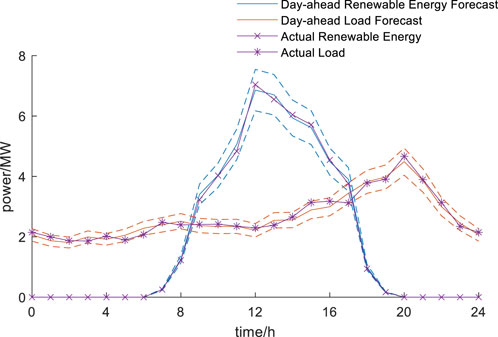
Figure 4. Forecast curve for Partition 1 in Scenario 1.
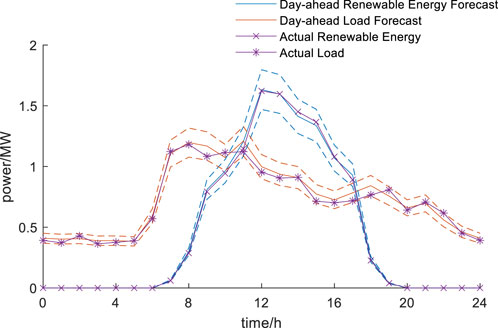
Figure 5. Forecast curve for Partition 2 in Scenario 1.
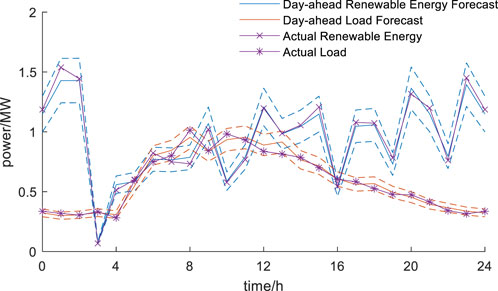
Figure 6. Forecast curve for Partition 3 in Scenario 1.
Given the varying renewable energy and load conditions across different periods, a day-ahead dispatch plan is formulated. The parameters for the day-ahead optimization refer to references (Li, 2019; Xiong et al., 2021), as shown in Table 1. The maximum reverse power flow for each partition is 6 MW. The time interval is set to 1 h. Each interconnection line can operate in a closed loop most once per day, with no limit on the duration of each loop-closing operation. The total number of loop-closing operations for all interconnection lines in a day is limited to a maximum of three. Within each time periods, the PST loop-closing device can be adjusted at most once. The optimization results using the proposed strategy are presented in in Table 2.

Table 1. Optimize parameter settings.

Table 2. Scenario 1 day-ahead optimization results.
According to the proposed method, line 12–26 is selected for closed loop operation between 11:00 and 15:00, while the connection of line 15–19 is selected for the period from 15:00 to 16:00. Overall, the approach achieves 100% utilization of distributed renewable energy output within a day. This outcome is attributed to the fact that the total benefits from interconnection lines are closely related to the increased renewable energy utilization. In contrast, the closed-loop operation costs remain relatively fixed. This is because the switching operation and phase shifter adjustment costs are generally fixed, while the operational loss costs of PST loop-closing device is primarily influenced by the interconnection line current. Since loop-closing current constraint is considered, the PST loop-closing device helps reduce this current. Moreover, by adequately accounting for the variability of wind and solar resources and load forecasting errors, the method ensures that the total revenue reaches 2,613.65 yuan even under the most adverse conditions.
The forecasts of renewable generation and load of Scenario 2 are illustrated in Figures 7–9. In this scene, a larger forecast error is observed for distributed renewable energy. Utilizing the two-stage robust optimization method outlined in this chapter, with parameters identical to those used in Scenario 2, the results are presented in Table 3.
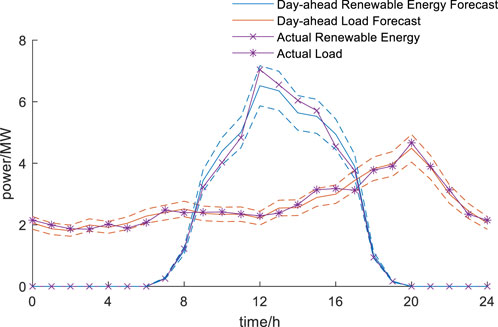
Figure 7. Forecast curve for Partition 1 in Scenario 2.
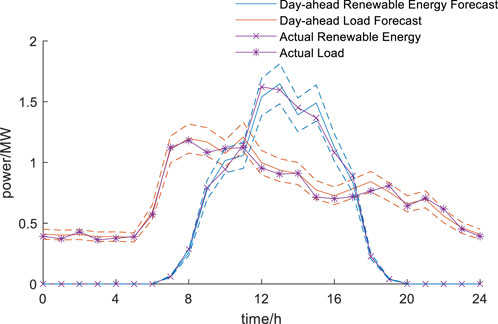
Figure 8. Forecast curve for Partition 2 in Scenario 2.
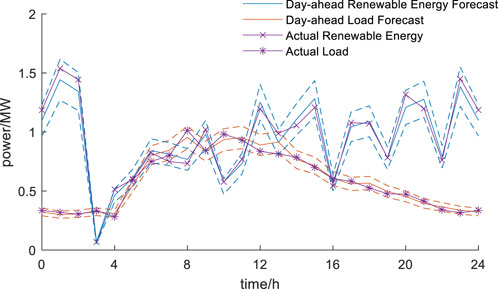
Figure 9. Forecast curve for Partition 3 in Scenario 2.

Table 3. Scenario 2 day-ahead optimization results.
After optimization in Scenario 2, distributed renewable energy can be fully accommodated. The optimized periods and lines for closed loop operation are identical to those in Scenario 1. However, the settings of PST differ from Scenario 1. Under Scenario 2 optimization, a profit of 2,326.29 yuan is achievable even under the worst-case scenario of fluctuating distributed renewable energy and loads. The profit during 11:00–15:00 is reduced compared to Scenario 1, due to Scenario 2’s prediction of less distributed renewable energy that the open-loop network cannot accommodate. Conversely, the profit during 15:00–16:00 increases compared to Scenario 1, as Scenario 2 predicts more distributed renewable energy that the open-loop network cannot accommodate. Overall, the total profit under robust optimization in Scenario 2 decreases by 287.36 yuan compared to Scenario 1.
Comparison between Scenario 2 and Scenario 1 indicates that the strategies proposed in this chapter demonstrate robust performance across varying prediction error ranges. The loop-closing lines and periods established in Scenario 1 are equally applicable in Scenario 2, with difference only in the taps of PST. This underscores the effectiveness and feasibility of the day-ahead optimization model developed.
In Scenario 3, by disregarding uncertainties and employing the optimization objectives and deterministic constraints as proposed in this paper based on forecast data, the day-ahead loop-closing scheduling is formulated. The distributed renewable energy and load data for each partition are based on the day-ahead forecast data from Scenario 1. The optimization results are detailed in Table 4.

Table 4. Scenario 3 day-ahead optimization results.
According to the results in Table 3, utilizing forecast-based methods allows for loop-closing operation for line 12–26 during 11:00–16:00, achieving a total profit of 3,187.16 yuan. This profit is influenced by specific forecast scenarios. However, due to prediction errors, there are instances where the loop-closing operation of line 12–26 during 15:00–16:00 may fail to meet 100% integration requirements.
Additionally, from a strategic perspective, the day-ahead scheduling determines the specific closed loop periods and lines for the entire day, emphasizing a comprehensive and robust planning approach. In contrast, intra-day scheduling prioritizes precision in control. Consequently, the results obtained from the two-stage robust optimization method are better suited to the day-ahead optimization context, ensuring compliance within the bounds of prediction errors.
4.2 Analysis of intra-day optimization result
During the intra-day stage, optimization is conducted using more precise ultra-short-term load forecasts, without modifying the loop-closing lines determined in the day-ahead plan. To accommodate the integration of new energy and account for potential abnormal fluctuations in renewable generation, the timing of loop-closing is permitted to be adjusted by up to 1 h. In this study, the error between intra-day forecasts and actual data is kept within 3%, with no observed abnormal fluctuations in the intra-day forecasting results. The intra-day renewable energy and load forecast curves for each partition are shown in Figures 10–12.
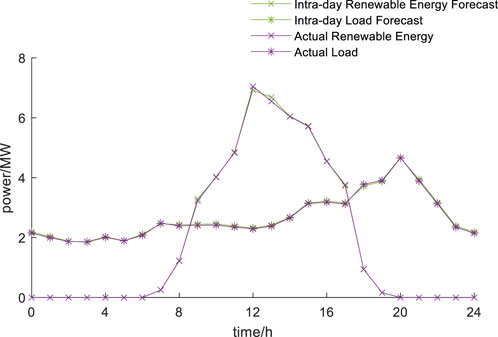
Figure 10. Forecast curve for Partition 1.

Figure 11. Forecast curve for Partition 2.

Figure 12. Forecast curve for Partition 3.
During the intra-day stage, closed loop operation are scheduled at 11:00 and 15:00, with pre-determined settings for PST. At 11:00, the PST taps are [5,11], resulting in a loop-closing transient current of 31.76 A. At 15:00, the PST settings are [−7,4], yielding a loop-closing transient current of 25.14 A. These settings are designed to minimize the loop-closing transient currents. The results obtained from applying the intra-day optimization strategy proposed in this chapter are summarized in Table 5.

Table 5. Intra-day optimization results.
The intra-day optimization results maintain the closed loop lines and periods determined in the day-ahead plan. Under the intra-day plan, the renewable energy integration rate also reaches 100%. Compared to the day-ahead plan, adjustments to the settings of PST are made due to reactive power optimization, ensuring optimal network performance during each time period. Figures 13, 14 illustrate the voltage deviation rate and network losses, respectively, for the day-ahead strategies of Scenario 1 and 2 and intra-day scheduling plan, based on the intra-day forecast data.

Figure 13. Voltage deviation rate under different scheduling strategies.
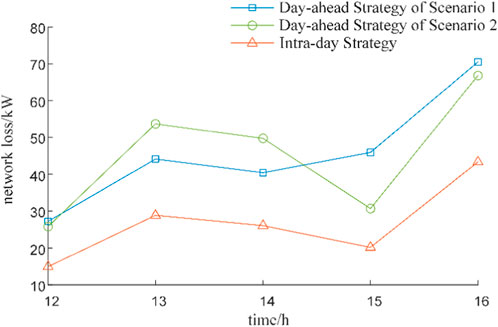
Figure 14. Network loss under different scheduling strategies.
From the figures, it is evident that with more accurate intra-day forecasts, the intra-day loop-closing scheduling plan achieves reduction in both voltage deviation and network losses compared to the day-ahead plan. The settings of PST provided under different day-ahead forecast accuracies result in varying voltage deviations and network losses when applied to intra-day forecast data. However, with the unified adjustments made through intra-day optimization, the network can achieve optimal operating conditions. Therefore, the intra-day optimization strategy enhances the accuracy of PST settings, effectively mitigating the impact of day-ahead forecast errors. By maintaining the closed-loop lines constant, this approach ensures complete integration of distributed renewable energy, reduces overall voltage deviation and network losses, and improves voltage and power flow distribution.
4.3 Analysis of the effects of different loop-closing scheduling plan
To assess the effectiveness of various loop-closing scheduling plans under actual distributed renewable generation and load, three cases are set up:
Case 1: Implementation of the day-ahead scheduling plan based on forecast data.
Case 2: Application of the day-ahead scheduling plan derived from the two-stage robust optimization in Scenario 1.
Case 3: Utilization of the intra-day scheduling plan obtained through rolling optimization.
Based on the scheduling plans of these cases, the actual data was used for validation. The results are presented in Table 6.
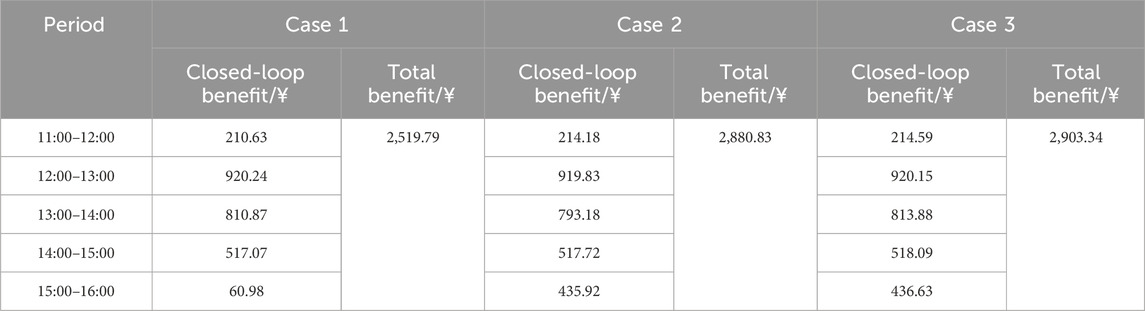
Table 6. Optimization results for different cases.
In Case 1, line 12–26 remain in loop-closing operation from 15:00 to 16:00. However, under actual conditions, the renewable generation in Partition 3 during this period exceeds the day-ahead forecast, while the load is slightly reduced. This results in increased voltage near the interconnection line in Partition 3, thereby limiting the amount of renewable energy that can be accommodated. Consequently, the profit from loop-closing operation decreases significantly, with a reduction of 667.37 yuan compared to the projected total profit under the day-ahead forecast, as shown in Table 2. This demonstrates that the method used in Case 1 has notable limitations and not applicable under actual conditions.
A comparison between Case 2 and Case 1 indicates that the results from robust optimization in the day-ahead stage are more generalizable, achieving at least the expected profit within the forecast error range. The total profit of Case 3 is comparable to that of Case 2; however Case 3 features more precise adjustments of PST settings, leading to reduced operational loss costs and avoiding the expense of an additional adjustment. As a result, the total profit of Case 3 is higher. Additionally, Case 3 achieves a lower overall voltage deviation and network losses compared to Case 2, as depicted in Figures 15, 16, which aligns closely with the results under intraday forecasts. This demonstrates the comprehensiveness and effectiveness of the strategy proposed in this paper.
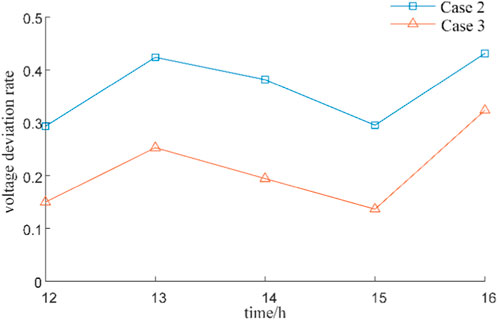
Figure 15. Voltage deviation rate under different cases.
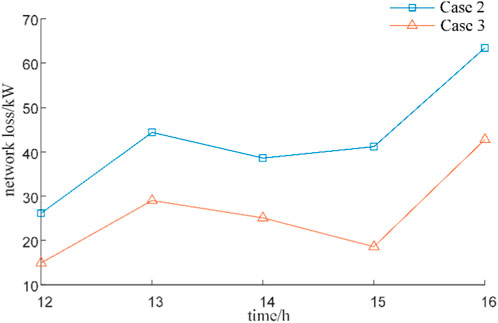
Figure 16. Network loss under different cases.
5 Additional requirements
This dissertation addresses the challenge of curtailing wind and solar energy in distribution network with high penetration of distributed renewable energy. It proposes a day-ahead and intra-day scheduling strategy utilizing PST loop-closing devices to achieve cross-partition renewable energy integration within the distribution network. This strategy employs robust optimization during the day-ahead stage to account for the randomness of renewable energy and load, selecting the loop-closing lines to ensure operational safety while developing an economically optimal day-ahead plan. During the intra-day stage, optimization is performed based on more accurate forecasts, adjusting closed-loop periods and PST settings to optimize voltage and power flow in the distribution network without altering the selected loop-closing lines.
The results demonstrate that the proposed day-ahead and intra-day scheduling strategy using PST loop-closing device significantly enhances the safe and economical operation of the distribution network. First, when certain partitions experience curtailment of wind and solar energy, the PST loop-closing device facilitates cross-partition integration, thereby improving the overall utilization rate and operational economy of the distribution network. Secondly, the power flow control capabilities of the PST effectively reduce voltage deviation and network losses, optimizing the operation state of the distribution network. Additionally, PST can reduce loop-closing currents, ensuring the safety of loop-closing operations. In summary, the strategy proposed in this dissertation shows promising prospects for addressing the integration challenges of high-penetration renewable energy in future distribution network.
Data availability statement
The raw data supporting the conclusions of this article will be made available by the authors, without undue reservation.
Author contributions
GX: Conceptualization, Data curation, Formal Analysis, Methodology, Writing–original draft, Writing–review and editing. XH: Conceptualization, Data curation, Investigation, Software, Supervision, Writing–original draft. ZX: Conceptualization, Methodology, Validation, Visualization, Writing–review and editing. GS: Conceptualization, Formal Analysis, Funding acquisition, Investigation, Writing–review and editing. XH: Conceptualization, Writing–review and editing. ZN: Investigation, Writing–review and editing. LQ: Software, Writing–review and editing. YY: Software, Writing–review and editing.
Funding
The author(s) declare that financial support was received for the research, authorship, and/or publication of this article. This work was supported by Technology Projects of State Grid Corporation of China (5500-202318115A-1-1-ZN).
Conflict of interest
Authors ZN and LQ were employed by State Grid Jiangsu Electric Power Co., Ltd. Research Institute.
The remaining authors declare that the research was conducted in the absence of any commercial or financial relationships that could be construed as a potential conflict of interest.
The authors declare that this study received funding from State Grid Corporation of China. The funder had the following involvement in the study: interpretation of data.
Generative AI statement
The author(s) declare that no Generative AI was used in the creation of this manuscript.
Publisher’s note
All claims expressed in this article are solely those of the authors and do not necessarily represent those of their affiliated organizations, or those of the publisher, the editors and the reviewers. Any product that may be evaluated in this article, or claim that may be made by its manufacturer, is not guaranteed or endorsed by the publisher.
References
Chowdhury, M.M.-U.-T., Biswas, B. D., and Kamalasadan, S. (2023). Second-order cone programming (SOCP) model for three phase optimal power flow (OPF) in active distribution networks. IEEE Trans. Smart Grid 14 (5), 3732–3743. doi:10.1109/TSG.2023.3241216
Cong, P., Tang, W., Lou, C., Zhang, B., and Zhang, L. (2019). Two-stage coordination optimization control of soft open point and tie switch in active distribution network with high penetration renewable energy generation. Trans. China Electrotech. Soc. 34 (06), 1263–1272. doi:10.19595/j.cnki.1000-6753.tces.180324
Gan, G., Wang, Z., Zhou, Y., Li, L., and Li, X. (2015). Reliability and economy based closed-loop operation modes for medium voltage distribution networks. Automation Electr. Power Syst. 39 (16), 144–150. doi:10.7500/AEPS20140901004
Hu, X., Liu, Z., Wen, G., Yu, X., and Liu, C. (2020). Voltage control for distribution networks via coordinated regulation of active and reactive power of DGs. IEEE Trans. Smart Grid 11 (5), 4017–4031. doi:10.1109/TSG.2020.2989828
Huang, Y., Cai, Z., Pan, T., and Chen, J. (2019). Research on wide area protection and control scheme for closed-loop distribution network. J. Electr. Power Sci. Technol. 34 (02), 47–52. doi:10.3969/j.issn.1673-9140.2019.02.007
Li, H., Gao, Y., Zhang, X., Lin, D., Qiang, W., and Sun, W. (2018). Promotion strategy of photovoltaic accommodation ability for regional power grid. Electr. Power Autom. Equip. 38, 114–120. doi:10.16081/j.issn.1006-6047.2018.07.015
Li, J. (2019). Robust optimal dispatching of the active distribution network with renewable energy. Beijing: North China Electric Power University. [dissertation thesis].
Li, Q., Zhang, N., Gao, S., Liu, J., and Zhou, Q. (2021). Modeling and application scenario analysis of power phase shift transformer based on RTDS. Electr. Power Eng. Technol. 40 (02), 53–58. doi:10.12158/j.2096-3203.2021.02.008
Li, Q., Zhang, N., Gao, X., Zhao, X., and Gao, S. (2024). Bi-level optimization of distribution network reconfiguration based on new-type phase shifting transformer. Power Demand Side Manag. 26 (02), 14–19. doi:10.15913/j.cnki.kjycx.2024.02.006
Li, Y., Ling, F., Qiao, X., Zhong, J., and Cao, Y. (2024). Day-ahead and intra-day optimization of flexible interconnected distribution system with self-energy storage based on the grid-side resource coordination. Trans. China Electrotech. Soc., 1–17. doi:10.19595/j.cnki.1000-6753.tces.221929
Liu, Y., Wu, W., Zhang, B., and Li, Z. (2014). A mixed integer second-order cone programming based active and reactive power coordinated multi-period optimization for active distribution network. Proc. CSEE 34, 2575–2583. doi:10.13334/j.0258-8013.pcsee.2014.16.007
Samadi, P., Mohsenian-Rad, H., Wong, V. W. S., and Schober, R. (2014). Real-time pricing for demand response based on stochastic approximation. IEEE Trans. Smart Grid 5 (2), 789–798. doi:10.1109/TSG.2013.2293131
Shen, X., Zhu, S., and Zheng, J. (2015). Active distribution network planning-operation co-optimization considering the coordination of ESS and DG. Power Syst. Technol. 39 (07), 1913. doi:10.13335/j/1000-3673.pst.2015.07.023
Wang, C., Fang, R., Lei, H., Sun, J., and Zha, X. (2024). Day-ahead and intraday coordinated economy schedule method based on the optimal operation region in the active distribution network. Power Syst. Technol., 1–16. doi:10.13335/j.1000-3673.pst.2023.0537
Wang, Y., and Liu, X. (2022). Day-ahead and intra-day two-stage optimal control of photovoltaic-energy storage charging station based on GRU-MPC. Electr. Power Autom. Equip. 42 (10), 177–183. doi:10.16081/j.epae.202208036
Wu, Z., Peng, X., Shen, Y., Xu, L., Wu, J., Lin, C., et al. (2013). Study on a loop power supply model and its loop-close operation mode for distribution network. Proc. CSEE 33 (10), 57–63. doi:10.13334/j.0258-8013.pcsee.2013.10.008
Xiong, Z., Chen, T., Du, L., Dai, Z., Chen, J., and Xu, L. (2021). Optimal allocation of soft open point in active distribution network based on improved sensitivity analysis. Automation Electr. Power Syst. 45 (08), 129–137. doi:10.7500/AEPS20191021004
Xu, B., Zhao, J., Zhang, P., Fan, S., and He, G. (2023). High-proportion renewable energy accommodation method based on customer directrix load and nash bargaining. Automation Electr. Power Syst. 47 (15), 36–45. doi:10.7500/AEPS20221130016
Xu, L., Zhang, S., Ye, L., Cao, Y., and Cheng, H. (2024). Joint planning of source-network-load-storage in distribution network considering dynamic reconfiguration and intelligent soft open point. South. Power Syst. Technol., 1–11. doi:10.13648/j.cnki.issn1674-0629.2024.04.014
Xu, Z., Liu, J., Jiang, Y., Xi, X., and Yang, S. (2023). Loop closing control device and control method of 10 kV distribution network based on phase shifting transformer and voltage regulating transformer. South. Power Syst. Technol. 17 (03), 85–96. doi:10.13648/j.cnki.issn1674-0629.2023.03.010
Xu, Z., Tang, J., Jiang, Y., Qin, R., Ma, H., Yang, Y., et al. (2022). Analysis of fault characteristics of distribution network with PST loop closing device under small current grounding system. Energies 15, 2307. doi:10.3390/en15072307
Xue, R. (2020). Location method for single phase-to-ground fault in closed-loop medium voltage distribution network. Beijing: North China Electric Power University. [dissertation thesis].
Yang, L. (2022). DC transformation of contact line and operation strategy in high permeability photovoltaic distribution network. Jiangsu: Southeast University. [dissertation thesis].
Yang, Y., Tang, J., Niu, C., Xu, Z., and Zhao, C. (2022). Coupling characteristic and control strategy for loop closing device based on improved phase shifting transformer under three-phase asymmetry condition. Automation Electr. Power Syst. 46 (14), 158–168. doi:10.7500/AEPS20211216006
Zeng, B., and Zhao, L. (2013). Solving two-stage robust optimization problems using a column-and-constraint generation method. Operations Res. Lett. 41 (5), 457–461. doi:10.1016/j.orl.2013.05.003
Keywords: distributed new energy, high permeability, phase shifting transformer loop-closing device, distribution network, day-ahead and intra-day optimization, loop-closing operation
Citation: Xiaochen G, Haoran X, Xin Z, Shan G, Haixiang X, Ningyu Z, Qun L and Yue Y (2025) Dispatching of distribution networks with high permeability distributed new energy based on phase shifting transformer loop-closing device. Front. Energy Res. 13:1516459. doi: 10.3389/fenrg.2025.1516459
Received: 24 October 2024; Accepted: 15 January 2025;
Published: 14 February 2025.
Edited by:
Can Huang, Pacific Gas and Electric Company, United StatesReviewed by:
Siqi Bu, Hong Kong Polytechnic University, Hong Kong SAR, ChinaLu Zhang, China Agricultural University, China
Hantao Cui, North Carolina State University, United States
Copyright © 2025 Xiaochen, Haoran, Xin, Shan, Haixiang, Ningyu, Qun and Yue. This is an open-access article distributed under the terms of the Creative Commons Attribution License (CC BY). The use, distribution or reproduction in other forums is permitted, provided the original author(s) and the copyright owner(s) are credited and that the original publication in this journal is cited, in accordance with accepted academic practice. No use, distribution or reproduction is permitted which does not comply with these terms.
*Correspondence: Zhao Xin, eGluemhhb0BzZXUuZWR1LmNu