 J. A. Ademilola
 Jack C. Pashin
94% of researchers rate our articles as excellent or good
Learn more about the work of our research integrity team to safeguard the quality of each article we publish.
Find out more
ORIGINAL RESEARCH article
Front. Energy Res., 25 February 2025
Sec. Carbon Capture, Utilization and Storage
Volume 13 - 2025 | https://doi.org/10.3389/fenrg.2025.1513164
This article is part of the Research TopicRisks and Opportunities in Carbon Capture and StorageView all 4 articles
Opportunities for offshore geologic carbon dioxide (CO2) storage are promising, and assessment of subsurface stress is critical for minimizing the risk of CO2 leakage. This research aims to assess stress and temperature conditions to determine if the area has the ability for secure long-term storage. This objective was achieved by using a suite of geophysical well logs, four-arm caliper logs, geochemical data and data from the BOEM Sands Database for geomechanical stress fields assessment, borehole breakout analysis, and to build 3D simulations of reservoir pressure and fracture pressure in seven protraction areas of the Central Gulf of Mexico. Results of the geomechanical assessment demonstrate that well segments containing a high volume of breakouts will have low CO2 storage potential because pore pressure approaches the minimum horizontal stress. The reservoir temperature gradient in the continental slope reduces substantially beyond a depth of about ∼3,048 m (∼10,000 ft). The changing geothermal gradient appears to stem from a combination of cooling of shallow strata by the thermal mass of the water column above the mudline and conductive and advective heat flow associated with basal heat flow and active hydrocarbon generation and migration at depth. 3D models of stress reveal shelf sands ∼1,600 m (5,249 ft) below the seabed are in a safe CO2 storage window. Results indicate CO2 can be injected safely at a pressure below the minimum horizontal stress to minimize the risk of cross-formational flow, and the high porosity and permeability of sand units in this region can facilitate effective long-term storage of CO2 in mature hydrocarbon reservoirs and saline formations.
One of the issues with offshore storage for CO2-enhanced oil recovery and storage in saline formations is the potential migration of injected CO2 out of the storage complex. An important way to mitigate this risk is to assess the integrity of subsurface strata. Indeed, it is necessary to assess the migration risks associated with storing carbon in the subsurface to gain site approval and public acceptance (Busch, 2015; Pruess, 2008). The subsurface rock geomechanical properties and state of stress can be known by developing and analyzing a geomechanical model (Rahman et al., 2022). Hence, a geomechanical assessment is necessary in a proposed site for CO2 storage because the injection of CO2 into depleted reservoirs can change the subsurface state of stress (Rahman et al., 2022).
Pore pressure increases when CO2 is injected into the subsurface, and this affects the stress field (Rahman et al., 2022). The effective vertical stress can cause grain reorientation, sliding, and frictional slip, which deforms subsurface rocks (Rahman et al., 2022). This induced subsurface stress can result in the deformation of reservoir strata and adjacent layers (Rahman et al., 2022), thereby promoting possible migration of injectate out of zone.
Interpolation of spatial data includes deterministic and probabilistic techniques. Deterministic approaches, such as inverse distance interpolation, utilize functions based on the distance between observation and target points. Probabilistic approaches are based on statistical theory. These methods measure the probability and uncertainty associated with interpolated data (Krivoruchko, 2012). In this study, empirical Bayesian kriging, which is a probabilistic statistical approach was used to build a 3-dimensional simulation of reservoir pressure and fracture pressure in mature hydrocarbon sands in order to estimate these properties away from well locations in the study area.
This research is part of the SECARB Offshore Partnership program, which is sponsored by the National Energy Technology Laboratory of the U.S. Department of Energy through the Southern States Energy Board (prime contract DE-FE0031557) and is advancing innovative concepts on offshore geologic storage. The key objective of the SECARB Offshore Partnership is to evaluate the potential for secure, long-term CO2 storage in the Central Gulf of Mexico (Figure 1).
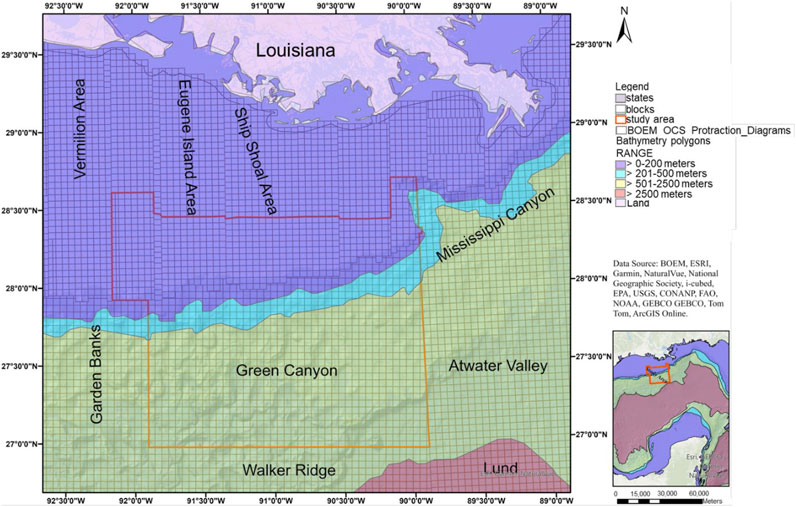
Figure 1. Central Gulf of Mexico Bathymetry map. The red outline shows the study area.
The study area is in the Ewing Bank, Green Canyon and the south extensions of the Eugene Island, South Marsh, South Timbalier, Grand Island, and Ship Shoal protraction areas in the outer continental shelf and the upper continental slope offshore of Louisiana (Figure 1). This study builds a three-dimensional model of the stress field to understand the potential for carbon storage in Miocene–Pleistocene strata which has not been performed in the study area. Researchers have performed stress field evaluation in a few part and Cretaceous strata east of the study area of this research (Finkbeiner et al., 1996; Keaney et al., 2010; King et al., 2012; Meng et al., 2018; Moore et al., 2009; Yassir and Zerwer, 1997; Zerwer and Yassir, 1994; Zoback and Peska, 1995), and additional work needs to be performed to apply the knowledge of the reservoir stress field to Cenozoic strata in the Central Gulf of Mexico using a more sophisticated and novel geostatistical approach for assessing carbon storage potential in the study area. CO2 storage opportunities exist in Miocene–Pleistocene reservoirs, which are becoming increasingly mature. Hence, there is a need to assess reservoir pressure and stress in the study area to evaluate and understand carbon storage potential in continental shelf and upper continental slope reservoirs. Despite the enormous opportunities provided by offshore strata for CO2-enhanced oil recovery (EOR), elevated reservoir pressure and in situ stress can potentially affect reservoir integrity, leading to the migration of CO2 beyond the limits of a defined storage complex. Hence, this research applies integrated geomechanical and geostatistical analysis by evaluating reservoir pressure and stress and by building a 3D model of reservoir pressure and fracture pressure in mature hydrocarbon sands in the study area to determine the integrity of the subsurface strata and the potential for CO2 storage in the seven protraction areas considered in this study.
Mesozoic–Cenozoic rifting, back-arc spreading, and passive margin formation began in the Gulf of Mexico during the Triassic, and sedimentation and basin formation are ongoing processes (Galloway, 2008; Jacques and Clegg, 2002; Sawyer et al., 1991; Snedden and Galloway, 2019). Counterclockwise rotation and hyperextension of the crust resulted in the modern Gulf of Mexico Basin (Pindell and Kennan, 2001; 2009; Sandwell et al., 2014). The nature and distribution of the underlying basement reveals the origin of the basin (Galloway, 2008). Thick transitional crust, which lies at a subsea depth of 2–12 km underlies the continental shelf and slope (Sawyer et al., 1991). Deep seismic profiles (Peel et al., 1995) reveal basement below the proximal sedimentary cover that locally exceeds 20 km in thickness (Galloway, 2008). Transitional crust with a thickness of about 10–16 km underlies most of the continental slope (Galloway, 2008).
Extensive salt tectonics related to buoyant and ductile deformation of Jurassic Salt make the Central Gulf of Mexico Basin structurally complex (Buffler, 1991). A 15,000–50,000 ft thick Mesozoic–Cenozoic sedimentary fill which comprises allochthonous salt systems, extensional faults, and contractional faults defines the geology of the study area (Rowan et al., 1999). Gravitational spreading and basinward displacement of buoyant Louann Salt by sediment loading are the key processes that made the structural framework of the Central Gulf, resulting in a complex array of extensional faults, associated with parautochtonous and allochthonous salt bodies that include a spectrum of diapiric structures and allochthonous salt sheets (Galloway, 2008; Jackson and Hudec, 2017; Lehner, 1969).
Four-arm caliper logs from seven near vertical wells with less than 10° deviation were used to assess the orientation of maximum horizontal stress (SHmax) in the study area. Suites of geophysical well logs and databases from the Bureau of Ocean Energy Management (BOEM) and Enverus were used for the estimation of the magnitude of principal stress and pore pressure. Geospatial and geostatistical analyses were carried out using data from the 2019 BOEM Sand Atlas (BOEM, 2019) to evaluate the potential of mature oil and gas fields for CO2 storage. Lastly, geochemical data from the U.S. Geological Survey (USGS) were used to evaluate the ionic concentration of total dissolved solids in formation water to estimate fluid density as well as the hydrostatic pressure change with depth.
The normal hydrostatic pressure for subsurface brine having 100,000 mg/L total dissolved solids (TDS) is ∼0.011 MPa/m (0.465 psi/ft), and normal hydrostatic pressure is a function of brine density, which is controlled by total dissolved solids (Meng et al., 2018). To estimate change in the hydrostatic pressure gradient with depth, geochemical data of Miocene-Pleistocene strata were obtained from the USGS geochemical database for produced water (Blondes et al., 2018). The data from the study area were assessed and extracted for analysis. Total dissolved solids data were extracted from the geochemical database to estimate the hydrostatic pressure. The concentrations of ions in the formation water of Miocene–Pleistocene sands were plotted using Excel to assess the impact of various ionic concentrations of the sediment and formation water on brine density and hydrostatic pore pressure. Original reservoir pressure is included for each sand in the BOEM Sands Atlas, and these data were used to determine the degree of overpressuring and to understand pressure-depth relationships.
Borehole breakout analysis was performed using four-arm caliper logs. The quality of the breakouts was ranked using the scheme of (Sperner et al., 2003). The vector mean azimuth of the breakouts was estimated using the statistical methods given in (Reinecker et al., 2003) as expressed in Equations 1, 2. The mean breakout azimuth (θm) was estimated by transforming the angles to 0–360° interval (Mardia 1972) that is,
where
A 1D mechanical model was generated by loading well log data into TechLog 2019 and DUG Insight 5.1 software, and the following parameters were estimated:
The vertical stress (Equation 3) was estimated by using the extrapolation method to estimate overburden stress in TechLog 2019.1 software and taking into consideration the stress of the seawater column on reservoir pressure such that
where
Minimum horizontal stress was estimated using the equation of (Eaton, 1969) (Equation 4), which has been applied successfully in the eastern Gulf of Mexico (Meng et al., 2018),
where
The coefficient of earth stress (Equation 5) was measured from Poisson’s ratio (Molaghab et al., 2017),
where
Poisson’s ratio was determined from sonic logs using Equation 6.
where
Fracture gradient (Equation 7) was estimated using the Matthews and Kelly (1967) equation.
where
Some of the wells, such as well EW-877, have pore pressure data available from the BOEM data center. However, in wells that do not have these data, pore pressure (Equation 8) was evaluated using the equation for pore pressure prediction (Eaton, 1975).
Where
The predicted pore pressure was calibrated by the reservoir pressure of sands in the BOEM Sands Atlas database.
In addition, the true vertical depth subsea depth (TVDSS), true vertical subseabed depth, sand pressure gradient and sand temperature gradient data in the 2019 BOEM sand dataset were used to determine the pressure-temperature-depth relationships in the study area. This was done in order to assess the implication of the subsurface stress state for carbon storage as well as to evaluate the differences in shelf and slope pressure gradient and temperature behavior.
The Empirical Bayesian kriging (EBK) method was used to create a 3D model of pressure and fracture pressure in order to determine how these properties vary with depth and away from well location in the Outer shelf and Upper continental slope of the study area.
This statistical approach differs from standard kriging techniques in that it accounts for errors introduced by constructing a semivariogram model. This involves estimating and employing many semivariogram models instead of a single one (Krivoruchko, 2012). This method includes the following procedures:
1. A semivariogram model was calculated from the data.
2. This semivariogram simulates fresh values at each input data point.
3. A new semivariogram model was determined using Baye’s rule, indicating the likelihood of generating observed data from it.
With step two and three repeated, the semivariogram computed in the first step was applied to simulate values at input points with each iteration. Simulated data were then utilized to determine and weight a new semivariogram model. Weights are applied to unsample areas to facilitate prediction and estimate standard error. This method generates a variety of semivariograms. Each semivariogram generated is an approximation of a real semivariogram that may produce the observed process (Krivoruchko, 2012).
The 3D simulations of reservoir pressure and fracture pressure were validated for performance and accuracy using the cross-validation technique. This is a leave-one-out validation method in which each predicted data at a point is pulled-out temporarily and re-evaluated from the other data. The data point extracted is then restored after prediction, and this process is repeated for the other data points in the dataset (Aelion et al., 2009; Li et al., 2020; 2022). The cross-validation statistics (Equations 9–12) used are mean error (ME), root mean square error (RMSE), mean standardized error (MSE) and the root mean square standardized error (RMSSE) equations as defined in (Aelion et al., 2009; Krivoruchko and Gribov, 2019; Li et al., 2020; Li et al., 2022):
where
A low value of RMSE indicates an accurate model prediction. To avoid over- and under-estimation from EBK models, the ME and MSE should be close to zero. In addition, the RMSSE should be as close to 1 as possible for better model performance (Krivoruchko and Gribov, 2019).
The relationships among the concentration of major ionic compounds that constitute total dissolved solids, such as calcium (Ca2+), potassium (K+), magnesium (Mg2+), chloride (Cl−), sulphate (SO42-), sodium (Na+), and bicarbonate (HCO3−) are assessed, and the concentration of these compounds determines brine density and thus the hydrostatic component of reservoir pressure. Sodium and chloride are the two most abundant ionic compounds and thus the principal determinants of brine chemistry (Figure 2). The TDS concentration ranges from 35,060 to 354,769 mg/L. Offshore TDS concentration is expected to have a minimum value equivalent to sea water, which is about 35,000 mg/L. In the study area the hydrostatic pore pressure increases as brine density increases from ∼0.01 MPa/m (0.44 psi/ft) to ∼0.012 MPa/m (0.54 psi/ft), which provides a baseline for hydrostatic pore pressure gradients in offshore strata. In Desoto Canyon located in the eastern part of the Gulf of Mexico, (Meng et al., 2018), also found the normal hydrostatic pressure of subsurface strata in wells located onshore to range from 10.04 kPa/m to 12.40 kPa/m.
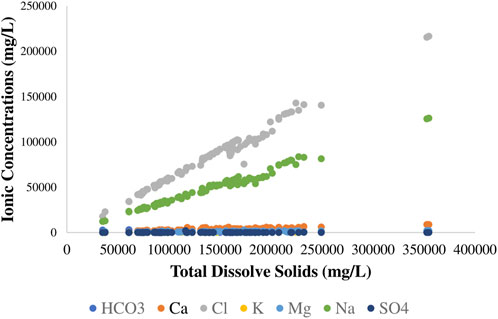
Figure 2. Geochemical concentration of ions of subsurface formations in the offshore Louisiana of the study area. The data source for this plot is from the USGS geochemical database (Blondes et al., 2018).
The temperature and pressure in reservoir sands in the study area generally increase toward the south and the east. Initial reservoir temperature ranges from 8°C to 164°C (Figure 3A). Initial reservoir pressure ranges from <3 to >142 MPa (Figure 3B). About 3.8% of the sands have pressure less than 7.29 MPa (1,057 psi) which is the required pressure for carbon storage. Out of the 1,615 reservoir sands in the study area, only 16 sands (∼1%) have temperature less than the required 31.11°C (88°F) for supercritical CO2 storage. Hence, ∼99% of the sands have reservoir temperature above the critical temperature for CO2.
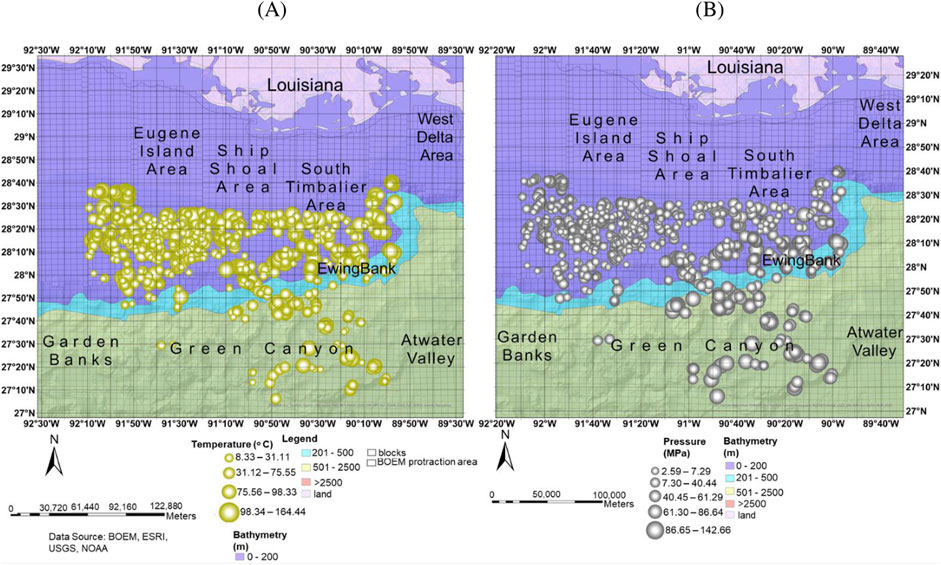
Figure 3. Spatial distribution of hydrocarbon sands in the study area (A) Initial temperature distribution (B) Reservoir pressure distribution.
Figure 4A shows that the reservoir temperature in the shelf has a linear relationship with depth. However, the geothermal gradient in the shelf is highly variable and has a curvilinear relationship with depth (Figure 4B). Geothermal gradient in shallow reservoirs at a depth of 1 km have an average gradient on the order of 5°C/km, whereas reservoirs deeper than 3 km have an average gradient on the order of 15°C/km. This changing temperature gradient might be related to advection associated with active hydrocarbon generation and migration at depth.
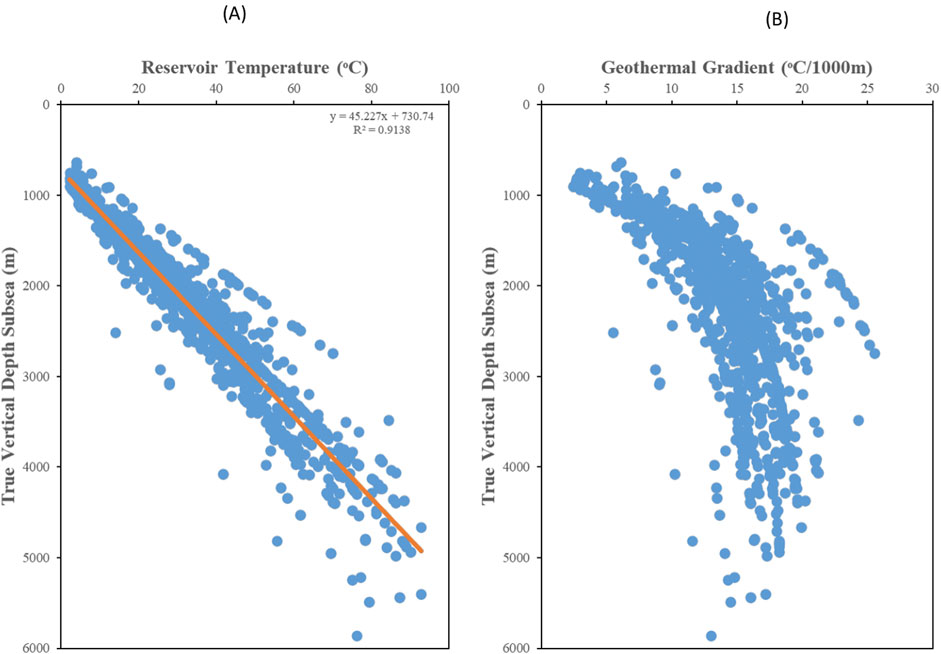
Figure 4. Temperature-depth plot and geothermal gradient-depth plot for continental shelf reservoirs. (A) Temperature-depth plot. (B) Geothermal gradient-depth plot.
Figure 5A reveals that the reservoir temperature differential in the continental slope shows a broad linear relationship with depth. Temperature gradient in the continental slope decreases conspicuously above a depth of 3 km (Figure 5B), which is due to the cooling effect of the thermal mass of the water column (Hu et al., 2024). also found that there is a decrease in the temperature of slope sands with depth with a Pearson correlation value of about 0.67.
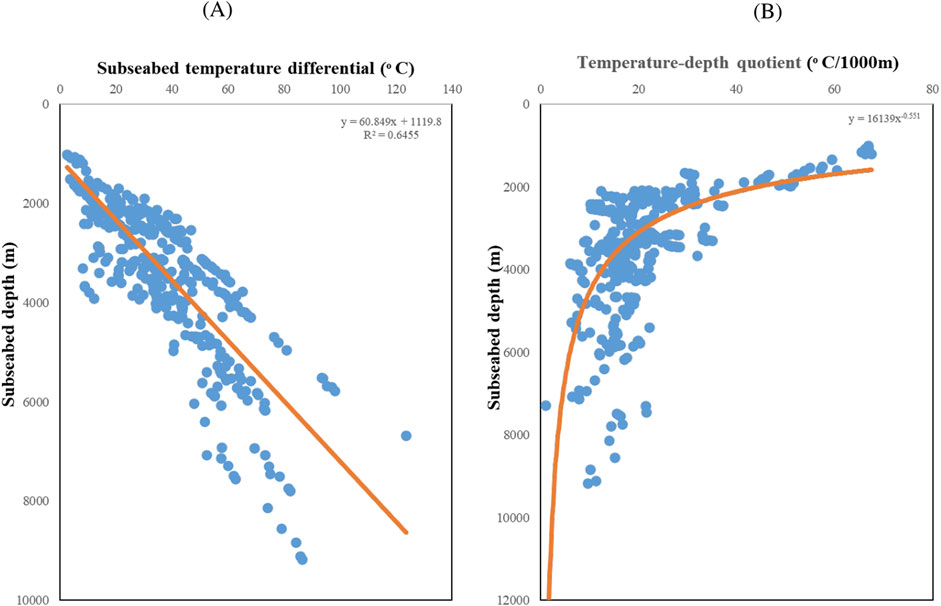
Figure 5. Subseabed temperature differential-depth plot and temperature-depth quotient plot for continental slope reservoirs. (A) Subseabed temperature differential-depth plot. (B) Temperature-depth quotient-subseabed depth plot.
Borehole breakout analysis has been performed on seven wells in the Ewing Bank, Green Canyon and Eugene Island areas to assess the orientation of the horizontal stresses. Borehole breakouts are asymmetrical widening of wellbores induced by stresses (Bell and Gough, 1979; Reinecker et al., 2003). Having followed the five criteria to identify borehole breakouts specified by Reinecker et al., 2003, breakout zones were observed in Well EW-877 and GC- 561. However, wells GC-627, EI-351, GC-490, GC-723, and GC-281 show no evidence of borehole breakout. Figure 6 shows different stress orientations at different depths and layer boundaries.
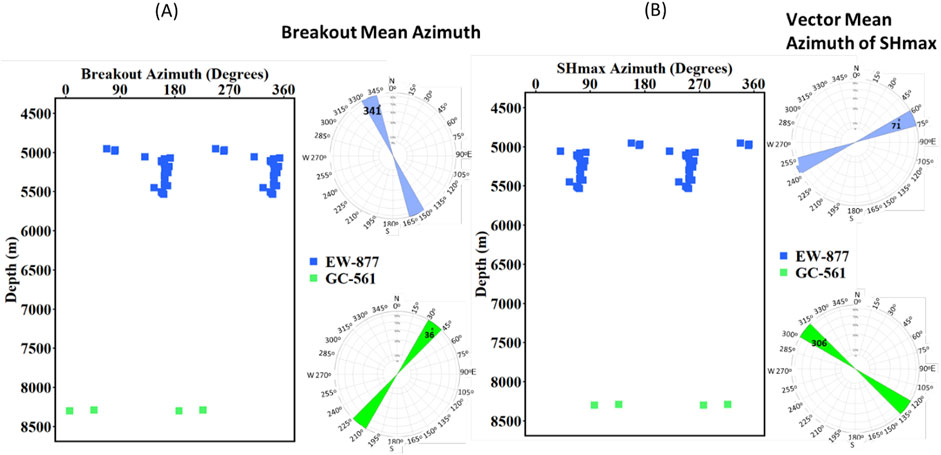
Figure 6. Borehole breakout and stress orientation plots (A) Breakout azimuth plot (B) SHmax azimuth plot.
Well EW-877 shows a high volume of breakouts (26) with 23 breakouts points oriented NW–SE at depth between 5,046.36 and 5,510.05 m (16,556.3–18,077.6 ft) and three breakout points oriented NE-SW at depth between 4,953.15 and 4,982.11 m (16,250.5–16,345.5 ft) (Figure 6A). The vector mean azimuth of breakouts in well EW-877 is 341°, which determines the minimum horizontal stress orientation and 36° in well GC-561 (Figure 6A). The vector mean azimuth of SHmax in well EW-877 and GC-561 is perpendicular to breakout orientation and is thus 71° and 306° respectively (Figure 6B).
Table 1 shows the quality of the borehole breakouts based on the number of breakout points, total length of breakouts and standard deviation using the (Sperner et al., 2003) ranking scheme in wells EW-877 and GC-561, breakout quality is B and D, respectively.
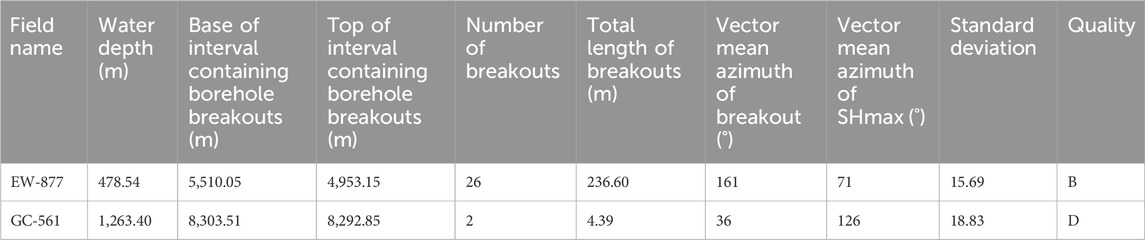
Table 1. Summary borehole breakouts and vector mean azimuth of horizontal stress.
The SHmax map in Figure 7 shows that the maximum stress orientation in the study area is parallel to the bathymetric contours.
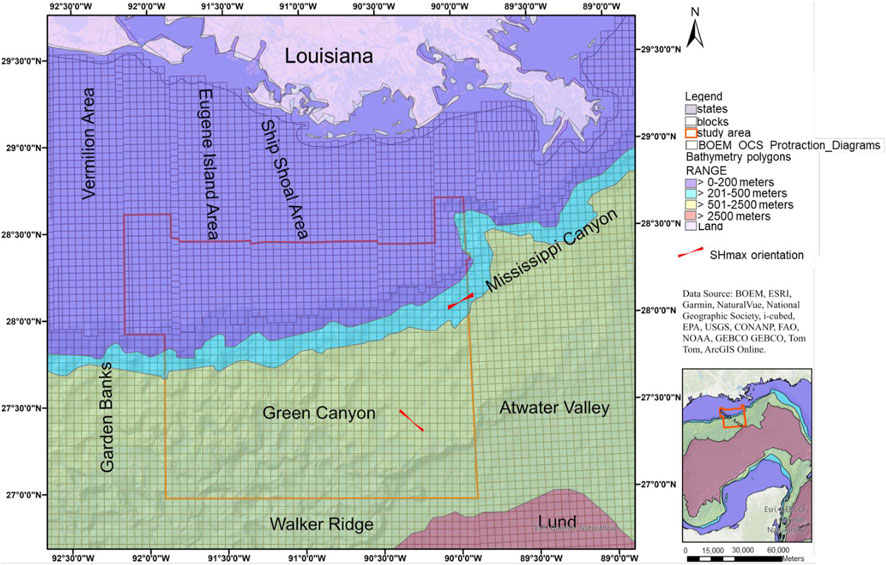
Figure 7. Maximum horizontal stress orientation map of the study area.
In well EW-877 (well with high breakout volume), the pressure becomes higher and approaches the minimum horizontal stress, and lithostatic stress at a depth of about 1,829–5,182 m (6,000–17,000 ft) (Figure 8A). So, this well shows a low CO2 storage potential because of a narrow effective stress window for safe CO2 injection. In well GC-561, which as a much smaller volume of borehole breakouts, overpressure begins at depth of about 8,382 m (27,500 ft) (Figure 8B), which is probably much deeper than CO2 would be stored. This 1D geomechanical assessment reveals that pore pressure and minimum horizontal stress are substantially lower than overburden stress, thus providing a large pressure window for CO2 storage and enhanced hydrocarbon recovery.
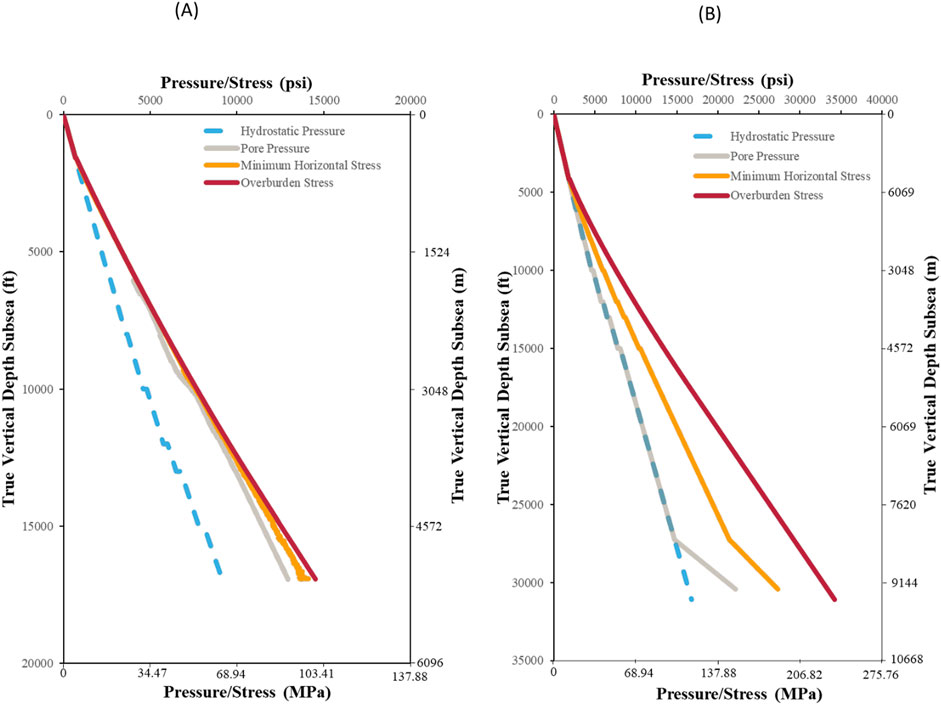
Figure 8. 1D geomechanical models (A) EW-877 Field pressure plot showing the principal stresses (B) GC-561 Field pressure plot.
The variation of hydrostatic pressure, reservoir pressure, fracture pressure and lithostatic pressure with depth in the study area shows that hydrocarbon overpressure is widespread in the study area (Figure 9A), and is especially common in Miocene strata, where reservoir approaches fracture pressure. The floor for reservoir pressure in the study area is brine-compensated hydrostatic pressure, which is common at depth <4,572 m (15,000 ft). The result of the sub-seabed pressure gradient and subsea pressure gradient comparison in the shelf and slope (Figure 9B) reveals the significant contribution of the water column above the seabed to reservoir pressure in the continental slope.
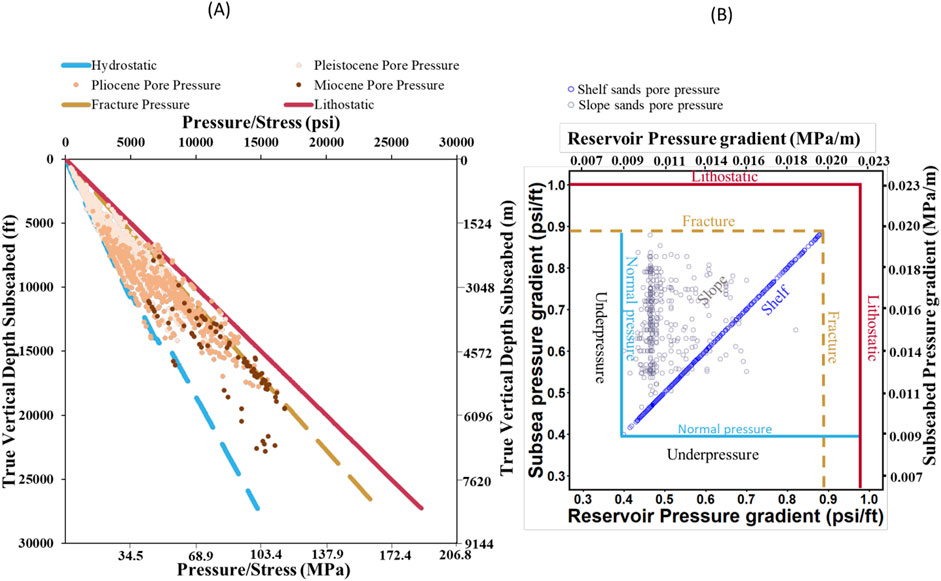
Figure 9. Pressure plots. (A) Pressure plot of Pleistocene-Miocene sands. (B) Comparison of the pore pressure gradient plot of shelf and slope sands.
Reservoir pressure locally equals or exceeds fracture pressure in the continental slope (Figure 10). Out of the 1,615 reservoir sands in the study area, only 53 reservoir sands (∼3%) have reservoir pressure greater than or equal to the fracture pressure. The reservoir pressure–fracture pressure quotient value in these extremely overpressured sands ranges from 1 to 1.2. All but one of these wells is in the Green Canyon protraction area, and one such well is in the Ewing Bank protraction area. Hence, based on subsurface stress assessment in the study area, there is a safe CO2 storage potential in the continental shelf and greater risk in parts of the slope.
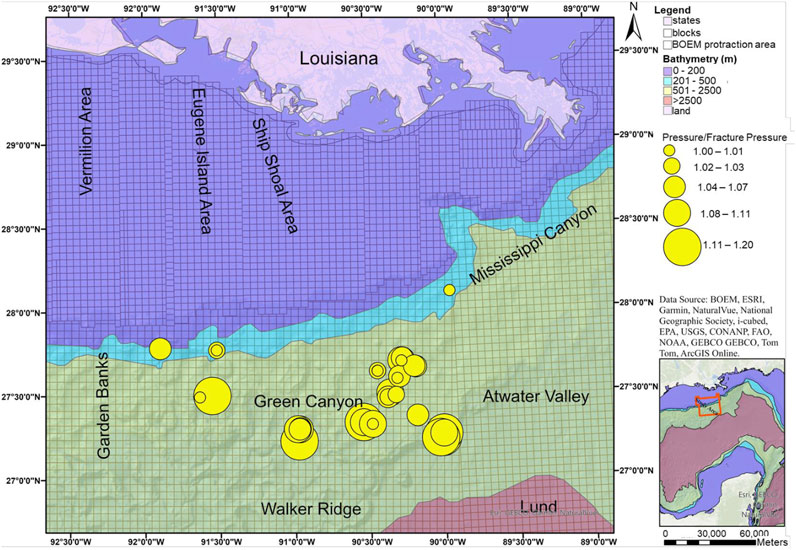
Figure 10. Spatial distribution of reservoir sands with low CO2 storage potential in the study area based on reservoir pressure–fracture pressure quotient greater than or equals one.
The results of the 3D simulations of reservoir pressure and fracture pressure shows that reservoir pressure increases towards the east, south, and with depth (Figure 11A) at pressure ranging from 24 to 114 MPa, thereby showing increase in the reservoir pressure from the continental shelf in the northern part of the study area to the upper slope in the southern part. Simulated fracture pressure increases with depth and towards the southern part of the study area with fracture pressure ranging from 26 to 137 MPa (Figure 11B). Generally, both the reservoir pressure and fracture pressure models show that reservoir pressure is lower than fracture pressure in most of the study area. Hence, most of the reservoirs have a good CO2 storage potential especially in the continental shelf.
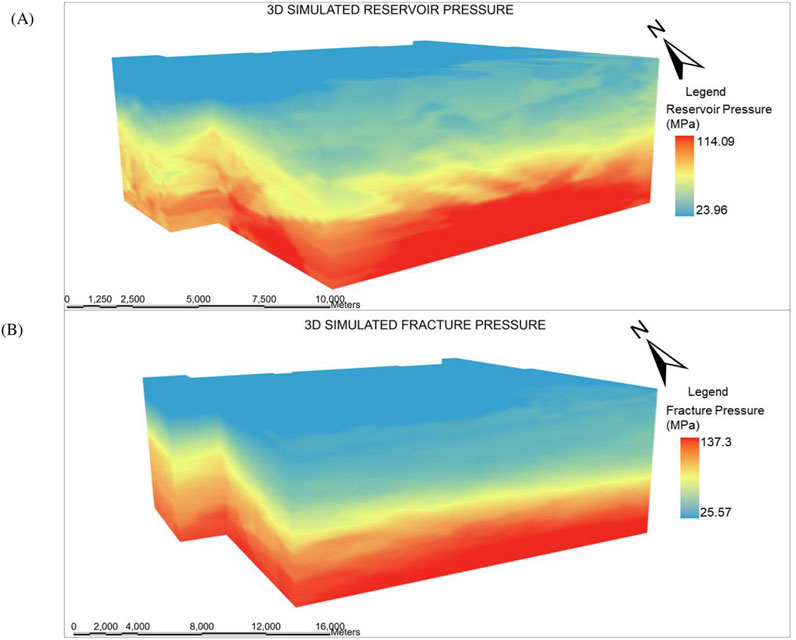
Figure 11. 3D Empirical Bayesian Kriging models (A) Reservoir pressure 3D model (B) Fracture pressure 3D model.
The reservoir pressure depth slice (Figure 12A) reveals that the reservoir pressure at a 1,600 m true vertical subsea depth ranges from about 18 to 55 MPa. The reservoir pressure increases southeast from the outer continental shelf towards the upper continental slope. The fracture pressure depth slice at a 1,600 m true subsea vertical depth (Figure 12B) shows that the fracture pressure at this depth ranges from about 33 to 52 MPa and increases southeastward. For the most part at this depth, a safe CO2 storage window exists where reservoir pressure is less than fracture pressure, especially in the northwestern part of the study area. However, in a few locations in the southeastern part of the study area, the reservoir pressure is equal to or greater than the fracture pressure. Hence, there is no CO2 storage opportunity in these locations.

Figure 12. Depth slice at 1,600 m subsea (A) Reservoir pressure (B) Fracture pressure.
The evaluation index of the 3D simulation is shown in Table 2 in order to assess the accuracy of the predicted reservoir pressure and fracture pressure models. The reservoir pressure model has a mean error, root mean square error, mean standardized error and root mean square standardized error values of 0.01, 3.86, 0.006 and 0.90 MPa, respectively. In addition, the fracture pressure model has a mean error, root mean square error, mean standardized error, and root mean square standardized error values of −0.01, 1.34, 0.005 and 0.80 MPa, respectively. Hence, both models have low root mean squared errors. The accuracy and the performance of the models is further emphasized with mean error and mean standardized errors close to zero as well as root mean squared standardized error close to 1 MPa.
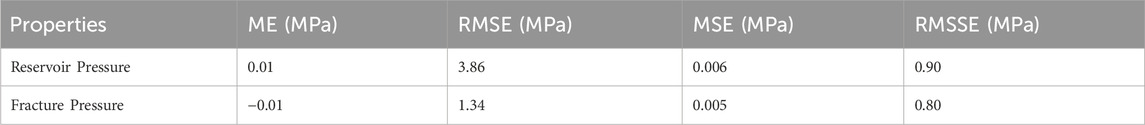
Table 2. Evaluation index of 3D Empirical Bayesian Kriging.
Borehole breakouts occur where stress is greater than the threshold for compressive failure around the wall of a borehole (Bell, 1990; Reinecker et al., 2003; Zoback et al., 1985). The high volume of breakouts in well EW-877 shows that the stress in the deep part of the wellbore is high enough to cause such failure. In addition, the stress plot of this well (Figure 5) shows high pore pressure close to the minimum principal stress and minimum horizontal stress, and these factors appear to have contributed to breakout formation. Tensile fractures are expected to develop with strike direction coincident with the maximum horizontal compressive stress. So, possible fractures in well EW-877 would be expected to strike NE–SW, perpendicular to the elongation direction of the borehole breakouts. Generally, the direction of maximum horizontal stress is parallel to bathymetric contours and the strike of normal faults in the study area, which strike NE-SW in Field EW-877 and NW-SE in Field GC-561. The sediment wedge, which has been subjected to gravitational stress while being deformed by movement of the buoyant, ductile Louann Salt (Garrison and Martin, 1973) has a minimum horizontal stress that is oriented NW-SE in Field EW-877 and is oriented NE-SW in Field GC-561. The different stress orientations at varying depth in Fields EW-877 and GC-561 may result from local structural complexity associated with gravitational extension combined with salt tectonics. In addition, the different stress orientations may have been influenced by overpressuring of sand bodies with variable geometry and proximity to salt bodies, which would facilitate the reorientation of the principal stresses (Zoback, 2007).
The minimum reservoir pressure in the study area is brine-compensated hydrostatic pressure, and overpressured reservoirs are common, which are apparently related to hydrocarbon charge in the region. Reservoir pressure gradient is generally higher in the slope than in the shelf. Rapid sediment loading also has been identified as a cause of overpressure in this and many other regions around the globe (Dugan and Flemings, 2000; Rubey and King Hubbert, 1959). Hence, the high pore pressure in the study area might be due to rapid deposition, active gravity gliding along the slope, and hydrocarbon charge.
The temperature-depth quotient in the continental slope decreases substantially below a depth of about 3,048 m (10,000 ft), which is beneath the deepest part of the water column in areas that have been drilled. The regional temperature gradient is highly variable, apparently reflecting a combination of conductive heat flow in the sediment column and water column and advection associated with hydrocarbon generation and migration as well as sediment compaction. Indeed, the decrease in temperature-depth quotient in slope sediment is largely due to thermal mass of the water column cooling the upper part of the sediment column.
Simulated reservoir pressure, and fracture gradient reveal the variation of these properties in three dimensions with reservoir pressure and fracture pressure increasing with depth. A depth slice at a subsea depth of 1,600 m shows strong CO2 storage potential with pressure and temperature meeting the criteria for storage of supercritical CO2 and reservoir pressure substantially below fracture pressure in the vast majority of the study area.
It is important to ensure safe injection of carbon dioxide and permanent storage. Before considering a site for CO2 injection, the subsurface stress condition, temperature, and pressure must be known to prevent leakage and ensure well integrity and reservoir integrity. This research provides an insight into understanding the interplay among geologic structure, pressure, temperature, and stress fields for secure injection of CO2 into offshore reservoirs in the Central Gulf of Mexico. The three principal stress classes include the minimum horizontal stress, maximum horizontal stress and overburden stress. The difference between these stresses and pore pressure is the effective stress. When carbon dioxide is injected into subsurface strata, pore pressure is increased, which invariably leads to a decrease in the effective stress and can potentially result in tensile failure, reactivation of existing faults, and migration of stored CO2 out of the storage complex.
Some of the hydrocarbon reservoirs, particularly in the Pliocene and Miocene sands in the study area, have pressure approaching fracture pressure and minimum horizontal stress which thus limits or occludes a secure CO2 storage window. To minimize the risk of fault reactivation in the study area, CO2 can be injected in places with few if any faults imaged on seismic data. Reservoir pressure and fracture pressure are simulated in 3D in this study to help understand the depth and geographic locations with good storage potential. On the basis of this analysis, risk is lowest in the Pleistocene sands, although many favorable locations also exist in the Miocene and Pliocene sands, particularly where pressure has been lowered by primary hydrocarbon production and the potential for CO2-EOR is high. For offshore storage, CO2 can be transported through pipeline in liquid form, which is the most efficient method of pipeline transport (McCoy and Rubin, 2008), or shipped offshore to platforms. In addition, it is preferable to transport CO2 in liquid form because of its high density and low compressibility (Vilarrasa and Rutqvist, 2017). If the injected CO2 is at a temperature lower than the formation temperature, it might promote shear failure, which would destabilize the reservoir and the caprock (Vilarrasa and Rutqvist, 2017), thereby increasing the risk of leakage of CO2 due to thermal stress. Failure of subsurface geologic formations can be prevented either by injecting the CO2 at lower rate or injected at a close to reservoir temperature to ensure thermal stability (Bonneville et al., 2014; Samaroo et al., 2024; Vilarrasa and Laloui, 2016; Vilarrasa and Rutqvist, 2017).
This study evaluated the stress field, temperature, and pressure in the outer continental shelf and upper continental slope offshore of Louisiana to better aid the understanding of the interplay among stress, geologic structure, temperature, and pressure and their implications for secure, long-term storage of carbon dioxide, which can be used for enhanced oil recovery or storage in saline formations. The orientation of the maximum horizontal stress in Field EW-877 is NE-SW, which tends to parallel bathymetric contours and the major orientation of extensional faults in the study area. The sediment wedge in the study area has been subjected to minimum horizontal stress oriented NW-SE in Field EW-877 and NE-SW in Field GC-561. The average sand pressure gradient and temperature gradient are ∼1.3 MPa/100 m and ∼1.2°C/100 m respectively. The temperature differential in the shelf and the slope is highly variable with depth. The temperature gradient in the continental slope decreases markedly below a depth of ∼3,048 m. The temperature gradient is interpreted as a product of conductive heat flow and advection associated with active hydrocarbon generation and migration at depth, sediment compaction, and the thermal mass of the water volume above the seafloor. The minimum reservoir pressure is brine-compensated hydrostatic pressure, and overpressuring is common with reservoir pressure locally approaching fracture pressure and lithostatic stress, particularly in Miocene and Pliocene sands. About 3% of the reservoir sands have reservoir pressure greater than or equal to the fracture pressure with reservoir pressure to fracture pressure quotient values equal to or greater than 1. In the study area, all of these wells are located in the upper continental slope. CO2 can be safely injected at a pressure between the reservoir pressure and the minimum horizontal stress to minimize the risk of formation damage and interformational flow. Additional work can be performed to evaluate the shear and tensile strength of both the caprock and the reservoir as well as to simulate the reservoir response to CO2 injection in order to control injection rate and optimize hydrocarbon sweep, CO2 storage efficiency, and storage security.
The publicly available datasets analyzed in this study can be found here: https://www.data.boem.gov/Main/GandG.aspx https://data.usgs.gov/datacatalog/data/USGS:59d25d63e4b05fe04cc235f9.
JA: Data curation, Formal Analysis, Investigation, Methodology, Software, Visualization, Writing–original draft, Writing–review and editing, Conceptualization. JP: Conceptualization, Formal Analysis, Funding acquisition, Methodology, Project administration, Resources, Supervision, Validation, Visualization, Writing–review and editing.
The author(s) declare that financial support was received for the research, authorship, and/or publication of this article. This research is supported by the U. S Department of Energy National Energy Technology Laboratory under agreement DE-FE0031557 through the Southern States Energy Board. The authors are grateful for the comments of the reviewers, which substantially improved this contribution. This paper is based upon work supported by the Department of Energy and was prepared as an account of work sponsored by an agency of the United States Government. Neither the United States Government nor any agency thereof, nor any of their employees, makes any warranty, express or implied, or assumes any legal liability or responsibility for the accuracy, completeness, or usefulness of any information, apparatus, product, or process disclosed, or represents that its use would not infringe privately owned rights.
Reference herein to any specific commercial product, process, or service by trade name, trademark, manufacturer, or otherwise does not necessarily constitute or imply its endorsement, recommendations, or favoring by the United States Government or any agency thereof.
The authors declare that the research was conducted in the absence of any commercial or financial relationships that could be construed as a potential conflict of interest.
The author(s) declare that no Generative AI was used in the creation of this manuscript.
All claims expressed in this article are solely those of the authors and do not necessarily represent those of their affiliated organizations, or those of the publisher, the editors and the reviewers. Any product that may be evaluated in this article, or claim that may be made by its manufacturer, is not guaranteed or endorsed by the publisher.
The views and opinions of authors expressed herein do not necessarily state or reflect those of the United States Government or any agency thereof.
Aelion, C. M., Davis, H., Liu, Y., Lawson, A., and McDermott, S. (2009). Validation of Bayesian kriging of arsenic, chromium, lead, and mercury surface soil concentrations based on internode sampling. Environ. Sci. and Technol. 43, 4432–4438. doi:10.1021/es803322w
Bell, J. (1990). Investigating stress regimes in sedimentary basins using information from oil industry wireline logs and drilling records. London, United Kingdom: Geological Society, London, Special Publications. Vol. 48, 305–325.
Bell, J., and Gough, D. (1979). Northeast-southwest compressive stress in Alberta evidence from oil wells. Earth Planet. Sci. Lett. 45, 475–482. doi:10.1016/0012-821x(79)90146-8
Blondes, M., Gans, K., Engle, M., Kharaka, Y., Reidy, M., Saraswathula, V., et al. (2018). US Geological Survey national produced waters geochemical database (ver. 2.3, January 2018). United States: US Geological Survey data release 10. doi:10.5066/F7J964W8
BOEM (2019). Atlas of Gulf of Mexico gas and oil sands data. Available at: https://www.data.boem.gov/Main/GandG.aspx (Accessed August 30, 2024).
Bonneville, A., Nguyen, B. N., Stewart, M., Hou, Z. J., Murray, C., and Gilmore, T. (2014). Geomechanical evaluation of thermal impact of injected CO2 temperature on a geological reservoir: application to the FutureGen 2.0 Site. Energy Procedia 63, 3298–3304. doi:10.1016/j.egypro.2014.11.358
Buffler, R. T. (1991). Seismic stratigraphy of the deep Gulf of Mexico basin and adjacent margins. Geological Society of America: America.
Busch, A. (2015). Gas retention and transport processes in low permeability rocks. (Doctoral dissertation. Habilitationsschrift, Aachen, Techn. Hochsch., 2014).
Dugan, B., and Flemings, P. B. (2000). Overpressure and fluid flow in the New Jersey continental slope: implications for slope failure and cold seeps. Science 289, 288–291. doi:10.1126/science.289.5477.288
Eaton, B. A. (1969). Fracture gradient prediction and its application in oilfield operations. J. petroleum Technol. 21, 1353–1360. doi:10.2118/2163-pa
Eaton, B. A. (1975). “The equation for geopressure prediction from well logs,” in Presented at the SPE annual technical conference and exhibition. SPE–5544.
Finkbeiner, T., Stump, B., Zoback, M., Flemings, P., and Parker, R. A. (1996). “Pressure (P), overburden (sv), and minimum horizontal stress (shmin) in Eugene Island block 330, offshore Gulf of Mexico,” in Topical report 1. prepared for the Gas Research Institute, grant GRI-96/0285 30.
Galloway, W. E. (2008). Depositional evolution of the Gulf of Mexico sedimentary basin. Sediment. basins world 5, 505–549. doi:10.1016/S1874-5997(08)00015-4
Garrison, L. E., and Martin, R. G. (1973). Geologic structures in the Gulf of Mexico basin. Washington, DC: US Government Printing Office.
Hu, X., Bhattacherjee, R., Botchway, K., Pashin, J. C., Chakraborty, G., and Bikkina, P. (2024). CO2 storage site analysis, screening, and resource estimation for cenozoic offshore reservoirs in the central Gulf of Mexico. Energies 17, 1349. doi:10.3390/en17061349
Jackson, M. P., and Hudec, M. R. (2017). Salt tectonics: principles and practice. Cambridge University Press.
Jacques, J. M., and Clegg, H. (2002). Late Jurassic source rock distribution and quality in the Gulf of Mexico: inferences from plate tectonic modelling. Gulf Coast Association of Geological Societies Transactions. Vol. 52, 429–440.
Keaney, G., Li, G., and Williams, K. (2010). “Improved fracture gradient methodology-understanding the minimum stress in Gulf of Mexico,” in Presented at the ARMA US rock mechanics/geomechanics symposium, ARMA, ARMA–10.
King, R., Backé, G., Tingay, M., Hillis, R., and Mildren, S., (2012). Stress deflections around salt diapirs in the Gulf of Mexico, 367, 141–153. doi:10.1144/sp367.10
Krivoruchko, K. (2012). Empirical bayesian kriging implemented in ArcGIS geostatistical analyst. ArcUser Fall, 6–10.
Krivoruchko, K., and Gribov, A. (2019). Evaluation of empirical Bayesian kriging. Spat. Stat. 32, 100368. doi:10.1016/j.spasta.2019.100368
Lehner, P. (1969). Salt tectonics and Pleistocene stratigraphy on continental slope of northern Gulf of Mexico. AAPG Bull. 53, 2431–2479. doi:10.1306/5d25c967-16c1-11d7-8645000102c1865d
Li, Y., Hernandez, J. H., Aviles, M., Knappett, P. S., Giardino, J. R., Miranda, R., et al. (2020). Empirical Bayesian Kriging method to evaluate inter-annual water-table evolution in the Cuenca Alta del Río Laja aquifer, Guanajuato, México. J. Hydrology 582, 124517. doi:10.1016/j.jhydrol.2019.124517
Li, Z., Tao, H., Zhao, D., and Li, H. (2022). Three-dimensional empirical Bayesian kriging for soil PAHs interpolation considering the vertical soil lithology. Catena 212, 106098. doi:10.1016/j.catena.2022.106098
Mardia, K. V. (1972). Statistics of directional data: probability and mathematical statistics. London: Academic Press, 357.
Matthews, W. R., and Kelly, J. (1967). How to predict formation pressure and fracture gradient. Oil Gas J. 65 (8), 92–106.
McCoy, S. T., and Rubin, E. S. (2008). An engineering-economic model of pipeline transport of CO2 with application to carbon capture and storage. Int. J. Greenh. gas control 2, 219–229. doi:10.1016/s1750-5836(07)00119-3
Meng, J., Pashin, J. C., Nygaard, R., and Chandra, A. (2018). Analysis of the stress field in the DeSoto canyon Salt Basin for ensuring safe offshore carbon storage. Int. J. Greenh. Gas Control 79, 279–288. doi:10.1016/j.ijggc.2018.11.006
Molaghab, A., Taherynia, M. H., Fatemi Aghda, S. M., and Fahimifar, A. (2017). Determination of minimum and maximum stress profiles using wellbore failure evidences: a case study—a deep oil well in the southwest of Iran. J. Petroleum Explor. Prod. Technol. 7, 707–715. doi:10.1007/s13202-017-0323-5
Moore, J. C., Iturrino, G. J., Flemings, P. B., and Sawyer, D. E. (2009). Data report: stress orientations from borehole breakouts, IODP Expedition 308, Ursa area, Mississippi Fan, Gulf of Mexico. Present. A. T. Proc. IODP 308, 2. doi:10.2204/iodp.proc.308.212.2009
Peel, F., Travis, C., and Hossack, J. (1995). Genetic structural provinces and salt tectonics of the Cenozoic offshore US Gulf of Mexico: a preliminary analysis, 153, 175. doi:10.1306/m65604c7
Pindell, J., and Kennan, L. (2001). Kinematic evolution of the Gulf of Mexico and caribbean, 193, 220. doi:10.5724/gcs.01.21.0193
Pindell, J. L., and Kennan, L. (2009). Tectonic evolution of the Gulf of Mexico, Caribbean and northern South America in the mantle reference frame: an update. London, United Kingdom: Geological Society, London, Special Publications. Vol. 328, 1–55.
Pruess, K. (2008). Leakage of CO2 from geologic storage: role of secondary accumulation at shallow depth. Int. J. Greenh. Gas Control 2, 37–46. doi:10.1016/s1750-5836(07)00095-3
Rahman, M. J., Fawad, M., and Mondol, N. H. (2022). 3D field-scale geomechanical modeling of potential CO2 storage site Smeaheia, offshore Norway. Energies 15, 1407. doi:10.3390/en15041407
Reinecker, J., Tingay, M., and Müller, B. (2003). Borehole breakout analysis from four-arm caliper logs. World stress map Proj., 1–5.
Rowan, M. G., Jackson, M. P., and Trudgill, B. D. (1999). Salt-related fault families and fault welds in the northern Gulf of Mexico. AAPG Bull. 83, 1454–1484. doi:10.1306/e4fd41e3-1732-11d7-8645000102c1865d
Rubey, W. W., and King Hubbert, M. (1959). Role of fluid pressure in mechanics of overthrust faulting: II. Overthrust belt in geosynclinal area of western Wyoming in light of fluid-pressure hypothesis. Geol. Soc. Am. Bull. 70, 167–206. doi:10.1130/0016-7606(1959)70[167:rofpim]2.0.co;2
Samaroo, M., McClure, M., Fowler, G., Chalaturnyk, R., Dusseault, M. B., and Hawkes, C. (2024). Injection temperature impacts on reservoir response during CO2 storage. SPE J. 29, 2638–2661. doi:10.2118/219461-PA
Sandwell, D. T., Müller, R. D., Smith, W. H., Garcia, E., and Francis, R. (2014). New global marine gravity model from CryoSat-2 and Jason-1 reveals buried tectonic structure. science 346, 65–67. doi:10.1126/science.1258213
Snedden, J. W., and Galloway, W. E. (2019). The Gulf of Mexico sedimentary basin: depositional evolution and petroleum applications. Cambridge University Press.
Sperner, B., Müller, B., Heidbach, O., Delvaux, D., Reinecker, J., and Fuchs, K. (2003). Tectonic stress in the Earth’s crust: advances in the World Stress Map project. London, United Kingdom: Geological Society, London, Special Publications. Vol. 212, 101–116.
Vilarrasa, V., and Laloui, L. (2016). Impacts of thermally induced stresses on fracture stability during geological storage of CO2. Energy Procedia 86, 411–419. doi:10.1016/j.egypro.2016.01.042
Vilarrasa, V., and Rutqvist, J. (2017). Thermal effects on geologic carbon storage. Earth-science Rev. 165, 245–256. doi:10.1016/j.earscirev.2016.12.011
Yassir, N., and Zerwer, A. (1997). Stress regimes in the Gulf Coast, offshore Louisiana: data from well-bore breakout analysis. AAPG Bull. 81 (2), 293–307. doi:10.1306/522B4311-1727-11D7-8645000102C1865D
Zerwer, A., and Yassir, N. A. (1994). “Borehole breakout interpretation in the Gulf coast, offshore Louisiana,” in Presented at the 1st North American rock mechanics symposium. ARMA-1994-0225.
Zoback, M. (2007). “Reservoir geomechanics,” in Reservoir geomechanics. doi:10.1017/CBO9780511586477
Zoback, M. D., Moos, D., Mastin, L., and Anderson, R. N. (1985). Well bore breakouts and in situ stress. J. Geophys. Res. Solid Earth 90, 5523–5530. doi:10.1029/jb090ib07p05523
Keywords: borehole breakouts, minimum horizontal stress, fracture pressure, pore pressure, total dissolved solids, 3D empirical Bayesian kriging, stress orientation
Citation: Ademilola JA and Pashin JC (2025) Integrated geostatistical and stress-field assessment of Miocene-Pleistocene strata for offshore geologic carbon storage in the Central Gulf of Mexico. Front. Energy Res. 13:1513164. doi: 10.3389/fenrg.2025.1513164
Received: 18 October 2024; Accepted: 03 February 2025;
Published: 25 February 2025.
Edited by:
Qiang Sun, Xi’an University of Science and Technology, ChinaReviewed by:
Weiqiang Zhang, China University of Mining and Technology, ChinaCopyright © 2025 Ademilola and Pashin. This is an open-access article distributed under the terms of the Creative Commons Attribution License (CC BY). The use, distribution or reproduction in other forums is permitted, provided the original author(s) and the copyright owner(s) are credited and that the original publication in this journal is cited, in accordance with accepted academic practice. No use, distribution or reproduction is permitted which does not comply with these terms.
*Correspondence: J. A. Ademilola, am9zaHVhLmFkZW1pbG9sYUBva3N0YXRlLmVkdQ==
Disclaimer: All claims expressed in this article are solely those of the authors and do not necessarily represent those of their affiliated organizations, or those of the publisher, the editors and the reviewers. Any product that may be evaluated in this article or claim that may be made by its manufacturer is not guaranteed or endorsed by the publisher.
Research integrity at Frontiers
Learn more about the work of our research integrity team to safeguard the quality of each article we publish.