 Yi Zhang
 Zhezhou Zhang*
- School of Economics and Management, Shanghai University of Electric Power, Shanghai, China
In the context of deepening energy coupling and the high penetration of renewable energy, this paper proposes a master-slave game model incorporating comprehensive demand response and a stepped carbon trading mechanism. The goal is to optimize scheduling of demand response resources and fully leverage the flexibility of energy use within an integrated energy system while addressing conflicts of interest among multiple stakeholders, thereby enhancing trading revenue in Energy Markets while considering lower carbon emissions. Firstly, the basic structure of the integrated energy system is analyzed, and the decision-making entities are modeled. A stepped carbon pricing mechanism is introduced to constrain the carbon emissions of each entity, while comprehensive demand response is introduced on the user side to improve user economic benefits and energy use comfort. Secondly, an energy manager is designated as the leader, while energy suppliers, energy storage operators, and users act as followers, forming a master-slave game model to explore the interaction mechanisms among the entities. Finally, the model is solved using the differential evolution algorithm and the Cplex tool on the Matlab platform, resulting in an equilibrium solution. A case study is conducted using relevant data from a typical region in China, demonstrating that the scheduling of demand response resources are improved, and carbon emissions are reduced, thereby verifying the rationality and effectiveness of the proposed model. Profits of EMO, EGO, ESO and users have respectively increased 34%, 46%, 31% and 7%. The carbon emissions of the system have decreased 11%.
1 Introduction
The fossil fuel-based energy consumption structure is one of the primary causes of global climate change, making the global energy transition an urgent task. Structural adjustments towards clean energy are an effective means to promote green development in the economy, environment, and society. Integrated Energy Systems (IES) break down the barriers between traditional energy subsystems, enabling the coordination of electricity, heat, gas, and cooling, thereby maximizing energy utilization and fostering sustainable energy development (Hongle et al., 2024).
Given the current context, there is increasing global emphasis on IES development, making integrated energy a research hotspot among scholars domestically and internationally. Some scholars have focused on IES modeling, laying the groundwork for research on system operation, evaluation, and scheduling. Shahidehpour et al. used singular perturbation theory to construct a dynamic IES model, facilitating the coordinated operation of gas, electric, and thermal systems (Shahidehpour et al., 2019). Peng et al. proposed a quantized event-driven IES simulation algorithm, improving the efficiency and accuracy of IES simulations (Peng et al., 2022). Hong et al. developed an optimal power-keeping model for electric-gas IES, effectively reducing the model scale and enhancing accuracy (Hong et al., 2023). Shuai et al. explored an algorithm based on state decomposition, improving flexibility of dispatch and energy efficiency (Shuai et al., 2022).
Optimizing IES scheduling is also a focal point for current scholars. Chong et al. established a two-stage optimization model for planning allocation and operational scheduling, exploring factors affecting the Integrated Benefit (IB) index and the optimal energy supply mode (Chongchao et al., 2023). Chen et al. proposed an improved multi-time-scale coordinated control strategy for IES based on a Hybrid Energy Storage System (HESS), analyzing the power response characteristics of various devices within IES across different time scales (Chenyun et al., 2023). Chen et al. considered the multi-energy coupling nature of IES and proposed an optimization model incorporating Demand Response (DR), enhancing economic efficiency and effectively promoting new energy absorption (Chen et al., 2024). Due to the volatility and randomness in renewable energy output and load demand, IES faces operational risks. Hui et al. proposed an optimized IES model considering multi-uncertainties, multi-energy coupling, and integrated demand response (IDR), which effectively ensures coordinated system operation, improves economic efficiency, and enhances system reliability (Hui et al., 2023). Hong et al. introduced a demand response (DR) mechanism based on the uncertainties of renewable energy, proposing an optimal planning method that balances the economic benefits and resilience of IES under extreme natural disasters by calculating the resilience marginal cost (Hongbo et al., 2023). Yun et al. constructed an IES optimization scheduling model based on the CVaR theory to predict energy demand, reduce IES operational risks, and simultaneously improve economic efficiency (Yunfei et al., 2022). Li et al. studied demand response in power systems against attacks (Yang S. et al., 2024).
The low-carbon aspect of IES is another key area of focus for scholars. Pei et al. introduced demand response and carbon trading mechanisms into IES optimized scheduling, proposing an optimal scheduling model incorporating combined cooling, heat, and power (CCHP) and carbon capture devices to achieve low-carbon economic operation of IES (Peihong et al., 2023). Xiao et al. applied a stepped carbon penalty response (SCPR) to IES, reducing IES operational carbon emissions and annual operating costs (Xiaohui et al., 2023). Ping et al. constructed an IES optimization scheduling model incorporating tiered carbon trading and hydrogen energy coupling, fully utilizing the clean characteristics of hydrogen energy to reduce carbon emissions and enhance the economic efficiency of IES operation (Pinghui et al., 2023).
IES operations often involve multiple stakeholders, and game theory is suitable for studying the interests among these parties. The master-slave game belongs to the dynamic non-cooperative game category, where the leader’s decisions become constraints for the followers, who then respond accordingly. Yuan et al. treated IES vendors as leaders and each IES as followers, constructing a master-slave game model to study the dynamic pricing behavior of IES vendors and the operational optimization strategies of IES (Yuanyuan et al., 2022). Ke et al. used a master-slave game model to explore the relationships among energy retailers (ER), energy suppliers (ESs), and users, validating the proposed method’s effectiveness through scenario analysis (Li et al., 2023). Mei et al. considered the collaborative incentives of carbon trading on the load side, establishing a one-master, multi-slave optimization model to explore trading strategies among multiple parties (Meijuan et al., 2024). The aforementioned studies on IES games focus on the interests among stakeholders without considering the impact of carbon emissions on each party.
Since the opening of the electricity market, scholars have focused on studying the participation of IES in the exchange of interests in the electricity market and enhancing the competitiveness of distributed energy, with less consideration given to fully utilizing demand side resources. Additionally, energy storage is a core component of IES, yet these studies overlook the role of energy storage operators as stakeholders. Based on the above background, this paper constructs a master-slave game model incorporating IES demand response and a stepped carbon pricing mechanism. The research content of this article is as follows:
1. Firstly, the basic structure of IES is introduced, and the decision-making entities are modeled, while also introducing the IDR to reflect user satisfaction with the use of electricity, heat, and cooling.
2. Secondly, a carbon trading mechanism is introduced, using stepped carbon price to reduce carbon emissions from the integrated energy system.
3. Subsequently, a one-master, multi-slave game model is constructed, with the Energy Management Operator (EMO) as the leader, and the Energy Generation Operator (EGO), Energy Storage Operator (ESO), and users as followers, to explore the interactive mechanisms among the entities.
4. The Differential Evolution Algorithm (DE) is used on the Matlab platform to solve the upper-level EMO model, while the Cplex tool is employed to solve the lower-level follower models, ultimately obtaining an equilibrium solution.
5. Finally, relevant data from a certain region in China is selected for case analysis, comparing the demand conditions for electricity, heat, and cooling during different periods, exploring the load changes before and after demand response, and optimizing the scheduling of the three types of energy. This verifies the model’s validity and scientific accuracy, demonstrating the advantages of game optimization from both economic benefits and environmental costs perspectives.
2 Multi-entity modeling of integrated energy systems and stepped carbon pricing mechanism
2.1 Integrated energy system framework
The integrated energy system can integrate various energy resources to solve the complexity of purchasing and managing energy resources separately. At the same time, under unified scheduling and management, it reduces energy loss and waste, thereby reducing the operating costs of enterprises. Integrated Energy Systems (IES) can simultaneously integrate electricity, heat, cooling, and gas. The system is equipped with energy storage devices to assist in balancing the supply and demand of these four types of energy, and includes energy conversion devices to enable flexible conversion between the four types of energy, maximizing the utilization of renewable energy. During system operation, the four types of energy units develop output plans based on their own operational characteristics, energy demands, and the price differences between various energies. IES uses energy conversion devices to achieve mutual conversion between various types of energy, enhancing the penetration rate of renewable energy. Unlike traditional power systems, IES includes multi-energy flow coupling. Figure 1 shows the IES architecture, which involves multiple energies such as electricity, heat, cooling, and gas. IES consists of an energy supply network, energy exchange links, and end use energy units.
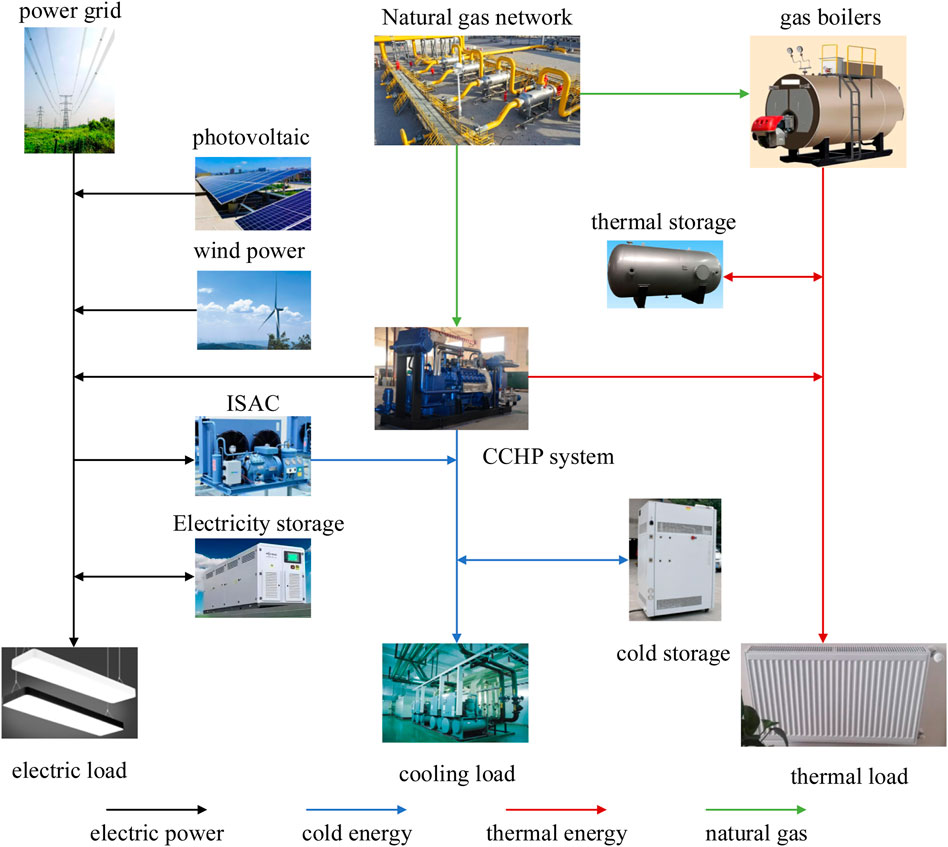
Figure 1. Ies architecture and energy flow diagram.
The IES energy supply equipment includes photovoltaic (PV), wind power (WT), and gas boilers (GB). The CCHP system typically consists of a gas turbine (GT), a heat recovery boiler (HRB), and an ice storage air conditioning system (ISAC). Energy storage equipment is composed of batteries (BT) and thermal storage tanks (HST).
2.2 Decision modeling of each entity
2.2.1 Energy Management Operator
Energy Management Operator (EMO) is responsible for coordinating and planning energy resources. EMO utilizes electricity pricing mechanisms to flexibly adjust the buying and selling prices of energy based on actual conditions, guiding the output of energy supply units. The objective
In the formula
Equation 3 describes the interests of eso in the formula
In the formula
In the formula
In the formula
In the formula
EMO’s purchase and sale of energy meet the following constraints Equations 7–11:
In the formula
2.2.2 Energy Generation Operator
Energy Generation Operator (EGO) is responsible for managing various types of energy units. EGO optimizes the output of various energy units based on energy prices to maximize its own profits.
In the formula
In the formula
Thermal power units must meet the following constraints Equations 17–23:
In the formula
2.2.3 Energy storage operator
The Energy Storage Operator (ESO) is responsible for managing energy storage equipment. ESO stores electric energy in BT and thermal energy in HST. To maximize profits, ESO stores energy when prices are low and discharges it when prices are high. The function 24 is represented as:
In the formula
In the formula
The state of charge and charging/discharging constraints of energy storage devices are as following Formulas 27–31:
In the formula
2.2.4 Users and integrated demand response
The objective function for maximizing consumer surplus is expressed as Formula 32:
In the formula
In the formula
Demand response is a flexible tool for regulating the electricity market, which plays an important role in balancing electricity supply and demand, consolidating system stability, and promoting the consumption of renewable energy (Zhijie et al., 2024). In the traditional sense, demand response refers to the adjustment of power consumption habits by users on the demand side in response to incentives, compensation policies, or electricity price changes issued by power companies (Song et al., 2024). Demand response is generally divided into price-based and incentive-based categories (Yang J. et al., 2024). With the advancement of information technology, single-energy systems are gradually evolving into multi-energy systems, and demand response has evolved to include electricity, cooling, heating, and other forms of energy (Peng et al., 2021). IES demand response is an important means of encouraging interaction between demand-side resources and renewable energy (Songrui et al., 2022).
Fixed load refers to an electrical load whose power remains relatively constant over a period of time. Shiftable loads refers to the power supply time that can be adjusted according to the plan, and the overall load can be shifted. The energy load is composed of fixed loads
Users can adjust their power consumption and timing based on electricity prices at different times, and shiftable loads
In the formula
Thermal (cooling) loads are composed of fixed thermal (cooling) loads and reducible thermal (cooling) loads, satisfying the following Equations 37, 38:
In the formula
2.3 Stepped carbon trading model
The goal of carbon trading policies is to stimulate the initiative of traditional units to reduce carbon emissions by adjusting carbon trading costs, thereby increasing the competitiveness of wind and solar power in the electricity market (Ruitian et al., 2022). A common method is to obtain carbon trading costs through a fixed carbon price, which is relatively convenient in terms of operation and settlement (Yongli et al., 2023). However, the carbon trading costs and operational decisions of most entities are affected by the carbon price, and the fixed carbon price model has limited incentives for entities to actively reduce emissions.
Unlike the usual carbon trading mechanism, the stepped carbon pricing mechanism divides the purchasing range into different intervals. As the volume of carbon emissions traded increases, the carbon price in the interval also rises. The stepped carbon trading cost
Where
The integrated energy system constructed in this article includes thermal power units, wind power units, and solar photovoltaic power units. Referring to the “Management Measures for Carbon Emission Trading”, carbon quotas are allocated to each subject of integrated energy system. The calculation formula is obtained by multiplying the unit carbon quota allocation coefficient with the power generation of the units, as following Equation 40:
In the formula
The entities in the integrated energy system can purchase excess carbon emission rights in the carbon market, avoid paying fines for excess carbon emissions, and also sell excess carbon quotas to obtain profits. The formula for calculating carbon trading costs is as following Equations 41–44:
In the formula
3 Master-slave game structure
3.1 Basic framework of the master-slave game
Game theory focuses on the interaction between multiple entities, exploring strategies to maximize the interests of each entity through modeling and quantifying information exchanges, constraints, etc., Among them. In games, any action by one party will affect the other parties to varying degrees, potentially leading them to change their strategies. The actions of one party influence the interests of the other parties, prompting strategy adjustments, which in turn impact the original party’s interests, resulting in conflicts of interest.
The master-slave game, a type of game theory, is dynamic. The entity with leadership advantages occupies a favorable position in the game, making decisions first, which serve as constraints for the followers. The followers then make decisions based on the leader’s actions, and the leader updates their decision based on the followers’ responses.
The master-slave game relationship among IES entities proposed in this paper is shown in Figure 2. The leader, Energy Management Operator (EMO), and followers, Energy Generation Operator (EGO), Energy Storage Operator (ESO), and users, aim to maximize their respective benefits while considering environmental benefits in their trading strategies. This improves their operational states, achieving economic and efficient energy supply and rational and scientific energy use. EMO plays a leading and coordinating role in the energy market, balancing power sources, loads, and storage, acting as an energy pool with input and output energy flows. EMO typically purchases electricity from EGO to supply to users. If the purchase quantity cannot meet the demand, EMO must pay more to purchase electricity externally and bear the additional carbon emission costs from the grid purchase. As the leader, EMO’s advantage lies in utilizing pricing strategies to enhance the flexibility of distributed energy sources, making them more competitive in the energy market compared to traditional energy sources, and effectively incentivizing users to reasonably adjust their energy use. The core of EGO is CCHP, optimizing the output of each unit considering profits, fuel costs, and carbon trading costs. ESO formulates buying and selling strategies based on price information, which influences EGO’s energy sales strategy and users’ demand response strategies through EMO. Conversely, adjustments by EGO and users also affect the strategies of ESO and users. On the user side, shiftable loads and reducible thermal (cooling) loads are introduced, allowing users to adjust their energy demand based on energy costs, comfort, and other factors. Changes in user energy use will impact the interests and strategies of other entities.
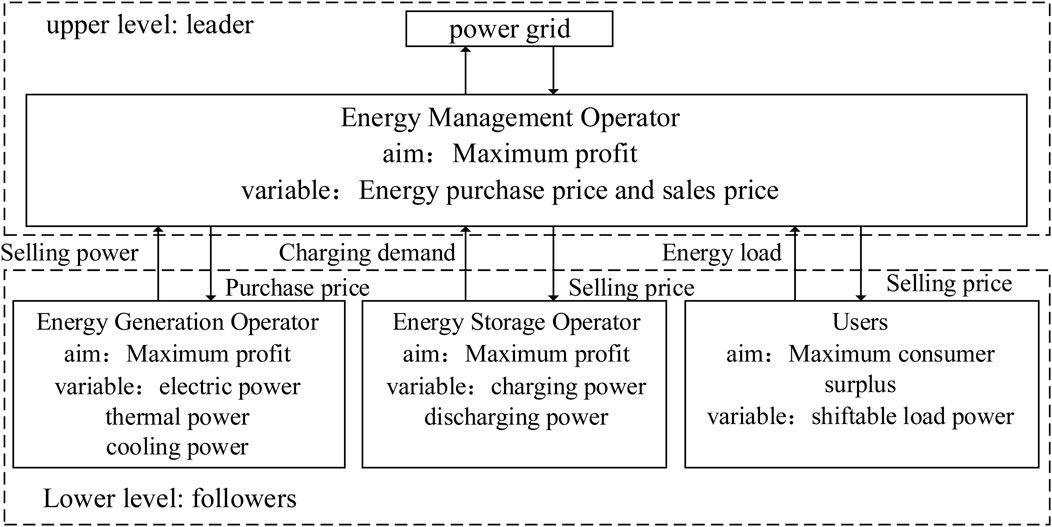
Figure 2. Master-slave game framework.
3.2 Stackelberg equilibrium
The master-slave game described in this paper depicts how EGO, ESO, and users, as followers, optimize their actions based on the leader EMO’s price decisions to achieve their optimal objectives. The Stackelberg model is as following formula:
The master-slave game model consists of three elements: participants, decision variables, and utility. Participant refers to every decision-maker involved in the game. Decision variables refer to the actions taken by participants in the game process. Utility is used to measure the level of utility obtained by participants in a game. The model constructed in this paper includes four participants: one leader EMO and three followers EGO, ESO, and users. The decision variables are: buying and selling prices
3.3 Solution method
Formula 5 is a nonlinear formula. This article linearizes the max and min functions by introducing two non negative auxiliary variables and using appropriate constraints to simulate them.
The rewritten equations are shown in Formulas 46–49:
To simulate these conditions, we can use binary variables
Constraint condition is shown in Formulas 50–54:
In summary, the following linearized model is obtained is shown in Equation 55:
Traditional optimization methods require collecting various data from participants, such as equipment parameters, user preferences, and environmental factors, but some information in the electricity market is not publicly transparent (Yang et al., 2025). Therefore, this paper adopts the Differential Evolution (DE) algorithm and the Cplex solver to solve the proposed master-slaver game model. The DE algorithm is an algorithm based on genetic algorithms (GA) that can solve multi-objective optimization problems. It is a heuristic random search algorithm based on group differences. Compared with other algorithms (GA, SA), DE, it has fewer parameters and is simpler to compute, making it commonly used to solve optimization scheduling problems in the power sector. The approximation effect of differential evolution algorithm is more significant compared to genetic algorithm. Solving the model proposed in this article belongs to high-dimensional problems. Other algorithms have slow or even difficult convergence speed for high-dimensional problems.
The solving process includes five steps: initializing the population, population mutation, crossover to form a new population, selection, and termination (Wanxing et al., 2023). As shown in the Figure 3, DE algorithm solution, initial data and parameters are first input in the upper-level, then an initial population a is generated, with the iteration count K = 0. The lower-level uses the Cplex solver to calculate the optimal results for the followers, and the leader updates its decision based on the results, calculating its own utility F1. The population a forms a new population b through mutation and crossover, and the lower-level repeats the followers’ solution and recalculates its own utility F2. A selection process follows: if F2 is greater than F1, b is assigned to a and F2 to F1, otherwise, it is retained. Finally, judgment is made. If the iteration count K meets the requirement, the final result is output; otherwise, the mutation, crossover, and other steps are repeated.

Figure 3. Flowchart for solving equilibrium solutions.
4 Case study analysis
4.1 Basic data for the case study
This paper conducts a case study analysis based on a typical region in China. The predicted curves for PV, wind power, and electric, thermal, and cooling loads in this region are shown in Figure 4. The PV generation period is from 6:00 to 18:00, mainly generating power from 9:00 to 14:00, while wind power generation is mostly from 19:00 to 24:00. The peak electricity demand occurs between 10:00 and 12:00 and 17:00 and 19:00, the peak thermal load demand between 20:00 and 22:00, and the cooling load peak between 11:00 and 16:00. The user preference coefficients for electricity, cooling, and heating are: Ve = 1.5,ae = 0.0009,Vh = 1.1,ah = 0.0011. Shiftable loads account for 20% of the total electric load, and adjustable cooling and heating loads account for 10% of the total cooling and heating loads. Other relevant IES parameters are listed in Table 1.
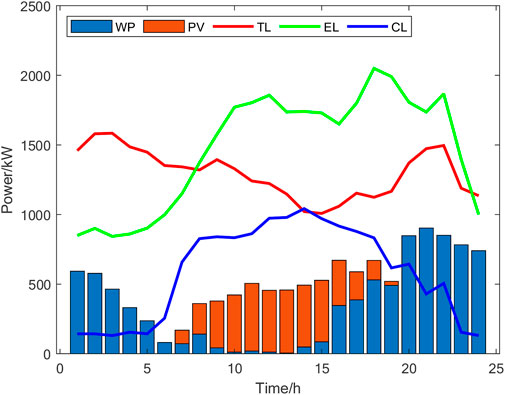
Figure 4. Predicted curves for various new energies and loads in a typical region.
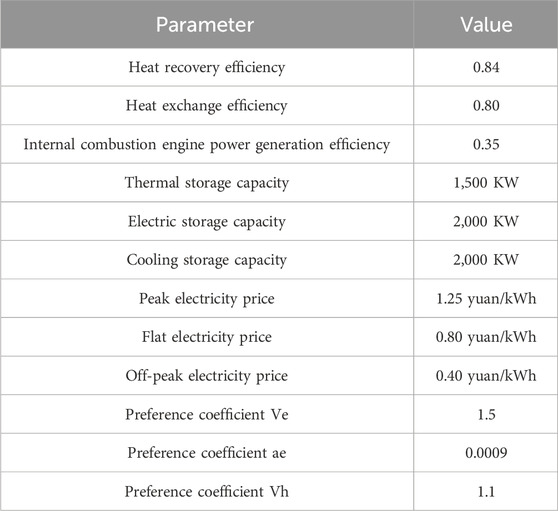
Table 1. IES-related parameters.
4.2 Results analysis
The purchase and sale pricing strategy of the upper-level EMO is shown in Figure 5. The selling price of electricity is similar to the time of use price. The heating purchase prices are higher than the lower price limit. In Figure 5A, the red and green dashed lines represent the time-of-use electricity price and the on-grid electricity price, respectively. EMO determines the pricing strategy within this range to provide EGO and users with more favorable prices than the grid. The electricity purchase price and load demand vary similarly at different times. The electricity prices are higher between 12:00–13:00 and 22:00–23:00, reaching 0.60 yuan/kWh and 0.63 yuan/kWh, respectively. During these periods, PV and wind power generation are higher, and the higher purchase price encourages more renewable energy generation, reducing the need to purchase electricity from the grid to increase profits. The trend in EMO’s electricity sales prices is similar to the grid’s time-of-use electricity prices, with higher prices between 11:00–14:00 and 17:00–21:00, reaching 1.25 yuan/kWh. In Figure 5B, the red and green dashed lines represent the upper and lower limits of heating prices in North China, respectively. EMO similarly determines purchase and sale prices within this envelope. The heating sale prices reach the upper limit during multiple periods, such as 3:00–4:00, 6:00–9:00, 12:00–14:00, 15:00–16:00, and 20:00–21:00. The heating purchase prices peak at 7:00–8:00, 11:00–12:00, and 22:00–23:00.
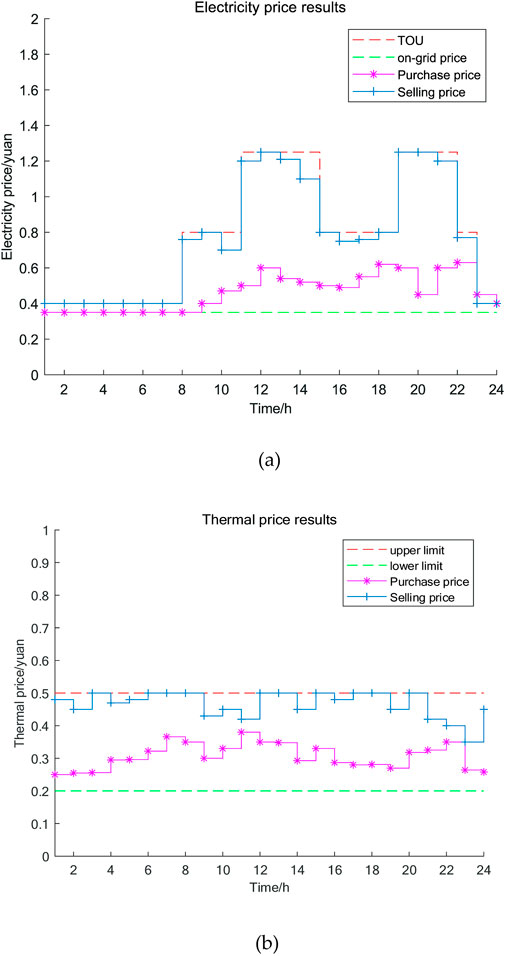
Figure 5. Hourly Electricity and Thermal Price Curves. (A) Electricity price curve chart, (B) Thermal price curve chart.
Figure 6 shows the electric, thermal, and cooling load curves on the user side before and after demand response. The EL curve presents an M-shape and CL curve presents an N-shape. The TL curve shows a trend of low in the middle and high on both sides. From Figure 6A, under the influence of electricity price incentives, the electric load curve before and after demand response shows a “peak shaving and valley filling” change, reducing the total electricity cost. Before demand response, the peak electric load occurred between 18:00 and 19:00, reaching 2050 kW, with other peaks at 12:00–13:00 and 22:00–23:00, reaching 1857 KW and 1867 kW, respectively. The electric load valleys occurred between 0:00–7:00 and 23:00–24:00, with the lowest value being 847 KW. After demand response, the peak value dropped to 1874 kW, and the lowest value increased to 980 kW, with a noticeable load shift. In Figure 6B, the thermal load curve also achieved “peak shaving and valley filling”. Before demand response, peaks occurred at 2:00–3:00 and 21:00–22:00, reaching 1584 KW and 1496 kW, respectively. The period between 10:00–17:00 showed a downward trend before rising, with a valley value of 1008 KW. After optimization, the peak value dropped to 1433 kW, and the valley value increased to 1087 KW. Figure 6C shows the cooling load curve, also exhibiting “peak shaving and valley filling”. Cooling demand was high between 8:00–18:00 and low between 0:00–6:00 and 23:00–24:00. Before optimization, the peak cooling load occurred at 14:00–15:00, reaching 1042 kW, with a low demand of about 135 KW between 0:00–4:00 and 23:00–24:00. Through demand response, the peak cooling load dropped to 922 kW, and the valley value increased to 251 KW. This proves that the optimization model proposed in this paper can reduce energy costs and improve energy economy while ensuring user comfort.
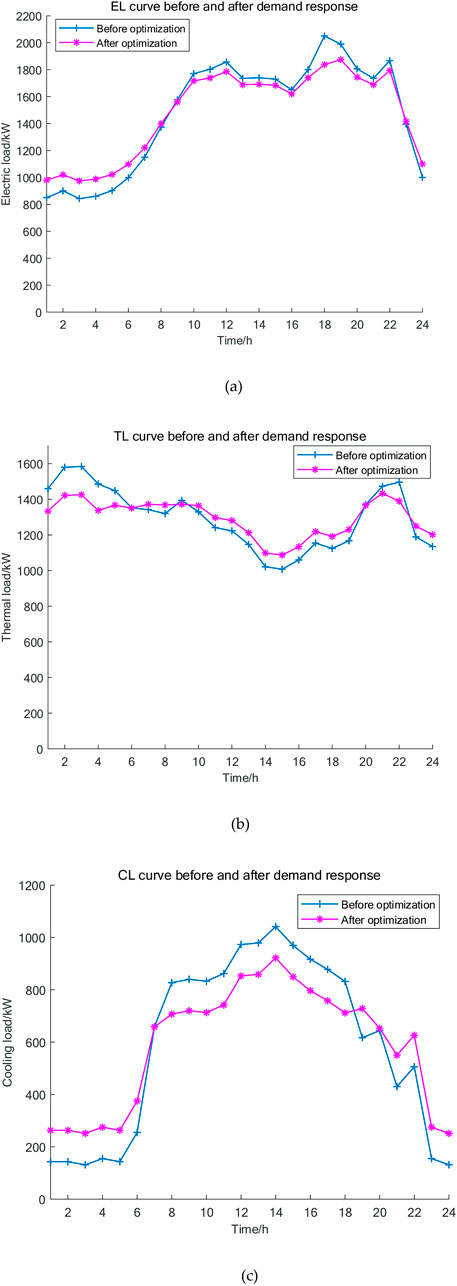
Figure 6. Load Curves. (A) Electric load curve chart, (B) Thermal load curve chart, (C) Cooling load curve chart.
Figure 7 shows the optimized scheduling of electricity, thermal, and cooling in the IES. Wind and PV power generation are low-carbon, so EGO prioritizes selling renewable energy to EMO. When the supply is insufficient, other gas-fired units are activated to supplement wind and PV shortfalls. For example, between 23:00–6:00, the period of off-peak electricity prices is mainly covered by wind power. During periods of high electricity demand such as 10:00–13:00 and 17:00–22:00, wind and PV power are fully utilized, and gas-fired units increase output to make up for the missing energy, while surplus energy is stored in ESO’s BT. During peak electricity demand periods such as 17:00–19:00, EGO limits the output of gas-fired units to some extent after analyzing energy prices and operational costs. If EGO cannot meet the load demand, EMO will purchase electricity from the grid to make up for the shortfall. Gas turbines generate heat during power generation, which is proportional to the electricity generated. Utilizing waste heat can reduce heating costs. EMO encourages the gas boiler’s output through pricing policies, and coordinating with the heat recovery boiler can effectively avoid penalties for heating interruptions, ensuring a stable heat supply. When the heat supply cannot be met, ESO compensates by releasing stored heat from HST during high-price periods. Cooling demand is relatively low, and ice storage air conditioners provide cooling through both air conditioning and ice melting modes, with air conditioning as the primary method. During peak cooling periods such as 8:00–20:00, the ice storage air conditioning system will additionally activate the ice melting mode, and ESO’s storage devices will supplement the cooling demand.
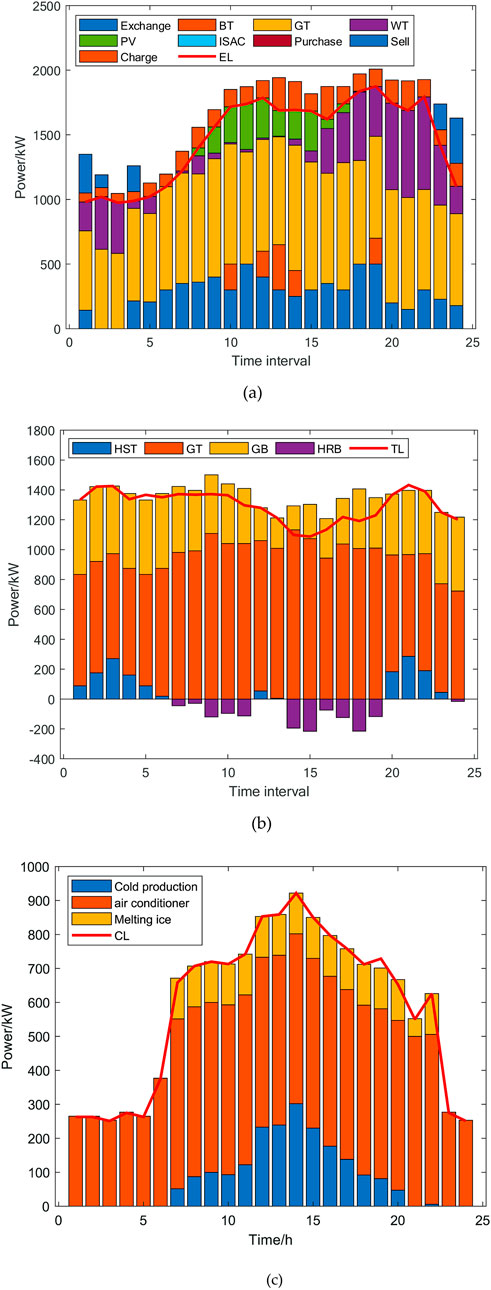
Figure 7. Energy Optimization Scheduling. (A) Electric energy optimization scheduling diagram, (B) Thermal energy optimization scheduling diagram, (C) Cold energy optimization scheduling diagram.
After optimization, EMO reduces the amount of external electricity purchased, and ESO mitigates the output pressure on EGO units by charging during low-price periods and discharging during high-price periods, providing users with more affordable energy prices. This helps reduce EMO’s external electricity purchase costs and users’ electricity costs. Table 2 compares the profits of each IES entity and total carbon emissions before and after optimization. The introduction of stepped carbon trading has reduced IES carbon emissions by 11%. Higher carbon emissions will result in paying more expensive fees. It can be calculated from the Table 2 that profits of EMO increase 34%. After optimization through the master-slave game model, energy supply and demand have reached a balance. There is no need to purchase electricity from external sources at high prices during peak periods, nor is there a need to sell surplus electricity at low prices during low periods. Profits of EGO increase 46%. After optimization EGO obtains more benefits through reasonable planning of power generation. Profits of ESO increase 31%. ESO purchases excess wind and photovoltaic power during low periods and sell it during peak periods to seek more profits. Profits of users increase 7%. By introducing a demand response mechanism, users have changed their electricity usage habits, resulting in increased revenue.
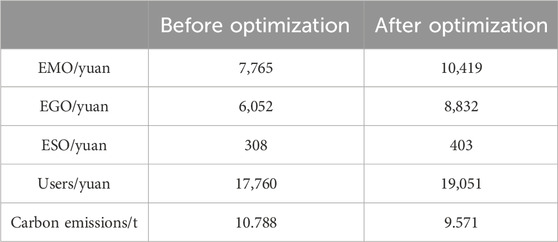
Table 2. IES profits and carbon emissions.
Figure 8 shows the comparison of power output of thermal power units before and after considering carbon trading. Without considering carbon trading, thermal power units output between 8:00–23:00. After considering carbon trading, output is reduced between 2:00–7:00. This is because the addition of carbon trading mechanisms requires thermal power units in the integrated energy system to pay more expensive fees for carbon emissions.
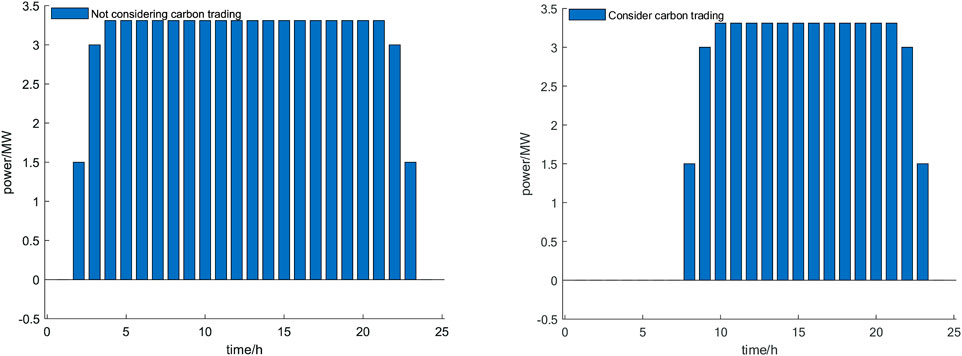
Figure 8. Comparison chart of thermal power units.
5 Conclusions and insights
This paper incorporates comprehensive demand response and a stepped carbon trading mechanism to propose a master-slave game model for IES, where the Energy Manager acts as the leader and the Energy Operator, Energy Storage Operator, and users as followers. The model is solved using intelligent algorithms and solvers to achieve equilibrium, optimizing the operation of each entity. The following conclusions were drawn:
(1) The master-slave game model constructed in this paper considers users’ energy use experience, allowing users to plan their energy purchases reasonably based on their energy needs and preferences. This effectively reduces energy costs, improves user benefits and satisfaction, and better motivates users to use energy economically and rationally. Profits of EMO, EGO, ESO and users have respectively increased 34%, 46%, 31% and 7%.
(2) Introducing a demand response mechanism to effectively tap into the flexible operational potential of the load side in the integrated energy system, achieving peak shaving and valley filling and promoting the consumption of wind and photovoltaic power generation.
(3) Compared to a one-leader-one-follower model, this master-slave game model better enhances the economy of IES, balances the interests of all entities, and ensures the reliability of energy supply and the flexibility of energy use.
(4) The model considers the interaction between source-load-storage by having EMO issue price signals to incentivize EGO to prioritize wind and PV output, and coordinate with ESO to ensure timely consumption of renewable energy, while reducing the overall operational costs of IES.
(5) Introducing stepped carbon trading into the master-slave game model studies the decision-making behavior of each entity under a low-carbon background, balancing the economic benefits of IES with environmental costs, and achieving low-carbon optimized operations. The carbon emissions of the system have decreased 11%.
The case study proves that the master-slave game model constructed in this paper is conducive to solving interaction problems among multiple entities, and the equilibrium solution obtained provides reference value for decision-makers of each entity. With the development of IES, participating agents may be unwilling to share all information with other agents. Future research should focus on a series of issues related to incomplete information in IES and use game theory to promote rational decision-making.
Data availability statement
The original contributions presented in the study are included in the article/supplementary material, further inquiries can be directed to the corresponding authors.
Author contributions
YZ: Writing–original draft. ZZ: Writing–original draft.
Funding
The author(s) declare that financial support was received for the research, authorship, and/or publication of this article. This paper was funded by the National Social Science Foundation (Grant no. 19BGL003).
Conflict of interest
The authors declare that the research was conducted in the absence of any commercial or financial relationships that could be construed as a potential conflict of interest.
Publisher’s note
All claims expressed in this article are solely those of the authors and do not necessarily represent those of their affiliated organizations, or those of the publisher, the editors and the reviewers. Any product that may be evaluated in this article, or claim that may be made by its manufacturer, is not guaranteed or endorsed by the publisher.
References
Chen, W., Sheng, C., Jingtao, Z., Yizhou, Z., Zhinong, W., and Shu, Z. (2024). Coordinated scheduling of integrated electricity, heat, and hydrogen systems considering energy storage in heat and hydrogen pipelines. J. Energy Storage 85, 111034. doi:10.1016/J.EST.2024.111034
Chenyun, P., Hongtao, F., Zhang, R., Sun, J., Wang, Y., and Sun, Y. (2023). An improved multi-timescale coordinated control strategy for an integrated energy system with a hybrid energy storage system. Appl. Energy 343, 121137. doi:10.1016/j.apenergy.2023.121137
Chongchao, P., Tai, J., Wang, G., Hou, X., and Gu, Y. (2023). Multi-objective and two-stage optimization study of integrated energy systems considering P2G and integrated demand responses. Energy 270 (2), 126846. doi:10.1016/j.energy.2023.126846
Hong, L., Xiaoshuo, L., Chang, C., and Jin, Q. (2023). A new power flow model for combined heat and electricity analysis in an integrated energy system. Appl. Therm. Eng. 219 (PB), 119597. doi:10.1016/j.applthermaleng.2022.119597
Hongbo, R., Zipei, J., Wu, Q., Li, Q., and Lv, H. (2023). Optimal planning of an economic and resilient district integrated energy system considering renewable energy uncertainty and demand response under natural disasters. Energy 277, 127644. doi:10.1016/j.energy.2023.127644
Hongle, L., Lizhong, X., Yu, P., Tinajero, G. D. A., Guan, Y., Yan, Q., et al. (2024). Dual-Stackelberg game-based trading in community integrated energy system considering uncertain demand response and carbon trading. Sustain. Cities Soc. 101, 105088. doi:10.1016/j.scs.2023.105088
Hui, X., Feiyu, L., Zeng, L., Zhao, W., Wang, J., and Li, Y. (2023). Optimal scheduling of regional integrated energy system considering multiple uncertainties and integrated demand response. Electr. Power Syst. Res. 217 (2), 109169. doi:10.1016/j.epsr.2023.109169
Li, Ke, Ye, N., Li, S., Wang, H., and Zhang, C. (2023). Distributed collaborative operation strategies in multi-agent integrated energy system considering integrated demand response based on game theory. Energy 273 (1), 127137. doi:10.1016/j.energy.2023.127137
Meijuan, Z., Jiahui, Y., Pengshuo, Y., Tinajero, G. D. A., Guan, Y., Yan, Q., et al. (2024). Dual-Stackelberg game-based trading in community integrated energy system considering uncertain demand response and carbon trading. Sustain. Cities Soc. 101, 105088. doi:10.1016/j.scs.2023.105088
Peihong, Y., Hui, J., Liu, C., Kang, L., and Wang, C. (2023). Coordinated optimization scheduling operation of integrated energy system considering demand response and carbon trading mechanism. Int. J. Electr. Power Energy Syst. 147 (6), 108902. doi:10.1016/j.ijepes.2022.108902
Peng, L., Shuang, L., Hao, Y., Jinyue, Y., Haoran, J., Jianzhong, W., et al. (2022). Quantized event-driven simulation for integrated energy systems with hybrid continuous-discrete dynamics. Appl. Energy, 307. doi:10.1016/J.APENERGY.2021.118268
Peng, L., Zixuan, W., Wang, J., Yang, W., Guo, T., and Yin, Y. (2021). Two-stage optimal operation of integrated energy system considering multiple uncertainties and integrated demand response. Energy 225, 120256. doi:10.1016/j.energy.2021.120256
Pinghui, J., Xin, C., Wang, L., Chen, J., Zhao, Y., and Cao, Y. (2023). Flexibility operation for integrated energy system considering hydrogen energy under inertia characteristics and stepped carbon trading mechanism. Sustain. Cities Soc. 98, 104809. doi:10.1016/j.scs.2023.104809
Ruitian, W., Xiangyuan, W., Wang, X., Fu, Y., and Zhang, Y. (2022). Low carbon optimal operation of integrated energy system based on carbon capture technology, LCA carbon emissions and ladder-type carbon trading. Appl. Energy 311 (7), 118664. doi:10.1016/j.apenergy.2022.118664
Shahidehpour, M., Shen, F., Ping, J., Chong, W., Zhiyi, L., and Xingyu, S. (2019). Singular perturbation for the dynamic modeling of integrated energy systems. IEEE Trans. Power Syst. 35 (3). doi:10.1109/TPWRS.2019.2953672
Shuai, Y., Wei, G., Jianzhong, W., Hai, L., Suhan, Z., Yue, Z., et al. (2022). Dynamic energy flow analysis of the heat-electricity integrated energy systems with a novel decomposition-iteration algorithm. Appl. Energy, 322. doi:10.1016/J.APENERGY.2022.119492
Song, Y., Mu, H., Li, N., Wang, H., and Kong, X. (2024). Optimal scheduling of zero-carbon integrated energy system considering long-and short-term energy storages, demand response, and uncertainty. J. Clean. Prod. 435, 435140393. doi:10.1016/j.jclepro.2023.140393
Songrui, L., Lihui, Z., Nie, L., and Wang, J. (2022). Trading strategy and benefit optimization of load aggregators in integrated energy systems considering integrated demand response: a hierarchical Stackelberg game. Energy 249, 123678. doi:10.1016/j.energy.2022.123678
Wanxing, S., Rui, L., Hui, H., Lin, K. P., Lan, K. M., Ren, Q., et al. (2023). Optimal wind power generation system by honey badger algorithm with differential evolution strategies. Appl. Soft Comput. 149, 110953. doi:10.1016/j.asoc.2023.110953
Xiaohui, Y., Zhonglian, Z., Mei, L., Wang, X., Deng, Y., Wei, S., et al. (2023). Optimal configuration of improved integrated energy system based on stepped carbon penalty response and improved power to gas. Energy 263 (52), 125985. doi:10.1016/j.energy.2022.125985
Yang, J., Yang, M., Ma, K., Dou, C., and Ma, T. (2024b). Distributed optimization of integrated energy system considering demand response and congestion cost allocation mechanism. Int. J. Electr. Power Energy Syst. 157, 157109865. doi:10.1016/j.ijepes.2024.109865
Yang, S., Lao, K.-W., Hui, H., and Chen, Y. (2024a). Secure distributed control for demand response in power systems against deception cyber-attacks with arbitrary patterns. IEEE Trans. Power Syst. 39 (6), 7277–7290. doi:10.1109/tpwrs.2024.3381231
Yang, S., Lao, K.-W., Hui, H., Su, J., and Wang, S. (2025). Secure frequency regulation in power system: a comprehensive defense strategy against fdi, DoS, and latency cyber-attacks. Appl. Energy 380, 124772.
Yongli, W., Zhen, L., Jingyan, W., Du, B., Qin, Y., Liu, X., et al. (2023). A Stackelberg game-based approach to transaction optimization for distributed integrated energy system. Energy 283, 128475. doi:10.1016/j.energy.2023.128475
Yuanyuan, Z., Huiru, Z., Li, B., and Wang, X. (2022). Research on dynamic pricing and operation optimization strategy of integrated energy system based on Stackelberg game. Int. J. Electr. Power Energy Syst. 143 (1), 108446. doi:10.1016/j.ijepes.2022.108446
Yunfei, M., Congshan, W., Yan, C., Hongjie, J., Qingzhu, Z., and Xiaodan, Y. (2022). A CVaR-based risk assessment method for park-level integrated energy system considering the uncertainties and correlation of energy prices. Energy, 247. doi:10.1016/J.ENERGY.2022.123549
Keywords: master-salve game, stepped carbon trading, integrated energy system, demand response, differential evolution
Citation: Zhang Y and Zhang Z (2025) Consider the master-slave game model of integrated energy system with step carbon trading and demand response. Front. Energy Res. 13:1501577. doi: 10.3389/fenrg.2025.1501577
Received: 25 September 2024; Accepted: 31 January 2025;
Published: 04 March 2025.
Edited by:
Haifeng Qiu, Nanyang Technological University, SingaporeReviewed by:
Maneesh Kumar, Indian Institute of Technology Roorkee, IndiaXinglei Liu, Xi’an Jiaotong University, China
Bin Xiong, Guangxi University, China
Wu Ruiming, Shanghai Jiao Tong University, China
Copyright © 2025 Zhang and Zhang. This is an open-access article distributed under the terms of the Creative Commons Attribution License (CC BY). The use, distribution or reproduction in other forums is permitted, provided the original author(s) and the copyright owner(s) are credited and that the original publication in this journal is cited, in accordance with accepted academic practice. No use, distribution or reproduction is permitted which does not comply with these terms.
*Correspondence: Zhezhou Zhang, OTMxMTM2MTFAcXEuY29t