 Katumwesigye Anthony
 Magnus Hellström
 Jonas Spohr
- Faculty of Science and Engineering, Åbo Akademi University, Åbo, Finland
The application of hydrogen in modern farming is transitioning from a conceptual idea to a practical reality, poised to meet future agricultural machinery requirements and transition goals. Increasing tensions between farmers and various institutions underscore the growing sensitivity around fossil fuel dependency in the agricultural sector, particularly in northern economies. This study investigates the economic feasibility of using decentralized hydrogen systems to fully replace fossil fuels in cereal crop farming across four agricultural zones. Specifically, it examines the economic viability of on-farm hydrogen production using electrolysers to meet the fuel needs of different farm structures. Various scenarios were modelled to assess the impact of switching to hydrogen fuel for annual farm operations, using Net Present Value (NPV) and Levelized Cost of Hydrogen (LCOH) metrics for hydrogen refuelling facilities on distinct farm structures. The results indicate that economic feasibility is a significant challenge, with LCOH reaching as high as 57 €/kg of hydrogen in some cases, while the best-case scenarios achieved LCOH as low as 7.5 €/kg. These figures remain significantly higher than those for diesel and alternative fuels such as methane, FAME, and HVO. The study also assessed strategies for reducing hydrogen production costs using low-cost electricity and maximizing plant efficiency by increasing the electrolyser utilization rate to 70%. Additionally, the potential for revenue generation through the sale of by-products was explored. Our findings highlight both the challenges and opportunities associated with hydrogen use in agriculture, emphasizing the critical role of access to renewable energy sources and the economic limitations of by-product revenue streams. In conclusion, while decentralized hydrogen production can contribute to emission reductions in cereal crop farming, further research and policy support are essential to improve its feasibility and sustainability.
Introduction
The market for green hydrogen exceeded USD 9.6 million in 2023 and is expected to grow at a CAGR of over 31% from 2024 to 2032. The reason for this increase is due to the growing demand for cleaner fuel alternatives and concerns over carbon emissions. In the agricultural sector, hydrogen is already being used for tasks such as grain drying and cooling through hydrogen generators, and in specific farming machinery like electric tractors to improve energy efficiency and reduce carbon emissions (Conklin, 2023). Supporting data from1 Our World in Data (2020) places agriculture as the fourth largest contributor to per capita greenhouse gas (GHG) emissions, with a footprint of 0.75 tonnes of CO2 equivalent. This places agriculture just behind the leading sectors of electricity and heat production (1.94 tonnes CO2 equivalent), transportation (0.93 tonnes CO2 equivalent), and manufacturing and construction (0.79 tonnes CO2 equivalent), underscoring the importance of targeted emission reduction strategies in the agricultural sector to address its significant environmental impact.
Fuel consumption is a significant factor in modern agriculture, especially in crop farming, as it directly impacts the economic viability and environmental sustainability of farming practices. Agricultural field machinery currently relies almost exclusively on internal combustion engines, 75% of these engines in the US and EU are powered by diesel oil (Lagnelöv et al., 2020). Diesel oil, characterised by its high energy density and safe handling, is an indispensable energy source for agricultural machinery, particularly tractors. Tractors, harvesters, and drying machines are the primary fuel consumers on farms, making them critical contributors to the energy consumption of each farm (CEMA, 2022). Tractors, in particular, are the backbone of modern farms and are extensively used for tasks such as ploughing, planting, and harvesting, making them the primary consumers of farm fuel (Farias et al., 2017). Similarly, harvesters, used for reaping crops, require intensive fuel consumption over shorter periods, and they draw significant quantities during peak harvesting times. Therefore, evaluating energy usage on agricultural farms is imperative, given the growing concerns about energy prices in the current world market and the pressing need to reduce greenhouse gas emissions (Giampietro, 2003).
The transition to alternative fuel sources in off-road transport systems, such as farm tractors, has gained significant momentum in recent years. This shift, largely motivated by the desire to move away from traditional fossil fuels, encompasses the use of fuels like methanol and hydrogen, as well as the adoption of electrification through battery packs (Caban et al., 2018; Ewald Luger, 2021). These initiatives aim to foster more sustainable and environmentally friendly practices within the agricultural sector, where fuel is extensively utilized for transportation, operating tractors and machinery, and irrigation. The rising costs of fossil fuels have notably impacted the economics of crop production, especially for those crops heavily reliant on machinery operations with high fuel consumption (Stakens et al., 2023). This has led to a faster increase in production costs compared to other crops, driven in part by escalating fuel prices.
Simultaneously, there has been a significant evolution in regulatory frameworks aiming to curtail emissions from off-road diesel engines. This has resulted in the implementation of more stringent emission standards for agricultural machinery engines in Europe and the United States, as discussed by Tim and Aparna (2016). Consequently, these regulations have influenced farmers’ crop choices, leading them to prefer crops that require less fuel to produce, thereby maximizing profitability (Safa and Samarasinghe, 2013). So far, the GHG emissions from offroad machinery have not been regulated. In October 2023, the Californian Air Resources Board announced that they are considering a 6% reduction in CO2 emissions in their upcoming Tier 5 regulation.2
Our study acknowledges a dual challenge in the agricultural sector: its fuel energy footprint is both an environmental issue and the existing challenges with the use of alternative fuels at the farm can potentially lead to production- and economic problems at the transitioning farm. This duality intertwines the concerns of maintaining a stable food supply with the imperative of environmental protection which scrutinizes machinery use in the sector. While our research acknowledges these intertwined dilemmas, it primarily concentrates on exploring the decarbonization pathways within the sector. Offroad engine application have such pathways in common with other so-called hard-to-abate sectors, notably maritime transportation (Hellström et al., 2023). Lots of studies have recently been devoted to alternative fuels for ships, for which the production pathway typically builds on largescale, centralized production facilities (Seithe et al., 2020; Fan et al., 2021; Korberg et al., 2021). However, farm machinery applications offer an interesting opportunity to explore farm-scale, decentralized production of alternative fuels. For example, biogas has been studied extensively over the past decade or so. With the introduction of hydrogen engines, decentralized production has become an interesting option. To date, few studies have investigated hydrogen usage in agricultural machinery in a systematic way that incorporates the fuel usage patterns of agricultural machinery on farms. Most of these studies have been limited to investigating machinery powertrain transitioning by introducing new concepts of machinery that use different energy sources like batteries, Fuel cells, and modified engines that can accommodate different fuel blends. However, they have not sufficiently discussed the implications of adopting these new technologies from a farm operations level perspective.
In the dynamic landscape of agricultural innovation, where there’s a burgeoning market for new tractor powertrains and machinery design is evolving to comply with stricter emission standards, hydrogen fuel emerges as a promising alternative. This transition to a certain degree is not solely about meeting environmental objectives; it also encompasses a crucial business dimension. The end goal of this transition is to achieve emission reduction while simultaneously ensuring that agricultural operations can be sustained economically amid escalating fuel prices and rigorous environmental mandates (Ewald Luger, 2021; CEMA, 2022). Therefore, the purpose of this study is to evaluate the environmental and economic sustainability of hydrogen technologies applied to farm-level agricultural practices.
The paper is organized as follows: it begins with an overview of decarbonization pathways and technologies currently implemented in the agricultural machinery sector, drawing on various literature sources. It then details the methodology used to assess fuel usage in agricultural machinery across different farm structures. The analysis further examines the implications of transitioning to a hydrogen-based fuel system in farms, concluding with a techno-economic assessment of the findings to establish the economic viability of renewable agricultural fuel systems in varying geographical farm settings.
Literature review
Decarbonisation of farming using hydrogen
Decarbonization options for agriculture encompass a broad spectrum of practices, ranging from crop rotation and precision farming to the adoption of renewable energy sources. Central to this transformation is the modernization of farm machinery – a shift from diesel-powered to electric or hydrogen-fueled vehicles and equipment (CEMA, 2022). New Holland (Germany-based manufacturer) introduced the second generation of its hydrogen-powered tractor, the NH2™, in 2012. This innovative model, built upon a conceptual design, employs a fuel cell to generate power for its electric drive train motors (Fuel Cells Bulletin, 2021). Despite the groundbreaking nature of this technology, infrastructure in Germany, like most other places, was not yet sufficiently developed to fully support the widespread adoption of such advanced machinery. This highlighted a broader challenge: transitioning to greener agricultural practices demands not just investment in cutting-edge technologies but also in the underlying infrastructure. The challenges posed by infrastructure, namely limited charging, and refueling points, as well as handling and storage issues related to hydrogen, have produced apprehensions regarding safety at refueling stations, which are essential to the successful implementation of these innovative technologies (Bhandari and Shah, 2021).
The production of hydrogen, which is pivotal for the clean energy transition in agriculture, is categorized into grey, blue, and green, reflecting the carbon intensity of each production method (Hermesmann and Müller, 2022). Grey hydrogen, produced from fossil fuels, is associated with high carbon emissions, whereas blue hydrogen mitigates this impact through carbon capture and storage techniques. Green hydrogen stands out as the most eco-friendly option, utilizing renewable energy sources to generate hydrogen through water electrolysis (Montenegro Camacho et al., 2017; EU Commision, 2022; Nasser and Hassan, 2023).
There is a possibility towards decentralizing hydrogen production, facilitating on-site generation at farms, not only addresses distribution challenges but also promotes sustainable agricultural practices (Janke et al., 2020). Despite its potential, this decentralized approach is impeded by significant obstacles, including high upfront costs, technological complexities, and substantial capital requirements for implementation (Fuel Cells Bulletin, 2021). Currently, hydrogen production is predominantly reliant on fossil fuel processes, such as steam reforming of natural gas (accounting for 76% of production) and coal gasification (23%), which contribute to greenhouse gas emissions (Aydin and Dincer, 2022; Hermesmann and Müller, 2022). However, there is a growing focus on shifting towards low-carbon hydrogen as a vital energy carrier, projected to increase its production capacity from 120 million tons per annum in 2020 to 530 million tons by 2050, highlighting its importance in achieving a low-carbon economy (Paris et al., 2021). This shift is crucial as scientists and policymakers alike recognize the need to reduce reliance on non-renewable energy sources and mitigate the environmental impacts associated with traditional hydrogen production methods (Dincer, 2012; IEA, 2019; Hermesmann and Müller, 2022).
Recent studies on the economic feasibility of farm-scale hydrogen production have shown mixed results, with the cost of hydrogen production and the required infrastructure investments being significant factors (Dincer and Acar, 2015; Aydin and Dincer, 2022; Breuer et al., 2022; EU Commission, 2022). This is primarily because authors have not been able to reach a uniform approach to solve the major challenges identified prior which have rendered hydrogen at present an unfeasible alternative due to the costs of technical requirements needed to facilitate its safe use in decentralized settings. Despite these challenges, the long-term benefits of transitioning to hydrogen, including reduced carbon emissions and lower operational costs, provide a compelling case for its adoption in farming (IEA, 2019).
Evaluating the feasibility of an on-farm fuel production system requires quantifying the amount of fuel consumed by the farm machines. However, it is equally important to consider the broader impact of fuel usage on the overall energy profile of the farming system. Research has shown that the emission footprint attributable to the use of fossil fuels by agricultural machinery ranges from 10% to 35% of total emissions from agricultural energy inputs, which encompass all energy used in agricultural operations in cereal crop farms were the majority of the studied cases (Dyer and Desjardins, 2003; Larry, 2008; Roberto Henke, 2021; Abbas et al., 2022a; Abbas et al., 2022b). Authors broadly agree that the factors influencing fuel consumption on a farm are varied, with machinery usage being a significant basis. Abbas et al. (2022b) underscores the significance of the notion of agricultural and environmental sustainability as a means of minimizing the depletion of natural resources while simultaneously increasing crop production. Consequently, thorough evaluations of energy resource inputs and outputs are crucial to ascertain the resilience and sustainability of a system (Abbas et al., 2022a).
Brynolf et al. (2018) identified a major challenge with alternative fuels for tractor engines: despite their lower power and energy output, they are costlier than standard diesel. To mitigate this economic barrier, farms could potentially adopt a strategy of localized/decentralized, small-scale production of fuels, particularly hydrogen, for their own use, as suggested by Janke et al. (2020). However, while Janke et al. (2020) examined the concept of decentralized hydrogen production, their research did not adequately address the diverse fuel usage patterns in different agricultural settings. Specifically, their methodology in designing hydrogen energy system modelling leaves room for debate, primarily because it did not adequately consider the variables that influence fuel consumption in agricultural machinery across various settings. The reliance on generalized assumptions about annual tractor mileage, and consequently annual fuel consumption, may not accurately reflect the nuanced demand for hydrogen in the farming sector (Janke et al., 2020).
On-farm hydrogen investment requirement
Transitioning agricultural machinery to hydrogen fuel requires significant initial investments but offers considerable long-term economic and environmental benefits (Charles, 2021; CEMA, 2022). Concerning on-farm hydrogen applications, the upfront costs are dominated by the acquisition and installation costs of electrolysers, which are crucial for generating hydrogen from water using electricity. These setups, along with the necessary storage and compression facilities, can incur annual electricity costs of approximately $50,000 to $60,000, assuming the electricity is sourced externally rather than produced on-site systems (H. Mousazadeh et al., 2010; Carroquino et al., 2019; Charles, 2021). Studies have indicated that the costs of electrolysers range from $1,000 to $3,500 per kW for capacities between 1–10 MW in the United States and EU, with costs potentially dropping to $320–$400 per kW for larger scale electrolysers as capacity increases by 2030 electrolysers (Janke et al., 2020; Micena et al., 2020; Reksten et al., 2022).
Additionally, the capital costs for hydrogen fuelling standalone systems are increased by the need for auxiliary devices. These include a compressor unit costing €394,398, a cooling unit priced at €140,000, a dispenser at €107,000, and storage costs that vary with hydrogen tank size, ranging from €632 to €800 per kg of hydrogen depending on the supplier. These figures underscore the financial commitment required upfront, balanced by the promise of future rewards in sustainability and cost savings (Porter and Michael, 2014; Grüger et al., 2018; Bhandari and Shah, 2021).
Moreover, integrating renewable energy sources like wind parks and solar grids on the farm itself significantly boosts the economic viability of these hydrogen systems (Porter and Michael, 2014; Micena et al., 2020). This integration not only strengthens the business case but also utilizes the farm’s existing resources to enhance sustainability and cost-effectiveness. Such operational efficiencies help amortize initial costs over time. Furthermore, producing hydrogen on-site for ammonia (NH3) fertilizer can greatly reduce both fuel and fertilizer expenses, substantially lowering long-term operational costs. For example, a large 2800-acre US farm that annually spends $120,000 to $135,000 on fuel and fertilizers for dryland crop cultivation could see a reduction in operational costs by $38,000 to $67,000 through the implementation of solar photovoltaic systems for electricity generation (Charles, 2021). This approach not only ensures resource conservation but also offers significant financial savings, making it a compelling option for sustainable agricultural operations.
The major issue with existing research on hydrogen application in farming is the overgeneralization of fuel consumption patterns on agricultural farms. Case studies suggest that hydrogen fuel cells operate at an estimated efficiency of 57%, significantly surpassing the 45% peak efficiency of diesel engines (Lajunen et al., 2018). Yet, unlike diesel oil that can be easily stored on farm, hydrogen faces high storage costs. This implies that farms should utilize strategies that rely on spot usage and projected energy consumption. Therefore, our research methodology also takes into consideration the variation in these consumption patterns over different agricultural settings as will be detailed in the following section.
Overall, while the transition to hydrogen fuel in agricultural machinery requires high initial investments, particularly in technical equipment and energy solutions, it is expected to offer a viable path toward reducing long-term operational costs and fostering sustainable farming practices. The central guide to the execution of the study was to quantify the techno-economic implications of such systems being implemented by actual case farms in various settings, as will be elaborated in the next section.
Methodology
Research process
We conducted a detailed techno-economic assessment to evaluate the feasibility of producing hydrogen on a small scale and in a decentralized manner, as a sustainable and eco-friendly alternative to diesel fuel for farm tractors. To systematically address our research objectives, the methodology is structured around three principal steps:
I. Fuel consumption modelling: This step focuses on quantifying the fuel consumption and associated emissions of farm machinery within a calendar year. By considering variables such as geographic location, cropping practices, and land size, we aim to develop a predictive model that estimates the annual fuel needs and emission outputs of diverse farm structures, providing a granular understanding of their fuel energy profiles.
II. Dimensioning of the hydrogen production and refuelling plant: Building on the consumption patterns identified, the study progresses to the conceptualization of a hydrogen refuelling station tailored to each farm’s specific requirements. The design criteria ensure the refuelling infrastructure can satisfy the entirety of the energy demands posed by agricultural operations, facilitated by an optimally sized electrolyser and a hydrogen storage system designed to offer a minimum two-day demand buffer.
III. Economic Analysis: The final facet of our methodology involves an economic evaluation, leveraging the concept of the Net present value to investigate the levelized cost implications for farms adopting hydrogen fuelling solutions. This analysis is critical for understanding the financial viability and environmental payoff of transitioning to hydrogen fuel, considering both immediate and long-term perspectives.
Fuel consumption modelling
This section of the study is structured to methodically examine such inputs and outputs for individual farms, much of this will not be discussed in this article as the topic has already been greatly discussed by studies employing a life cycle assessment concepts (Weidema and Meeusen, 2000; Safa and Samarasinghe, 2013; Abbas et al., 2022a; Tihanov and Ivanov, 2021). While the focus on outputs has predominantly been on emission footprints, this study also scrutinises into the inputs, categorizing them into direct energy inputs (such as fossil fuels) and indirect energy inputs (including energy embedded in machinery, energy for fertilizer manufacturing, and electricity used for drying and irrigation). Contrary to including the whole farm energy profile, for the case of this study, the investigation only presents the findings of fossils (fuel + lubricant). This is because if green hydrogen is adopted as an alternative fuel, these types of emissions could be reduced by a factor of almost 100%. This comprehensive approach is designed to provide a holistic understanding of the energy dynamics within a farm structure in a farm-to-gate system boundary while analysing the operational aspects of fuel consumption by machinery used in crop farming.
When dealing with energy systems inform of fuels, not all farms have the same energy footprint much as they might be growing the same type of crop. Therefore, it is important that fuel use on different types of farms is analysed based on the farm operational activities that require agricultural machinery. Furthermore, the farmland ownership structure greatly influences the emission footprints and thus should be included when policies are being implemented to achieve equality in responsibility sharing by different farm holders.
System boundary definition
In establishing the system boundary for this research, as illustrated in Figure 1, we focused on the operational dimensions of fuel consumption associated with machinery employed in crop farming. This encompasses a range of activities, starting from field preparation (cultivation) through to the post-harvest processes (processing), specifically for crop farms. The choice to centre on cereal crops for this study is driven by their significant contribution, accounting for more than 70% of global crop production (Fantin et al., 2017).
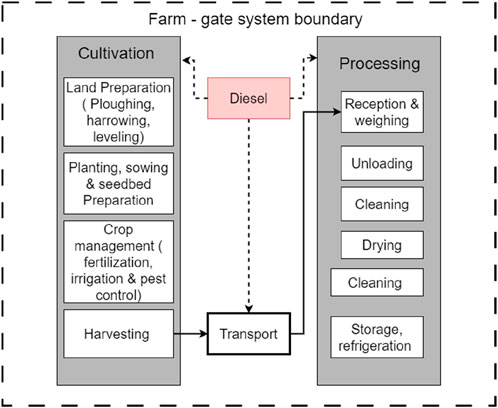
Figure 1. Farm - gate system boundary.
Scenario development
To undertake a meaningful study with so many variables (location, type of crop, farm structure, machinery fleet etc), four case scenarios were developed.
The categorization of farm structures in this study adheres to the EU3 criteria for farm ownership, which is predominantly based on the size of the land. Under this classification, farms are categorized as small-holder if they utilize less than 15 hectares (ha), medium-scale if they range between 20 and 50 ha, medium-intensity if they span 50–150 ha, and intensively mechanized if they exceed 150 ha (EU, 2020).4 This classification also considers the diversity in farming practices that arise due to regional climatic conditions, agricultural legislation, and mandates, even though the focus is on the same types of crops.
The scale of agricultural operations, ranging from small family-run farms to large commercial enterprises, can impact fuel consumption patterns. Smaller farms, often limited by resources such as land size, typically rely on manual or traditional farming methods. However, for this study, we assumed data on farm machinery intensity per scenario. More importantly, it is evident that larger farms with more land are likely to have a greater number of machinery pieces than smaller farms. Therefore, it is crucial to consider this assumption. To accurately reflect the differences in farm operations, the scenarios developed in this study are based on farmland distribution data from Eurostat. This allows us to capture the true demographics of the national agricultural industry in the selected regions.
As detailed in Table 1, the study includes scenarios of small-holder farms in Italy, medium-scale farms in Germany and Sweden, and large, intensively mechanized farms in the United States. The crops selected for focus in this study are wheat, maize, and barley, which are significant contributors to global arable farming. This methodological approach enables a detailed understanding of how fuel consumption varies across different types and sizes of farms, within the context of diverse agricultural practices and policies.
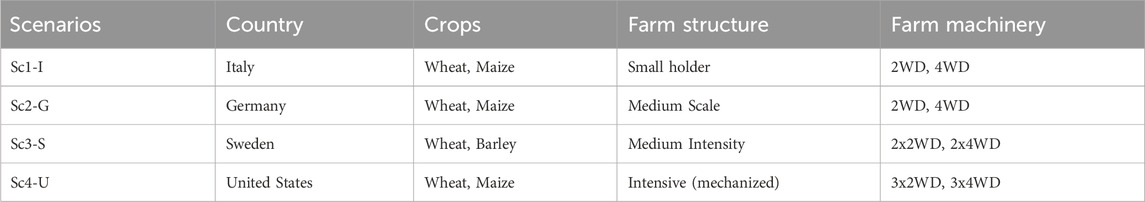
Table 1. Scenarios based on the selected farm geographical locations.
Modelling machinery operations
Under this section of the research, we conducted a detailed investigation into the fuel consumption patterns associated with a variety of crop farming practices, structured across different scenarios to capture the nuances of crop seasons, farming techniques, and regional variances. This analysis was grounded in an evaluation of the fuel footprint linked to the operation of agricultural machinery, particularly tractors, through various stages of farming activity (refer to Figure 2). Drawing upon the foundational work of Grisso et al. (2003), Šarauskis et al. (2014), and Tihanov and Ivanov, (2021), we categorized farming operations into five key areas based on their energy demands and operational phases: land preparation, planting and seedbed preparation, crop management, harvesting, and post-harvest processes.
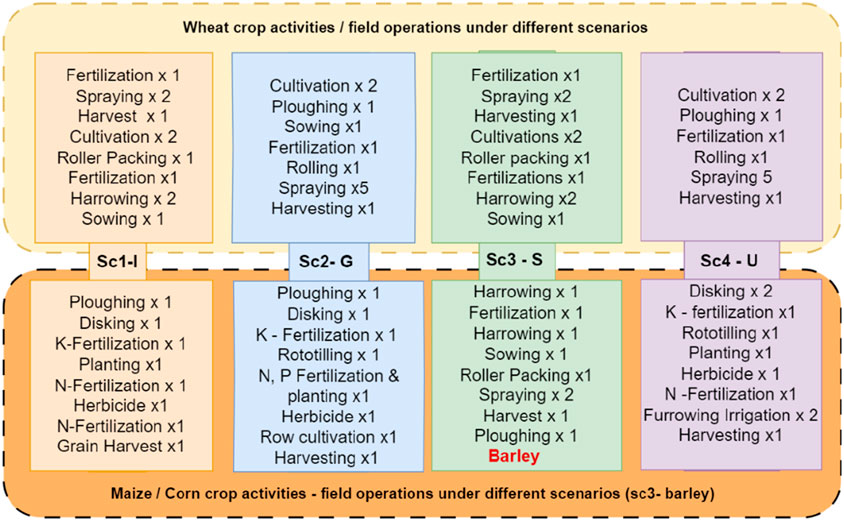
Figure 2. Crop activities/field operations for each scenario (Sc1, Sc2, Sc3 and Sc4).
For land preparation, including tasks such as ploughing, harrowing, and levelling, our methodology pinpointed the necessity for machinery within the 90 kW–130 kW power class, a decision informed by literature that emphasizes the significant influence of soil properties and machinery efficiency on fuel consumption (Klöckner, 2020; Paris et al., 2022; The U.S.Department of Agriculture (USDA), 2022). The subsequent phase of planting and seedbed preparation was noted for its shift towards precision, requiring machinery on the lighter end of the spectrum (<50 KW) and underscoring the differential fuel use driven by operational precision and duration.
In addressing crop management practices—fertilizing, irrigation, and pest control—our approach leveraged insights from the European Union’s Common Agricultural Policy (CAP) as a framework for integrating eco-friendly practices through precision agriculture (Balogh, 2023). This included the deployment of 2WD tractors equipped with variable-rate technology, optimizing fuel consumption by adjusting to soil-specific needs, even if with a marginal increase in fuel use due to the technology itself.
Harvesting was identified as a particularly fuel-intensive stage, with combine harvesters at the forefront of operations in large-scale farming contexts, such as those prevalent in the United States (The U.S.Department of Agriculture (USDA), 2022). Our analysis here was enriched by examining how the volume of crops harvested, field terrain, and crop moisture levels collectively impact fuel efficiency, reflecting on the complex dynamics highlighted by Klöckner (2020) and Paris et al. (2022).
Lastly, the post-harvest phase, which includes drying, storage, and transportation, was scrutinized for its fuel consumption implications. Drying and storage does not belong to the category of offroad (mobile) machinery, but hydrogen could be used for those operations and hence (positively) impact the hydrogen economy of the farm. Emphasizing the critical role of strategic planning in reducing carbon emissions during transportation—a key concern under the EU’s Green Deal—our study assumed for the utilization of heavy-duty 4WD tractors for these energy-demanding tasks.
By integrating these diverse strands of literature and analysis, our methodology offers a nuanced understanding of fuel consumption across the agricultural cycle, positioning our study as a significant contribution to the discourse on agricultural sustainability and efficiency. Through this comprehensive examination we were able to trace fuel usage in accordance with agricultural machinery and crop stages across all scenarios under our scope of investigation.
Fuel consumption model
A mathematical model is developed to estimate annual fuel consumption for various crop practices (refer to Equation 1). To create an accurate model, it is essential to identify and consider the significant factors that influence fuel usage. The model incorporates variables such as land area allocated for each crop, the number of operations per crop type, fuel consumption per operation, and machinery efficiency. For this study these are the factors that were selected; the type of operation being carried out, the type of crop being planted, the size of the farm, the type of machinery used per distinct operation, the frequency and duration of operations, as well as machinery fuel consumption patterns under similar operations. By considering these variables, we can model fuel consumed by each farm under each scenario.
F: Annual farm fuel consumption
A: Total land area allocated for each type of crop
n: Number of operations for each crop type (from land preparation to harvesting from the field)
fi: fuel consumption per hectare for i-th field operation (litres per hectare)
Mi: Selected agricultural machinery (2WD or 4WD) fuel consumption per hectare (based on tractor standard field test)
ri: Number of treatments an i-th field operation is carried out per crop season
The fuel estimation model presented here is a simplified version that aims to provide an estimate of fuel consumption for tractors used in farming operations. However, it is important to note that this model does not consider certain agronomic factors such as weather, soil type, and machine age/technicalities, which can have a significant impact on fuel consumption.
The data used for tractor fuel consumption per field activity was collected from a variety of sources including secondary sources, case studies, and standard field performance tests from DLG5 (Deutsche Landwirtschafts-Gesellschaft – German Agricultural Society). These sources have already accounted for the agronomic characteristics while providing performance metrics during field operations in various locations. As a result, this model can be considered a linear model for fuel estimation, applicable to farms growing the same crops in different geographical locations. It is important to keep in mind that this model is not an all-encompassing solution for fuel estimation. Rather, it provides a basic estimate that can be used as a starting point for further analysis and optimization of fuel usage in farming operations.
Hydrogen refuelling station component sizing and dimensioning
Methodology
A hydrogen refuelling station comprises several key components, including an electrolyser, compressors, hydrogen tanks, a dispenser, and a pre-cooling unit (PCU), each playing a crucial role in the fuelling process as described briefly in 5. Compressors, especially piston compressors as noted in this study, are essential for elevating hydrogen pressure from low levels in storage to the higher pressures necessary for fuelling operations, a process highlighted by Micena et al. (2020). Maintaining the purity of hydrogen during this compression is critical, as emphasized by Grüger et al. (2018), given its application as a pure fuel source in vehicles. The selected piston compressor in this study is assumed to increases the pressure from 1 MPa to a discharge pressure of 90 MPa, aligning with the electrolyser’s output and meeting the SAE J2601 standard, which sets the maximum pressure for Class 70 refuelling stations at 87.5 MPa as greatly detailed by studies (Grüger et al., 2018; Micena et al., 2020; Šimunović et al., 2022).
This research, therefore, adopts a two-tiered approach to hydrogen storage, mirroring the design suggested by Grüger et al. (2018). Initially, the hydrogen is stored at low pressure, serving as a buffer, and ensuring a consistent flow to the compressor (Grüger et al., 2018). This low-pressure tank, directly linked to the electrolyser’s output, maintains the initial pressure level (Grüger et al., 2018). Post-compression, the hydrogen is stored in a high-pressure tank, ready for use during peak demands and operating at the same 90 MPa pressure as the compressor’s output (Micena et al., 2020) (refer to Figure 3). The dispenser and pre-cooling unit (PCU) are governed by the industry-standard SAE J2601 protocol, as detailed by Janke et al. (2020) and Šimunović et al. (2022). This protocol stipulates that hydrogen’s temperature must not exceed 85°C during refuelling. Consequently, when compression increases the hydrogen’s temperature, cooling is required to prevent overheating. The system targets a pre-cooling temperature of −40°C for refuelling at 70 MPa (Micena et al., 2020). Equipped with a pre-cooling unit, hose, and nozzle, the dispensing system facilitates the transfer of cooled hydrogen into the vehicle’s tank, ensuring efficient and safe refuelling.
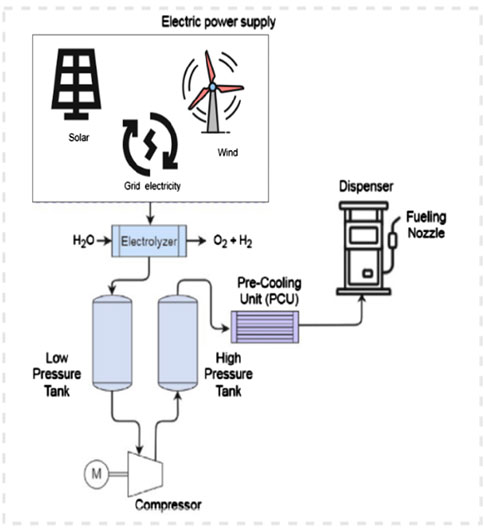
Figure 3. Schematic outline of a hydrogen component setting Sources: Micena et al., 2020.
Hydrogen refuelling plant optimization
Our methodology involves optimizing the sizes of electrolysers and hydrogen storage tanks to meet the energy demands of agricultural operations. We employ a heuristic and iterative approach, tailoring hydrogen production to the fluctuating demand schedules across different farming cycles and geographic regions as shown in the Figures 4, 5. The goal is to balance production efficiency with storage capacity, ensuring a continuous hydrogen supply, particularly during peak agricultural periods.
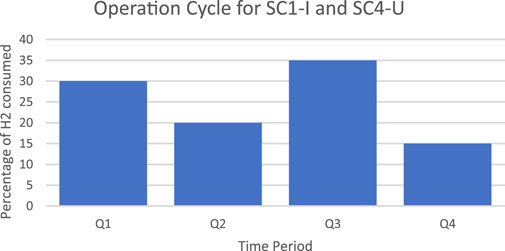
Figure 4. Annual farming calendars for Italy and United States farm structures that was a reference for hydrogen demand optimisation.
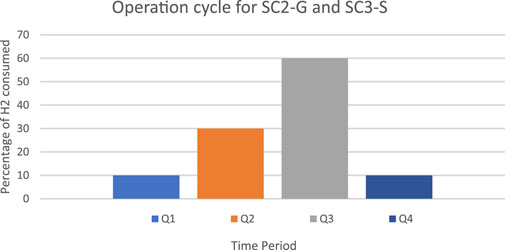
Figure 5. Annual farming calendars for Germany and Swedish farm structures that was a reference for hydrogen Demand optimisation.
H2PT component modelling
Operation Cycles (OC): Assumptions for operation cycles were based on regional weather patterns and agricultural activities. In SC2-G and SC3-S, we assumed a split usage of hydrogen, 10% of the annual fuel consumption in the first + fourth quarter due to winter seasons while 30%, 60% is consumed in the second, third quarter respectively (refer to Figure 5). In addition, for SC1-I and the SC4-U we assumed that they consume hydrogen quarterly, with the consumption being distributed as 30%, 20%, 35%, and 15% across the four quarters as depicted in Figure 4. Similarly, to SC2-G and SC3-S, these countries also have 40 non-operational days per year. Based on the assumptions detailed above, Equation 2 was used to model daily hydrogen demand of these different scenarios as a first step towards hydrogen storage tank size modelling.
Daily Hydrogen Demand and Component Sizing: This involved calculating the operational days for a hydrogen-powered tractor (8 h a day, 5 days a week) and determining the minimum required production capacity of the electrolyser and storage capacity of the tanks. Maximum daily hydrogen demand was computed to ascertain the minimum electrolyser production capacity and storage tank size (Equations 2–5).
Economic analysis
The system’s economic viability was assessed using two principal financial indicators: the Levelized Cost of Hydrogen (LCOH) and the Net Present Value (NPV). LCOH is pivotal for optimizing the configuration of the Power-to-Hydrogen (PtH2) plant, particularly concerning the electrolyser’s capacity and hydrogen storage capacity. Conversely, NPV helps compare the financial aspects of a hydrogen-based system with those of a traditional diesel-powered system. Determining the NPV is critical for understanding the financial ramifications of transitioning to a hydrogen fuel system in agricultural settings, notably for operations involving machinery in crop farming such as wheat, maize, and barley. These indicators were utilized to build a functional model to compute the financial and economic results summarized in the next section.
Operationalization of the functional model
The models used in this analysis integrate financial projections and economic assessments. The computational steps taken to arrive at the results are as follows:
i. When calculating energy requirements and costs, this model assesses the economic feasibility of adopting hydrogen as an alternative fuel, by computing for capital requirements, both variable and Fixed operational costs associated with producing the targeted hydrogen demanded/needed by each farm annually to fully cover its fuel needs on site using the average spot prices of electricity in each locations/scenario.
ii. Using projected future electricity prices under each scenario, the model is improved to create a best-case scenario that farms could operate under if the Utility Rate (UR) of the hydrogen refuelling station across all scenarios is improved to reach 70% by selling off excess hydrogen at the same targeted hydrogen price which is 3€/kg across all scenarios. Furthermore, under this setting, the financial revenues are improved by incorporating assuming a best case scenario at which these stations could operate given that future renewable energies are projected to have an impact on future hydrogen prices. Under this we also considered discussions about possibility of earning extra revenues through if farms could sell off by products like oxygen and recovering thermal heat to industry partners as recommended by (Janke et al., 2020).
iii. The financial analysis part of the study is carried out using NPV and LCOH for each individual scenario using the collected economic parametric data.
Formulas
To calculate the NPV, we need to estimate the annual savings or revenue and subtract the OPEX for each year, then discount these annual net savings back to the present value using the discount rate (refer to Equation 6).
where:
• n is the number of years (15 years in this case).
• r is the discount rate.
Annual Savings would be the value of the hydrogen produced each year if it were to be sold or the savings from not purchasing diesel. OPEX is the annual operational cost.
The LCOH is calculated by dividing the total discounted cost (CAPEX + OPEX) by the total discounted hydrogen production over the system’s lifetime (refer to Equation 7).
• It, Investment cost
• Mt, Maintenance cost
• Ft, Fuel cost
• Et, Energy produced
• r, Discount rate
• t, Lifetime of the project
Assumptions and input data
The economic parameters outlined below are applied to analyse the Net Present Value (NPV) and Levelized Cost of Hydrogen (LCOH) for decentralized hydrogen production facilities on farms in Italy, Germany, Sweden, and the United States. These parameters include essential financial and technical metrics that underpin the evaluation of the profitability and viability of such systems in different national contexts.
General Parameters.
• Lifetime (n): The assumed operational lifespan of the hydrogen production system is consistently set at 15 years across all countries.
• Interest on Capital: A uniform interest rate of 3% is applied, reflecting the cost of capital for financing the equipment required for setting up a hydrogen refuelling station. This figure also sets a consistent risk margin that is associated with the fragility of these kinds on investments which are mostly considered to be new technologies in the markets.
• Electrolyser Capacity: Varies significantly by country, with capacities ranging from 50 kW in Italy to 350 kW in the United States (refer to Table 2). The capacity variations in electrolyser capacities were optimised to suit the hydrogen demand profiles of the farms under study.
• Hydrogen Storage Tank Size: Similarly, storage capacities differ, with Italy at 20 kg and the United States at 400 kg, indicating differing scales of hydrogen storage capability. The tank sizes were optimised to keep a buffer storage of 2 days under each scenario to meet variations in fuel consumption during peak demand during operational seasons. Furthermore, hydrogen has higher costs of storage due to the energy consumption during storage and thus the logic is to store enough fuel to avoid operational constraints rather than storing the total annual fuel needed for farm operations as it is common with diesel fuel.
• Target Annual Hydrogen Production: Targets are set based on country-specific demands and capabilities, ranging from 806 kg/yr in Italy to 45,518 kg/yr in the United States. These targeted hydrogen quantities are energy equivalents from the Annual diesel fuel consumed under each scenario as investigated in 5.
• Targeted Selling Price of Hydrogen: A standardized price of 3 €/kg is used across all countries to estimate revenue from hydrogen sales. This price was chosen as an ideal selling price that would make hydrogen competitive with fossil fuels and other alternative fuels.
• Discounting Rate: Reflects country-specific financial environments (for our case we used the average 106-year bond interest rates), with rates from 4.09% in Italy 2.42% in Sweden.
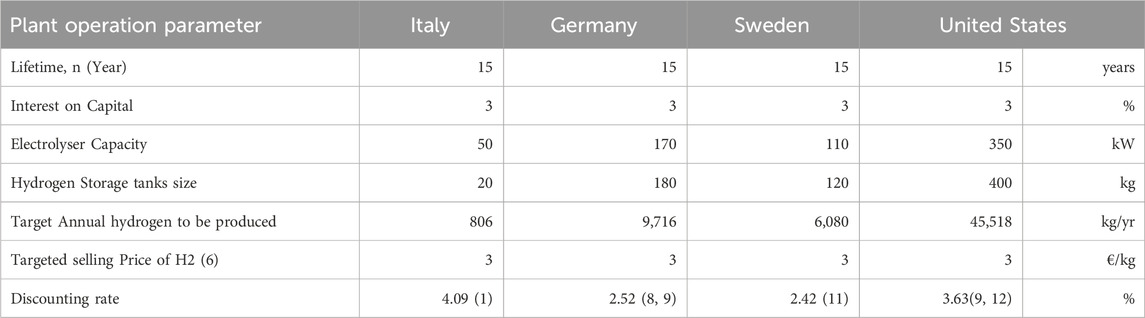
Table 2. Economic data for the hydrogen fuel stations.
Assumptions For capital expenditures (CAPEX)
Under economic modelling of hydrogen production, a detailed assessment of capital expenditures (CAPEX) was performed using the data in Table 3. This assessment included costs associated with key components necessary for the setup and operation of hydrogen production facilities. The economic cost data used was collected from secondary literature sources including feasibility reports, and articles that have already extensively researched the implications of developing hydrogen refuelling stations in the countries understudy to reflect national market prices of these components however, some parameters were applied uniformly across all scenarios as follows.
• Electrolyser Costs: The electrolyser, a crucial component for hydrogen production, exhibited country-specific costs per kW. The costs ranged from 970 €/kW in Sweden to 1,450 €/kW in the United States, significantly impacting the initial investment required for each location.
• Stack Replacement Costs: These costs were uniformly set at 15% of the electrolyser CAPEX across all countries. This assumption ensures a standardized approach to accounting for maintenance and part replacements in the 8 years which is essential for continuous operation.
• Storage Tank Costs: For 250 bar low-pressure storage tanks, the costs were consistent at approximately 200 €/kg across all countries. This consistency facilitates comparability and uniformity in evaluating storage solutions.
• Compressor Costs: There was significant variability in compressor costs, with Italy incurring a relatively low cost of 6,700 €, while Germany’s costs scaled based on a factor of 0.6, reflecting the larger systems used.
• Dispenser and Chiller Costs: These were uniformly set at 170,000 € except for the United States, where costs were scaled to account for the higher capacities used.
• Installation and Permitting Costs: These were calculated as 15% of the capital equipment cost, with specific scaling factors applied in different countries to reflect local regulatory and installation requirements. The figure was reached due to the regulatory frameworks that are in existence to avert risks associated with safety operations thus requiring specialised technical expertise for installation of the system which some cases assume to range between 10%–12% whereas 5%–3% was to cover the initial permitting costs by local authorities (Proost, 2019).

Table 3. Capital expenditure for hydrogen fuel stations investment requirements.
Assumptions For operational expenditures (OPEX)
Operational expenditures (OPEX) were analysed to understand the ongoing costs associated with the hydrogen production facilities refer to Table 4. These costs encompass electricity prices, maintenance, and operational overheads, among other factors.
• Electricity Prices (Average Spot Prices 2023): There was significant variability in electricity prices, ranging from 40 €/MWh in the United States to 126.766 €/MWh in Italy. These prices directly influence the operational costs, as electricity is a primary input for hydrogen production via electrolysis.
• Electrolyser OPEX: Uniformly set at 50 €/kW across all countries, this cost covers the maintenance and operational overheads of the electrolysis units. This ensures a standardized assessment of the operational costs associated with the electrolysers.
• Storage OPEX: Consistent at 5 €/kg, this cost was applied uniformly across all countries to ensure a standardized evaluation of the operational costs associated with hydrogen storage.
• Dispenser and Chiller Costs: Set at 5,350 € uniformly, except for the United States where scaled results were used to reflect higher capacities and usage rates.
• Compressor OPEX: These costs varied, with a fixed cost of 15,000 € in Germany and scaled results in other countries, reflecting the differences in compressor capacities and operational demands.
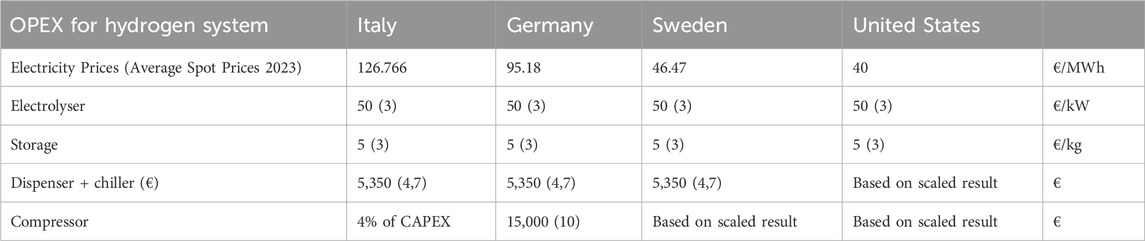
Table 4. Operational expenditure for hydrogen fuel systems in different scenarios.
By standardizing these assumptions across different countries, the study ensures a consistent framework for evaluating the economic costs associated with operating these systems. This approach allows for comparability and reliable assessment of the potential financial outcomes associated with transitioning to hydrogen-based systems in agricultural settings.
Modelling a possible best scenario from the first economic model
Proost, (2019) underscored the critical role of annual operating hours (load hours) in determining the cost of electrolytic hydrogen. The study revealed that low operational times (<2000 h per year), even with zero electricity costs, would result in hydrogen prices exceeding 10 €/kg, a finding that is both surprising and counterintuitive. Given that the electrolyser capacities across various scenarios, it is evident that the target annual production capacities do not achieve a utilization rate of even 40% except for United States.
The European Hydrogen Roadmap anticipates that the hydrogen economy will be supported by an abundance of cheaper renewable electricity, driven primarily by the increased adoption of wind and solar energy. These renewable sources are projected to contribute more than 15% of grid electricity by 2030 and 65% by 2050 (EU Hydrogen Road Map, 2019). Janke et al. (2020) highlighted the potential for farmers to use renewable electricity from sources like wind to produce hydrogen for farm machinery, benefiting from lower electricity costs. Additionally, the authors proposed that such hydrogen systems could generate extra revenue through waste heat recovery and selling oxygen to industrial consumers, thereby enhancing the profitability of these projects users (Janke et al., 2020).
These perspectives formed the basis for creating a best-case scenario in this study, which accounts for several factors: increasing the utilization rate (UR) of each electrolyser to 70%, reducing electricity prices based on future projections of cheaper renewable energy due to increased investments, and incorporating a subsistence production model where excess hydrogen is sold to other end. This comprehensive approach aims to provide a more accurate and optimistic assessment of the economic viability of decentralized hydrogen production systems on farms (refer to Table 5).
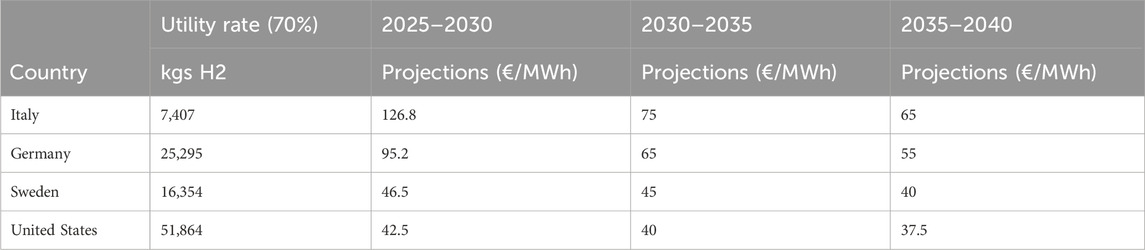
Table 5. Data used to study the best possible operational mode of these hydrogen systems.
Results
Fuel consumption modelling
The results from our study are present in Table 6 and provide an insightful overview of diesel fuel consumption for wheat and maize cultivation across four scenarios (Sc1-I, Sc2-G, Sc3-S, Sc4-U), measured in total litres and efficiency (litres per hectare, L/ha). In Sc3-S, the fuel consumption of barley is considered. This is because the Swedish weather partners do not typically favour maize or corn, so farmers often plant barley as a cover crop. The analysis aims to provide a better understanding of fuel efficiency and consumption in agricultural practices.
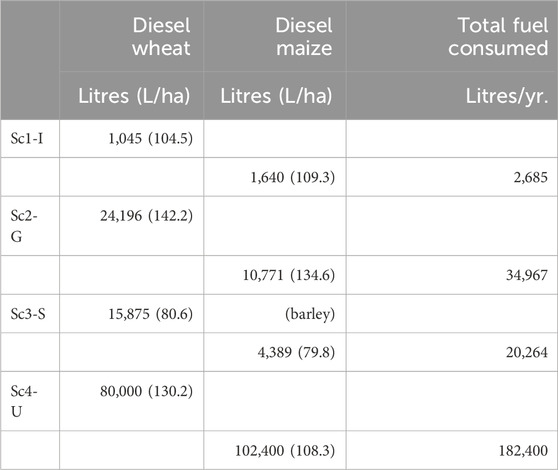
Table 6. Results of Total Annual fuel consumption for farms under different scenarios because of growing two types of cereal crops.
Sc1-I exhibits the lowest total annual fuel consumption at 2,685 L, with wheat and maize requiring 104.5 L/ha and 109.3 L/ha, respectively. This scenario indicates relatively efficient fuel use, possibly due to less intensive land use. The total land utilized amounts to 25 ha, split between wheat (10 ha) and maize (15 ha).
Sc2-G shows a higher total fuel consumption at 34,967 L, with wheat at 142.2 L/ha and maize at 134.6 L/ha. The increased fuel use per hectare in this scenario suggests more fuel-intensive agricultural practices. The land utilization significantly jumps to 232 ha, with wheat cultivated on 152 ha and maize on 80 ha.
Sc3-S includes barley and demonstrates a total fuel consumption of 20,264 L, with wheat using 80.6 L/ha and barley 79.8 L/ha. The inclusion of barley and its comparative fuel efficiency to wheat in this scenario highlights potential crop-specific agricultural practices influencing fuel consumption. The total land used is 180 ha, distributed between wheat (125 ha) and barley (55 ha).
Sc4-U records the highest total fuel consumption at 182,400 L, where wheat and maize require 130.2 L/ha and 108.3 L/ha, respectively. The significant fuel use in this scenario, especially for maize, points to highly intensive farming operations or larger scale cultivation requiring more fuel per hectare. This scenario also has the largest land utilization at 1,300 ha, with 500 ha for wheat and 800 ha for maize.
This simplified analysis underscores the variability in diesel fuel efficiency and total consumption across different crops and scenarios. The fuel efficiency (L/ha) offers insights into the relative energy demands of wheat, maize, and barley cultivation under varied agricultural conditions. It is evident that even though multiple farms may grow the same crop simultaneously, there can be significant variations in fuel footprints due to external factors such as weather conditions, farming practices, and the state of machinery used. Furthermore, the results certainly affirm that the farm structure has significant effect on the total fuel annual fuel consumption of each farm but does not necessarily mean that large scale farmers are less efficient when it comes to fuel usage per crop cultivated on a farm.
The fuel footprint of different farm activities can be analysed by studying which activities dominate the fuel usage across all farms as seen in Figure 6.
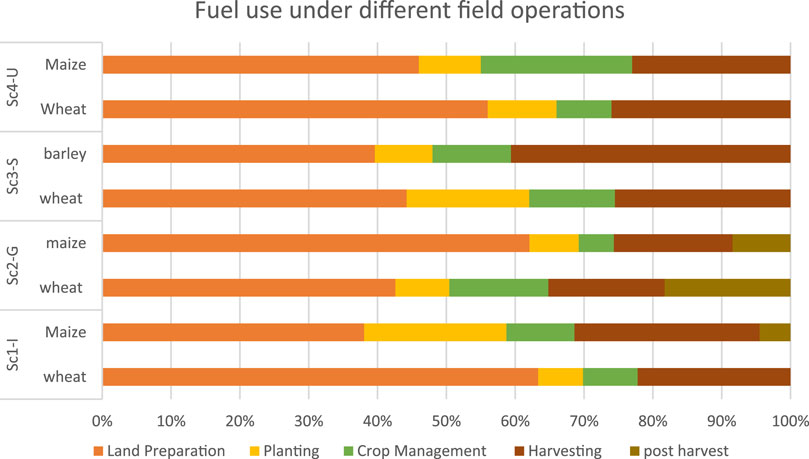
Figure 6. Fuel usage by different cereal crop activities as a percentage of total annual fuel consumed under different scenarios.
The graph highlights that land preparation and harvesting are the most fuel-intensive stages of field operations across all crops and scenarios. Similar patterns have been observed in other studies. For instance, Grisso et al. (2014) found that ploughing and harvesting can constitute more than 60% of total fuel consumption in agricultural operations. This is consistent with our findings, where land preparation, particularly, shows the highest fuel consumption in scenarios such as Sc1-I for both wheat and maize.
Planting and crop management exhibit moderate to high variability in fuel consumption across different scenarios. This suggests there are significant opportunities for improving efficiency in these stages. Studies like Francesco et al. (2011) have also highlighted the potential for fuel savings through optimized planting techniques and better crop management practices.
Post-harvest activities consistently require the least fuel, indicating efficient practices are already in place during this stage. This finding aligns with research by Flammini et al. (2022), Gustavo et al., (2013) which also reported minimal fuel use in post-harvest operations due to advancements in mechanical efficiency and streamlined processes.
Hydrogen production and refuelling station dimensioning
The capacity and daily production of hydrogen varied across countries, reflecting the scale of agricultural activities and energy requirements (Table 7).
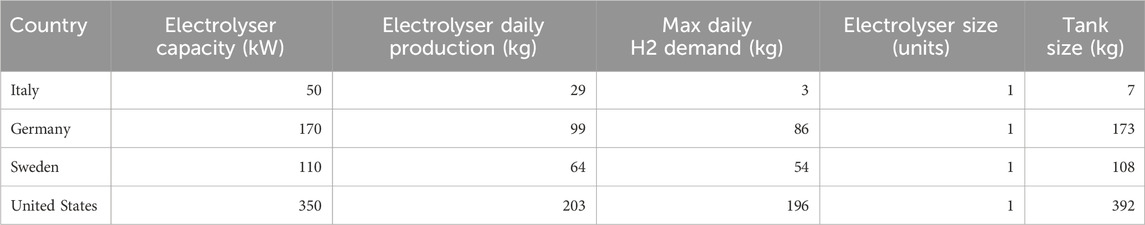
Table 7. Results of the Electrolyser Optimisation and Tank sizing.
The optimization process ensured that a single electrolyser unit would suffice for the maximum daily hydrogen demand, with storage capacities tailored to each country’s needs (Table 7).
Economic analysis
The financial viability of decentralized hydrogen production on farms is critically dependent on both capital expenditures (CAPEX) and operational expenditures (OPEX). This section discusses the cost assessment across Italy, Germany, Sweden, and the United States, using the detailed assumptions and data provided in the previous section.
Capital expenditures (CAPEX)
Electrolyser costs
The initial investment in electrolysers shows significant variation across the countries, with costs ranging from €55,000 in Italy to €507,500 in the United States (refer to Table 8). This substantial difference can be attributed to local market conditions, technology costs, and the scale of hydrogen production systems required. Sweden and Germany fall in between, with costs of €106,700 and €170,000 respectively. These variations significantly impact the total CAPEX, making the USA’s initial investment notably higher than other countries.
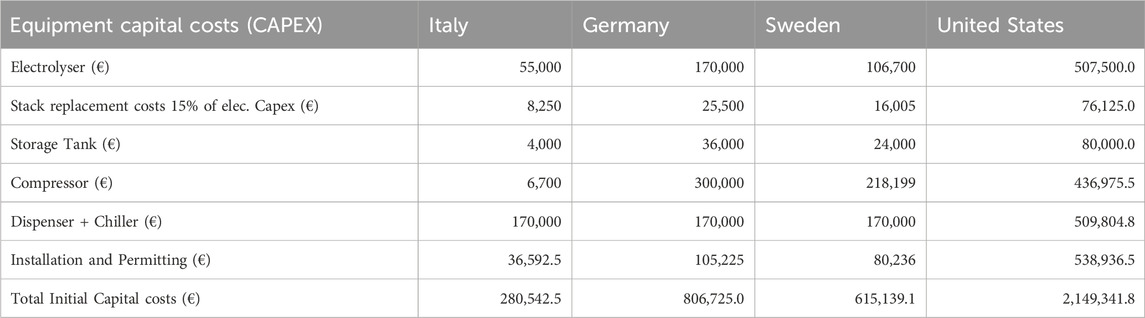
Table 8. Capital requirement for the hydrogen fuel system setup across different scenarios.
Stack replacement costs
Uniformly set at 15% of the electrolyser CAPEX, stack replacement costs ensure a consistent approach to maintenance across different regions. These costs are €8,250 in Italy, €25,500 in Germany, €16,005 in Sweden, and €76,125 in the United States. The uniform percentage ensures proportionality to the initial investment, facilitating a standard method for financial planning.
Storage tank costs
The costs for storage tanks are standardized at approximately 200 €/kg, leading to absolute costs of €4,000 in Italy, €36,000 in Germany, €24,000 in Sweden, and €80,000 in the United States. This uniformity ensures comparability in evaluating storage infrastructure across different countries.
Compressor costs
Compressor costs exhibit significant variability, with Italy incurring a relatively low cost of €6,700, while Germany faces a scaled cost of €300,000 due to larger system sizes. Sweden’s costs are €218,199, whereas the USA’s are €436,975.5 both of which were derived from scaling the sizes of the compressor by a factor of 0.6 from the reference hydrogen plant. The variability in costs reflects different system requirements and local manufacturing efficiencies.
Dispenser and chiller costs
Uniformly set at €170,000 for most countries, dispenser and chiller costs are significantly higher in the United States at €509,804.8. This discrepancy is due to the scaling required for larger systems in the United States, reflecting higher capacity requirements. Furthermore, the assumptions take into consideration that EU countries on aspects of product development of these technologies have higher prospects of having standard equipment costs due to economic partnerships under joint research projects with industry partners.
Installation and permitting costs
Installation and permitting costs, calculated as 15% of the capital equipment cost, vary by country: €36,592.5 in Italy, €105,225 in Germany, €80,236 in Sweden, and €538,936.5 in the United States. These costs account for local regulatory and labour conditions, impacting the total CAPEX.
The annual fixed operational costs for decentralized hydrogen production systems exhibit significant variability across Italy, Germany, Sweden, and the United States (refer to Table 9). The high costs of electrolyser maintenance and interest expenses dominate Italy’s and the USA’s FCOP profiles, underscoring the importance of initial investments and financing when switching to such energy systems. However, for variable operational costs are directly proportional to the capacity sizes and are dominated by the electricity costs followed by the costs of water consumed for the electrolysis process refer to the Supplementary Table SA1.
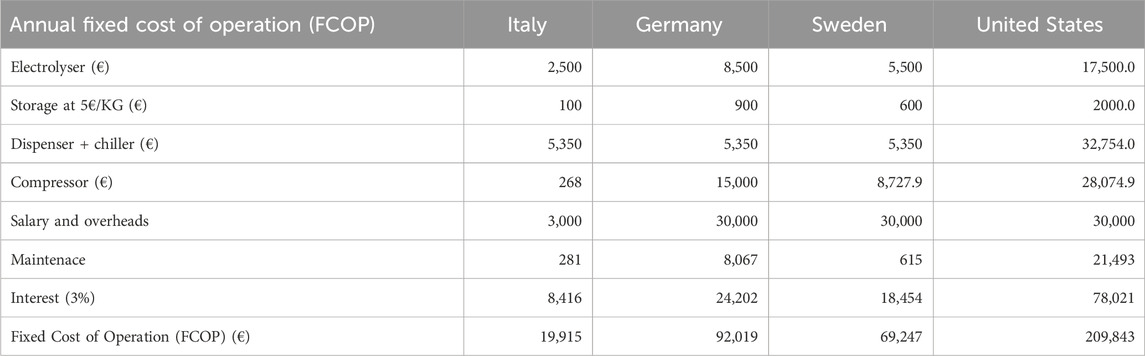
Table 9. Annual Fixed Costs of operations for the distinct hydrogen fuel system setups across different scenarios.
Studies such as those by Larry (2008) and Jonas and Lagnelöv (2018) emphasize the high operational costs associated with electrolyser maintenance and labour, aligning with the findings presented here. These studies also highlight the critical role of financing in hydrogen production, consistent with the significant interest costs observed in this analysis.
Additionally, the IEA (2019) report notes that high labour and maintenance costs can significantly impact the overall operational expenses of hydrogen production systems. This is particularly evident in Germany and Sweden, where salaries and overheads constitute the largest portion of FCOP. The report suggests that optimizing labour efficiency and reducing maintenance costs could improve the economic viability of these systems.
NPV and LCOH
The economic analysis of the hydrogen system was investigated based on two critical financial metrics: Net Present Value (NPV) and Levelized Cost of Hydrogen (LCOH). These metrics were evaluated under different operational scenarios to understand the economic feasibility and competitiveness of hydrogen production for machinery operations across Italy, Germany, Sweden, and the United States. The results are divided into two sets: one based on hydrogen demand for machinery operations (HDP) under assumptions that these farms produce fuel for their own needs on the farm and nothing further. However, the results of the first economic model revealed that the projects are not feasible across all scenarios refer to Table 10.
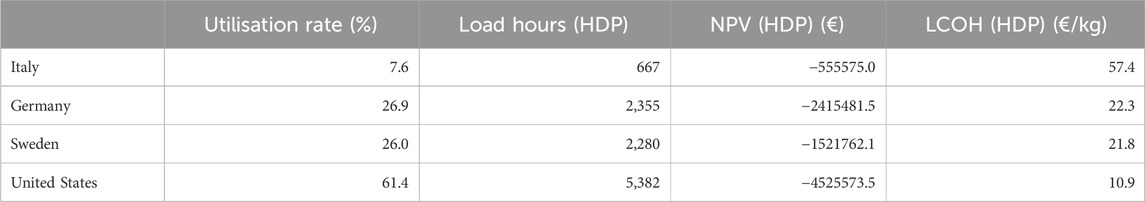
Table 10. Results of the first economic model.
The negative NPVs across all countries indicate that, under current conditions, the hydrogen production systems are not financially viable Table 10: Results of the first economic model. The LCOH values vary significantly, with the United States achieving the lowest LCOH at 10.9 €/kg H2, reflecting its larger scale and potentially lower operational costs. Conversely, Italy has the highest LCOH at 57.4 €/kg H2, suggesting higher costs per kilogram of hydrogen produced due to smaller scale operations and higher electricity price. Thus, the LCOH where quite higher for all farms with lower volumes of production therefore confirming the trend of LCOH being directly proportional to the utility rate of the electrolyser in use due to the existence of economies of scale refer to Figure 7.
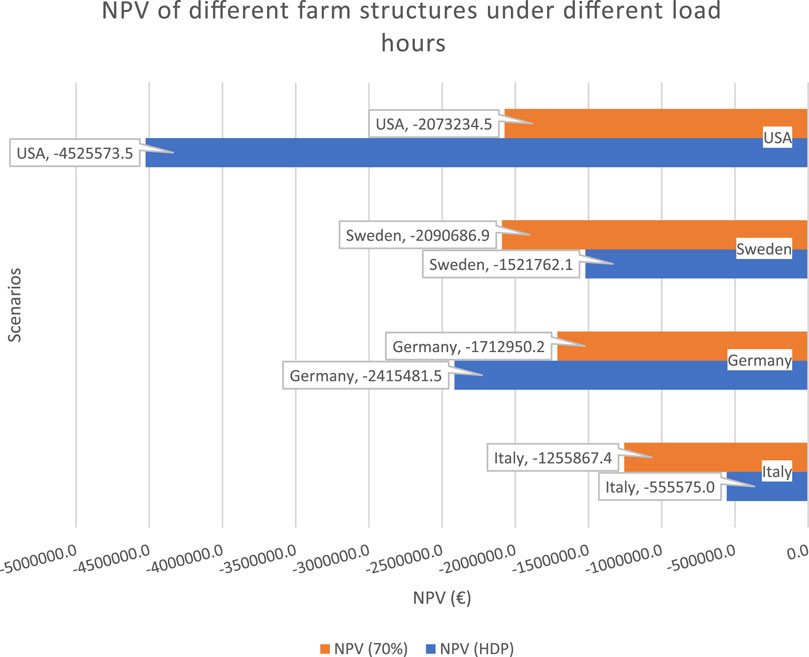
Figure 7. NPV results of both economic models.
The second results of the economic model explored the impact of increasing the electrolyser utilization rate to 70% (refer to Figure 8). Additionally, a sub-scenario includes the effect of offsetting extra revenue from by-products. The results revealed that Increasing the electrolyser utilization rate to 70% significantly improves the NPV and reduces the LCOH in all countries (refer to Figures 7, 8). These improvements highlight the importance of optimizing electrolyser utilization and leveraging additional revenue streams to enhance the economic feasibility of hydrogen production systems as viable option that can increase feasibility of these systems however, issue of how these products will reach the market is still under study. The United States still maintains a relatively low LCOH at 10.8 €/kg H2, with a further increment to 14.6 €/kg if the utility rate is raised to 70% while it reduces to 12.9 €/kg H2 when considering by-product revenue offsets. Germany achieves the most substantial reduction in LCOH, from 21.8 €/kg H2 to 11.6 €/kg H2, and further down to 7.5 €/kg H2 with by-product revenue refer to Figure 8. Significant reductions are seen under the scenario of Italy whereby increasing its utility rate would reduce the LCOH from 57.4 €/kg H2 to 18.7 €/kg under the best-case scenario of Italian farms.
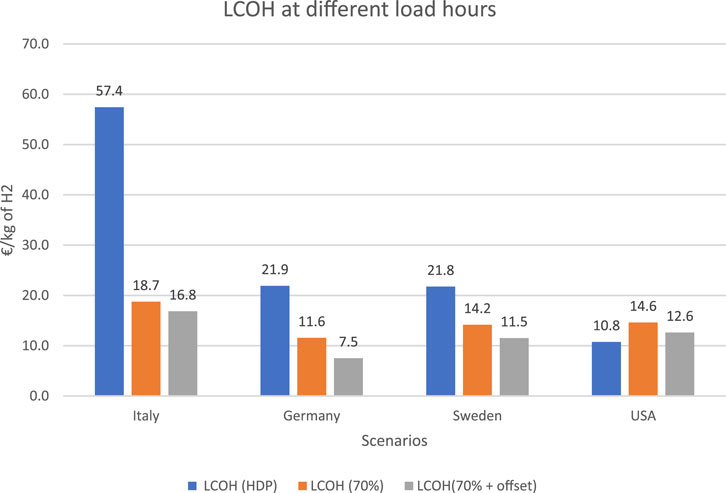
Figure 8. Levelized Cost of energy across both economic models under different load hours.
Discussion
Most of the research on hydrogen application in farming has focused on enhancing the performance of machinery by improving efficiency. Carroquino et al. (2019) conducted a study on a self-sufficient renewable energy system that used solar energy to power irrigation in a vineyard. The excess energy produced was used to generate hydrogen for a fuel cell electric vehicle that was used on the site for workers’ mobility. The authors found that this system could save up to 1,084 L of diesel by replacing it with hydrogen. However, the study did not cover the use of agricultural tillage machinery. So, this study conducted here is much more holistic taking all or most of the farm machinery activities that contribute to these food systems which will be impacted by the future transitions in the transport industry.
In another study, Janke et al. (2020) investigated different cases and technological scenarios to explore the future use of hydrogen by single-case farms. They proposed that four farms of 300 hectares could share investment costs for a wind-powered hydrogen refuelling unit. The authors found that sharing costs reduced the hydrogen production cost by 35% due to economies of scale and more distributed hydrogen demand. However, they only modelled the system to replace 28% of the total annual fuel use on these farms, and they used an assumed figure. None of these studies have considered the fuel consumption patterns resulting from the use of agricultural machinery on the farm. Therefore, this study takes into account the desirable positions of most agricultural stakeholders that are aiming towards decarbonisation by having hydrogen produced on the farm run the whole farm machinery.
In our case study, we have found that fuel consumption on a farm is dependent on the activities related to the crop being grown, which in turn are subject to the specific field operations required for each type of crop. The study has also revealed that, even if two farms are growing the same crop, external factors such as regulations on tillage methods, soil texture, weather, and location can significantly affect their fuel consumption patterns. Moreover, we have identified that the variations in carbon abatement tax have a significant impact on the adoption of these technologies, with Germany having the highest carbon tax cost savings, but not necessarily the highest emission reductions.
The study was also able to quantify the possible emission footprints of different farm structures in producing cereal crops. With the highest footprints belonging to highly mechanised farm structures but also these farms have the most economical potential for hydrogen production on site if renewable sources are employed for electricity production as observed in the results of the second economic model.
The study highlights that hydrogen systems for farm usage face significant challenges, primarily due to the high-cost implications of owning such systems. This includes substantial expenses for the equipment, storage, and handling of hydrogen, driven by the necessity to mitigate safety risks during operation (Proost, 2019). Despite these financial hurdles, hydrogen technologies offer a promising solution to reduce emissions from fossil fuel usage on farms, which account for approximately 15%–25% of a farm’s total emissions (Flammini et al., 2022). However, this reduction is only a partial solution. A significant portion of farm emissions, particularly those from fertilizer use, remain unaddressed by hydrogen systems. Fertilizer emissions constitute the largest share of a farm’s emission profile, suggesting that while hydrogen can help mitigate some environmental impacts, it does not fully resolve the issue (Larry, 2008).
Comparatively, the adoption of electric-powered tractors presents an alternative with its own set of benefits and challenges. Electric tractors offer the advantage of zero tailpipe emissions and lower operational costs due to reduced fuel and maintenance needs (Francesco et al., 2011). Moreover, they align well with the increasing availability of renewable electricity, which can further enhance their sustainability credentials (IEA, 2019). However, the current limitations of electric tractors, such as high weight to PTO ratios, limited battery life and the need for significant charging infrastructure, pose challenges for their widespread adoption, particularly on larger farms or those with high-intensity usage (Jonas and Lagnelöv, 2018). In contrast, hydrogen systems, despite their higher costs, offer quicker refuelling times and longer operational periods, which can be more suitable for extensive farm operations.
Conclusion
This study explored the application of hydrogen in cereal crop farming, with a focus on decentralized hydrogen production using electrolysers across various farm categories defined by size, structure, and crop type. Andreas et al. (2019) emphasized that reducing hydrogen production costs requires purchasing low-cost electricity, maximizing plant efficiency, and minimizing investment costs. Our study investigated the positive impact of low-cost electricity based on future price projections by the IEA,7,8 USEIA,9 and CE DEFT,10 considering scenarios at five-year intervals from 2025 to 2040.
To maximize plant efficiency, we examined increasing the utilization rate to 70%, recognizing that future renewable energy sources may not achieve corresponding load hours due to their operational limitations. Other studies, such as those by the IEA (2019), highlight the importance of strategically placing hydrogen plants in areas with high full-load hours. This is particularly crucial when these plants are connected to photovoltaic (PV) or wind parks, as it is essential for optimizing performance.
Hydrogen technology is becoming increasingly applicable in agriculture, with significant advancements in hydrogen-powered tractors, such as those developed by Deutz in Germany. However, the economic feasibility of using exclusively green hydrogen is challenging, particularly for small-scale farms. To enhance hydrogen supply chains and make them more economically viable, it is crucial to consider other types of hydrogen, not just green hydrogen, especially for farms committed to reducing emissions (IEA, 2019).
The findings underscore the necessity for farms to have access to renewable energy sources to make hydrogen prices more affordable. The potential benefits of incorporating additional revenues from byproducts such as heat recovery and oxygen sales are limited. Although these byproducts can reduce hydrogen costs by about 2 €/kg, the associated conditioning and transportation costs are substantial. Furthermore, generating significant revenue from these byproducts is challenging due to the lack of readily available markets for large volumes of oxygen and thermal energy.
Overall, decentralized hydrogen production holds promise for reducing emissions in cereal crop farming. However, significant challenges remain, including high costs of ownership, the need for low-cost renewable energy and the economic viability of byproduct revenue streams. Further research and policy support are essential to address these challenges and enhance the feasibility of hydrogen use in agriculture. For hydrogen to be a competitive fuel for agricultural machinery, its price should be maintained below 3 €/kg. Otherwise, the high costs of storage and distribution pose significant limitations on the geographical location of production sites (Larry, 2008).
Study limitations
This study has several limitations that future research should address. Firstly, the scope was limited to cereal crops such as wheat, maize, and barley. Future studies should include cash crops like fruits, sugarcane, and cotton, as well as animal husbandry, to provide a more comprehensive analysis. Secondly, the study did not model the sizes of hydrogen components other than storage tanks and electrolysers, which were considered negligible for obtaining an overview but are essential for detailed analysis. Thirdly, the focus was on food systems in the global northern hemisphere, particularly farms in the United States and the EU. Lastly, the study did not consider the costs of tractor equipment or other agricultural machinery, focusing solely on the cost of the hydrogen fuel system as an alternative to reduce fossil fuel dependency. Future research should include these factors to provide a more detailed economic analysis of hydrogen use in agriculture.
Data availability statement
The datasets presented in this study can be found in online repositories. The names of the repository/repositories and accession number(s) can be found in the article/Supplementary Material.
Author contributions
KA: Conceptualization, Data curation, Formal Analysis, Investigation, Methodology, Project administration, Resources, Software, Supervision, Validation, Visualization, Writing–original draft, Writing–review and editing. MH: Conceptualization, Data curation, Formal Analysis, Funding acquisition, Investigation, Methodology, Project administration, Resources, Supervision, Validation, Visualization, Writing–original draft, Writing–review and editing. JS: Conceptualization, Data curation, Formal Analysis, Investigation, Methodology, Project administration, Resources, Supervision, Validation, Visualization, Writing–original draft, Writing–review and editing.
Funding
The author(s) declare that no financial support was received for the research, authorship, and/or publication of this article.
Conflict of interest
The authors declare that the research was conducted in the absence of any commercial or financial relationships that could be construed as a potential conflict of interest.
Publisher’s note
All claims expressed in this article are solely those of the authors and do not necessarily represent those of their affiliated organizations, or those of the publisher, the editors and the reviewers. Any product that may be evaluated in this article, or claim that may be made by its manufacturer, is not guaranteed or endorsed by the publisher.
Supplementary material
The Supplementary Material for this article can be found online at: https://www.frontiersin.org/articles/10.3389/fenrg.2025.1479212/full#supplementary-material
Footnotes
1https://ourworldindata.org/emissions-by-sector
2https://dieselnet.com/news/2023/11carb.php
3https://ec.europa.eu/eurostat/statistics-explained/index.php?title=Farms_and_farmland_in_the_European_Union_-_statistics
4https://www.europarl.europa.eu/RegData/etudes/ATAG/2020/659325/EPRS_ATA(2020)659325_EN.pdf
5https://www.dlg.org/en/agriculture/tests/dlg-awards-explained
6https://www.treasurydirect.gov/savings-bonds/i-bonds/i-bonds-interest-rates/
7International Energy Agency - World Energy Outlook 2023: https://www.iea.org/reports/world-energy-outlook-2023.
8International Energy Agency - World Energy Outlook 2022: https://www.iea.org/reports/world-energy-outlook-2022.
9U.S. Energy Information Administration - Annual Energy Outlook: https://www.eia.gov/outlooks/aeo/.
10CE Delft - Energy and Electricity Price Scenarios: https://cedelft.eu/wp-content/uploads/sites/2/2021/04/CE_Delft_3H58_Energy_and_electricity_price_scenarios_DEF.pdf.
References
Abbas, A., Waseem, M., Ahmad, R., khan, K. A., Zhao, C., and Zhu, J. (2022b). Sensitivity analysis of greenhouse gas emissions at farm level: case study of grain and cash crops. Environ. Sci. Pollut. Res. 29 (54), 82559–82573. doi:10.1007/s11356-022-21560-9
Abbas, A., Zhao, C., Waseem, M., Ahmed khan, K., and Ahmad, R. (2022a). Analysis of energy input–output of farms and assessment of greenhouse gas emissions: a case study of cotton growers. Front. Environ. Sci. 9, 826838. doi:10.3389/fenvs.2021.826838
Andreas, Z., Böhm, H., Rosenfeld, D. C., and Tichler, R. (2019). Analysis on future technology options and on techno-economic optimization. Available at: https://ec.europa.eu/research/participants/documents/downloadPublic?documentIds=080166e5c58ae3ff&appId=PPGMS.
Average Spot Prices (2023). Available at: https://www.energy-charts.info/charts/price_average_map/chart.htm?l=en&c=DE&interval=year&year=2023.
Aydin, M. I., and Dincer, I. (2022). An assessment study on various clean hydrogen production methods. Energy 245, 123090. doi:10.1016/j.energy.2021.123090
Balogh, J. M. (2023). The impacts of agricultural subsidies of Common Agricultural Policy on agricultural emissions: the case of the European Union. Agric. Econ. (Zemědělská Ekon.) 69 (4), 140–150. doi:10.17221/51/2023-AGRICECON
Bhandari, R., and Shah, R. R. (2021). Hydrogen as energy carrier: techno-economic assessment of decentralized hydrogen production in Germany. Renew. Energy 177, 915–931. doi:10.1016/j.renene.2021.05.149
Breuer, J., Scholten, J., Koj, J., Schorn, F., Fiebrandt, M., Samsun, R., et al. (2022). An overview of promising alternative fuels for road, rail, air, and inland waterway transport in Germany. Energies 15 (4), 1443. doi:10.3390/en15041443
Brynolf, S., Taljegard, M., Grahn, M., and Hansson, J. (2018). Electrofuels for the transport sector: a review of production costs. Renew. Sustain. Energy Rev. 81, 1887–1905. Available at: https://linkinghub.elsevier.com/retrieve/pii/S1364032117309358.doi:10.1016/j.rser.2017.05.288
Caban, J., Vrabel, J., Šarkan, B., Zarajczyk, J., and Marczuk, A. (2018). Analysis of the market of electric tractors in agricultural production. MATEC Web Conf. 244. 03005. doi:10.1051/matecconf/201824403005
Carroquino, J., Bernal-Agustín, J.-L., and Dufo-López, R. (2019). Standalone renewable energy and hydrogen in an agricultural context: a demonstrative case. Sustainability 11 (4), 951. doi:10.3390/su11040951
CEMA (2022). The role of agricultural machinery in decarbonising agriculture. Eur. Agric. Mach. Ind. Assoc. Bruss. Available at: CEMA - European Agricultural Machinery - Home.
Charles, P. (2021). The hydrogen fueled farm of the future. Available at: https://hydrogen.wsu.edu/2021/08/04/the-hydrogen-fueled-farm-of-the-future/(Accessed April 2, 2024).
Conklin, J. C. (2023). PennState extension. [Online]. Available at: https://extension.psu.edu/exploring-the-potential-of-hydrogen-in-agriculture-farming-with-a-green-future(Accessed September 1, 2024).
Dincer, I. (2012). Green methods for hydrogen production. Int. J. Hydrogen Energy 37 (2), 1954–1971. doi:10.1016/j.ijhydene.2011.03.173
Dincer, I., and Acar, C. (2015). Review and evaluation of hydrogen production methods for better sustainability. Int. J. Hydrogen Energy 40 (34), 11094–11111. doi:10.1016/j.ijhydene.2014.12.035
Dyer, J. A., and Desjardins, R. L. (2003). The impact of farm machinery management on the greenhouse gas emissions from Canadian agriculture. J. Sustain. Agric. 22 (3), 59–74. doi:10.1300/J064v22n03_07
EU Commission (2022). Decarbonising-Europes-hydrogen-production-with-biohydrogen. Eur. Biogas Assoc. Available at: https://www.europeanbiogas.eu/decarbonising-europes-hydrogen-production-with-biohydrogen/.
EU Hydrogen Road Map (2019). Available at: https://www.clean-hydrogen.europa.eu/system/files/2019-02/Hydrogen%2520Roadmap%2520Europe_Report.pdf.
EU (2020). Available at: https://www.europarl.europa.eu/RegData/etudes/ATAG/2020/659325/EPRS_ATA(2020)659325_EN.pdf.
Ewald Luger (2021) Alternative drive systems for agricultural machinery: climate neutrality in Austria by 2040.
Fan, A., Wang, J., He, Y., Perčić, M., Vladimir, N., and Yang, L. (2021). Decarbonising inland ship power system: alternative solution and assessment method. Energy 226, 120266. doi:10.1016/j.energy.2021.120266
Fantin, V., Righi, S., Rondini, I., and Masoni, P. (2017). Environmental assessment of wheat and maize production in an Italian farmers’ cooperative. J. Clean. Prod. 140, 631–643. doi:10.1016/j.jclepro.2016.06.136
Farias, M. S. D., Schlosser, J. F., Linares, P., Barbieri, J. P., Negri, G. M., Oliveira, L. F. V. D., et al. (2017). Fuel consumption efficiency of an agricultural tractor equipped with continuously variable transmission. Ciência Rural. 47 (6). doi:10.1590/0103-8478cr20160814
Flammini, A., Pan, X., Tubiello, F. N., Qiu, S. Y., Souza, L. R., Quadrelli, R., et al. (2022). Emissions of greenhouse gases from energy use in agriculture, forestry and fisheries: 1970–2019. Earth Syst. Sci. Data 14, 811–821. doi:10.5194/essd-14-811-2022
Francesco, A., Moretti, B., Sacco, D., and Grignani, C. (2011). EUE (energy use efficiency) of cropping systems for a sustainable agriculture. Energy 36 (7), 4468–4481. doi:10.1016/j.energy.2011.03.075
Fuel Cells Bulletin (2021). Linde for hydrogen production, refueling station in Herten 2021 (5), 8. doi:10.1016/S1464-2859(21)00271-6
Gustavo, G. T. C., Matthew, R. R., and Tom, L. R. (2013). Energy Use and Greenhouse Gas Emissions from Crop Production Using the Farm Energy Analysis Tool. doi:10.1525/bio.2013.63.4.6
Giampietro, M. (2003) “Energy use in agriculture,” in eLS. 1st Edn. John Wiley and Sons, Ltd. doi:10.1038/npg.els.0003294
Grisso, R. B., Kocher, M. F., and Vaughan, D. H. (2003). Predicting tractor fuel consumption. doi:10.13031/2013.13732Available at: http://elibrary.asabe.org/abstract.asp?JID=5&AID=13732&CID=lnv2003&T=1.
Grisso, R. B., Kocher, M. F., and Vaughan, D. H. (2014). Predicting tractor fuel consumption. Available at: http://elibrary.asabe.org/abstract.asp?JID=5&AID=13732&CID=lnv2003&T=1.
Grüger, F., Dylewski, L., Robinius, M., and Stolten, D. (2018). Carsharing with fuel cell vehicles: sizing hydrogen refueling stations based on refueling behavior. Appl. Energy 228, 1540–1549. Available at: https://linkinghub.elsevier.com/retrieve/pii/S0306261918310419.doi:10.1016/j.apenergy.2018.07.014
Hellstrom, M., Rabetino, R., Schwartz, H., Tsvetkova, A., and Haq, S. H. U. (2023). GHG emission reduction measures and alternative fuels in different shipping segments and time horizons – a Delphi study. Mar. Policy 160, 105997. doi:10.1016/j.marpol.2023.105997
Hermesmann, M., and Müller, T. E. (2022). Green, turquoise, blue, or grey? Environmentally friendly hydrogen production in transforming energy systems. Prog. Energy Combust. Sci. 90, 100996. doi:10.1016/j.pecs.2022.100996
Janke, L., McDonagh, S., Weinrich, S., Nilsson, D., Hansson, P. A., and Nordberg, Å. (2020). Techno-economic assessment of demand-driven small-scale green hydrogen production for low carbon agriculture in Sweden. Front. Energy Res. 8, 595224. doi:10.3389/fenrg.2020.595224
Jonas, E., and Lagnelöv, O. (2018). An autonomous electric powered tractor—simulation of all operations on a Swedish dairy farm. J. Agric. Sci. Technol. A 8, 182–187. doi:10.17265/2161-6256/2018.03.006Available at: http://www.davidpublisher.org/index.php/Home/Article/index?id=36884.html.
Klöckner, J. (2020). Understanding farming: facts and figures about German farming: source federal ministry of food and agriculture. Available at: https://www.bmel.de/SharedDocs/Downloads/EN/Publications/UnderstandingFarming.html.
Korberg, A. D., Brynolf, S., Grahn, M., and Skov, I. (2021). Techno-economic assessment of advanced fuels and propulsion systems in future fossil-free ships. Renew. Sustain. Energy Rev. 142, 110861. doi:10.1016/j.rser.2021.110861
Lagnelöv, O., Larsson, G., Nilsson, D., Larsolle, A., and Hansson, P. A. (2020). Performance comparison of charging systems for autonomous electric field tractors using dynamic simulation. Biosyst. Eng. 194, 121–137. doi:10.1016/j.biosystemseng.2020.03.017
Lajunen, A., Sainio, P., Laurila, L., Pippuri-Mäkeläinen, J., and Tammi, K. (2018). Overview of powertrain electrification and future scenarios for non-road mobile machinery. Energies 11 (5), 1184. doi:10.3390/en11051184
Larry, G. (2008) Agriculture: contribution to climate change. Available at: https://www.encyclopedia.com/
Micena, R. P., Llerena-Pizarro, O. R., de Souza, T. M., and Silveira, J. L. (2020). Solar-powered hydrogen refueling stations: a techno-economic analysis. Int. J. Hydrogen Energy 45 (3), 2308–2318. doi:10.1016/j.ijhydene.2019.11.092
Montenegro Camacho, Y. S., Bensaid, S., Piras, G., Antonini, M., and Fino, D. (2017). Techno-economic analysis of green hydrogen production from biogas autothermal reforming. Clean Technol. Environ. Policy 19 (5), 1437–1447. doi:10.1007/s10098-017-1341-1
Mousazadeh, H., Keyhani, A., Javadi, A., Mobli, H., Abrinia, K., and Sharifi, A. (2010). Optimal power and energy modeling and range evaluation of a solar assist plug-in hybrid electric tractor (SAPHT). Trans. ASABE 53 (4), 1025–1035. doi:10.13031/2013.32586
Nasser, M., and Hassan, H. (2023). Techno-enviro-economic analysis of hydrogen production via low and high temperature electrolyzers powered by PV/Wind turbines/Waste heat. Energy Convers. Manag. 278, 116693. doi:10.1016/j.enconman.2023.116693
Our World in Data (2020). Available at: https://ourworldindata.org/emissions-by-sector.
Paris, B., Papadakis, G., Janssen, R., and Rutz, D. (2021). Economic analysis of advanced biofuels, renewable gases, electrofuels and recycled carbon fuels for the Greek transport sector until 2050. Renew. Sustain. Energy Rev. 144, 111038. doi:10.1016/j.rser.2021.111038
Paris, B., Vandorou, F., Tyris, D., Balafoutis, A. T., Vaiopoulos, K., Kyriakarakos, G., et al. (2022). Energy use in the EU livestock sector: a review recommending energy efficiency measures and renewable energy sources adoption. Appl. Sci. 12 (4), 2142. doi:10.3390/app12042142
Porter, H., and Michael, P. (2014) “Hydrogen fueling station in honolulu,” in Hawaii feasibility analysis.
Proost, J. (2019). State-of-the art CAPEX data for water electrolysers, and their impact on renewable hydrogen price settings. Int. J. Hydrogen Energy 44 (9), 4406–4413. doi:10.1016/j.ijhydene.2018.07.164
Reksten, A. H., Thomassen, M. S., Møller-Holst, S., and Sundseth, K. (2022). Projecting the future cost of PEM and alkaline water electrolysers; a CAPEX model including electrolyser plant size and technology development. Int. J. Hydrogen Energy 47 (90), 38106–38113. doi:10.1016/j.ijhydene.2022.08.306
Roberto Henke, C. (2021). Italian agriculture in figures 2020. Research Centre for Agricultural Policies and Bioeconomy.
Safa, M., and Samarasinghe, S. (2013). Modelling fuel consumption in wheat production using artificial neural networks. Energy 49, 337–343. doi:10.1016/j.energy.2012.10.055
Šarauskis, E., Buragienė, S., Masilionytė, L., Romaneckas, K., Avižienytė, D., and Sakalauskas, A. (2014). Energy balance, costs and CO2 analysis of tillage technologies in maize cultivation. Energy 69, 227–235. doi:10.1016/j.energy.2014.02.090
Seithe, G. J., Bonou, A., Giannopoulos, D., Georgopoulou, C. A., and Founti, M. (2020). Maritime transport in a life cycle perspective: how fuels, vessel types, and operational profiles influence energy demand and greenhouse gas emissions. Energies 13 (11), 2739. doi:10.3390/en13112739
Šimunović, J., Pivac, I., and Barbir, F. (2022). Techno-economic assessment of hydrogen refueling station: a case study in Croatia. Int. J. Hydrogen Energy 47 (57), 24155–24168. doi:10.1016/j.ijhydene.2022.05.278
Stakens, J., Mutule, A., and Lazdins, R. (2023). Agriculture electrification, emerging technologies, trends and barriers: a comprehensive literature review. Latv. J. Phys. Tech. Sci. 60 (3), 18–32. doi:10.2478/lpts-2023-0015
The U.S.Department of Agriculture (USDA) (2022) Conservation practices on cultivated cropland. Available at: https://www.nrcs.usda.gov/sites/default/files/2022-12/ceap-croplands-ConservationPracticesOnCultivatedCroplands-summary-March2022.pdf.
Tihanov, G., and Ivanov, N. (2021). Fuel consumption of a machine-tractor unit in direct sowing of wheat. Agric. Sci. Technol. 13 (1), 40–42. doi:10.15547/ast.2021.01.007
Keywords: fuel consumption, hydrogen refuelling system, decarbonisation, agricultural machinery, hydrogen, crop farming
Citation: Anthony K, Hellström M and Spohr J (2025) Techno-economic assessment of hydrogen application in cereal crop farming. Front. Energy Res. 13:1479212. doi: 10.3389/fenrg.2025.1479212
Received: 11 August 2024; Accepted: 09 January 2025;
Published: 10 February 2025.
Edited by:
Siamak Hosseinzadeh, Sapienza University of Rome, ItalyReviewed by:
Shraddha Maitra, University of Illinois at Urbana-Champaign, United StatesMorteza Taki, Agricultural Sciences and Natural Resources University of Khuzestan, Iran
Copyright © 2025 Anthony, Hellström and Spohr. This is an open-access article distributed under the terms of the Creative Commons Attribution License (CC BY). The use, distribution or reproduction in other forums is permitted, provided the original author(s) and the copyright owner(s) are credited and that the original publication in this journal is cited, in accordance with accepted academic practice. No use, distribution or reproduction is permitted which does not comply with these terms.
*Correspondence: Katumwesigye Anthony, YW50aG9ueS5rYXR1bXdlc2lneWVAYWJvLmZp