 Junliang Li
 Meng Cai1,2
 Na Wei
- 1Production Engineering and Research Institute, Daqing Oilfield Company, Daqing, China
- 2Heilongjiang Provincial Key Laboratory of Oil and Gas Reservoir Stimulation, Daqing, China
- 3State Key Laboratory of Oil and Gas Reservoir Geology and Exploitation, Southwest Petroleum University, Chengdu, Sichuan, China
During throttling and pressure reduction, hydrates can form due to changes in pipeline pressure, particularly in natural gas with high water content. The formation of hydrates obstructs gas flow, even in minimal quantities, resulting in elevated differential pressure and accelerating hydrate formation, which leads to technical challenges such as diminished production and pressure retention. This study introduces and verifies a multi-field coupling risk prediction model for hydrate blockages in natural gas pipelines. The model integrates the temperature field, pressure field, multiphase flow theory, and hydrate clogging theory. Based on this foundation, the impacts of inlet temperature, pressure, and gas volume on the formation of hydrates in pipelines were analyzed, and the most vulnerable blocked point and the maximum formation rate were determined for different sensitivity factors. The results show that elevated inlet pressure and reduced inlet temperature enhance the maximal hydrate formation rate, while gas volume exerts a negligible influence. And increasing gas transport will move the most susceptible blockage point downstream. Finally, the original model is used to forecast actual gas hydrate plugging using time discretization and iterative calculation approaches.
1 Introduction
At the moment, the world’s energy structure is in transition. Natural gas is a clean energy source with a high calorific value of burning, low emissions, and low pollution levels, making it a desirable transitional energy source in the current energy system (Hu et al., 2023). Natural gas has become an essential energy source for both industrial and domestic use. In addition to focusing on development and extraction, attention must also be given to the safety and efficiency of natural gas transmission (Foster Natural Gas Report group, 2013). The transportation mode of natural gas has its characteristics, including pipeline transmission, liquefied natural gas transmission, and natural gas compression transmission. Pipeline transportation is the most prevalent method employed. While pipeline transportation is typically regarded as a secure and economical method of conveyance, it nonetheless presents possible safety hazards. It could lead to significant consequences for people, the environment, and property (Markiewicz, 2024). The diverse characteristics of the fluid in question, coupled with the complex fluctuations in temperature and pressure that occur during the process of gas collection, render hydrate formation a significant risk factor for the safe operation of gas collection (Chen et al., 2020; Abbasi and Hashim, 2016). Natural gas hydrate is a crystalline structure composed of hydrocarbon gas and water that forms under high-pressure and low-temperature conditions (Zhou et al., 2023). In 1934, Hammerschmidt initially identified that gas hydrates might obstruct gas pipelines (Hammerschmidt, 1934). The formation of a small quantity of hydrate will narrow the gas flow path, cause throttling, and subsequently accelerate hydrate formation (As shown in Figure 1). A significant buildup of hydrates can obstruct pipeline valves and equipment, resulting in complications such as diminished production, production interruptions, pressure hold-ups in gas-gathering pipelines, and potentially grave pipeline incidents and fatalities (Tang et al., 2020; Sun et al., 2021). However, during gas hydrate formation, the temperature, pressure field, and fluid flow state are in a dynamic change process (Wang et al., 2023; Simon, 2023; Misyura, 2022). To clarify the mechanism of gas hydrate plugging and reduce the safety risk in the pipeline transportation process, it is necessary to investigate the risk of gas pipeline hydrate plugging through coupled calculations of temperature and pressure fields, multiphase flow theory, and the gas hydrate growth and plugging model.

Figure 1. Natural gas transport pipeline and hydrate blockage process.
Up to now, a significant body of research has been conducted on calculating gas-gathering pipelines. Sehorre proposed the first equation to predict the temperature change of pipelines in 1954 (Schorre, 1954); Englezos et al., in 1987 employed a modified V-B experimental setup to measure the growth kinetic data for methane and ethane. This data was then used to derive a hydrate kinetic model (Englezos et al., 1987); Erik M. Freer obtained the kinetic parameters of methane hydrate formation in his measurements, revealed that the growth rate of hydrate is proportional to the degree of supercooling, and proposed a simultaneous consideration of heat transfer and kinetic hydrate formation model (Freer et al., 2001); Hashemi et al. proposed a hydrate growth driver based on the gas hydrate formation concentration at experimental temperature and experimental pressure, assuming a vapor-liquid water equilibrium as well as a hydrate-liquid water equilibrium under the same conditions (Hashemi et al., 2007). Sebastien Bergeron and Phillip Servio incorporated this new driving force into an adapted edition of the Englezos model. This led to the development of a novel kinetic model for hydrate growth (Bergeron and Servio, 2007). In order to eliminate the uncertainty value of the dissolution rate at the gas-liquid-water interface, Bergeron et al. also proposed an alternative formulation of the hydrate growth model based on an experimental study of a semi-intermittent stirred kettle reactor (Englezos et al., 1987); Sonne et al. modeled a condensate transmission pipeline and concluded that the critical dependence of pipeline gas hydrate is on liquid-holding capacity, shear rate, and hydrate content (Bergeron and Servio, 2009); Kishimoto observed hydrate crystal growth and measured the lateral growth rate of the hydrate film (Sonne et al., 2009); The experiments conducted by Webb revealed a notable increase in viscosity during the formation of slurry hydrates (Kishimoto et al., 2011); Rao et al. studied the process of hydrate formation and deposition on pipe walls in saturated aqueous methane systems (Webb et al., 2012); Sanjeev V. Joshi proposed a gas hydrate plugging mechanism for purely aqueous systems (Rao et al., 2013); Kvamme analyzed the mechanism of hydrate formation when water and impurities are carried during the transportation of natural gas through pipelines (Joshi et al., 2013); Masoumeh Akhfash observed the formation of hydrates in sapphire autoclave equipment observed the hydrate particle generation-deposition process and proposed a conceptual mechanism for hydrate plug formation in partially dispersed oil-water systems based on the findings (Kvamme et al., 2016); Liu et al. developed a model for assessing the degree of wellbore plugging used for deep-water gas well testing, and analyzed the different degrees of influence of the gas production rate, the methanol concentration, and the rate of water production on the hydrate plugging (Akhfash et al., 2016); Klymenko et al. developed a model for assessing the degree of hydrate plugging in deep-water gas wells based on the Aspen Hysys to simulate the process of changing thermodynamic parameters of the supply fluid and hydrate deposits in the pipeline (Liu et al., 2018a).
Based on the relevant knowledge of the existing research on gas hydrate pipeline plugging, it is found that previous research has not adequately considered the dynamic changes of critical factors such as temperature, pressure, and flow pattern during the formation of natural gas hydrate. Therefore, this paper will use numerical simulation to build a multi-physical field model and carry out coupling calculations. Finally, to ensure the accuracy and reliability of the model, the results were compared concerning the existing literature.
2 Hydrate plugging prediction model
The temperature and pressure distribution within the gas collection pipeline, along with the phase equilibrium conditions of the gas hydrate, are crucial in forecasting the risk of hydrate formation. The phase equilibrium of the gas hydrate is predominantly influenced by the fluid composition as well as the type and concentration of inhibitors (Klymenko et al., 2022). By calculating the pressure, temperature, and hydrate phase equilibrium conditions, a prediction method for hydrate formation in transport pipelines can be established (Zhang et al., 2024). In the context of natural gas pipeline transmission, the potential for hydrate formation can be determined by comparing the pipeline’s temperature and pressure with the hydrate phase equilibrium conditions. When the natural gas gathering pipeline contains water, the pressure is higher than the hydrate phase equilibrium pressure, and the temperature is lower than the phase equilibrium temperature, the environment is considered favorable for hydrate formation, and then there is a risk of hydrate formation in the pipeline (Wei et al., 2019; Wang et al., 2014). Under conditions where hydrates can be generated, the risk of hydrate generation can be judged by the degree of subcooling, which is the variance between the tube flow temperature and the hydrate phase equilibrium temperature. The higher the subcooling, the higher the risk of hydrate generation (Cai et al., 2018; Bykov et al., 2022).
Considering the actual situation, assumptions are made for the evaluation model of hydrate deposition in gathering and transportation pipelines as follows:
(1) The flow within the pipeline is a stable, one-dimensional flow of compressible fluid;
(2) During a long stability period, the phase transition heat generated by the hydrate itself is smaller than the external exchange heat of the pipeline, and it can be approximated that the external ambient temperature of the pipeline remains unchanged.
2.1 Multiphase flow model
The multiphase flow model mainly consists of two parts: the continuity equation and the motion equation (Wei et al., 2018), which are respectively introduced below:
(1) Continuity equation
The basic flow equation is established: a section of fluid with length dz is considered as the control volume for the continuity equation, as shown in Figure 2. The fluid in the control body is analyzed. Fluid inflows from Section 1.1 and outflows from Section 2.2.
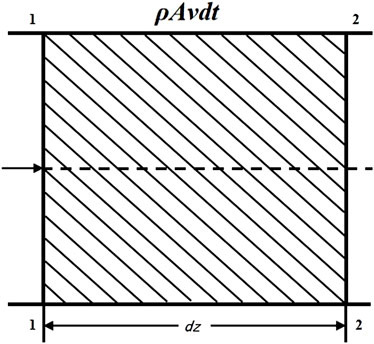
Figure 2. Continuity equation control body.
Given the cross-sectional area of the flow channel A, in dt time, the law of conservation of mass in Equation 1 can be obtained:
After simplification, the gas phase continuity equation in this state can be obtained, which can be sorted into tensor equation (Equation 2):
Similarly, the liquid phase continuity equation in this state can be obtained, and its tensor equation is as Equation 3:
ρl represents density of the liquid phase, kg/m³; ρg represents the gas phase density, kg/m³; vl stands for velocity of the liquid phase, m/s; vg stands for velocity of the gas phase, m/s; αl table liquid holdup, dimensionless; αg indicates gas retention, dimensionless.
(2) Momentum equation
According to the stress of the model, the tensor form that controls the momentum equation of the gas phase in the body can be constructed (Equation 4):
Similarly, the equation in tensor form controlling the motion of the liquid phase is Equation 5:
Equation 6 of the motion equation of gas-liquid two-phase mixed fluid can be obtained by adding the two formulas:
To facilitate simplification, the shear stress between the gas-liquid two-phase mixed fluid and the wall is written in the form of friction as in Equation 7:
Therefore, the tensor form of the gas-liquid two-phase motion equation in the well is Equation 8:
ρm represents the average density of the two-phase fluid, kg/m³; vm stands for the average velocity of a two-phase fluid, m/s; p represents local pressure in the tube, Pa; fF indicates the coefficient of resistance along the pipeline; D indicates pipe diameter, m; V indicates flow rate of two-phase fluids, m/s.
2.2 Pipeline pressure variation model
A model of the pressure variation in the process of natural gas transport is established (Jiang et al., 2022). Assuming that the pipeline flow is a one-dimensional stable flow problem of compressible fluid, using the Weymouth formula (Adeosun et al., 2009) to calculate pressure distribution, namely Equation 9:
Starting at the inlet of the gas collection pipeline, the pressure gradually decreases with pipe extension, with a more rapid decline noted near the terminal. Therefore, in the gas collecting pipe, the pressure does not change in a straight line. Where P1、P2 respectively represent the starting point pressure, the final point pressure, Pa;
2.3 Pipeline temperature variation model
Drawing from the principles of energy conservation and the heat conduction equation, a temperature distribution model for the pipeline is formulated (Wang et al., 2014; Cai et al., 2018). At the place where the starting point is
After separating variables, integral is performed, and finally solved, we can obtain Equation 11:
Where a is shown in Equation 12:
Where M denotes the mass flow rate of the medium, kg/s;
2.4 Hydrate growth and plugging model
(1) Thermodynamic model for hydrate growth
From a thermodynamic perspective, the formation of natural gas hydrates is contingent upon the following conditions: the presence of water and hydrocarbon gases that can form hydrates; temperature and pressure conditions conducive to the formation of hydrates; and the existence of a center within the fluid that facilitates the crystallization of hydrates. Each gas has a critical temperature below which hydrates will form. At temperatures above this threshold, regardless of the pressure, the formation of hydrates is precluded. Similarly, at a certain temperature, each gas also has a corresponding critical pressure. If the pressure is higher than this threshold, hydrates will form, which will subsequently result in a blockage (Wei et al., 2021). As shown in Figure 3.
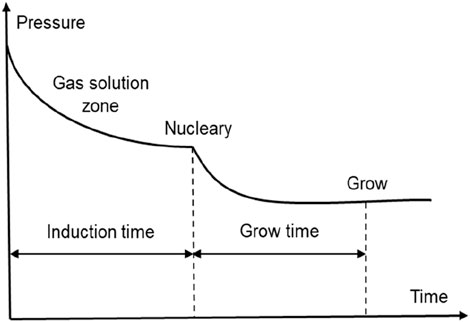
Figure 3. Hydrate aggregation and blockage process.
This article will use the Chen Guo model (Chen et al., 2000). Chen and Guo proposed a two-stage hydrate formation mechanism different from the van der Waals Platteeuw model: guest molecules and water molecules generate stoichiometric basic hydrates through quasi-chemical reactions. Then, some small gas molecules adsorb in the cavity where the basic hydrate exists, resulting in the nonstoichiometric nature of the hydrate. The calculation formula for the fugacity of guest molecule i (Equation 13) was given using statistical thermodynamics:
Where Δμ is calculated according to the following Equation 14:
In the equation, λ1 represents the number of small pores per unit of water molecule; λ2 represents the number of large pores per unit of water molecule; Δμ0 represents the difference in chemical potential between the empty hydrate phase and the aqueous phase; Δh0 indicates the molar enthalpy difference between the empty hydrate phase and the aqueous phase; ΔV0 represents the molar volume difference between the empty hydrate phase and the aqueous phase; ΔCp represents the specific heat resistance between the hydrate phase and the aqueous phase;
Combined with the fraction xi of component i, the thermodynamic formation model of hydrate can be derived as Equations 15, 16:
(2) Kinetic model of hydrate growth
Kinetically, hydrates form through both nucleation and growth processes. Nucleation refers to the process in which the micro-hydrate crystal attempts to reach a critical size, which is a random micro-scale process that cannot be detected from the macro level and represents the beginning of a phase transition. The degree of supercooling is defined as the difference between the phase equilibrium temperature (Teq) of hydrate formation and the actual temperature (Tx) under a certain pressure. A hydrate nucleus is formed at the time interval when the subject molecule meets the guest molecule, and this interval is the induction time. The generation of natural gas hydrates is dependent on the pressure and liquid flow rate within the flow regime. The processes of hydrate nucleation and growth occur simultaneously, and the degree of supercooling can be expressed as Equation 17:
On this basis, the induction time is used to evaluate the ability of the supersaturated system to maintain a metastable equilibrium state, and the induction time model and the intrinsic dynamics model are generated by combining water and matter. Through simplification, Equation 18 can be obtained:
Where n represents gas consumption, mol; K* represents the total rate coefficient of hydrate formation, mol/(m2·MPa·s); Ap represents the surface area of hydrate particles, m2; f represents gas fugacity, MPa; feq is the fugacity of gas at three-phase equilibrium, MPa; kr represents the reaction rate coefficient, mol/(m2·MPa·s); kd represents the mass transfer coefficient, mol/(m2·MPa·s); kL stands for liquid layer mass transfer coefficient, m/s; A(g-l) represents the gas-liquid contact area, m2; cw0 is the initial concentration of water molecules, mol/m³; xint represents the interfacial liquid phase molar fraction; Quantity fraction of xb liquid phase substance.
(3) Hydrate plugging model
During the gas collection process, it is crucial to pay attention to the deposition of hydrate particles that result from liquid droplets on the inner surface of the tube. Free water on the pipe wall causes hydrate particles to adhere more strongly to the pipe wall than other hydrate particles. It has been shown that inhibition of hydrate formation and aggregation can also be achieved by increasing the flow rate to enhance gas perturbation. The following Equation 19 can be used to calculate the hydrate particle deposition rate per unit length of pipe:
In the process of hydrate deposition on the wall of the pipe to form a constantly growing hydrate film, the diameter of the pipe decreases at the following rate (Equation 20):
Hydrate film thickness (Equation 21):
The blockage rate is Equation 22:
WhereΔTsub and Teq represent supercooling degree and phase equilibrium temperature respectively, K; Rhd stands for gas pipeline hydrate production, mol; rf stands for effective pipe diameter, m; k1 represents the kinetic constant without dimension; k2 denotes the activation temperature for the formation of hydrates, K; ρh represents the density of hydrate, kg/m³; u stands for empirical coefficient, without dimension; δh represents the deposit thickness of the hydrate layer, m; δD represents the plugging rate, i.e., the extent of gas line blockages.
3 Model solving and verification
3.1 Model solving
A predictive and evaluative model of hydrate plugging, which includes some nonlinear equations, has been presented above. We segmented the pipeline into a limited number of sections based on its length. Because of the interrelated relationship between pressure, temperature, multiphase flow, and the rate of hydrate deposition in the pipeline, a coupling mathematical model is established by linking the multiphase flow model, the pressure variation model, the temperature variation model, and the hydrate growth and plugging model, and the iterative method is adopted to solve the problem. Based on this, the region where hydrate formation occurs is identified, and the influence of relevant parameters is analyzed. The division of nodes and the solving process are shown in Figure 4.
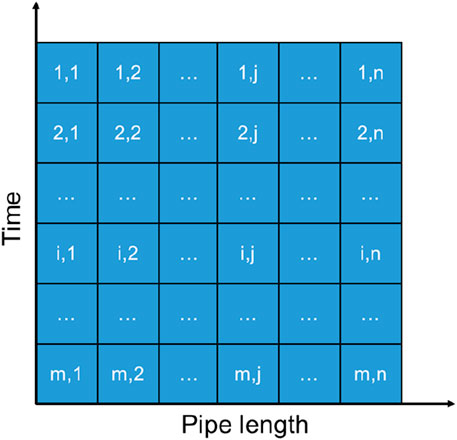
Figure 4. Gathering and transportation pipeline grid division.
Meanwhile, according to actual, the initial conditions for solving the above model can be obtained as in Equation 23:
The boundary conditions are Equations 24, 25:
Where Px(0) indicates the pressure at the beginning of the pipeline, Pa; Px(l) indicates the end-point pressure at l, Pa; Tx(0) indicates the temperature at the start of the pipeline, K. Calculated from the starting to the endpoint.
3.2 Model verification
To validate the accuracy of the proposed theoretical evaluation model and numerical simulation calculation, the actual data of an onshore pipeline mentioned in the reference (Liu et al., 2018b) in this paper was first used for calculation under the following conditions: The pipeline length is 150 km, the inner diameter of the pipeline is 0.7 m, the relative density of natural gas is 0.632, the starting pressure is 3.5 MPa, the starting temperature is 313.15 K, the mean daily gas delivery is 180 × 104 m3, the mean daily water production is 2.72 m3, and the ambient temperature is 263.15 K. The gas components of the pipeline are shown in Table 1. The model calculation results for the data of the onshore pipeline are shown in Figure 5.

Table 1. Gas components of the pipeline.
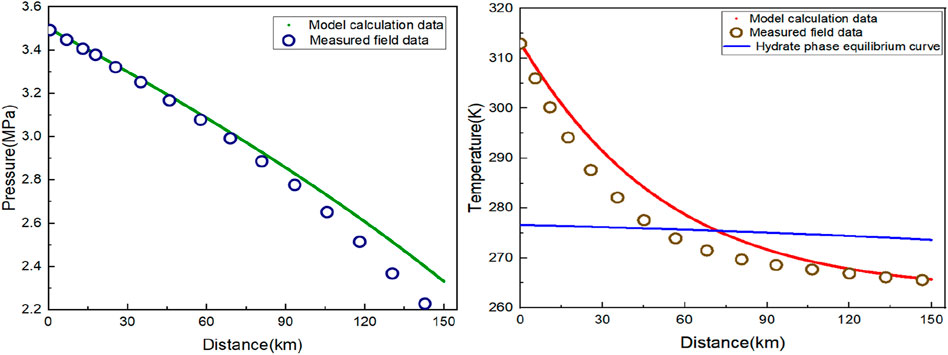
Figure 5. Model calculation result.
The calculated end pressure of the onshore pipeline is 2.33 MPa, and the actual end pressure of the onshore pipeline is 2.23 MPa. The calculated end temperature is 265.70 K, and the exact temperature is 264.98 K. The average pressure error is 4.19%, and the average temperature error is 6.7%, which is within the allowable error range. The hydrate generation starting point is 71.67 km, and the actual hydrate generation starting point is 68.91 km, leading to a calculated difference of 4.01%.
To validate the model further, the pipeline data in reference (Wang, 2015) of this paper was calculated. The calculation conditions are as follows: The pipeline length is 200 km, the inner diameter of the pipeline is 0.5 m, the relative density of natural gas is 0.702, the starting pressure is 9 MPa, the starting temperature is 323.15 K, the mean annual gas delivery is 1.5 × 10⁹ m3, and the ambient temperature is 278.15 K. The gas components of the pipeline are shown in Table 2. The model calculation results of the data for the onshore pipeline are shown in Figure 6.

Table 2. Gas components of the pipeline.
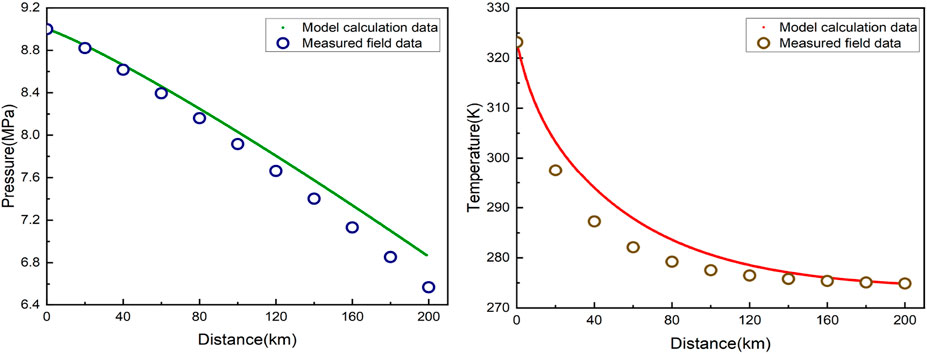
Figure 6. Model calculation result.
The calculated onshore pipeline terminal pressure is 6.85 MPa, while the actual onshore pipeline terminal pressure is 6.57 MPa. Similarly, the calculated terminal temperature is 274.81 K, while the actual temperature is 274.8 K. The average pressure error is 3.76%, and the average temperature error is 5.69%. These values fall within the allowable error range. The comparative results of the two pipelines verify the accuracy of the theoretical model and numerical simulation, indicating that the evaluation model and calculation method of hydrate generation in the natural gas gathering and transportation pipelines formed in this paper are highly accurate.
4 Analysis of sensitivity factors
Based on verifying the reliability of the established gas hydrate plugging prediction model, a large-scale numerical simulation was carried out based on the concentration and transportation data of an onshore gas field, and sensitivity analysis was carried out to clarify the critical parameters of pipeline flow for the pipeline plugging response. Table 3 shows the calculation parameters related to the natural gas transportation of a trial pipeline.
Table 3. Basic pipeline and calculation parameters.
Based on the above predictive model of gas hydrate blockage in the transport pipeline, the influence laws of inlet pressure, inlet temperature, and gas volume were analyzed (Jiang et al., 2022; Adeosun et al., 2009; Wei et al., 2021). The sensitivity analysis is depicted in Table 4.
Table 4. Sensitivity analysis table.
4.1 Inlet pressure
Under the conditions of inlet pressures of 5.5 MPa, 6 MPa, and 6.5 MPa, respectively, the temperature, pressure, density, and hydrate generation rate of concentration and transportation pipelines at different inlet pressures were calculated, as shown in Figure 7.
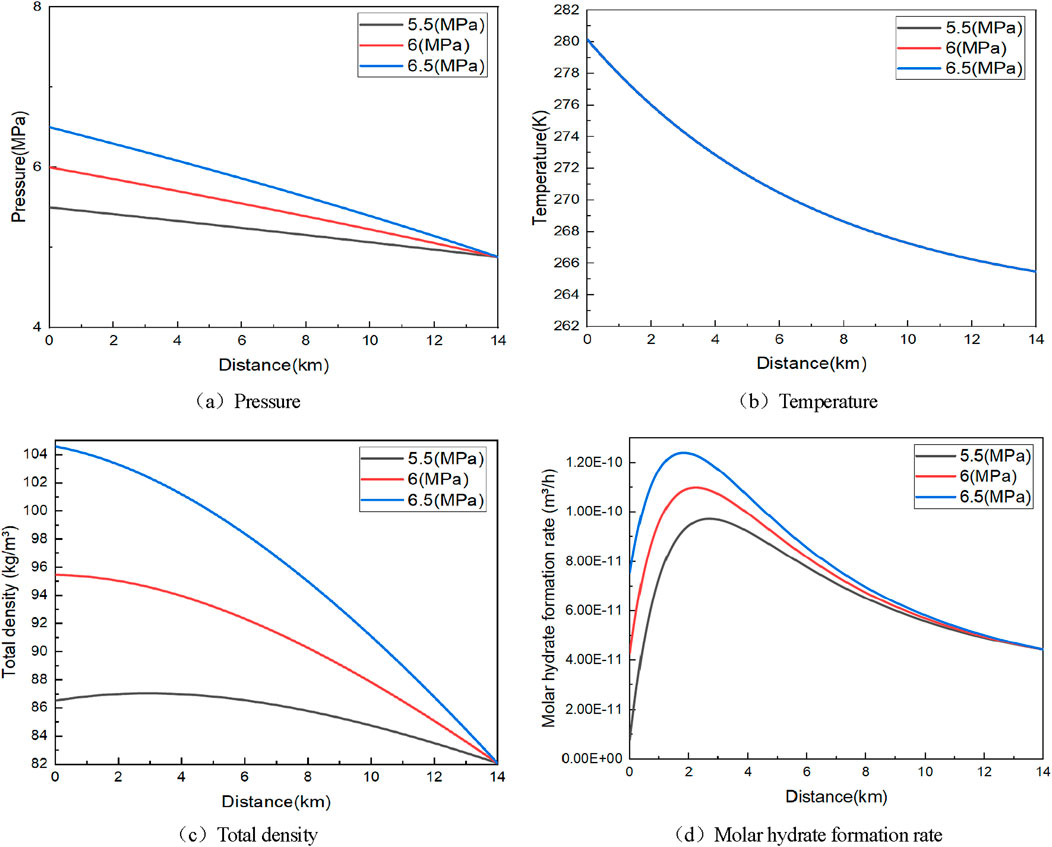
Figure 7. The variation rule under different wellhead pressure conditions. (A) Pressure, (B) Temperature, (C) Total density, (D) Molar hydrate formation rate.
As can be seen from Figure 7, as the inlet pressure rises from 5.5 MPa to 6.5 MPa, the increase in overall density causes the pressure loss to increase continuously, and the overall change trend of the hydrate generation rate is the same, which increases first, then decreases, and finally tends to a fixed value. At the same time, the maximum generation rate point exists in the simulated pipeline concentration and transportation process. The lateral distance corresponding to the maximum rate of hydrate formation is inversely proportional to the change in pressure. The main reason is that the increase in pressure causes the critical temperature of hydrate formation to rise, thus accelerating the rate of hydrate formation and making the blockage phenomenon appear in advance.
Figure 7 results of hydrate formation rate show that when the inlet pressure is 5.5 MPa, 6 MPa, and 6.5 MPa, hydrate will be formed in the whole pipe section. However, since the change in pressure is proportional to the hydrate formation rate, at 5.5 MPa, 6 MPa, and 6.5 MPa, the corresponding maximum hydrate formation rates are 0.98 × 10⁻¹⁰ m3/h, 1.099 × 10⁻¹⁰ m3/h, and 1.24 × 10⁻¹⁰ m3/h, respectively, and the corresponding transverse axis distances are 2,568, 2,110, and 1783 m, respectively. It can be found that the transverse axis distance and the maximum hydrate formation rate increase slightly. The results show that the rate of hydrate formation increases nonlinearly with the growth of pressure. Based on the analysis above, it can be concluded that while the natural gas pipeline is in operation, the lower inlet pressure will reduce the maximum hydrate generation rate and, at the same time, the position that is most likely to be blocked after the formation of hydrate will shift to the end, which is conducive to reducing the risk of gas hydrate plugging.
4.2 Inlet temperature
Under the conditions of initial flow temperatures of 266.15 K, 273.15 K, and 280.15 K, respectively, the temperature, pressure, density, and hydrate generation rate of concentration and transportation pipelines at different inlet temperatures were calculated, as shown in Figure 8.
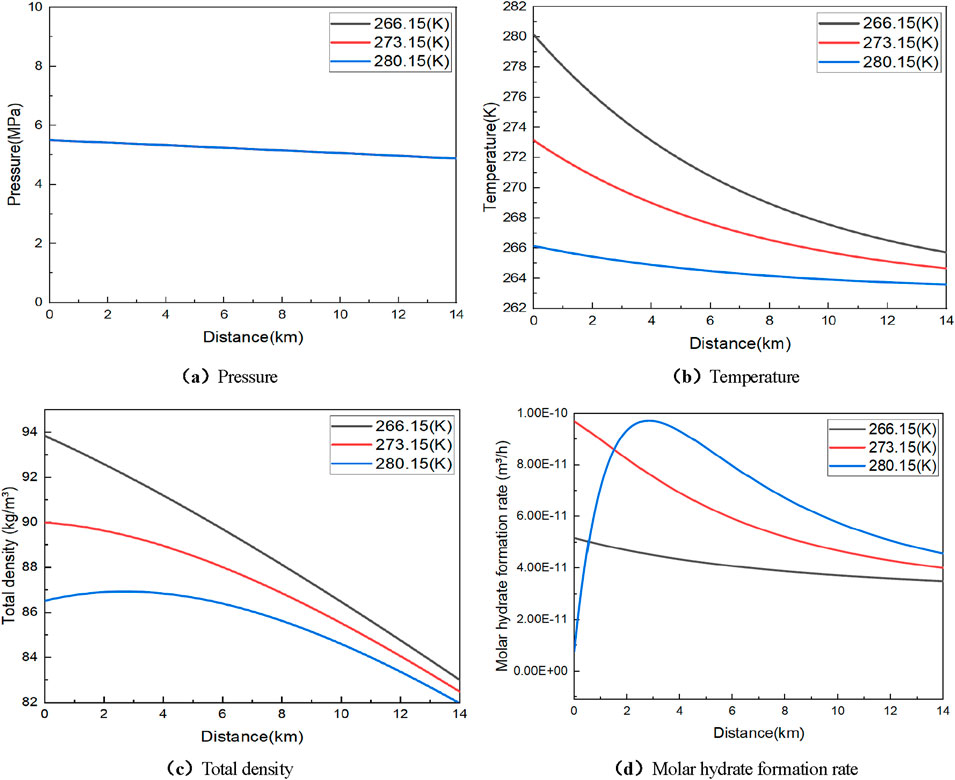
Figure 8. The variation rule under different wellhead temperature conditions. (A) Pressure, (B) Temperature, (C) Total density, (D) Molar hydrate formation rate.
The density results depicted in Figure 8 clearly illustrate that as the inlet temperature rises from 266.15 K to 280.15 K, there is a notable decrease in total density from the initial to the final station along the pipeline. Moreover, the extent of this decrease diminishes progressively from the starting point to the endpoint. This pattern is primarily attributed to the increase in inlet temperature, which enhances the amount of heat the fluid carries through the pipeline over time, subsequently raising the temperature throughout the entire gathering system. Nonetheless, owing to heat dissipation, the temperature of the flow consistently drops. If the pipeline is extended indefinitely, the flow temperature will eventually converge to the same 263.15 K as the ambient temperature, and the change law of the flow temperature plays a dominant role in the change of the total density.
As shown in Figure 8, hydrates will be generated in the whole pipe section when the inlet temperature is 266.15 K, 273.15 K, and 280.15 K. However, it is evident from the calculated results of the hydrate generation rate that the hydrate generation rate has a maximum value in the concentration and transmission processes. As the temperature increases, the most easily clogged position corresponding to the maximum hydrate generation rate will move backward. The maximum rate of hydrate formation tends to a certain value, which not only indicates that the degree of blockage of the pipeline will gradually decrease but also confirms that the increase in temperature is conducive to preventing the formation of hydrate. Drawing from the preceding analysis, it is evident that a higher inlet temperature in the natural gas gathering pipeline operation process will narrow the hydrate generation range and reduce the degree of supercooling during hydrate formation. This makes it more likely for blockages to occur at the end after hydrate generation shifts. Therefore, a higher flow temperature will help ensure safety in preventing and controlling hydrates during the concentration and transportation processes.
4.3 Gas transmission
Under the conditions of gas volumes of 0.5 × 10⁴ m3/d, 1 × 10⁴ m3/d, and 1.5 × 10⁴ m3/d respectively, the temperature, pressure, density, hydrate generation rate of concentration, and transportation pipelines at different gas volumes were calculated, as shown in Figure 9.
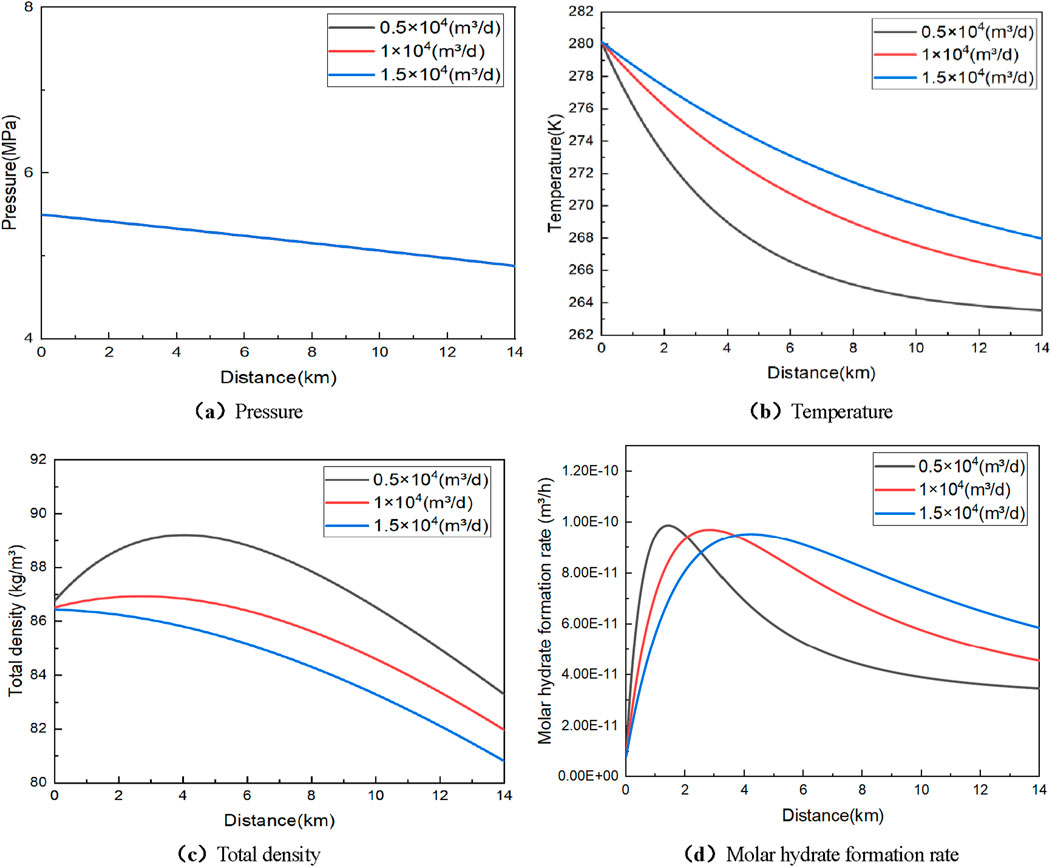
Figure 9. The change rule under different collecting and transporting capacity. (A) Pressure, (B) Temperature, (C) Total density, (D) Molar hydrate formation rate.
It can be seen in Figure 9 that as the gas transmission increases from 0.5 × 10⁴ m³/d to 1.5 × 10⁴ m³/d, the temperature drop keeps decreasing, and the total density keeps increasing. The increased range is more extensive than that of pressure and temperature. Different from the changing trends in temperature and pressure, the maximum formation rate of hydrate is similar. They are 9.91 × 10⁻¹¹ m3/h, 9.56 × 10⁻¹¹ m3/h, and 9.23 × 10⁻¹¹ m3/h, respectively, and the corresponding transverse distances gradually move backward to 1361 m, 2837 m, and 4368 m, respectively, indicating that the change of gas transmission is inversely proportional to the transverse distance corresponding to the maximum rate of hydrate formation. The specific reason is that after the gas transmission is reduced, there is an adequate heat exchange between the inside of the pipe and the outside world, which reduces the temperature of the fluid and the critical pressure for hydrate formation, resulting in the formation in advance and thus blocking the pipeline.
In Figure 9, hydrate formation and blockage occurred in the whole process when the gas volume was 0.5 × 10⁴ m³/d, 1 × 10⁴ m³/d and 1.5 × 10⁴ m³/d, and the maximum total density was 89.20 kg/m3, 86.94 kg/m3 and 86.53 kg/m3, respectively. The temperature variation trend was the same as the total density. The overall temperature drop was 289.75 K, 286.59 K, and 285.32 K, respectively, and the decreasing range of the two factors was constantly decreasing. Comprehensive analysis shows that higher gas transmission can reduce the mixing density of the fluid in the pipeline to reduce temperature drop loss, which helps to reduce the incidence of pipeline blockages caused by gas hydrates.
5 Case analysis
Using the gas hydrate concentration and transportation pipeline clogging prediction model established in this paper, a numerical simulation was carried out on an oil field external transportation pipeline currently in operation. The essential data on the external transportation pipeline is shown in Table 5.
Table 5. Essential data.
The curves of temperature, pressure, density, and hydrate formation rate obtained through model calculation are shown in Figure 10.
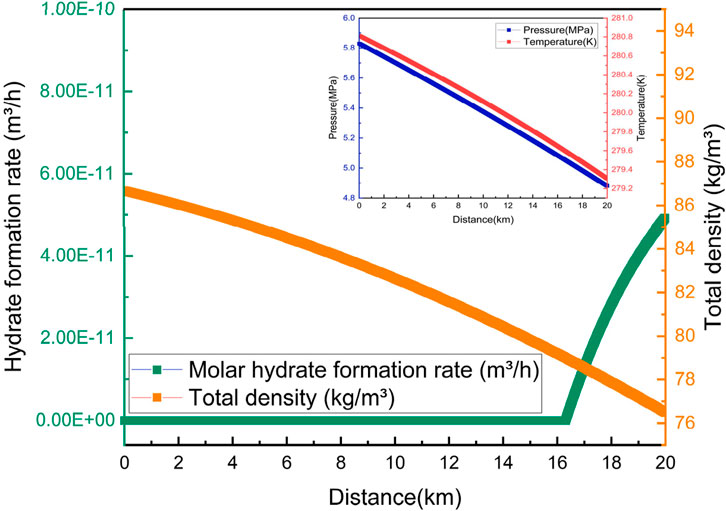
Figure 10. Calculated results of temperature, pressure, total density, and hydrate formation rate.
This can be seen in Figure 10. When operating this pipeline, temperature, pressure, and total fluid density continue to drop, with a pressure drop of 0.95 MPa and a temperature drop of 274.66 K. At the same time, gas hydrate blockage occurs at 16.33 km, and the hydrate generation rate keeps increasing. The original model was discretized about time and iteratively calculated to predict further the 6 h, 12 h, and 24 h plugging rates, as shown in Figure 11.
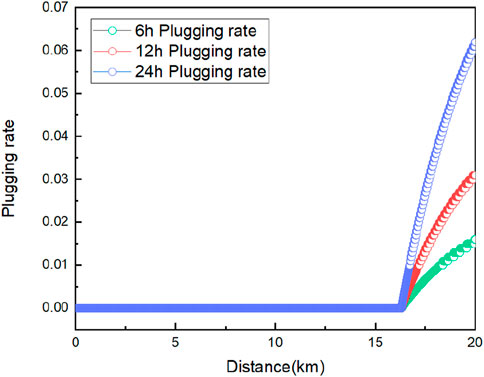
Figure 11. Blockage rate at 6 h, 12 h and 24 h.
With the increase in pipeline operation time, the plugging rate increases from 0.016 to 0.062, indicating that the potential for hydrate blockage is increasing. This is because the formation of hydrates will narrow the gas flow path, produce throttling, increase the pressure difference in the pipeline, and accelerate the formation of hydrates, so as the running time of the pipeline increases, the amount of hydrate formation increases, making the clogging rate increase. However, compared with the pipe volume, the amount of gas hydrate production is less, and the overall plugging risk is negligible. At this time, the phenomenon of hydrate clogging the pipeline can be avoided by adding a small number of inhibitors (methanol, ethylene glycol, etc.), increasing the inlet temperature, reducing the inlet pressure, and slightly increasing the gas transmission.
6 Conclusion
This article introduces a predictive model for blockages in pipelines gathering and transporting natural gas hydrates. Developed through a multi-physical field coupling approach, the model evaluates how variations in inlet temperature, pressure, and gas volume affect the likelihood of hydrate formation and subsequent blockages in natural gas pipelines. On this basis, the risk of gas hydrate plugging is forecast according to the actual case. The research results presented in this paper can be summarized as follows:
(1) Coupled with the multiphase flow model, pipeline temperature and pressure model, and hydrate growth and plugging model, a gas hydrate blockage risk prediction model was established. The model’s accuracy was confirmed through actual working conditions. The pressure and temperature errors between the model and the actual working conditions were 4.19% and 7.6%, respectively, which were within the allowable range of errors.
(2) The sensitivity factors were analyzed by using the prediction model of gas hydrate plugging. The analysis results showed that as the inlet temperature decreased, the most easily blocked position of hydrate would move backward, and the maximum rate of hydrate generation would tend to a certain value, indicating that the degree of pipeline plugging would gradually increase; pressure changes correlate directly with the rate of hydrate formation, which increases nonlinearly as pressure rises. While the impact of gas flow on the maximum hydrate formation rate is minimal, there is an inverse relationship between gas flow and the most easily blocked position corresponding to the maximum rate of gas hydrate formation. Therefore, higher gas transmission can reduce the mixing density of fluids within the pipeline and mitigate temperature loss, effectively lowering the risk of hydrate blockages.
(3) Based on the established model, the discretization of time and iterative calculation can be carried out to obtain the gas hydrate plugging rate under different pipeline operating times. The plugging rate can be used to comprehensively evaluate the gas hydrate plugging risk and take corresponding measures to prevent the blockage phenomenon.
Data availability statement
The raw data supporting the conclusions of this article will be made available by the authors, without undue reservation.
Author contributions
JL: Writing–original draft, Writing–review and editing. MC: Writing–original draft. NW: Writing–review and editing.
Funding
The author(s) declare that no financial support was received for the research, authorship, and/or publication of this article.
Acknowledgments
This work was supported by the National Natural Science Foundation of China (U20B6006-05), the National Key Research and Development Program (2021YF2800903), and the 111 Project (D21025).
Conflict of interest
Authors JL and MC were employed by Daqing Oilfield Company.
The remaining author declares that the research was conducted in the absence of any commercial or financial relationships that could be construed as a potential conflict of interest.
Publisher’s note
All claims expressed in this article are solely those of the authors and do not necessarily represent those of their affiliated organizations, or those of the publisher, the editors and the reviewers. Any product that may be evaluated in this article, or claim that may be made by its manufacturer, is not guaranteed or endorsed by the publisher.
References
Abbasi, A., and Hashim, M. F. (2016). A prediction model for the natural gas hydrate formation pressure into transmission line. Petroleum Sci. Technol. 34 (9), 824–831. doi:10.1080/10916466.2016.1170842
Adeosun, T., Olatunde, O., Aderohunmu, J., and Ogunjare, T. (2009). Development of unsteady-state Weymouth equations for gas volumetric flow rate in horizontal and inclined pipes. J. Nat. Gas Sci. Eng. 1 (4), 113–117. doi:10.1016/j.jngse.2009.09.001
Akhfash, M., Aman, Z. M., Ahn, S. Y., Johns, M. L., and May, E. F. (2016). Gas hydrate plug formation in partially-dispersed water–oil system. Chem. Eng. Sci. 140, 337–347. doi:10.1016/J.CES.2015.09.032
Bergeron, S., and Servio, P. (2007). Reaction rate constant of propane hydrate formation. Fluid Phase Equilibria 265 (1), 30–36. doi:10.1016/j.fluid.2007.12.001
Bergeron, S., and Servio, P. (2009). CO2, and CH4 mole fraction measurements during hydrate growth in a semi-batch stirred tank reactor and its significance to kinetic modeling. Fluid Phase Equilibria 276 (2), 150–155. doi:10.1016/j.fluid.2008.10.021
Bykov, I. Y., Paranuk, A. A., and Bunyakin, A. V. (2022). Mathematical simulation of temperature conditions of hydrate formation in the field gas collectors of the western pestsovaya area of the urengoi oil and gas condensate field. J. Eng. Phys. Thermophys. 95 (1), 223–229. doi:10.1007/s10891-022-02481-3
Cai, H. N., Zhao, L. N., Chen, X. M., Chen, X. T., Guan, T., Wang, J. X., et al. (2018). Shuaibin Li.optimization of temperature drop formula for annular gathering pipeline in high water cut oil region of central hebei province. Workshop 9, 2018. doi:10.4236/jpee.2018.69003
Chen, G. J., Ma, Q. L., and Guo, T. M. (2000). A new mechanism for hydrate formation and development of thermodynamic model. Acta Chemologica Sin. 2000 (5), 626–631.
Chen, W., Xu, H. L., Kong, W. Y., and Yang, F. Q. (2020). Study on three-phase flow characteristics of natural gas hydrate pipeline transmission. Ocean. Eng. 214, 107727. doi:10.1016/j.oceaneng.2020.107727
Englezos, P., Kalogerakis, N., Dholabhai, P., and Bishnoi, P. (1987). Kinetics of formation of methane and ethane gas hydrates. Chem. Eng. Sci. 42, 2647–2658. doi:10.1016/0009-2509(87)87015-x
Foster Natural Gas Report group (2013). GAO examines nature of transportation of gas and liquids via relatively safe pipelines; recommends better data collection and sharing by department of transportation. Foster Nat. Gas. Rep. 2013.
Freer, M. E., Selim, S. M., and Sloan, D. E. (2001). Methane hydrate film growth kinetics. Fluid Phase Equilibria 185 (1), 65–75. doi:10.1016/s0378-3812(01)00457-5
Hammerschmidt, E. G. (1934). Formation of gas hydrates in natural gas transmission lines. Industrial & Eng. Chem. 26 (8), 851–855. doi:10.1021/ie50296a010
Hashemi, S., Macchi, A., and Servio, P. (2007). Gas hydrate growth model in a semibatch stirred tank reactor. Industrial & Eng. Chem. Res. 46 (18), 5907–5912. doi:10.1021/ie061048+
Hu, J. J., Yang, Z. M., and Su, H. (2023). Dynamic prediction of natural gas calorific value based on deep learning. Energies 16 (2), 799. doi:10.3390/en16020799
Jiang, Y. P., Ren, Z. Y., Yang, X., Li, Q. Y., and Xu, Y. (2022). A steady-state energy flow analysis method for integrated natural gas and power systems based on topology decoupling. Appl. Energy 306, 118007. doi:10.1016/j.apenergy.2021.118007
Joshi, S. V., Grasso, G. A., Lafond, P. G., Rao, I., Webb, E., Zerpa, L. E., et al. (2013). Experimental flowloop investigations of gas hydrate formation in high water cut systems. Chem. Eng. Sci. 97 (7), 198–209. doi:10.1016/j.ces.2013.04.019
Kishimoto, M., Mitarai, M., and Ohmura, R. A. (2011). A112 surfactant effects on crystal growth of clathrate hydrate at interface between water and hydrophobic-guest liquid. Proc. Therm. Eng. Conf. 2011, 3–4. doi:10.1299/jsmeted.2011.3
Klymenko, V., Ovetskyi, S., Martynenko, V., Vytyaz, O., and Uhrynovskyi, A. (2022). An alternative method of methane production from deposits of subaquatic gas hydrates. Min. Mineral Deposits 16, 11–17. doi:10.33271/mining16.03.011
Kvamme, B., Kuznetsova, T., Bauman, J. M., Sjöblom, S., and Avinash Kulkarni, A. (2016). Hydrate formation during transport of natural gas containing water and impurities. J. Chem. & Eng. Data 61 (2), 936–949. doi:10.1021/acs.jced.5b00787
Liu, W. Y., Hu, J. Q., Li, X. F., Sun, F. R., Sun, Z., and Zhou, Y. J. (2018a). Research on evaluation method of wellbore hydrate blocking degree during deepwater gas well testing. J. Nat. Gas. Sci. Eng. 59, 168–182. doi:10.1016/j.jngse.2018.08.027
Liu, W., Hu, J., Li, X., Sun, Z., Sun, F., and Chu, H. (2018b). Assessment of hydrate blockage risk in long-distance natural gas transmission pipeline. J. Nat. Gas Sci. Eng. 60, 256–270. doi:10.1016/J.JNGSE.2018.10.022
Markiewicz, M. T. (2024). Consideration of risks to people and the environment related to accidents on natural gas transmission pipelines in LUP and SEA processes in Poland. Impact Assess. Proj. Apprais. 42 (1), 88–105. doi:10.1080/14615517.2023.2266268
Misyura, S. Y. (2022). Dissociation and combustion of gas hydrates. J. Eng. Thermophys. 31 (4), 573–579. doi:10.1134/s181023282204004x
Rao, I., Koh, C. A., Sloan, E. D., and Sum, A. K. (2013). Gas hydrate deposition on a cold surface in water-saturated gas systems. Ind. Eng. Chem. Res. 52 (18), 6262–6269. doi:10.1021/ie400493a
Schorre, C. E. (1954). Here's how to calculate flow temperature in a gas pipeline. Oil Gas. J. 9 (27), 66–68.
Simon, P. (2023). Hydrate formation at extreme conditions. Acta Crystallographica: section C. Struct. Chem. 79 (1), 1–2. doi:10.1107/S2053229622011731
Sonne, J., Pedersen, K. S., and Taran, Y. (2009). Simulation of hydrate growth in steady state flow lines. Min. Deposita 39 (39), 976–982. doi:10.1007/s00126-004-0443-y
Sun, Z. W., Shi, K. J., Guan, D. W., Lv, X., Wang, J. G., Liu, W. G., et al. (2021). Current flow loop equipment and research in hydrate-associated flow assurance. J. Nat. Gas Sci. Eng. 96, 104276. doi:10.1016/j.jngse.2021.104276
Tang, Y., Yao, J. X., He, Y., Sun, P., and Jin, X. (2020). Study on pressure-controlled sliding sleeve of jet breaking for natural gas hydrate mining based on throttle pressure drop principle. Energy Sci. & Eng. 8 (5), 1422–1437. doi:10.1002/ese3.616
Wang, J. (2015). Prediction of hydrate generation in long-distance gas pipelines. Changjiang University.
Wang, J. A., Li, Y., Zhao, J. F., Shi, B. H., Gong, J., and Li, Q. P. (2023). Simulation of the effect of hydrate adhesion properties on flow safety in solid fluidization exploitation. Petroleum 9 (3), 403–411. doi:10.1016/j.petlm.2022.04.003
Wang, Z. Y., Sun, B. Y., Wang, X. R., and Zhang, Z. n. (2014). Prediction of natural gas hydrate formation region in wellbore during deep-water gas well testing. J. Hydrodynamics 26 (4), 568–576. doi:10.1016/s1001-6058(14)60064-0
Webb, E. B., Rensing, P. J., Koh, C. A., Sloan, E. D., Sum, A. K., and Liberatore, M. W. (2012). High-pressure rheology of hydrate slurries formed from water-in-oil emulsions. Energy & Fuels 26, 3504–3509. doi:10.1021/ef300163y
Wei, N., Sun, W. T., Meng, Y. F., Liu, A. Q., Chen, G. L., Xu, H. M., et al. (2019). Wellbore flow rules in marine natural gas hydrate reservoir drilling (Conference Paper). Springer Series in Geomechanics and Geoengineering, 1658–1672.
Wei, N., Sun, W. T., Meng, Y. F., Liu, A. Q., Zhao, J. Z., Zhou, S. W., et al. (2018). Multiphase non equilibrium pipe flow behaviors in the solid fluidization exploitation of marine natural gas hydrate reservoir. Energy Sci. & Eng. 6 (6), 760–782. doi:10.1002/ese3.251
Wei, N., Xie, C. Y., Sun, W. T., Li, H. T., Jiang, L., and Zhang, S. H. (2021). An experimental study on the formation of natural gas hydrate with thermodynamic inhibitors. Front. Energy Res. 9. doi:10.3389/fenrg.2021.699356
Zhang, A. Y., Cai, M., Wei, N., Li, H. T., Zhang, C., Pei, J., et al. (2024). Analysis of sensitivity to hydrate blockage risk in natural gas gathering pipeline. Petroleum Sci. 2024. doi:10.1016/j.petsci.2024.01.016
Keywords: natural gas hydrates, gas pipeline, hydrate deposition, simulation, long distance transportation
Citation: Li J, Cai M and Wei N (2025) Flow assurance study based on hydrate deposition modeling. Front. Energy Res. 13:1435285. doi: 10.3389/fenrg.2025.1435285
Received: 20 May 2024; Accepted: 31 January 2025;
Published: 21 February 2025.
Edited by:
Zhenyuan Yin, Tsinghua University, ChinaReviewed by:
Pengfei Wang, Southern University of Science and Technology, ChinaYonghai Gao, China University of Petroleum (East China), China
Baojiang Sun, China University of Petroleum (East China), China
Copyright © 2025 Li, Cai and Wei. This is an open-access article distributed under the terms of the Creative Commons Attribution License (CC BY). The use, distribution or reproduction in other forums is permitted, provided the original author(s) and the copyright owner(s) are credited and that the original publication in this journal is cited, in accordance with accepted academic practice. No use, distribution or reproduction is permitted which does not comply with these terms.
*Correspondence: Junliang Li, bGpsaWFuZzE5ODJAMTYzLmNvbQ==