- 1China Energy Engineering Group Zhejiang Electric Power Design Institute Co., Ltd., Hangzhou, China
- 2Zhejiang Key Laboratory of Offshore Geotechnics and Material, College of Civil Engineering and Architecture, Zhejiang University, Hangzhou, China
- 3China Energy Engineering Group Guangdong Electric Power Design Institute Co., Ltd., Guangzhou, China
- 4Computional Geomechnics, Ocean Department, Norwegian Geotechnical Institute, Oslo, Norway
Introduction: Floating wind power is the important path for the development of offshore wind energy, and the performance of the mooring system of floating wind turbines (FOWTs) significantly affects their economic viability, safety, and sustainability.
Methods: This paper systematically analyses the positioning performance, mooring line extreme loads, and fatigue response of a FOWT equipped with both single segment and multi-segment mooring systems, based on the IEA 15 MW large turbine and a floating platform. The hydrodynamic performance of the floating platform is calculated, and the platform’s motion-sensitive directions are analysed through Response Amplitude Operators (RAOs). The natural periods of the platform are validated by free decay tests. The six degrees of freedom (DOFs) motion response and the mooring line peak tensions are analysed under normal and extreme conditions.
Results: The results show that both mooring systems provide good motion performance and stable tilt angles for the platform. Under ALS (single-line failure) condition, the multi-segment mooring system demonstrates a notable capacity to resist impact loads, with comparatively minor fluctuations in mooring line tension. In the multi-segment system, fatigue damage primarily occurs in the upper mooring chain, with damage approximately 4.5 times greater than that of the bottom chain over a 1-year period. The effects of mooring line spread angles and lengths on performance are also analysed. The results indicate that the mooring line spread angle has slight impact on platform motion response and mooring line tension, while mooring line length significantly affects the extreme tension of the lines.
Discussion: The findings of this study can provide some references in the design of mooring systems for future FOWTs.
1 Introduction
In light of global climate change and the looming energy crisis, the development of clean energy has become a pivotal area of scientific inquiry. Wind energy, as one of the most promising renewable energy sources, is favoured by many countries due to its abundant reserves and widespread distribution (IEA, 2020). Among these, offshore wind power is gradually becoming the focal point of wind energy development, due to a number of advantages, including higher average wind speeds, large wind energy reserves, minimal environmental noise pollution, and no land use requirements (Musial et al., 2022). Nevertheless, offshore wind resources in nearshore areas are confronted with a lot of challenges, such as potential conflicts with traditional nearshore aquaculture, fishing activities, shipping routes, and the saturation of resource development. Consequently, the expansion of the offshore wind power into deeper and more distant waters is an unavoidable trend (GWEC, 2019; WFO, 2022). Furthermore, as offshore wind power transitions from nearshore to deepwater, the costs and construction challenges associated with fixed-foundation turbines increase significantly. Therefore, floating wind power has become the inevitable choice for the development of deepwater wind energy resources (Rui et al., 2024b). DNV (2020) projects that by 2050, the installed capacity of floating wind power will reach to 250 GW, representing over 20% of the offshore wind power market, and constituting 2% of the global electricity supply.
A FOWT system typically comprises three main components: the wind turbine itself, the floating foundation and mooring/anchor facilities. Regarding the turbine, it is evident that there is a tendency towards an increase in the power output of the mainframe. While much of the existing research in this field mainly has concentrated on the NREL 5 MW reference turbine (Jonkman, 2009) including numerical modelling and basin tests such as the NREL OC3 Hywind Spar Buoy (Jonkman, 2010) and the NREL OC4 DeepCwind (Robertson et al., 2014), some studies have also considered the larger-scale reference turbines. For instance, the 10 MW turbine developed by the DTU (Bak et al., 2013) has been the subject of study with both a semi-submersible platform (Azcona et al., 2017) and a TLP platform (Pegalajar-Jurado et al., 2016). Additionally, the 15 MW turbine, developed by the IEA, has also been analyzed for a semi-submersible platform (Pillai et al., 2022). In fact, commercial floating wind farms have begun to adopt higher-capacity turbines on a gradual basis. For example, in 2020, Principle Power installed three 8.3 MW Vestas V164 turbines on the WindFloat platform in Portugal, and a 9.5 MW turbine at the Kincardine site in Scotland. Moreover, turbine manufacturers such as Vestas, Siemens-Gamesa, and Mingyang are developing and deploying FOWT prototypes with capacities of at least 10 MW (Spearman et al., 2020; Vestas, 2021). As a result, it is imperative for researchers to undertake preliminary studies on the performance of ultra-large FOWTs. However, research in this field is still in progress.
The floating platform provides support for the upper wind turbine structure, thereby ensuring buoyancy and facilitating maintenance of the system. As FOWT technology has continued to evolve, new foundation concepts have emerged. These can be categorized based on their static stability principles into four types: semi-submersible, spar, tension-leg platform, and barge. Each corresponds to a different operational water depth (Xu et al., 2024a; Rui et al., 2024a). In China, the semi-submersible type of floating foundation is currently the most widely studied and applied foundation for FOWT systems due to the relatively shallow continental shelf along its coastal regions. This type is suitable for a wide range of water depths and generates a notable variation in waterplane area through its distributed pontoon structure, which in turn produces restoring moments to resist platform tilting.
The mooring system, which serves as the load transfer mechanism connecting the seabed anchors to the floating structure, plays a pivotal role in FOWT technology. However, deep-sea FOWTs face considerable challenges due to intricate component coupling and punitive operating environments, thereby subjecting the mooring system to rigorous scrutiny. On the one hand, the mooring system must satisfy the requisite positioning and safety standards. As documented in the literature, an average of 7.5 tropical cyclones make landfall in China each year (Wang et al., 2023; Li et al., 2023). To ensure reliance in the face of extreme conditions and accidental limit states (ALS), it is essential to incorporate redundancy into the mooring system design for FOWTs. On the other hand, the design of the mooring system must also consider economic factors. The widespread commercialization of floating wind power is impeded by the significant costs associated with mooring/anchor systems, which account for over 27% of the total cost, surpassing that of the wind turbine equipment itself (Stehly et al., 2020). This underscores the necessity for further optimization and analysis of the mooring system design.
The diverse force characteristics of mooring lines have led to the classification of mooring positioning systems into two main categories: traditional catenary mooring and taut or semi-taut mooring systems (Wang et al., 2020; Rui et al., 2023b). The static stability characteristics of semi-submersible floating platforms render the catenary mooring system is an effective mooring method (Xu et al., 2024a; Rui et al., 2024a). In catenary systems, the ratio of mooring line length to water depth is typically considerable, resulting in a portion of the mooring line lying on the flat seabed. The restoring force for the motion of the floater in such a mooring system is mainly provided by the weight of the cable and changes in the shape of the mooring line (Smith and MacFarlane, 2001). Due to the presence of a lying chain, the uplift angle at the seabed contact point remains zero throughout the service life, and only horizontal tension acts at the touchpoint. Consequently, the mooring anchor is only required to resist horizontal forces.
Chains are the most commonly utilized material in catenary mooring systems due to their high tensile strength and resistance to wear (Guo et al., 2024; Rui et al., 2024c). However, their substantial weight makes them costly when employed as standalone mooring lines. In recent years, multi-segment mooring systems have been widely used in the construction of floating platforms. The multi-segment mooring system was first effectively applied in the positioning and stabilization of deep-sea floating production storage and offloading units (FPSOs), semi-submersible platforms, drilling ships, and other floating marine platforms. In the past decade, with the rapid development of offshore wind energy, these related technologies have also been utilized to reduce costs and improve efficiency in FOWT platforms (Pham, 2024; Civier et al., 2024). In such applications, specific sections of the mooring line are substituted with alternative chains or materials, thereby facilitating construction and reducing costs (Qiao et al., 2013; Xie et al., 2015; Hermawan and Furukawa, 2020). The impact of multi-segment mooring systems on floating platforms has been the subject of study by several researchers (Ja’e et al., 2022). For example, Ha (2011) investigated the effects of multi-segment mooring systems on FSPOs, finding that while these systems are capable of enduring extreme sea conditions, they significantly reduce the vertical loads on the tensioned mooring lines. Ghafari and Dardel (2018) investigated the effect of mooring line length on the dynamic response of semi-submersible platforms with multi-segment mooring systems and indicated that increasing mooring line length reduces platform motion but accompanying increases mooring line tension. Neisi et al. (2022) analysed the influence of multi-segment mooring systems on the 5 MW OC4-DeepCwind semi-submersible platform, and found that the addition of buoy and clump weight significantly affects platform heave and pitch motions. However, there is still a lack of research on the effects of multi-segment mooring systems on the positioning performance and tension characteristics of large FOWTs. Although multi-segment mooring systems demonstrate good performance in terms of cost-effectiveness and horizontal restoring force, they also have certain limitations. These include compatibility between different materials, adaptability to marine environments (such as marine corrosion, low temperatures, and ultraviolet radiation exposure), and the complexity of connector designs (Bastos and Silva, 2020; Del Vecchio et al., 2024). When selecting and designing a mooring system, it is essential to consider factors such as the operational environment, technological capabilities, economic benefits, and safety to ensure the system’s reliability and performance (Rui et al., 2024a).
The performance of mooring systems is also influenced by various factors, such as the number of mooring lines, spread angles, lengths, materials, and configurations (Paredes et al., 2016; Hsu et al., 2017; Rui et al., 2023c). Pillai et al. (2022) examined the effect of different mooring footprint and wind-wave incidence angles on the anchor loads of a 15 MW turbine in the context of shallow water mooring conditions. The findings demonstrated that augmenting the mooring radius can diminish peak anchor loads by 56%, and varying wind and wave directions significantly affect the load magnitude. Zhang et al. (2024) conducted an optimization on the single-point mooring system, and the results suggested that changes in mooring line length have minimal impact on the dynamic response of the platform and mooring system while the addition of appropriate buoys or sinkers can reduce the motion response and the mooring line tension. Yu et al. (2024) made an optimal design of asymmetrically arranged moorings for floating production system considering the mooring radius, azimuth, spread angle, number of lines and three segment lengths, and found that the offset of the floating platform was reduced by 8.29% via the asymmetrical mooring pattern. The primary objectives of these analyses of mooring design parameters are to control the motion of the floating platform, ensure safety, and maintain cost-effectiveness. Furthermore, for permanent mooring design, it is essential to consider not only extreme strength design but also the implications of fatigue under conditions of combined loading (API RP 2SK).
To this end, this paper aims to evaluate the performance of the muti-segment mooring system of a 15 MW FOWT under normal and extreme conditions, including the positioning performance of the mooring system, the fatigue performance of the mooring line, and the influence of the mooring arrangement parameters (mooring line spread angle, mooring line length, etc.), etc., by means of an integrated model through numerical analysis. The findings of this study can provide some guidance in the design of mooring systems for future FOWTs.
2 Modelling of a 15 MW FOWT
2.1 Reference turbine
A suitable 15 MW wind turbine developed by IEA that is well-described in literature is utilised for numerical modelling (Gaertner et al., 2020). In comparison to the previously widely used NREL 5 MW baseline turbine (Jonkman, 2009) and the DTU 10 MW referenced turbine (Bak et al., 2013), the IEA-15–240-RWT employs a more sophisticated blade construction and control system, thereby facilitating enhanced power generation and attitude control technologies (Pillai et al., 2022).
2.2 Floating support structure
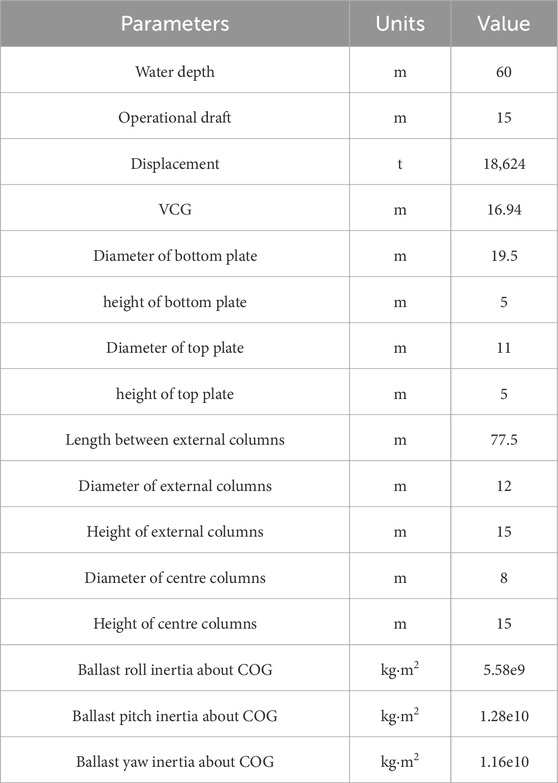
After the preliminary investigation of the FOWT installation region, the average water depth of the target field is about 60 m, and the semi-submersible type floating platform is designed to support the 15 MW turbine. The floater is primarily constituted by four external and central columns, four bottom and top plates and a multitude of diagonal struts. The turbine is situated at the pinnacle of the central column and plate. The centre point of the reference coordinate system is established as the base of the central column. The x-axis is oriented in a direction extending from the farthest outer column, with positive values extending away from the centre point. The z-axis is oriented in a direction extending upward from the centre point, while the y-axis is oriented in a direction extending from the centre point in a manner consistent with the right-hand rule. The principal geometric and dimensional parameters are illustrated in Figure 1 and given in Table 1.
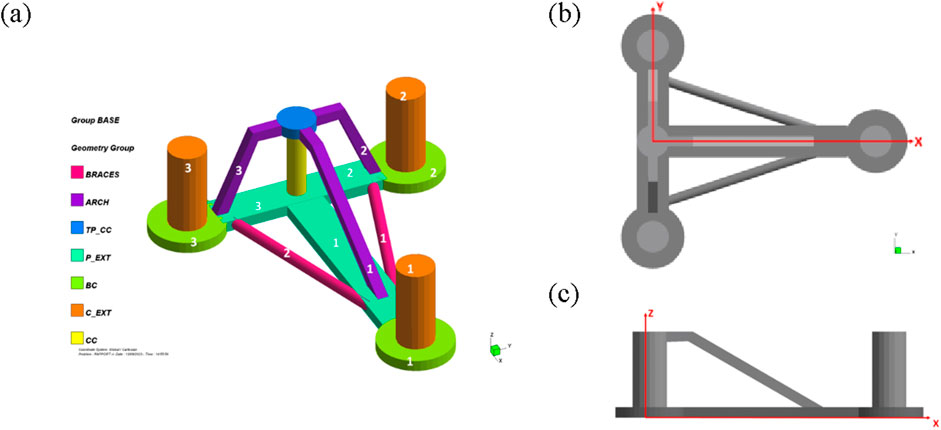
Figure 1. Definition of floating platform: (A) compositions of the platform, (B) coordinate definition-top view, (C) coordinate definition-elevation view.
2.3 Mooring system configuration
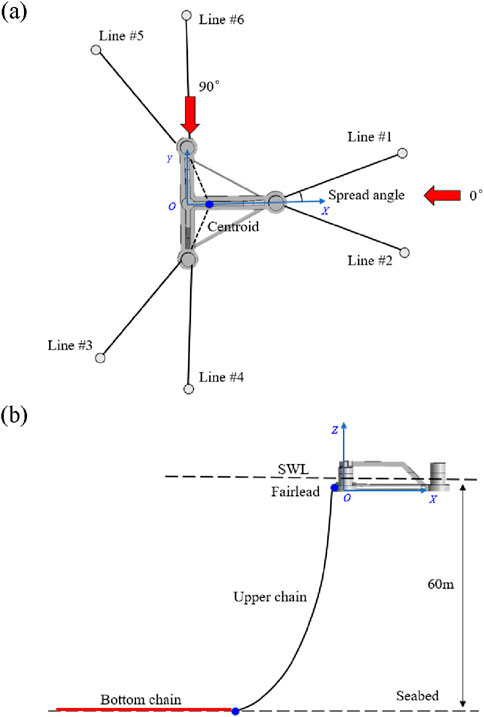
The configuration of the mooring system for the FOWT is shown in Figure 2A. The mooring system was originally designed to consist of six identical 100 mm R3 studdles chains (with mass and geometric properties listed in Table 2). Each chain has a length of 490 m long and spreads out symmetrically from the platform’s three external columns along the centroid, which is located 3 m below the stationary water level. The horizontal spread angle of each chain on the same column was 3° along the x-axis, and the mooring footprint for each mooring line was 476 m, which is approximately eight times the water depth.
In consideration of the water depth conditions and the pertinent economic factors within the target area, the mooring lines were optimized through the implementation of a multi-segment mooring system without any alteration to the mooring radius or line length. Each mooring line consists of two sections, as shown in Figure 2B. The upper segment, located in the splash zone, is composed of R3S-grade chain with a diameter of 76 mm and a length of 180 m, directly connected to the winch. The bottom-resting catenary segment is consisting of R3-grade chain with a diameter of 100 mm and a length of 310 m. The incorporation of a thicker chain in the bottom section serves to increase its weight, thereby ensuring that the bottom portion remains in contact with the seabed. This prevents the chain from being pulled taut, which could otherwise result in the generation of uplift forces on the anchor. The pretension at the top of each mooring line is approximately 52 t, and the main parameters of two sections are listed below in Table 2.
2.4 Integrated analysis model
The widespread NREL simulation software OpenFAST, is employed for integrated analysis of the 15 MW FOWT, which contains the various coupled modules including aerodynamics, servo-control, elasticity, hydrodynamics, and mooring (Xu et al., 2024b). The referenced IEA 15 MW wind turbine model, has been built and validated during the OC6 project (Allen et al., 2020). Based on this model, the input files for the structural dynamics, aerodynamics, hydrodynamics, and mooring modules were modified to align with the specifications of the floating platform utilized in this study. The hydrodynamics module was initially analysed in the frequency domain using the hydrodynamic analysis software AQWA (ANSYS, 2019), and the results were then converted to WAMIT format for use as input files in OpenFAST. It is important to note that since the calculation principles of AQWA are based on potential flow theory and Morison’s equation, which do not account for viscous damping, and because it is challenging to determine the drag force and added mass coefficients for the floating structure’s members, an overall system damping correction of 8% of the critical damping was applied in this analysis (Xu et al., 2023). A portion of the critical damping can be considered as equivalent viscous damping and the formula for the critical damping can be expressed as Equation 1:
where M is the mass or moment of inertia of the structure; Ma is the additional mass or additional moment of inertia, and Ci is the hydrostatic restoring force stiffness. Equation 1 does not consider the coupling effect of the structure in different directions of motion, and since the hydrostatic stiffness is 0 in sway, surge and yaw, the viscous damping is only considered in the three DOFs, such as heave, pitch and roll (Roddier et al., 2011). The control module was not modified, so the standard industrial controller was still used as a reference (Abbas et al., 2022).
3 Load conditions
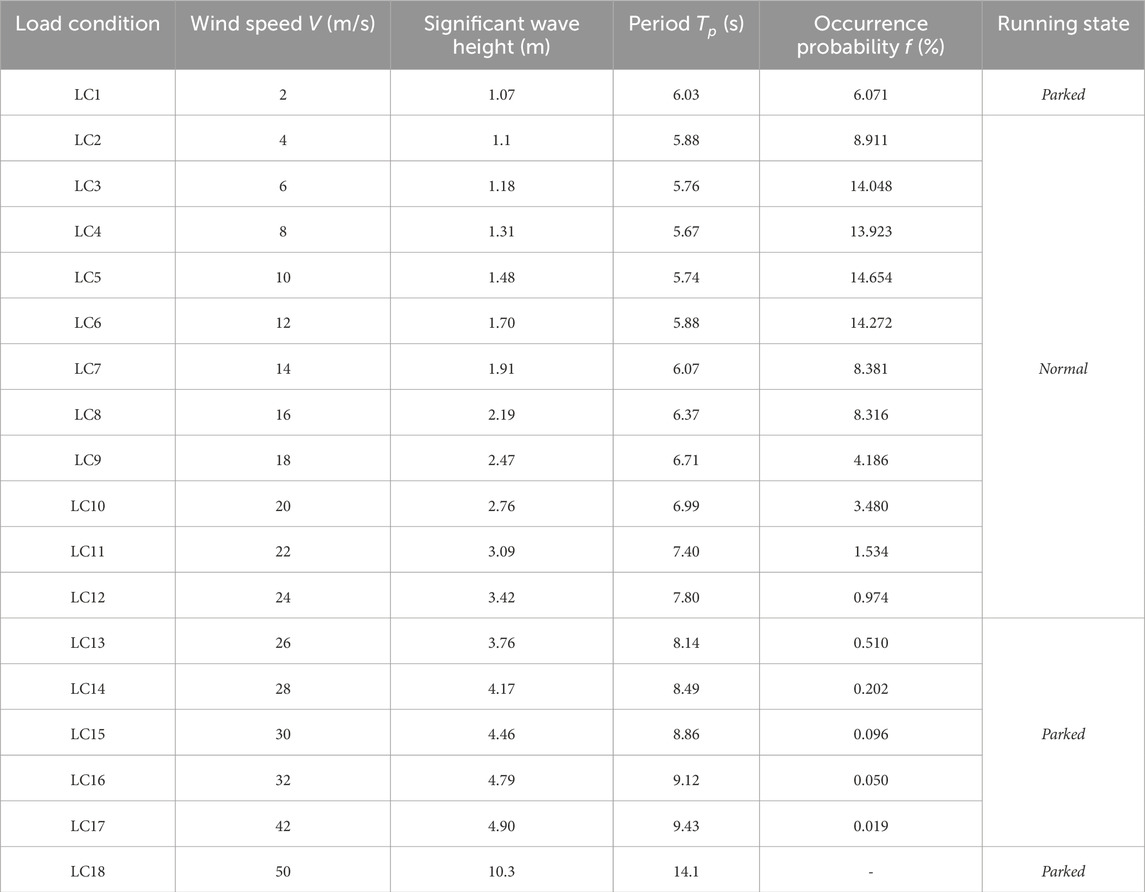
The extreme value and fatigue analysis of the mooring lines in this study considered multiple wind-wave combinations and their probability distributions over the service life of the turbine, as summarized in Table 3 (Asen et al., 2017; Krathe and Kaynia, 2017). The data presented in the table are derived from a 22-year environmental parameter monitoring campaign at an offshore wind farm observation site in the North Sea. All data were statistically integrated and categorized into 17 different load conditions. The Kaimal spectrum and JONSWAP spectrum are used to simulate the wind turbulence and random nature of wave, respectively (Zha et al., 2023). For load cases LC 2–12, the average hub wind speed falls between the turbine’s cut-in (3 m/s) and cut-out (25 m/s) speeds, meaning the turbine is in normal operation. In the cases of LC 1 (below the cut-in wind speed) and LC 13–17 (above the cut-out wind speed), the turbine is in a state of parked condition with feathered blades and idle rotation. Based on the available data for the target site, LC6 was approximately set as the rated design condition with largest thrust force (DLC1.2b), and LC19 is additionally considered as the 50-year return extreme design condition (DLC6.1a). In the following analysis, the simulation time for each case is 700 s, with the initial 100 s excluded to ensure the stability of the data. The rotor hubs are set always face the wind, meaning there is no yaw error.
4 Results and discussion
4.1 RAOS of platform
The Response Amplitude Operators (RAOs) for the floating platform under different wave incidence angles are shown in Figure 3. In the absence of mooring forces, the RAO values for heave and sway motions decrease with increasing frequency. When the waves act in the direction of heave and sway motions, the RAOs for these motions are relatively high. The heave RAO shows significant variation when the wave frequency ranges from 0 to 0.75 rad/s, peaking around 0.28 rad/s. The RAOs for different wave directions are generally similar, indicating that the impact of different wave directions on heave amplitude is relatively small. At a wave frequency of 0.276 rad/s, both pitch and roll reach their maximum values simultaneously. A comparison of the peak values reveals that the pitch RAO peak is slightly lower than the roll RAO peak, which can be attributed to minor geometric asymmetries in the structure for which the moment of inertia is larger in the pitch direction, and therefore the pitch direction exhibits a better restoring stability under wave action. From the overall RAO curves, it is evident that the platform is particularly sensitive to wave directions of 0° and 90°. Under extreme conditions, it is essential to carefully assess the platform’s motion response and mooring tension in relation to wave directions of 0° and 90°.
4.2 Free decay test
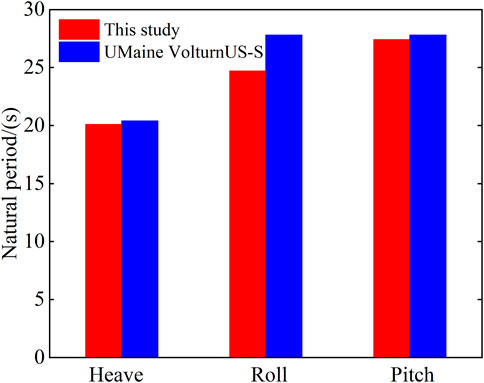
Prior to conducting a time domain analysis, it is necessary to perform a free decay test on the floater to ensure the accuracy of the results. By applying an initial displacement to the FOWT in still water, the natural periods of the platform can be obtained through Fast Fourier Transform (FFT) analysis of the time history curves. Figure 4 presents a comparison between the natural periods of the platform used in this study and those of the VolturnUS-S Platform (Allen et al., 2020). It can be observed that the heave and pitch periods of both platforms are almost identical. However, due to slight geometric asymmetry, the roll period of the platform in this study is observed to be slightly lower than the pitch period. Both periods exceed 20 s, thereby avoiding the main wave period range and meeting the regulatory requirements.
4.3 Effects of multi-segment mooring lines
4.3.1 Normal condition
In a normal operating condition (LC6), where the wind speed is close to the rated speed of the turbine, the rotor thrust is at its maximum, and the turbine operates in its least stable state. Under this condition, the main focus is to assess the extent of the platform’s motion amplitude. From the aforementioned frequency domain analysis, it is noted that the motion of this FOWT is more sensitive under 0° and 90° incidence directions. Accordingly, this section primarily analyses the platform’s motion under both incidence conditions, comparing the effects of single-segment and multi-segment mooring systems.
The time-history curves for each DOF are shown in Figure 5. Under normal conditions, the platform displaces in the direction of the applied load, with the maximum surge displacement for the two mooring systems being 1.2 m and 2.0 m, respectively, neither exceeding 10% of the water depth (6 m). In the case of a 0° wind and wave incident angle, the platform experiences a larger surge motion, with maximum values of 8.63 m and 8.17 m, respectively. The vertical motion is relatively small under normal condition, with the maximum heave displacements of 0.84 m and 0.49 m. The maximum platform tilt occurs under the 0° incident condition with a roll angle of 1.3°, which is well within the regulatory limit of 5° (DNVGL-ST-0119). Overall, the difference in motion between the single-segment and multi-segment mooring systems under normal conditions is small, and the platform exhibits good motion performance.
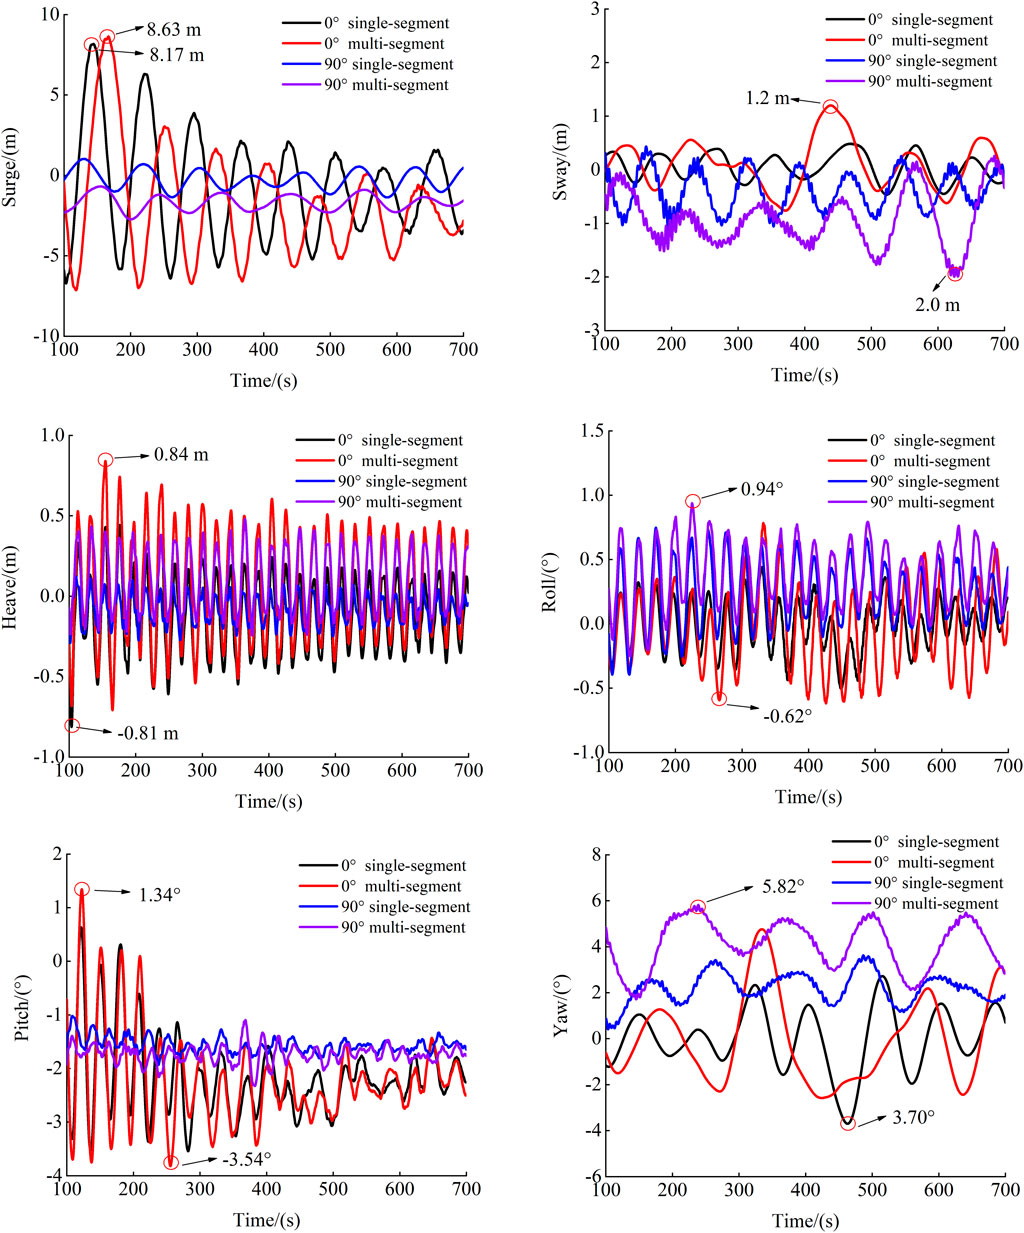
Figure 5. 6-DOF motions of the platform: (A) surge, (B) sway, (C) heave, (D) roll, (E) pitch, (F) yaw.
4.3.2 Extreme condition
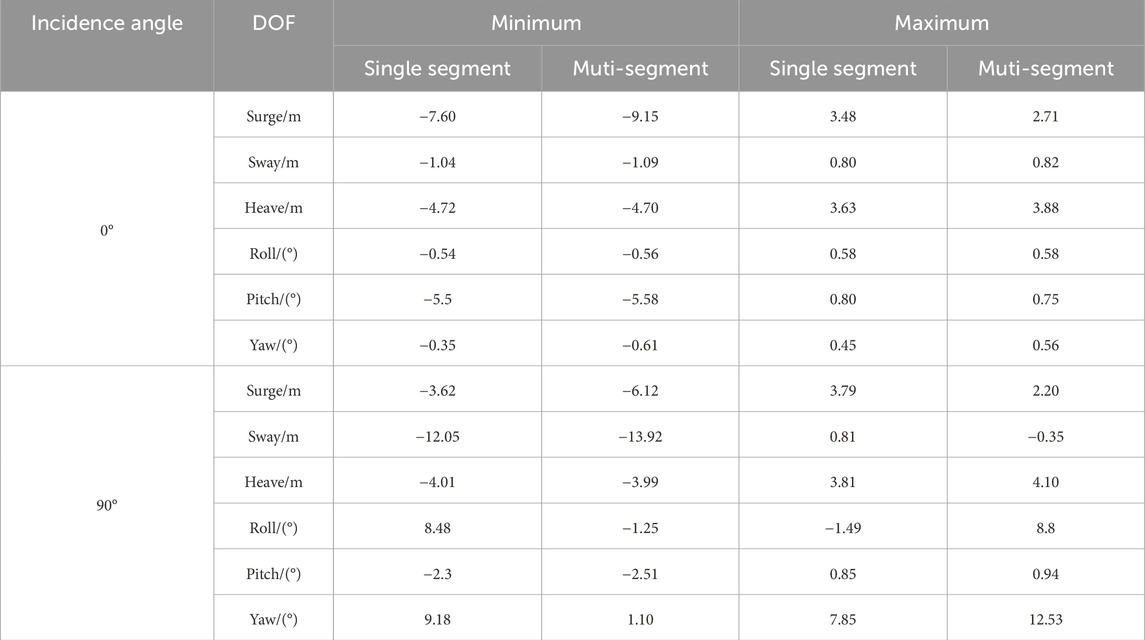
Extreme conditions serve as the control cases for platform motion and mooring line tension. Table 4 and Figure 6 respectively show the platform motion amplitude and fairlead tension time history curves for single-segment and multi-segment mooring systems under extreme conditions and at 0° and 90° incidence angles.
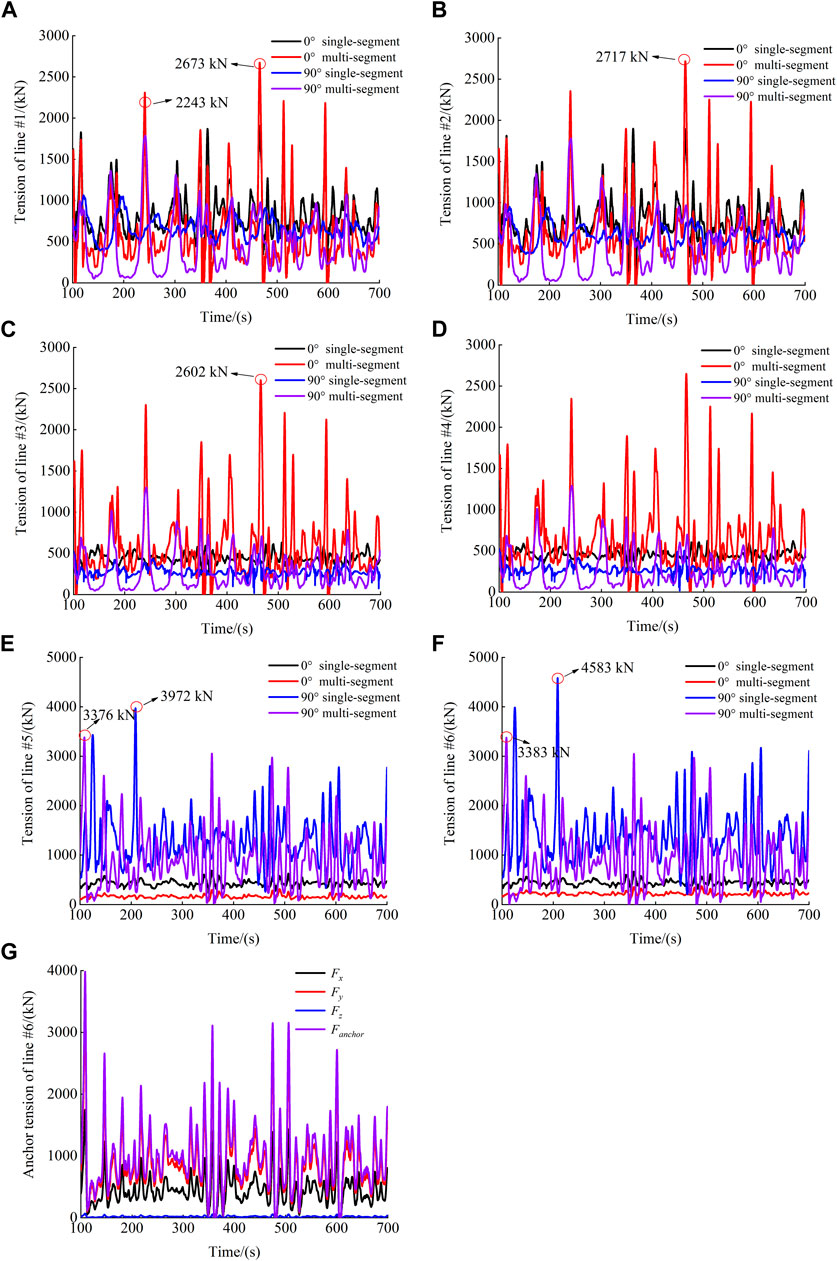
Figure 6. Mooring line tensions under extreme condition: (A) line #1, (B) line #2, (C) line #3, (D) line #4, (E) line #5, (F) line #6, (G) uplift force at anchor point of line #6 for 90° incidence angle.
As illustrated in Table 4, the platform experiences a certain drift in the windward direction as a consequence of wind and waves at 0° and 90°. The surge amplitude occurs at the 0° incidence angle, with absolute values of 7.60 m and 9.15 m for the single-segment and multi-segment mooring systems, respectively. The sway amplitude occurs at the 90° incidence angle, with values of 12.05 m and 13.92 m, respectively. In extreme conditions, the platform displacements in both directions under the single-segment mooring system do not exceed 20% of the water depth (12 m). The multi-segment mooring system shows slightly more drift in the surge direction, mainly due to its lower mooring stiffness and smaller restoring force. However, the platform’s overall drift remains acceptable in both mooring systems under extreme conditions. In the heave direction, the maximum values are 4.72 m and 4.70 m, with the multi-segment mooring system showing slightly better vertical displacement performance.
Under the 0° and 90° wind-wave incidence angles, the main rotational motions of the FOWT are pitch and roll. The direction of the rotational amplitude for both mooring systems is contingent upon the incidence angle. The pitch amplitude occurs at the 0°, while the roll amplitude occurs at the 90°. The distinction between pitch and roll is particularly evident at the 90° angle, indicating that rotational motion is more pronounced at this angle and therefore merits particular attention in the design process. Due to the asymmetric load incidence, the yaw angle is greater in the multi-segment mooring system at the 90°. In general, under extreme conditions, the maximum in-plane rotational angles for the platform in both mooring systems are 8.48° and 8.8°, respectively, both within the 10° limit specified by regulations (DNVGL-ST-0119).
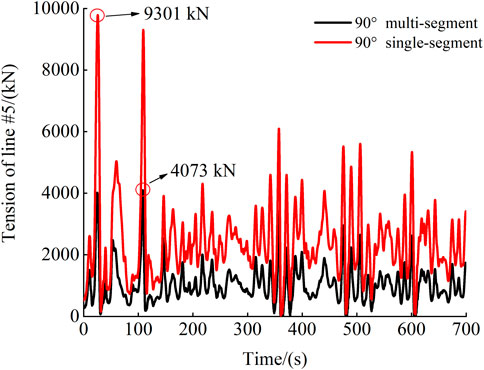
Figure 6 shows that, under extreme conditions, the maximum mooring tension at 0° wave incidence of two mooring system occurs in mooring lines #2, with values of 2275 kN and 2717 kN, respectively. At 90° wave incidence, the maximum mooring tension occurs in mooring lines #6, with values of 4,583 kN and 3,383 kN, respectively. The maximum mooring tension at 0° is significantly lower than that at 90°, but in both cases, the tension does not exceed the mooring line’s breaking strength. Under the 90° load incidence angle, the fairlead tension in the multi-segment mooring system is about 26% lower than that of the single-segment mooring system. Furthermore, the vertical tension component at the anchor in the multi-segment system is quite small, meaning almost no uplift force is generated, which helps fully utilize the horizontal bearing capacity of the anchor foundation (e.g., suction anchors, pile anchors).
Additionally, under extreme conditions, the API RP 2SK standards require further single-line failure analysis of the mooring lines (ALS conditions). Figure 7 compares the calculated remaining mooring line tensions at the fairleads after the failure of mooring lines #6 in both single-segment and multi-segment mooring systems, under a load incident angle of 90°. It is observed that after a mooring line failure, the platform experiences displacement, resulting in the redistribution of tension among the remaining mooring lines. The tension in adjacent lines increases, making it the most disadvantage mooring lines. In the single-segment mooring system, the tension in the adjacent mooring line spikes to 9,301 kN, an increase of 103%. However, in the multi-segment mooring system, the peak load only increases by 20% (from 3,383 kN to 4,073 kN). This is because the upper segment of the mooring chain has lower stiffness, providing better elasticity and elongation under load, thus mitigating the impact of environmental forces on the mooring system following a line failure (Xu et al., 2023), and enhancing the overall safety of the system. The ALS conditions highlight the superiority and importance of the multi-segment mooring system.
4.3.3 Fatigue analysis
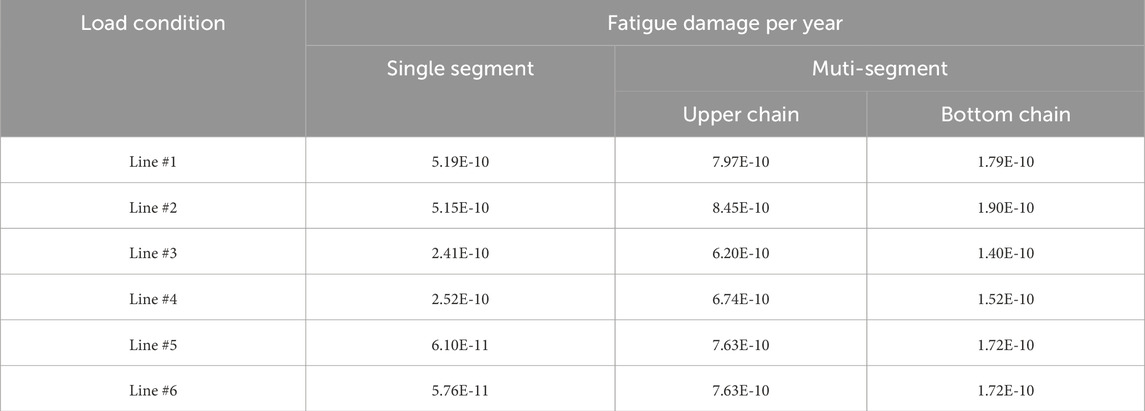
This section evaluates the annual fatigue damage of each mooring line in both mooring system under 17 sea states with a 90° incident angle. In the fatigue analysis of mooring lines, the T-N curve recommended by API RP 2SK is generally used, i.e., only the fatigue generated by tension is considered, and other factors such as bending and torsion are not taken into account. The T-N curve represents the relationship between the fatigue strength and fatigue life of a standard specimen under specific cyclic conditions. The basic form is as Equation 2:
Where R is the ratio of tension amplitude to reference failure strength, which is typically replaced by the minimum breaking strength. M and K are the fitting parameters of the material’s T-N curve, representing the slope and intercept, respectively. For studdles chains, M is taken as 3.0, and K is taken as 316 (API RP 2SK).
For any fatigue condition listed in Table 5, the dynamic response of the mooring lines is calculated to obtain the time history of the tension. The rainflow counting method (Matsuishi and Endo, 1968) is then used to statistically determine the number of cycles n corresponding to different tension amplitude ratios R. According to the Miner-Palmgren linear fatigue damage accumulation theory, the fatigue damage caused by each stress amplitude is independent and can be linearly superimposed. The long-term sea state in which the mooring line is located is discretised into a series of short-term sea states i = 1, 2, ., k, and the annual fatigue damage of a mooring line under short-term sea state k is given by Equation 3:
Where pk is the probability of occurrence of short-term sea state k in the long-term sea states; t is the duration of 1 year, taken as 3.15576 × 10⁷ s; tk is the duration of short-term sea state k; nj,k is the number of occurrences of the jth tension cycle under short-term sea state k; and Nj is the number of cycles required for the segment to fail due to fatigue at the jth tension. D is the fatigue damage, usually D < 1 means that the structure has not reached the fatigue limit; D ≥ 1 means that the structure has been fatigued.
It can be observed that in the multi-segment mooring system from Table 5, the majority of fatigue damage occurs in the upper segment, with significantly higher fatigue damage in the upper chain compared to the bottom chain. Over 1 year of long-term sea conditions, the fatigue damage in the upper chain is approximately 4.5 times greater than that in the bottom chain. It is therefore recommended that particular attention be paid to the maintenance of the upper mooring chain in practical engineering applications.
The fatigue damage of chains in a single-segment mooring system is greater than that of a same chain in a multi-segment system, with the maximum damage increasing by approximately 2.7 times. This is because in a catenary mooring system, the restoring force of the floater is mainly provided by the weight of the mooring line and changes in the mooring line configuration. For multi-segment mooring systems, the heavier mooring chain in the bottom part increases the length of the laid section, better limiting the range of motion of the floater and thus reducing the magnitude of the mooring tension cyclic amplitude. Figure 8 depicts the fatigue damage of the upper mooring chain in a multi-segment system under different conditions (excluding probability considerations). It can be observed that under low wind speed conditions, the fatigue damage of the chain in conjunction with an increase in wind speed and wave height. However, once the wind speed exceeds the cut-out wind speed, the fatigue damage of the chain decreases significantly, as the freewheeling control of the wind turbine effectively reduces environmental loads. Nevertheless, as the wind speed continues to increase, wave and tower wind loads gradually become dominant, causing a renewed increase in mooring chain fatigue damage.
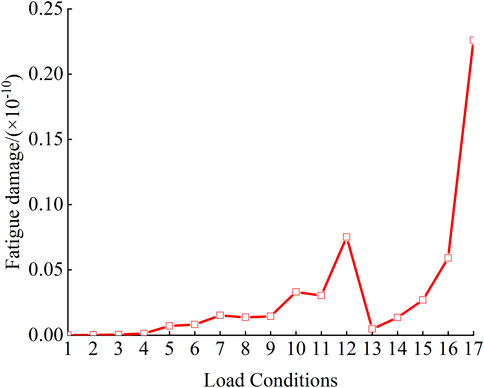
Figure 8. Fatigue damage under different load conditions of upper chain for muti-segment mooring system.
4.4 Effects of mooring line spread angle
Throughout the service life of a FOWT, it is subjected to environmental loads from different directions, and the mooring line spread angles may also influence the platform’s mooring performance. In addition to the 3° mooring spread angle, this section additionally compares the motion of the FOWT and mooring line tensions under three different mooring angles: 4°, 5°, and 6°. Figure 9 presents the maximum displacement, rotation, and the most critical mooring line tension under extreme conditions with a 90° incident angle for different mooring spread angles.
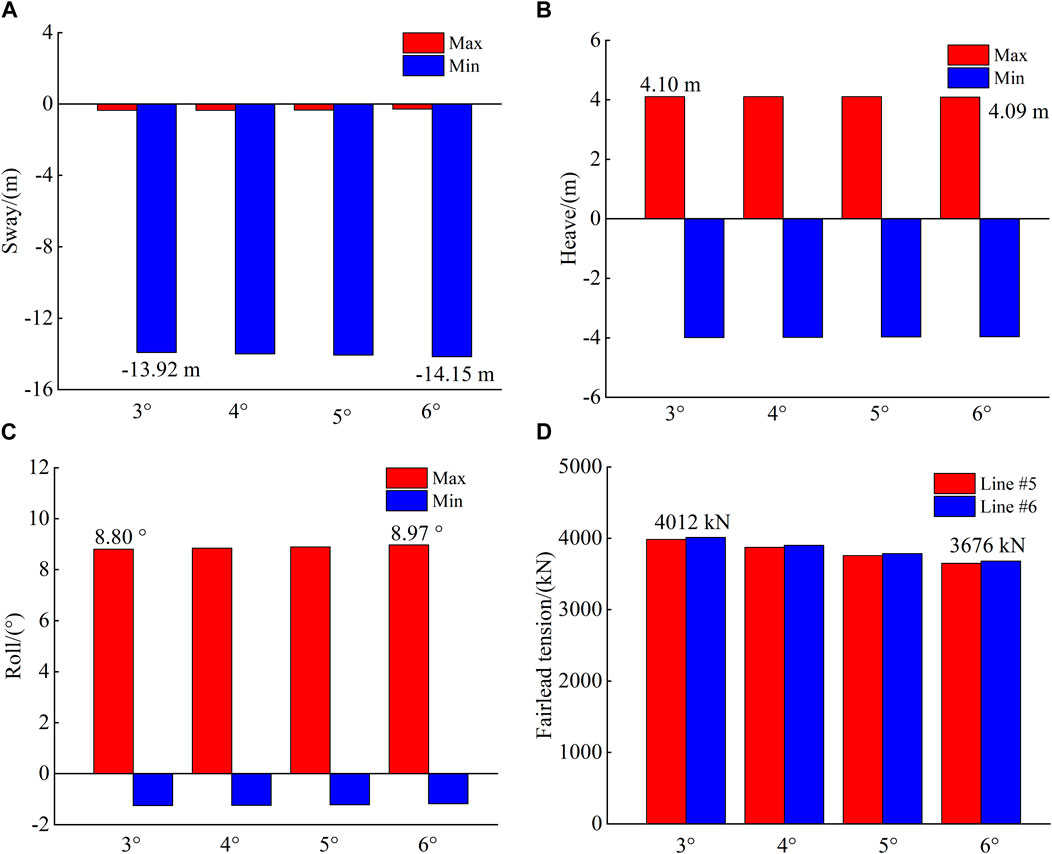
Figure 9. Effects of mooring line spread angle of incidence angle of 90° under extreme condition: (A) sway, (B) heave, (C) roll, (D) fairlead tension.
As shown in the Figure 9, the platform’s displacements and rotations are not sensitive to changes in the mooring line spread angle. As the angle increases, there is virtually no change, indicating that the change in this angle has a minimal impact on the platform’s horizontal and vertical displacement stability, and only a minor improvement in tilt performance. As the angle increases, the peak tension in the most disadvantage line decreases, but the overall reduction is limited (with a maximum decrease of less than 10%). This indicates that alterations in the mooring spread angle have a small effect on fairlead tension. Therefore, while increasing the mooring line spread angle may slightly improve the safety factor of the lines, considering the practical feasibility of construction (such as the installation of mooring chains and anchors), selecting a slightly smaller mooring line spread angle may be more appropriate.
4.5 Effects of mooring line length
It is suggested in some studies that unstretched mooring line length also play a crucial role in mooring safety (Liang et al., 2022; Xu et al., 2024a). This section analyses the impact of different mooring line lengths on the reliability of multi-segment mooring lines under extreme conditions with a 90° wave incidence angle. Specifically, without altering the mooring radius or other parameters, the total mooring line length was adjusted by modifying the length of the bottom chain, with three additional cases considered: total mooring line lengths of 480 m, 485 m and 495 m. It is important to note that the dynamic response of the mooring line is a stochastic process, and determining extreme loads and failure probabilities requires statistical methods (IEC 61400–1, DNV RP-C205). The most commonly employed extrapolation techniques for extreme loads include the Gumbel distribution and log-normal distribution predictions. The probability density functions are expressed as Equations 4, 5:
where x is random variable, μ is mean of the distribution, β is scale parameter, σ is the standard deviation.
Figure 10 shows the predictions for different mooring line lengths and segments employing Gumbel and log-normal distribution methods, respectively. In accordance with DNV regulations (DNV OS-E301) pertaining to the extreme dynamic analysis of mooring lines, the minimum requirement of safety factor is 1.3 (3,812 kN for the upper chain and 6175 kN for the bottom chain). It can be observed that mooring line length has a significant impact on the failure probability. Particularly, under the log-normal prediction, reducing the mooring line length from 480 m to 485 m, just a 1% decrease, results in an increase in failure probability of over 30%. And increasing mooring line length from 490 m to 495 m leads nearly negligible occurrents of failure. This is mainly due to the fact that at 480 m and 485 m, the bottom segment of the mooring line has a reduced laid length, causing the mooring line to approach full tension due to its higher axial stiffness. In shallow water mooring systems, this geometric nonlinearity makes the fairlead tension highly sensitive to platform displacement. Therefore, for muti-segment mooring systems, appropriately increasing the initial length of the bottom resting segment can enhance mooring safety under extreme conditions.
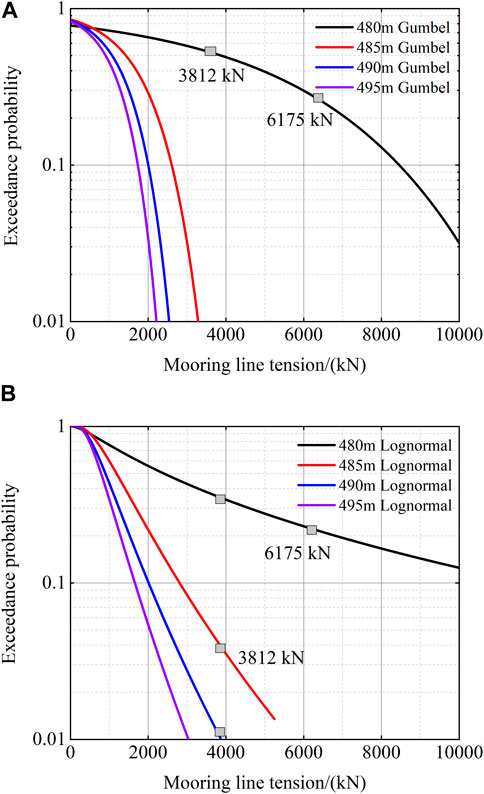
Figure 10. Exceedance probability of mooring tension with different mooring line length: (A) Gumbel, (B) lognormal.
5 Conclusion
This paper establishes an integrated analysis model of a 15 MW floating offshore wind turbine (FOWT) and conducts a hydrodynamic performance analysis of the floating platform. Furthermore, it compares the performance of single-segment and multi-segment mooring systems in terms of platform positioning, mooring line extreme loads, and fatigue response. The impact of various factors, including wind and wave incident angle, mooring line spread angle, and mooring line length, on mooring performance and safety was investigated. The main conclusions are as follows:
1. The natural periods of the DOFs for the floating platform used in this study are similar to those of the VolturnUS-S platform, and the RAOs are more sensitive to wave directions of 0° and 90°. Under normal conditions, the motion differences between the single-segment and multi-segment mooring systems are minimal, and the platform demonstrates good motion performance. Under extreme conditions, the platform experiences greater drift in the multi-segment mooring system due to its lower mooring stiffness. In all conditions, the platform maintains good stability, with a maximum tilt angle of 8.8°.
2. Under extreme conditions, the multi-segment mooring system has a certain impact on the peak tension of the mooring lines, especially under the ALS condition (single-line failure). The multi-segment mooring system significantly reduces the impact loads on the mooring lines, highlighting its advantages. In the multi-segment system, fatigue damage mainly occurs in the upper chain, with approximately 4.5 times greater than that of the bottom chain over a 1-year period. In the single-segment system, the fatigue damage of the same chain is greater than that in the multi-segment system, with the maximum damage increasing by approximately 2.7 times.
3. The platform’s displacement and rotation response are not sensitive to changes in the mooring line spread angle, and the peak tension in the most disadvantage line slightly decreases as the angle increases. The mooring line length has the most significant impact on the fairlead tension, for reducing the length of the bottom section of the chain greatly decreases the safety factor of the mooring system. Therefore, in practical engineering applications, special evaluations should be conducted on the length of the bottom chain section.
Data availability statement
The original contributions presented in the study are included in the article/supplementary material, further inquiries can be directed to the corresponding author.
Author contributions
JH: Conceptualization, Funding acquisition, Methodology, Writing–original draft, Writing–review and editing. HX: Data curation, Formal Analysis, Methodology, Software, Writing–original draft, Writing–review and editing. LC: Data curation, Validation, Visualization, Writing–review and editing. KL: Formal Analysis, Investigation, Validation, Writing–review and editing. MG: Methodology, Software, Writing–review and editing. MY: Conceptualization, Funding acquisition, Writing–review and editing. SR: Funding acquisition, Supervision, Writing–review and editing.
Funding
The author(s) declare that financial support was received for the research, authorship, and/or publication of this article. The authors gratefully acknowledge the financial supports from China Energy Engineering Group Major Science and Technology Project (CEEC2021-ZDYF-01) and the European Commission (HORIZONMSCA-2022-PF-01, 101108745).
Conflict of interest
Authors JH, LC, and KL were employed by China Energy Engineering Group Zhejiang Electric Power Design Institute Co., Ltd. Author MY was employed by China Energy Engineering Group Guangdong Electric Power Design Institute Co., Ltd.
The remaining authors declare that the research was conducted in the absence of any commercial or financial relationships that could be construed as a potential conflict of interest.
Publisher’s note
All claims expressed in this article are solely those of the authors and do not necessarily represent those of their affiliated organizations, or those of the publisher, the editors and the reviewers. Any product that may be evaluated in this article, or claim that may be made by its manufacturer, is not guaranteed or endorsed by the publisher.
References
Abbas, N. J., Zalkind, D. S., Pao, L. W., and Wright, A. (2022). A reference open-source controller for fixed and floating offshore wind turbines. Wind Energy Sci. 7 (1), 53–73. doi:10.5194/wes-7-53-2022
Allen, C., Viselli, A., Dagher, H., Goupee, A., Gaertner, E., Abbas, N., et al. (2020). “Definition of the UMaine VolturnUS-S reference platform devel,” in Oped for the lEA wind 15-megawatt offshore reference wind turbine. TechnicalReport: NREL and IEA Wind.
Asen, S., Page, A. M., Skau, K. S., and Nygaard, T. A. (2017). Effect of foundation modelling on the fatigue lifetime of a monopile-based offshore wind turbines. Wind Energy Sci. 2, 361–376. doi:10.5194/wes-2-361-2017
Azcona, J., Vittori, F., Schmidt, U., Savenije, F., Kapogiannis, G., Karvelas, X., et al. (2017). Design solutions for 10MW floating offshore wind turbines. Report, Innwind. Available at: http://www.innwind.eu//media/sites/innwind/publications/deliverables/deliverabled437_design-solutions-for-10mw-fowt.pdf.
Bak, C., Zahle, F., Bitsche, R., Kim, T., Yde, A., Henriksen, L. C., et al. (2013). The DTU 10-MW Reference Wind turbine. Report, Technical Univeristy of Denmark (DTU). Available at: https://core.ac.uk/download/pdf/13804144.pdf.
Bastos, M. B., and Silva, A. L. N. (2020). “Evaluating offshore rope fibers: impact on mooring systems integrity and performance,” in Paper presented at the Offshore Technology Conference, Houston, Texas, USA, May 6–9, 2024.
Civier, L., Chevillotte, Y., Bles, G., Guillaume, D., Montel, F., Davies, P., et al. (2024). Visco-elasto-plastic characterization and modeling of a wet polyamide laid-strand sub-rope for floating offshore wind turbine moorings. Ocean. Eng. 2024 (303), 117722. doi:10.1016/j.oceaneng.2024.117722
Del Vecchio, C., Yan, H., Rieth, D., Gabrielsen, Ø., Menezes, F., Jegannathan, M., et al. (2024). “Advances towards replacing top chain with fiber rope for offshore moorings: a DeepStar study,” in Paper presented at the Offshore Technology Conference, Houston, Texas, USA, May 6–9, 2024.
Gaertner, E., Rinker, J., and Viselli, A. (2020). Definition of the lEA wind 15-MegawattOffshore reference wind turbine. China: NREL and lEA. Technical Report.
Ghafari, H., and Dardel, M. (2018). Parametric study of catenary mooring system on thedynamic response of the semi-submersible platform. Ocean. Eng. 153, 319–332. doi:10.1016/j.oceaneng.2018.01.093
Guo, Z., Zhou, Z. F., Jostad, H. P., Wang, L. Z., and Rui, S. J. (2024). Relationship between chain axial resistance and confining stress for South China Sea carbonate sand: an element test. Can. Geotech. J. 61 (7), 1449–1467. doi:10.1139/cgj-2023-0322
Ha, T. P. (2011). “Frequency and time domain motion and mooring analysis for FPSO operating in deep water,”. Doctoral Thesis.Sch. Mar. Sci. Technol. Fac. Sci. Agric. Eng. Newctle. Univ. Available at: http://hdl.handle.net/10443/1306.
Hermawan, Y., and Furukawa, Y. (2020). Coupled three-dimensional dynamics model of multi-component mooring line for motion analysis of floating offshore structure. Ocean. Eng. 200, 106928. doi:10.1016/j.oceaneng.2020.106928
Hsu, W., Sharman, K., and Manuel, L. (2017). Extreme mooring tensions due to snap loads on a floating offshore wind turbine system. Mar. Struct. 55, 182–199. doi:10.1016/j.marstruc.2017.05.005
Ja’E, I., Osman, M., Ali, A., Yenduri, A., Zafarullah, N., and Nakayama, A. (2022). Optimisation of mooring line parameters for offshore floating structures: a review paper. Ocean. Eng. 247 (4), 110644. doi:10.1016/j.oceaneng.2022.110644
Jonkman, J. (2010). Definition of the floating system for phase IV of Oc3. Report. Golden, CO (United States): National Renewable Energy Lab.NREL.
Jonkman, J. M. (2009). Dynamics of offshore floating wind turbines-model development and verification. Wind Energy Int. J. Prog. Appl. Wind Power ConversionTechnol. 12 (5), 459–492. doi:10.1002/we.347
Krathe, V. L., and Kaynia, A. M. (2017). Implementation of a non-linear foundation model for soil-structure interaction analysis of offshore wind turbines in FAST. Wind Energy 20 (4), 695–712. doi:10.1002/we.2031
Li, P., Zhang, Y., Wang, Z., Teng, Y., Yi, J., Mu, T., et al. (2023). Development of design typhoon profile for offshore wind turbine foundation design in Southern China. Mar. Struct. 92, 103479. doi:10.1016/j.marstruc.2023.103479
Liang, J., Liu, Y., Chen, Y. K., and Li, A. J. (2022). Experimental study on hydrodynamic characteristics of the box-type floating breakwater with different mooring configurations. Ocean. Eng. 254, 111296. doi:10.1016/j.oceaneng.2022.111296
Matsuishi, M., and Endo, T. (1968). “Fatigue of metals subjected to varying stress,” in Paper presented to Japan society of mechanical engineers. Japan, Fukuoka.
Musial, W., Spitsen, P., Duffy, P., Beiter, P., Marquis, M., Hammond, R., et al. (2022). Offshore wind market report. 2022 Edition. USA: Office of energy efficiency and renewable energy.
Neisi, A., Ghassemi, H., Iranmanesh, M., and He, G. (2022). Effect of the multi-segment mooring system by buoy and clump weights on the dynamic motions of the floating platform. Ocean. Eng. 260 (2), 111990. doi:10.1016/j.oceaneng.2022.111990
Paredes, G. M., Johannes, P., Claes, E., Lars, B., and Francisco, T. P. (2016). Experimental investigation of mooring configurations for wave energy converters. Int. J. Mar. Energy 15, 56–67. doi:10.1016/j.ijome.2016.04.009
Pegalajar-Jurado, A., Hansen, A. M., Laugesen, R., Mikkelsen, R. F., Borg, M., Kim, T., et al. (2016). Experimental and numerical study of a 10MWTLP wind turbine in waves and wind. J. Phys. Conf. Ser. 753, 092007. doi:10.1088/1742-6596/753/9/092007
Pham, H. H. (2024). Numerical modeling of a mooring line system for an offshore floating wind turbine in Vietnamese sea conditions using nonlinear materials. Water Sci. Eng. 17 (3), 300–308. doi:10.1016/j.wse.2023.10.004
Pillai, A., Gordelier, T. J., Thies, P., Cuthill, D., and Johanning, L. (2022). Anchor loads for shallow water mooring of a 15 MW floating wind turbine—Part II: synthetic and novel mooring systems. Ocean. Eng. 266 (1), 112619. doi:10.1016/j.oceaneng.2022.112619
Qiao, D., Li, B., and Ou, J. (2013). Comparative analysis on coupling effects between aninnovative deep draft platform and different mooring models. Brodogr. Teor. praksa Brodogr. i Pomor. Teh. 63 (4), 318–328. Available at: https://hrcak.srce.hr/94191
Robertson, A., Jonkman, J., Masciola, M., Song, H., Goupee, A., Coulling, A., et al. (2014). Definition of the semisubmersible foating system for phase l of OC4. Report. Golden, CO (United States): National Renewable Energy Lab.NREL.
Roddier, D., Peiffer, A., Aubault, A., and Weinstein, J. (2011). “A generic 5 MW wind float for numerical tool validation and comparison against a generic spar,” in 30th International Conference on Ocean, Offshore and Arctic Engineering. OMAE2011-50278.
Rui, S., Xu, H., Teng, L., Xi, C., Sun, X., Zhang, H., et al. (2023b). A framework for mooring and anchor design in sand considering seabed trenches based on floater hydrodynamics. Sustainability 15, 9403. doi:10.3390/su15129403
Rui, S. J., Jostad, H. P., Zhou, Z. F., Wang, L. Z., Sævik, S., Wang, Y. F., et al. (2024c). Assessment of seabed trench formation based on marine sediment properties and chain-bar penetration tests. Eng. Geol. 342, 107746. doi:10.1016/j.enggeo.2024.107746
Rui, S. J., Wang, L. Z., Zhou, Z. F., Jostad, H. P., and Guo, Z. (2024b). Bearing performance of a novel caisson-plate gravity anchor. Géotechnique, 1–12. (In Press). doi:10.1680/jgeot.23.00451
Rui, S. J., Zhou, Z. F., Gao, Z., Jostad, H. P., Wang, L. Z., Xu, H., et al. (2024a). A review on mooring lines and anchors of floating marine structures. Renew. and Sust. Energ. Rev. 199, 114547. doi:10.1016/j.rser.2024.114547
Rui, S. J., Zhou, Z. F., Jostad, H. P., Wang, L. Z., and Guo, Z. (2023c). Numerical prediction of potential 3-dimensional seabed trench profiles considering complex motions of mooring line. Appl. Ocean. Res. 139, 103704. doi:10.1016/j.apor.2023.103704
Smith, R. J., and MacFarlane, C. J. (2001). Statics of a three component mooring line. Ocean. Eng. 28 (7), 899–914. doi:10.1016/s0029-8018(00)00058-5
Spearman, D., Strivens, S., Matha, D., Nicolai, C., Macleay, A., Regelink, J., et al. (2020). “Floating wind joint industry project - phase I summary report,” in Report. Carbon Trust. Available at: https://www.carbontrust.com/our-work-and-impact/guides-reports-and-tools/floating-wind-joint-industry-programme-phase-ii-summary-report.
Stehly, T., Beiter, P., and Duffy, P. (2020). 2019 cost of wind energy review (No. NREL/TP-5000- 78471). Golden, CO (United States): National Renewable Energy Lab.NREL.
Vestas, (2021). Technical specification online V235-15.0MW. Available at: https://www.vestas.com/en/products/offshore-platforms/v236_15_mw (Accessed on 18 June 2021).
Wang, L., Hong, Y., Gao, Y., Huang, M., Guo, Z., Lai, Y., et al. (2023). Dynamic catastrophe and control of offshore wind power structures in typhoon environment. Chin. J. Theor. Appl. Mech. 55 (3), 567–587. (in Chinese). doi:10.6052/0459-1879-22-529
Wang, L. Z., Rui, S. J., Guo, Z., Gao, Y. Y., Zhou, W. J., and Liu, Z. Y. (2020). Seabed trenching near the mooring anchor: history cases and numerical studies. Ocean. Eng. 218, 108233. doi:10.1016/j.oceaneng.2020.108233
WFO (2022). Global offshore wind report-2022. World Forum Offshore Wing. Available at: https://gwec.net/wp-content/uploads/2022/06/GWEC-Global- Offshore-Wind-Report-2022.pdf.
Xie, Z. T., Yang, J. M., Hu, Z. Q., Zhao, w.H., and Zhao, J. R. (2015). The horizontal stability of an FLNG with different turret locations. Ocean. Eng. 7, 244–258. doi:10.1515/ijnaoe-2015-0017
Xu, H., Rui, S. J., Shen, K. M., and Guo, Z. (2023). Investigations on the mooring safety considering the coupling effect of the mooring line snap tension and anchor out-of-plane loading. Appl. Ocean. Res. 141, 103753. doi:10.1016/j.apor.2023.103753
Xu, H., Rui, S. J., Shen, K. M., Jiang, L. L., Zhang, H. J., and Teng, L. (2024a). Shared mooring systems for offshore floating wind farms: a review. Energy Rev. 3 (5), 100063. doi:10.1016/j.enrev.2023.100063
Xu, H., Wang, L. Z., Zha, X., Rui, S. J., Shen, K. M., and Guo, Z. (2024b). Dynamic response of floating offshore wind turbine under different stages of typhoon passage. Appl. Ocean. Res. 104047. doi:10.1016/j.apor.2024.104047
Yu, Y., Zhao, M. R., Li, Z. M., Zhang, B. L., Pang, H. X., and Xu, L. X. (2024). Optimal design of asymmetrically arranged moorings in a floating production system based on improved particle swarm optimization and RBF surrogate model. Mar. Struct. 94, 103576. doi:10.1016/j.marstruc.2024.103576
Zha, X., Lai, Y. Q., Rui, S. J., and Guo, Z. (2023). Fatigue life analysis of monopile-supported offshore wind turbines based on hyperplastic ratcheting model. Appl. Ocean. Res. 136 (2), 103595. doi:10.1016/j.apor.2023.103595
Keywords: floating wind turbine, mooring line, mooring system, floating platform, chain
Citation: Huang J, Xu H, Chen L, Lin K, Guo M, Yang M and Rui S (2024) Analysis of mooring performance and layout parameters of multi-segment mooring system for a 15 MW floating wind turbine. Front. Energy Res. 12:1502684. doi: 10.3389/fenrg.2024.1502684
Received: 08 October 2024; Accepted: 30 October 2024;
Published: 19 November 2024.
Edited by:
Yuquan Zhang, Hohai University, ChinaReviewed by:
Cai Tian, Norwegian University of Science and Technology, NorwayGuang Yin, University of Stavanger, Norway
Copyright © 2024 Huang, Xu, Chen, Lin, Guo, Yang and Rui. This is an open-access article distributed under the terms of the Creative Commons Attribution License (CC BY). The use, distribution or reproduction in other forums is permitted, provided the original author(s) and the copyright owner(s) are credited and that the original publication in this journal is cited, in accordance with accepted academic practice. No use, distribution or reproduction is permitted which does not comply with these terms.
*Correspondence: Hang Xu, eHVfaGFuZ0B6anUuZWR1LmNu
 Jianwu Huang1
 Hang Xu
 Shengjie Rui