- 1Department of Electrical Engineering, National Institute of Technology, Jamshedpur, India
- 2Department of Electrical and Electronics Engineering, School of Engineering and Technology, Sandip University, Nashik, India
- 3Department of Electrical Engineering, B.K. Birla Institute of Engineering and Technology, Pilani, India
- 4College of Computer and Information Sciences, Prince Sultan University, Riyadh, Saudi Arabia
- 5Automated Systems and Soft Computing Lab (ASSCL), Prince Sultan University, Riyadh, Saudi Arabia
- 6Faculty of Computers and Artificial Intelligence, Benha University, Benha, Egypt
- 7Faculty of Engineering, Cairo University, Giza, Egypt
- 8Department of ICT and Natural Sciences, Norwegian University of Science and Technology, Alesund, Norway
The growing energy demand and target for net zero emission compelling the world to increase the percentage of clean energy sources which are freely available and abundant in nature. To fulfil this, a hyperparametric tuned multilevel deep learning stacked model assisted grid-connected hybrid renewable energy system (HRES) has been developed. The proposed system has been subjected to techno-economic assessment with a novel application of the rime-ice (RIME) optimization algorithm to determine the lowest possible cost of electricity (COE) corresponding to the best HRES system components. The analysis has been carried out for the residents of the eastern part of India. The results show that the prediction accuracy of the solar irradiance and wind speed are 95.92% and 95.80% respectively which have been used as inputs for the HRES. The proposed optimization used has shown the lowest COE of Rs. 4.65 per kWh and total net present cost (TNPC) of 7,247 million INR with a renewable factor of 87.88% as compared to other optimizations like GWO, MFO and PSO. Further sensitivity analysis and power flow analysis for three consecutive days carried out have also been done to check the reliability of the HRES and its future perceptiveness.
1 Introduction
The dynamic interplay between societal modernity, population growth, and urbanization presents formidable obstacles for energy providers seeking to balance supply and demand for electrical energy. The increasing number of electronic gadgets, the rise of industries, and the general increase in energy-intensive activities are all contributing factors to the rising need for energy. The difficulty increases when one takes into account the constraints and quick exhaustion of non-conventional energy sources. Non-conventional sources, such as fossil fuels, are finite and contribute to environmental challenges including air pollution and climate change. This calls for a change to renewable and sustainable energy sources.
Growth in the world’s power demand is predicted to slow down in 2023 and then pick up speed in 2024. After growing at a rate of 2.3% in 2022 and an average annual growth rate of 2.4% from 2015 to 2019, demand is predicted to expand by slightly less than 2% in 2023. Declining power consumption and slower economic development in advanced economies—which are still coping with the fallout from the global energy crisis—are the main causes of this reduction. Rebounding to 3.3% in 2024, global power demand growth is predicted as prospects for the economy improve (Executive summary–Electricity Market Report–Update 2023–Analysis, 2023) which correspondingly emphasizes the overall power generation demand. The increasing energy demand can only be matched up with the increasing percentage of renewable energy as the non-conventional sources are limited and exhaustible. India has also increased the sanctioned capacity of solar power to 2,655.07 MW and Wind Power to 1,341.28 MW like other countries to fulfil the power scarcity and reduce carbon emission marking the contribution for the net zero emission target (NZE) for 2050.
The natural availability of solar irradiance and wind has not only made it possible for energy supply to remote areas but also provided the stability of the overall generation and distribution network if connected to the electrical grid. However, to guarantee a steady and dependable supply, precise estimation of energy production from various sources is essential, supporting grid planning and management. Because of their dynamic behavior, which is impacted by time, weather conditions, and location, it is particularly difficult to predict when they will generate electricity. In addition to the intrinsic complexity of these phenomena, the challenges are made worse by the scarcity of local real-time data, especially for projections that are made for the near future. To solve these types of issues, the application of advanced models and forecasting methods is crucial (Ladide et al., 2019). As a result, complex modelling and forecasting approaches are required to attain this objective (Caroprese et al., 2024).
In this paper, an optimized stacked machine learning model has been designed for the prediction of the accurate solar irradiance and wind speed which have been further utilized for the calculation of the forecasted solar and wind power. The RNN and LSTM deep learning models have been used as the base learner model and 1D-CNN as the Meta learner for the stacking purpose. The parameters of the deep learning models have been tuned initially with the Bayesian optimization instead of applying default and fixed parametric values which may affect the accuracy of the model. The forecasted solar and wind power is used for the techno-economic analysis of the grid-connected hybrid system consisting of photovoltaic panels, wind turbine generators, and battery systems for satisfying the residential load demand (Al Busaidi et al., 2023).
For power systems to function properly, optimal power flow is a critical issue. Optimizing power flow is significantly more important for hybrid energy systems because of the unpredictability and instability brought on by generation generated from renewable energy sources (Pandya et al., 2022). In this study, our strategy maximizes the effectiveness of these many sources by utilizing optimization approaches. Hence, a novel application of the RIME ice optimization has been used for the techno-economic analysis of the proposed HRES system and compared with other popular optimization algorithms to validate the result where the objective was to minimize the total electricity cost (TEC) with the best combination of the system components. We increase the assessment’s realism by including predictive analytics, which also helps to clarify the concept of renewable energy integration and emphasizes the value of making proactive decisions in sustainable energy planning.
1.1 Status quo of machine learning-based techno-economic analysis
The application of machine learning models for the assessment of off and on-grid connected individual or hybrid renewable energy sources nowadays burning research areas as the need for electrical supply is increasing day by day (Kamran et al., 2018). Some of the recent works concerning this issue have been quoted in Table 1.
1.2 Main contributions and paper organization
The contribution made in this research article can be summarized as:
• A multilevel-tuned deep learning method has been developed for the prediction of both solar irradiation and wind speed forecasting.
• The tuning of the deep learning models has been done with the Bayesian optimization method.
• The predicted solar irradiance and the wind speed values are used for the power calculation.
• A novel application of the rime-ice (RIME) optimization technique has been done for the techno-economic analysis of the grid-connected HRES and compared with the GWO, MFO and PSO.
• Optimum sizing of the system components has been determined with the minimization of the cost of electricity (COE) and total net present cost (TNPC).
• The sustainability and reliability of the proposed system have been checked with the sensitivity analysis and power flow analysis methods.
• Environment and Social Index for improvised policy making decision.
The paper has been organized as the first section contains the introduction, literature survey and the contribution made. The second section has focused about the methodology and data preprocessing methods. The theory about the deep learning models, optimization method applied and performance metrics has been explained in section 3rd, 4th and 5th respectively. The next section is about HRES modelling followed by the result and discussion section. Finally, the overall research work has been concluded in the last section.
2 Methodology
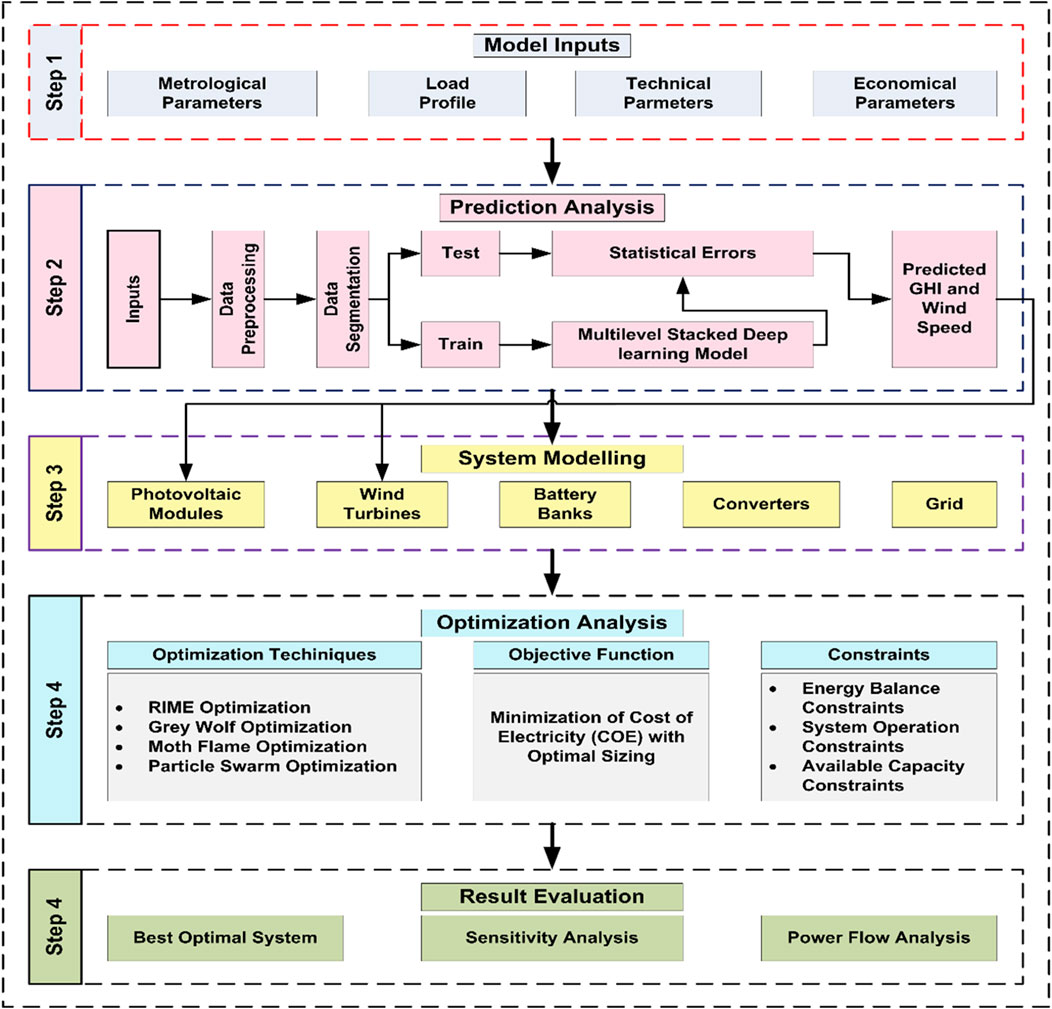
The overall methodology has been divided into two main parts. In the first part, the prediction of GHI and the wind speed is done with the help of the hyper-tuned stacked model. The parameters of the three deep learning models have been initially optimized with the Bayesian Optimization and a further stacking approach has been applied for the prediction of both parameters which will be used for the estimation of the predicted solar and wind power. The second part is about techno-economic analysis of the hybrid renewable energy system (HRES) where hybridization of the photovoltaic system (PVS), wind turbine system (WTS) and diesel generator system (DGS) has been carried out. The technical and economic parameters have been analyzed and optimized with different optimization techniques to minimize the losses and maximize the benefit of the best HRES configurations. The overall flow of the work has been described in Figure 1.
The steps carried out for the predictions of the GHI and wind speed can be represented in the following steps:
I. Aggregation of Data: The dataset of the year (2016–2023), which included important environmental factors like wind speed and sun irradiation, has been gathered from the NASA website, provides important insights into the interactions between environmental components over the study period and is useful for assessing long-term trends and patterns in solar energy and wind dynamics. The dataset contains the 13 attributes where the target variables are only two i.e., GHI and wind speed.
II. Cleaning of Data: Refining datasets through error correction, missing value management, and duplication removal requires data cleaning as the raw data may contain unwanted values that can affect the model’s accuracy. Imputation and outlier elimination are two techniques that improve data quality and guarantee accurate and trustworthy analysis.
III. Normalization of Data: Scaling and standardizing numerical characteristics within a dataset to provide consistent ranges for useful analysis is known as data normalization. A popular technique called Min-Max normalization uses Equation 1 to scale data to a range of 0–1:
where, vn and vi are the data after normalization and before normalization vmax and vmin are the maximum and minimum data values.
IV. Feature Importance Analysis: By evaluating the relevance of input variables in machine learning models, feature importance analysis provides insights into important factors that influence decision-making when the dataset consists of a lot of attributes. This analysis facilitates comprehension, streamlines intricate models, and backs data-driven decision-making procedures. Here, the correlation method has been used to show the correlation of attributes among themselves.
V. Training and Testing Division: The whole data has been split into two parts in the ratio of 7:3. The larger part (70%) represents the training data used for the training of the stacked model and the smaller part (30%) is the testing data for the evaluation of the model with.
3 Deep learning models
Deep learning models are generally the subset of the machine learning models which mimic the human brain neurons and have evolved as the most promising model to solve the issue of overfitting, underfitting, large dataset handling and feature extraction. DL consists of large no. hidden layers which produce the optima data after processing the inputs multiple times (Krishnan et al., 2023). There are several deep learning models available, out of which three DL algorithms have employed in the study.
3.1 Recurrent neural network
An artificial neural network type called a recurrent neural network (RNN) was introduced in the 1990s by Elman to handle sequential data by retaining the internal state or history of the observations. RNNs can display dynamic temporal behavior because they have connections that loop around on themselves, in contrast to feed-forward neural networks, which only process data in a single direction. To put it another way, an RNN gives neural network a memory function, which helps the neural network perform well while analyzing time series data (Miao and Yokota, 2024).
The present state of a hidden layer of an RNN unit can be determined using the current input state and the prior hidden state as per the Equation 2:
where
3.2 Long short-term memory (LSTM)
The problem of dealing with long-term dependencies in sequential data has led to the development of LSTM, an upgraded version of recurrent neural network (RNN) (Xu et al., 2024). Since its first introduction by (Hochreiter and Schmidhuber, 1997), it has been widely utilized in several domains, such as time series analysis, natural language processing, and speech recognition.
The LSTM cell unit structure can be explained with the following three gate:
I. Forget gate: It decides which data or information needs to be erased from the memory as in Equation 4.
II. Input gate: It decides which data will be passed through memory or cell as in Equation 5.
III. Output gate: It selects the data that exits the memory cell unit as per the Equation 6.
The expression for the other states like temporary cell state, current cell state and the hidden layer state can be presented using Equations 7–9.
3.3 One dimensional convolutional neural network (1D-CNN)
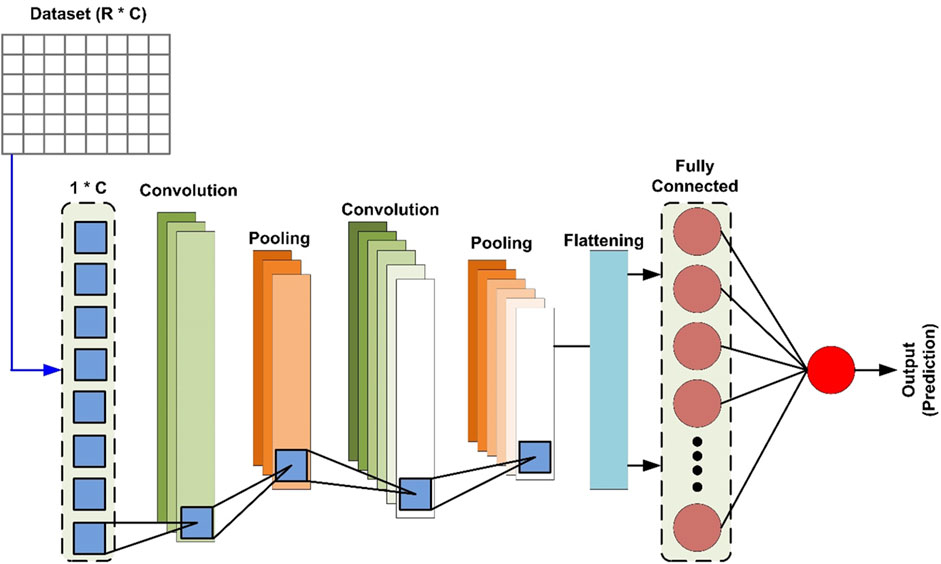
1D-CNN is a type of deep neural network that has become well-known for its exceptional capacity to identify and evaluate intricate patterns within huge datasets (Teng et al., 2024). Sequential data is processed by a one-dimensional CNN by convolving the input sequence using learnable filters. A feature map is produced by the convolution process, which calculates the dot product between the input sequence and the filter at each place (Namdari et al., 2023). Let’s have an input sequence of one dimension
here
The significant features are then usually extracted from the feature maps
3.4 Stacking of tuned deep learning models
In machine learning and deep learning, stacking—also referred to as stacked generalization or meta-ensembling is an effective approach that combines numerous models to enhance prediction performance. Stacking is the process of training many neural networks and integrating their predictions to generate a better ensemble model in the context of deep learning (Lazzarini et al., 2023). The procedure for the stacking of ML or DL modes can be represented with the pseudo-code of Algorithm 1 which is as follows:
Algorithm 1.Stacking pseudo code.
Input:
Output: Trained stacked model
1. Stage 1: Base-level learning
2. for
3. learning of
4. end for
5. Stage 2: Implementation of new prediction dataset
6. for
7.
8. end for
9. Stage 3: Meta-level learning
10. Learning of
11. return
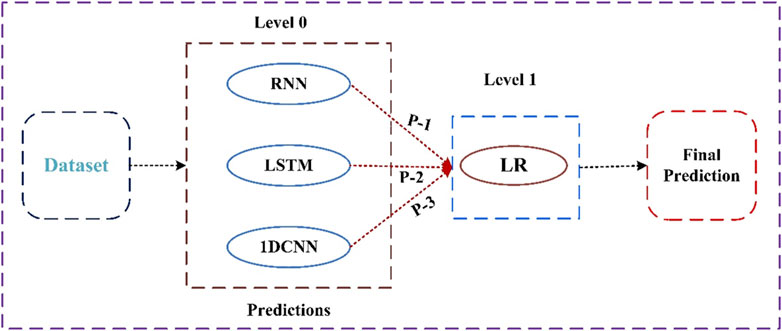
The stacked model considered in this article consists of RNN, LSTM and 1DCNN as the base learner and linear regression as the meta-learner model or final prediction model. First, the hyperparameters of the base learners are tuned using Bayesian optimization and the overall stacking structure is presented in Figure 3.
4 RIME optimization algorithm
This method is motivated by the rime formation, introduced by Hang Su (Su et al., 2023). The rime form due to the uncondensed water molecules available the atmosphere and the formation takes place on the materials like tree branches present in the colder region or climate. Some of the regions generate an annual distinctive scene known as rime-ice because of their distinct geographical structure and climate. The factors like wind speed, temperature, air quality and humidity affect the formation of the rime ice. The growing process of the rime ice come to end when it achieves an stable state in spite of the continuous variation in the atmospheric conditions. Normally the growing pattern is split into soft rime and hard rime pattern.
This method makes use of the different ways that soft- and hard-rime develop, which are determined by the direction and speed of the wind. It combines techniques including a positive greedy selection method, a hard-rime puncture mechanism, and a soft-rime search. Together, these components enable the optimization process to be refined iteratively, giving the RIME algorithm strong global optimization capabilities.
The algorithm mimics the development patterns of both hard-rime and soft-rime to construct its hard-rime puncture and soft-rime search methods. The RIME method consists of four major steps which can be explained in mathematical form as follows:
4.1 Initializing cluster of RIME
Like other population-based optimization techniques, RIME starts by initializing the population. The population is made up of m rime agents
In this case,
4.2 Soft-rime searching method
Soft-rime growth grows slowly in the same direction but is very unpredictable and may stick to most object surfaces. RIME may efficiently prevent local stagnation and explore widely in initial iterations thanks to the soft-rime search technique, which is based on these growth qualities. The following is the updating procedure for rime particles:
In the above equation, the new position of the
where
In order to regulate the number of segments of the step function, the default value
The pseudo code of the above analysis of the soft rime method has been shown in Algorithm 2.
Algorithm 2.Soft-Rime Searching Pseudo Code.
1. Initialization of Rime population (P)
2. Obtain the present best rime agent and its fitness value
3. While
4. Calculate the
5. For
6. For
7. If
8. Updating the rime position using the Equation 14
9. End If
10. End For
11. End For
12. Updation of the best agent position and its fitness value
13.
14. End While
4.3 Mechanism of hard rime puncture
Like rime puncture, hard rime frequently intersects because it expands in the same direction. By imitating this technique, rime agents can share information, improving convergence and avoiding entrapment in local optima as described in Equation 18 below:
where the
Algorithm 3.Hard Rime Puncture Pseudo Code.
1. Initialization of Rime population (P)
2. Obtain the present best rime agent and its fitness value
3. While
4. For
5. For
6. If
7. Updating the rime position using the Equation 18
8. End If
9. End For
10. End For
11. Updation of the best agent position and its fitness value
12.
13. End While
4.4 Mechanism for positive greedy selection
In contrast to traditional greedy selection, RIME takes an aggressive stance, which improves the algorithm’s exploration and exploitation. It contrasts the fitness values of updated and non-updated search agents, swapping out the latter for updated agents that perform better. By enhancing the search agents’ general quality, this strategy drives the population closer to optimum with each repetition. The Algorithm 4 has represented the steps of the positive greedy selection in the form of pseudo code.
Algorithm 4.Positive Greedy Selection Pseudo Code.
1. Initialization of Rime population (P)
2. Obtain the present best rime agent and its fitness value
3. While
4. For
5. IF
6.
7.
8. IF
9.
10.
11. End If
12. End For
13. End For
14.
15. End While
Algorithm 5 provides a concise overview of the RIME algorithm, including its operational phases and pseudo-code and also the flow diagram of the algorithm has been shown in Figure 4.
Algorithm 5.Rime Pseudo Code.
1. Initialization of Rime population initialization (P)
2. Obtain the present best rime agent and its fitness value
3. While
4. Calculate the
5. If
6. Updating the rime position using the soft-rime method
7. End If
8. If
9. Cross updating among rime particles using hard-rime puncture method
10. End If
11. If
12. Using the positive greedy selection process, replace the unsatisfactory solution with the optimum one.
13. End If
14.
15. End While
The optimization is better than the other traditional or state of art optimization techniques due to following reasons:
1. The soft rime strategy allows the algorithm to simultaneously consider the breadth and depth when searching for the optimal solution, alternating between large-scale exploration and small-scale exploitation.
2. By achieving centralized exploitation through the crossover between the optimal and current solutions, the hard-rime puncture mechanism facilitates the RIME algorithm’s rapid locking of the global approximation optimal solution, hence enhancing the accuracy and efficiency of the solution.
3. By preventing low-quality solutions from entering the search population, the positive greedy selection process allows the RIME algorithm to actively alter the positions of agents. This enhances population diversity, guarantees the accuracy of the whole population after every iteration and drastically lowers the algorithm’s performance loss.
5 HRES techno-economic assessment
This study looks into how rural electrification programs may help achieve techno-economic improvements in the power system’s functioning through total transformation and a methodical approach with an emphasis on increasing the amount of renewable energy at the local level, solar and wind turbines are regarded as the main renewable energy sources (Rhaman, 2013; Meghni et al., 2017; 2018; Ammar et al., 2019; Abdelmalek et al., 2018).
When the local wind speed at the hub height is less than the wind turbine’s cut-in wind speed, neither solar nor wind energy is accessible at night. This system combines wind and solar energy such that each one may compensate for the other’s shortcomings. Both the price of power and the overall net current cost would drop as a result of this arrangement. A graphical representation of an integrated energy system is shown in Figure 5, which highlights the advantages of smart control and low-carbon technologies for consumers. The system configuration selected is intended to support the push for a sustainable energy transition.
5.1 Technical aspects of the HRES system
The system considered for the analysis consists of the four major resources which are solar array, wind turbine, battery storage system and diesel generators. The mathematical design of the individual system components has been discussed separately.
5.1.1 Modelling of solar photovoltaic (SPV) system
Ideally, the equation used to determine the hourly energy production of solar modules (
where
where
here,
5.1.2 Modelling of wind turbine (WT) system
A turbine’s main function is to convert mechanical wind energy into electrical energy. Equation 22 can be used to represent a wind turbine’s power output
here the
5.1.3 Modelling of battery storage system (BSS)
In order to provide a steady supply of electricity due to the intermittent nature of solar and wind energy, battery storage systems must be used in wind turbine and photovoltaic power plants. Distributed generators are supported by batteries, which electrochemically store direct current (DC) electrical energy (Kharrich et al., 2021). The battery storage system may enhance the quality of grid electricity in addition to promoting renewable resources. The life span of the BSS generally depends on the charging and discharging phenomenon which is governed as per initial and minimum state of charge (SoC) of the BSS. The Equations 23, 24 associated with charging and discharging process are expressed as:
where
5.1.4 Modelling of converter
Electric power may be converted using a converter in two different ways: first, for inversion, from DC to AC, and second, for rectification, from AC to DC. The converter acts as a link between the DC and AC buses transforms DC voltage from PV modules and the battery into AC voltage. It then reverts the AC voltage to DC voltage to charge the battery using the extra energy produced by the diesel generator and wind turbine (Oladigbolu et al., 2023). Equation 25 is used to determine the output power of the converter.
here
5.2 HRES energy management system
The energy management system of the suggested hybrid/integrated renewable energy system handles issues with robustness, stability, and technological dependability. The duties covered in this area include managing rural communities, achieving technological performance, allocating resources optimally, and operating in a resilient manner. The main goal of energy management is to govern the flow of energy in the hybrid energy system for rural communities by making effective decisions that take into account the technological capabilities and constraints of each system component. Here the strategies for the energy flow have been categorized into three scenarios which are as follows:
Scenario 1: When RES power is greater than the load, then battery charges according to the Equations 26–28.
Scenario 2: When RES power is less than the load power, then the BSS supplies the deficit load according to Equations 29–31.
Scenario 3: “When RES and BSS are both unable to supply the load, then power will be supplied by the grid according to Equation 31.
5.3 HRES objective function
Several economic criteria are employed in the literature to analyze the economic feasibility of localized renewable energy systems. The life cycle cost, total annualized cost, and cost of energy are some of these factors. The economical method, which takes into account the life cycle, initial cost, operation and maintenance costs, and replacement costs of each subsystem, is established in this section for system configurations depending on the Total Net Present Cost (TNPC) and Energy Cost (EC).
The minimization of the COE for the proposed HRES is the main concern of this study which can be expressed using Equation 32 expressed below:
where, CRF denotes the capital recovery factor which can be calculated using Equation 33 expressed below:
where r is the actual rate of interest which is 7 percent here and the project period is generally considered equal to the PV panel life span.
To evaluate an investment project’s economic feasibility, one important financial metric is the TNPC which consists of all system components’ capital cost, their maintenance and operating cost and the cost of replacement of any particular component.
Similar to TNPC one more key parameter that has been analyzed here is the renewable fraction (RF) refers to a limit that establishes how much energy is imported by the grid concerning a renewable generator. The perfect system using exclusively renewable resources is indicated by the renewable factor of 100%. On the other hand, the renewable factor of 0% indicates that the power imported by the grid is equal to the power generated by renewable resources. The RF can be obtained using Equation 34 shown below:
The constraints taken for each objective function are the maximum and minimum number of PV panels, wind turbines and battery systems.
5.4 Socio development and environmental index
Earmarking the sustainable development, the environment impact and social development have to be a concern to consider while designing any HRES system. The environmental benefits on by reducing the Carbon emission should be prioritize and employment of the local for rural community enhancement must be taken into the consideration. This paper has introduced the socio-environmental index while designment HRES system and formulating the objective functions.
The following Equation 35 computes the total employment that could be created by deployment of the proposed HRES system (Kumar et al., 2023):
where,
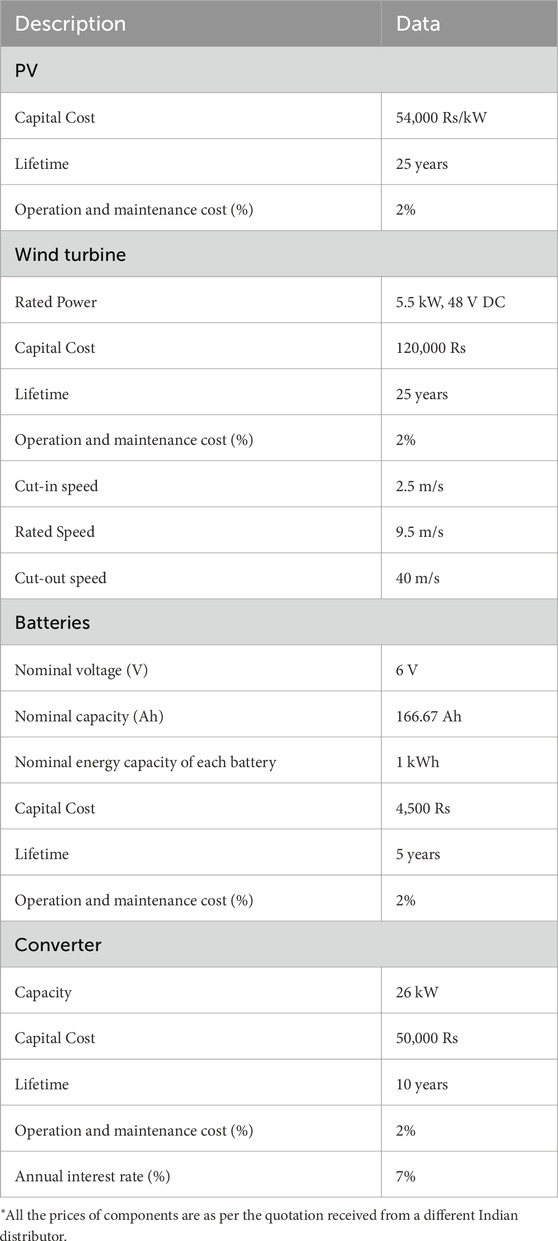
Table 3 below display the input parameter as employment variables considered in this paper. Furthermore, this paper also includes the environmental index which highlights that the following system have attained reduction in carbon emission in comparison with the traditional diesel generator or grid. The carbon emission is calculated by the emission factor mentioned in the Table 3 and power generated by each component of the system and the total emission can be determined by the following Equation 36.
where
6 Performance metrics
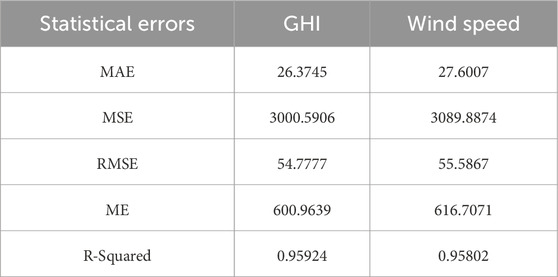
Comprehending regression model performance issues is crucial for evaluating accuracy and directing enhancements. Reducing mistakes improves predictive power, which is essential for practical uses in engineering, healthcare, and finance. Understanding the kind and extent of errors is necessary to make informed decisions and guarantee consistent model performance in this article, five statistical measures have been calculated which are: Mean Error (ME), Root Mean Squared Error (RMSE), Mean Squared Error (MSE), Mean Absolute error (MAE) and R-Squared score.
7 Results and discussion
The overall analysis has been divided into two sections where in the first section the prediction of the solar irradiance and wind speed and the second part explains the techno-economic analysis of the HRES with the optimization method has been discussed in brief.
7.1 Prediction analysis of the GHI and wind speed
The 5 years of data obtained from the NREL have been taken for the analysis and the five performance parameters have been calculated to highlight the efficiency of the model. There are so many parameters associated with each deep learning model which generally affect the performance of the model if properly not selected. For this reason, the hyperparameters of each deep learning model have been optimized with Bayesian optimization and a further stacking process has been accomplished.
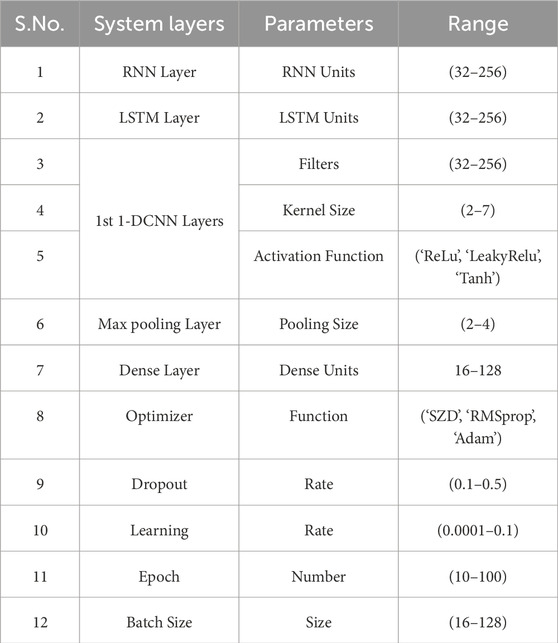
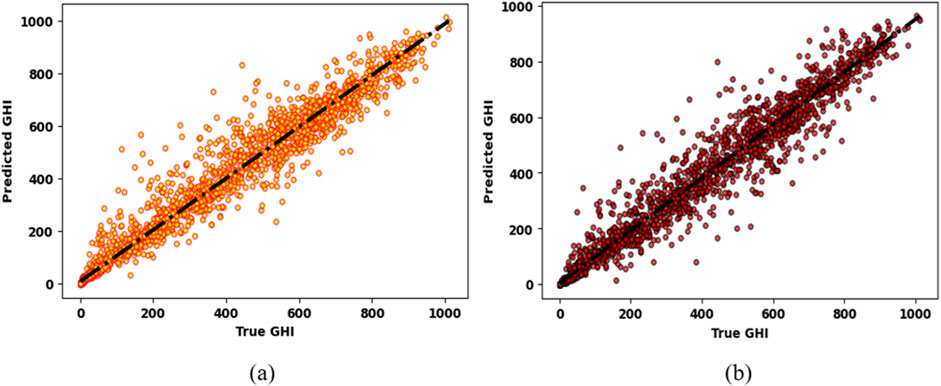
The hyperparameters range and chosen values for the optimization have been shown in Table 4 and the Table 5 shows the output of the Bayesian Optimization. The statistical errors of the stacked model with the optimized parameters for the GHI and the wind speed prediction have been represented in Table 6. The regression analysis has been done between the predicted and the true values of both targeted variables and has been shown with the scatter plot in Figure 6A for GHI and in Figure 6B for wind speed.
7.2 Techno-economic analysis
This paper examines and presents quantitative experiment results related to resilient planning and evaluation of the integrated multi-agent hybrid energy system that was created. The solar radiation and wind speed data utilized in this study is primarily anticipated using the stacked deep learning method, followed by the planning and distribution of the hourly rural local load consumption profile. In order to create a strong and practical techno-socio-economic architecture RIME optimization is applied and compared with other prominent optimization techniques.
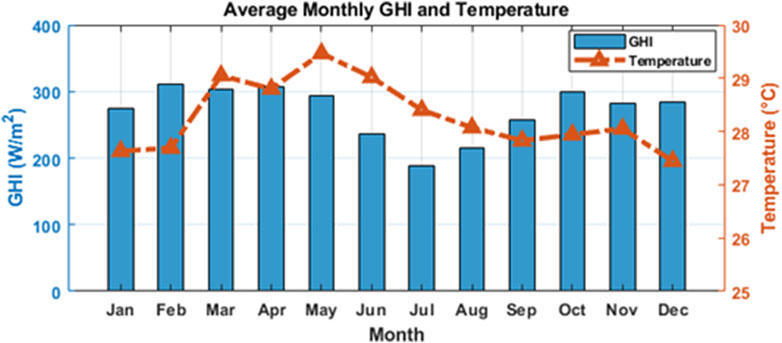
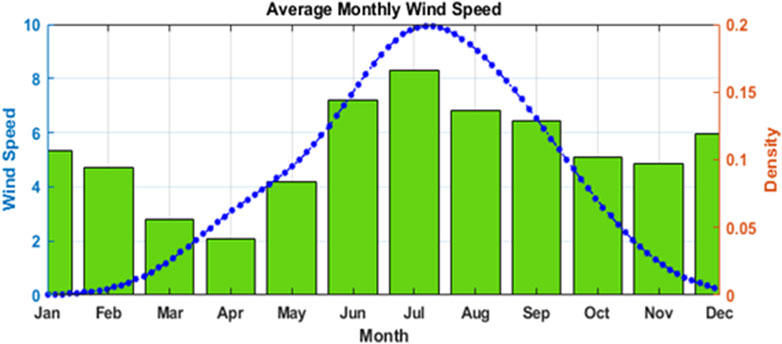
The residential load profile for the entire year has been plotted in Figure 7 where it can be noted that the load is generally low in the morning and night but at the peak in the afternoon. Also, if we analyze the entire year the summer season has maximum demand as compared to the winter. The monthly profile of the solar irradiance and temperature has been shown in Figure 8 and the wind speed in Figure 9 respectively.
7.2.1 Optimal sizing impact on TNPC and EP
The sizing of the system components has a significant impact on the performance of the system. The optimal results are filtered out after 30 separate runs of the RIME, GWO, MFO, and PSO with a population size of 100 and a maximum of 200 iterations. The optimum sizing of the system components which provides the minimum TNPC and EP has been shown in Table 7.
It can be observed that the RIME method has performed well as compared to other optimization techniques with the lowest objective values of 4.65 Rs./kWh for electricity price/cost and 7246578600 for TNPC. The convergence and precision of the outputs from all four optimizations have been also assessed to create a stable and ideal configuration for a hybrid energy system as shown in Figure 10.
The validation of the proposed model has also been carried out the most popular HOMER software (Kanata et al., 2021) which is widely used for the techno economic analysis of HRES. The validation analysis has been represented with the Table 8 where it can be observed that the proposed optimization has better outcome as compared to the HOMER which make it more reliable and applicable.
The convergence characteristics of the four optimization methods show that the proposed method has the lowest electricity price or COE as compared to other optimization methods, only GWO has similar and nearest behavior.
7.2.2 Sensitivity analysis
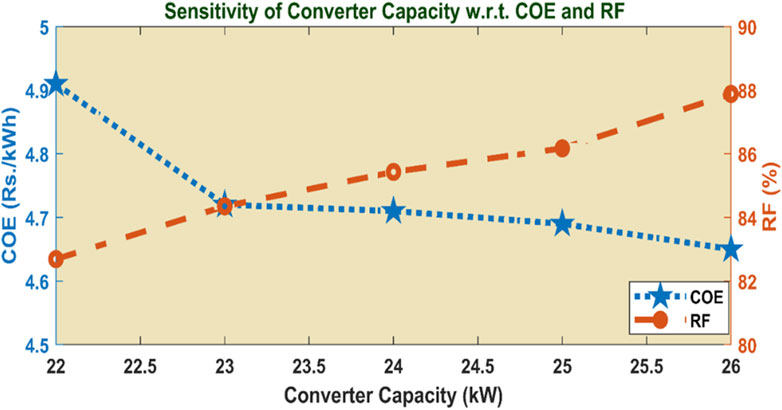
Sensitivity analysis is very crucial in the field of TEA of any HRES to have an understanding of the impact on the designed system performance measures such as NPV and EP due to key parameter variations. Through the identification of sensitivities, stakeholders may enhance the resilience and economic sustainability of HRES installation by optimizing system design, mitigating risks, and making informed decisions. Hence in this study sensitivity analysis of the COE/EP has been checked with the variation of the different converter capacities and also sensitivity analysis of converter capacity with various sizes DGs is performed as shown in Figures 11, 12.
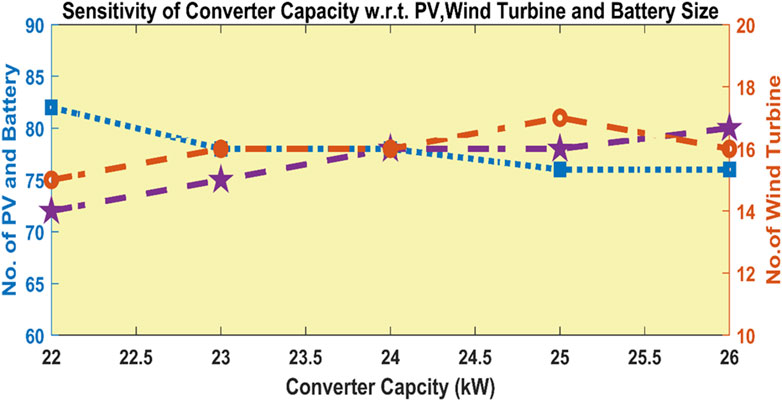
Figure 12. Sensitivity of size of PV, wind turbines and battery with respect to converter capacities.
It can be observed that the COE/EP has an inverse relationship with the converter capacity but is directly proportional to the RF. The COE is minimum, i.e. 4.65 Rs./kWh for 26 kW converter capacity and can be minimized by increasing the capacity of the converter. Figure 12 shows the optimum number of all the supplying sources corresponding to the least values of COE.
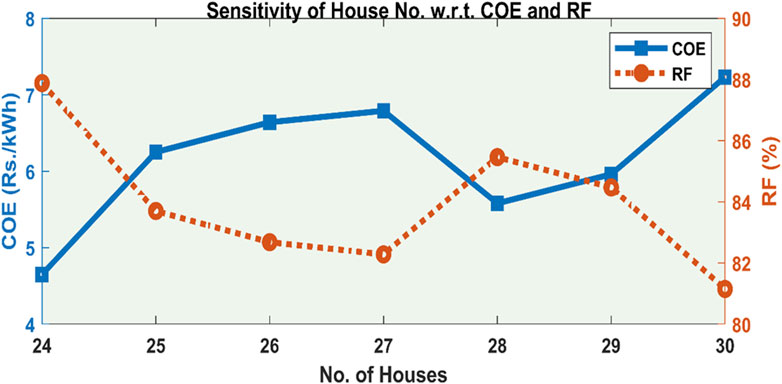
In addition, the sensitivity of COE/EP and RF of the proposed HRES has also been analyzed with the variation of the number of the houses as shown in Figure 13 and the sensitivity of the corresponding optimal sizes of DGs with respect to the house number variation has been also depicted graphically in Figure 14.
It can be noticed from the above Figure 13 that the COE/EP is lowest when the house number is low but increases as the number of houses to be supplied increases. The optimal combination of the system components provides the lowest electricity cost for the lower number of houses. The solar and battery sizes are comparatively proportional and the wind turbine sizing increases only when the other two sources sizing decreases as shown in Figure 14.
7.2.3 Power flow analysis for three consecutive days
Power flow analysis ensures the system stability, optimizing performance and maximization of RES penetration. In this study, the power flow analysis of the proposed system for three consecutive days has been carried out also to check the sustainability of the HRES in future. The graphical representation of the analysis has been shown in Figure 15.
From the above analysis, it can be observed that the grid power comes into the picture when the battery storage system is completely discharged and solar power is also not available for the fulfilment of the load demand. The RES is well satisfying the electrical demand during maximum hours of the day and importing power from the grid only for fewer hours which confirms the sustainability and reliability of the proposed analysis of the HRES.
Energy demand fulfillment with a social environment factor is considered as wise able alternative for rural electrification. HRES components produce the carbon pollutants, but the optimal system configuration reduces the emission. Socio development in terms of employment for local is statistically shown in Table 9. Furthermore, based on the power generated from the optimal system configuration
8 Conclusion
The main concern of this work is to establish a machine learning or AI-assisted HRES to cater for the local residential load for the locations which are blessed with an abundant supply of RES like solar and wind. So the overall analysis has been categorized into two sections. In the first section of the analysis, the hyperparametric tuned deep learning stacked model has been developed for the forecasting and prediction of the solar irradiance and wind speed using the 5 years of the recent dataset from the NREL. The proposed ML model has shown a prediction accuracy of 95.92% for GHI and 95.80 for the wind speed which shows that the predicted value can be utilized further for the calculation of the solar and wind power in advance.
The precise and accurate forecasting can help policymaker persons to invest in RES integrated infrastructure due to which the stability of the grid could be enhanced while balancing the demand and supply effectively. The government body can be assisted with these forecasting data to achieve the energy targets and have an idea of implementation of the renewable energy based projects. The policy structure can be supported with the incorporation of the forecasting models in designing of the energy strategies as per the region and available RES which will ensure a sustainable energy in future.
The second part incorporated these predicted values of the GHI and wind speed for the techno-economic analysis of the grid-connected HRES system which consists of PV, wind turbine and BSS. For this TEC analysis, a novel application of the RIME optimization has been incorporated whose objective is to minimize the COE w.r.t to the optimal size of the system components. The proposed optimization for TEC analysis shows that the COE comes to 4.65 Rs./kWh and TNPC 72.46 crore INR with an RF value of 87.88% as compared to the other three optimization methods GWO, MFO and PSO. THE optimal configuration of system components corresponding to the lowest COE are PV (76), WT (16) and BSS (80). The validation of the TEA has also been done with the HOMER. Further, the sensitivity analysis has been done to check the performance of the system where the initial impact of converter capacity on the COE and NPC has been analyzed and then the impact of different house numbers on the COE and the corresponding sizing of the system components checked. In addition to this, the power flow analysis for three consecutive days has been carried out for the daily operation performance of the system. These above efforts confirm that the proposed grid-connected HRES is efficient and can be implemented in areas or locations where grid power is unreliable.
The proposed HRES system can be reconfigured and optimized based on geographical conditions. A similar system has been adopted by Kumar et al. (2023), which includes hydro, solar, and extensive green land coverage such as forests and agricultural areas. Therefore, the proposed system may be suitable for various geographical locations and resource availabilities. Fundamentally, the potential for HRESs to be adapted to different geographical locations with varying renewable energy resources is significant. Ideally, a few key factors need to be considered for accelerated adaptation, including the availability of primary renewable resources, climatic and seasonal variations, energy storage, cost-effectiveness, and environmental and social impact.
Data availability statement
The original contributions presented in the study are included in the article/supplementary material, further inquiries can be directed to the corresponding authors.
Author contributions
MK: Conceptualization, Formal Analysis, Methodology, Resources, Software, Writing–original draft, Writing–review and editing. KN: Conceptualization, Formal Analysis, Methodology, Resources, Software, Writing–original draft, Writing–review and editing. AS: Conceptualization, Formal Analysis, Methodology, Resources, Software, Writing–original draft, Writing–review and editing. NK: Data curation, Formal Analysis, Methodology, Resources, Software, Writing–original draft, Writing–review and editing. AA: Conceptualization, Formal Analysis, Investigation, Methodology, Validation, Writing–original draft, Writing–review and editing. NAK: Formal Analysis, Investigation, Methodology, Resources, Validation, Visualization, Writing–review and editing. IH: Data curation, Formal Analysis, Funding acquisition, Methodology, Resources, Validation, Writing–review and editing.
Funding
The author(s) declare that financial support was received for the research, authorship, and/or publication of this article. This research was funded Norwegian University of Science and Technology, Norway. This research was also supported by the Automated Systems and Soft Computing Lab (ASSCL), Prince Sultan University, Riyadh, Saudi Arabia.
Acknowledgments
The authors would like to thank the Norwegian University of Science and Technology, Norway for paying the Article Processing Charges (APC) for this publication. The authors specially acknowledge the Automated Systems and Soft Computing Lab (ASSCL) at Prince Sultan University, Riyadh, Saudi Arabia. In addition, the authors wish to thank Prince Sultan University, Riyadh, Saudi Arabia, for their support.
Conflict of interest
The authors declare that the research was conducted in the absence of any commercial or financial relationships that could be construed as a potential conflict of interest.
Publisher’s note
All claims expressed in this article are solely those of the authors and do not necessarily represent those of their affiliated organizations, or those of the publisher, the editors and the reviewers. Any product that may be evaluated in this article, or claim that may be made by its manufacturer, is not guaranteed or endorsed by the publisher.
References
Abdelmalek, S., Azar, A. T., and Dib, D. (2018). A novel actuator fault-tolerant control strategy of DFIG-based wind turbines using Takagi-Sugeno Multiple models. Int. J. Control, Automation Syst. 16 (3), 1415–1424. doi:10.1007/s12555-017-0320-y
Alam, M. M., Tirth, V., Irshad, K., Algahtani, A., Al-Mughanam, T., Rashid, T., et al. (2024). An adaptive power management approach for hybrid PV-wind desalination plant using recurrent neural networks. Desalination 569, 117038. doi:10.1016/J.DESAL.2023.117038
Al Busaidi, A., Al Lamki, H., Alhinai, A., and Kazem, H. A., 2023 Techno Economic Design and Analysis of A Hybrid Renewable Energy System for Jazirat Al Halaniyat in Oman. Int. J. Renew. Energy Res. 13, 1039–1050. doi:10.20508/IJRER.V13I3.13679.G8778
Ammar, H. H., Azar, A. T., Shalaby, R., and Mahmoud, M. I. (2019). Metaheuristic optimization of fractional order incremental conductance (FO-INC) maximum power point tracking (MPPT). Complexity 2019, 1–13. doi:10.1155/2019/7687891
Cakiroglu, C., Demir, S., Hakan Ozdemir, M., Latif Aylak, B., Sariisik, G., and Abualigah, L. (2024). Data-driven interpretable ensemble learning methods for the prediction of wind turbine power incorporating SHAP analysis. Expert Syst. Appl. 237, 121464. doi:10.1016/J.ESWA.2023.121464
Caroprese, L., Pierantozzi, M., Lops, C., and Montelpare, S. (2024). DL2F: a deep learning model for the local forecasting of renewable sources. Comput. Ind. Eng. 187, 109785. doi:10.1016/J.CIE.2023.109785
El Bourakadi, D., Ramadan, H., Yahyaouy, A., and Boumhidi, J. (2023). A novel solar power prediction model based on stacked BiLSTM deep learning and improved extreme learning machine. Int. J. Inf. Technol. Singap. 15, 587–594. doi:10.1007/S41870-022-01118-1
Eren, Y., and Küçükdemiral, İ. (2024). A comprehensive review on deep learning approaches for short-term load forecasting. Renew. Sustain. Energy Rev. 189, 114031. doi:10.1016/J.RSER.2023.114031
Executive summary – Electricity Market Report – Update 2023 – Analysis (2023). Paris: IEA. Available at: https://www.iea.org/reports/electricity-market-report-update-2023/executive-summary (Accessed August 27, 2024).
Hermann, D. T., Franck Armel, T. K., René, T., and Donatien, N. (2022). Consideration of some optimization techniques to design a hybrid energy system for a building in Cameroon. Energy Built Environ. 3, 233–249. doi:10.1016/J.ENBENV.2021.01.007
Hochreiter, S., and Schmidhuber, J. (1997). Long short-term memory. Neural comput. 9, 1735–1780. doi:10.1162/NECO.1997.9.8.1735
Hou, Y., Wang, Q., and Tan, T. (2024). A robust stacking model for predicting oil and natural gas consumption in China. Energy Sources, Part B Econ. Plan. Policy 19. doi:10.1080/15567249.2023.2292235
Kadri, N., Ellouze, A., Ksantini, M., and Turki, S. H. (2023). New LSTM deep learning algorithm for driving behavior classification. Cybern. Syst. 54, 387–405. doi:10.1080/01969722.2022.2059133
Kamran, M., Asghar, R., Mudassar, M., Ahmed, S. R., Fazal, M. R., Abid, M. I., et al. (2018). Designing and optimization of stand-alone hybrid renewable energy system for rural areas of Punjab, Pakistan. Int. J. Renew. Energy Res. 8, 2385–2397. doi:10.20508/IJRER.V8I4.8696.G7539
Kanata, S., Baqaruzi, S., Muhtar, A., Prasetyawan, P., and Winata, T. (2021). Optimal planning of hybrid renewable energy system using HOMER in sebesi island, Indonesia. Int. J. Renew. Energy Res. 11, 1507–1516. doi:10.20508/IJRER.V11I4.12296.G8303
Kharrich, M., Mohammed, O. H., Alshammari, N., and Akherraz, M. (2021). Multi-objective optimization and the effect of the economic factors on the design of the microgrid hybrid system. Sustain Cities Soc. 65, 102646. doi:10.1016/J.SCS.2020.102646
Krishnan, N., Kumar, K. R., and Inda, C. S. (2023). How solar radiation forecasting impacts the utilization of solar energy: a critical review. J. Clean. Prod. 388, 135860. doi:10.1016/J.JCLEPRO.2023.135860
Kumar, N., Namrata, K., and Samadhiya, A. (2023). Techno socio-economic analysis and stratified assessment of hybrid renewable energy systems for electrification of rural community. Sustain. Energy Technol. Assessments 55, 102950. doi:10.1016/J.SETA.2022.102950
Ladide, S., EL Fathi, A., Bendaoud, M., Hihi, H., and Faitah, K. (2019). Flexible design and assessment of a stand-alone hybrid renewable energy system: a case study Marrakech, Morocco. Int. J. Renew. Energy Res. 9 (4), 2003–2022. doi:10.20508/ijrer.v9i4.9936.g7806
Lazzarini, R., Tianfield, H., and Charissis, V. (2023). A stacking ensemble of deep learning models for IoT intrusion detection. Knowl. Based Syst. 279, 110941. doi:10.1016/J.KNOSYS.2023.110941
Meghni, B., Dib, D., Azar, A. T., Ghoudelbourk, S., and Saadoun, A. (2017). Robust adaptive supervisory fractional order controller for optimal energy management in wind turbine with battery storage. Stud. Comput. Intell. 688, 165–202. doi:10.1007/978-3-319-50249-6_6
Meghni, B., Dib, D., Azar, A. T., and Saadoun, A. (2018). Effective supervisory controller to extend optimal energy management in hybrid wind turbine under energy and reliability constraints. Int. J. Dyn. Control 6 (1), 369–383. doi:10.1007/s40435-016-0296-0
Miao, P., and Yokota, H. (2024). Comparison of Markov chain and recurrent neural network in predicting bridge deterioration considering various factors. Struct. Infrastructure Eng. 20, 250–262. doi:10.1080/15732479.2022.2087691
Mohammadifar, A., Gholami, H., and Golzari, S. (2023). Stacking- and voting-based ensemble deep learning models (SEDL and VEDL) and active learning (AL) for mapping land subsidence. Environ. Sci. Pollut. Res. 30, 26580–26595. doi:10.1007/s11356-022-24065-7
Namdari, H., Haghighi, A., and Ashrafi, S. M. (2023). Short-term urban water demand forecasting; application of 1D convolutional neural network (1D CNN) in comparison with different deep learning schemes. Stoch. Environ. Res. Risk Assess., 1–16. doi:10.1007/s00477-023-02565-3
Oladigbolu, J. O., Mujeeb, A., Al-Turki, Y. A., and Rushdi, A. M. (2023). A novel doubly-green stand-alone electric vehicle charging station in Saudi Arabia: an overview and a comprehensive feasibility study. IEEE Access 11, 37283–37312. doi:10.1109/ACCESS.2023.3266436
Pandya, S., Jangir, P., and N. Trivedi, I. (2022). Multi-objective moth flame optimizer: a fundamental visions for wind power integrated optimal power flow with facts devices. Smart Sci. 10, 118–141. doi:10.1080/23080477.2021.1964693
Rhaman, M. M. (2013). Hybrid renewable energy system for sustainable future of Bangladesh. *International Journal of Renewable Energy Research* 3 (4), 777–780. doi:10.20508/ijrer.v3i4.836.g6204
Sawle, Y., Gupta, S. C., and Bohre, A. K. (2018). Socio-techno-economic design of hybrid renewable energy system using optimization techniques. Renew Energy 119, 459–472. doi:10.1016/J.RENENE.2017.11.058
Sheng, D., Yu, J., Tan, F., Tong, D., Yan, T., and Lv, J. (2023). Rock mass quality classification based on deep learning: a feasibility study for stacked autoencoders. Journal of Rock Mechanics and Geotechnical Engineering 15, 1749–1758. doi:10.1016/J.JRMGE.2022.08.006
Srilakshmi, K., Gaddameedhi, S., Borra, S. R., Balachandran, P. K., Reddy, G. P., Palanivelu, A., et al. (2023). Optimal design of solar/wind/battery and EV fed UPQC for power quality and power flow management using enhanced most valuable player algorithm. Front Energy Res 11, 1342085. doi:10.3389/fenrg.2023.1342085
Srilakshmi, K., Sundaragiri, D., Gaddameedhi, S., Vangalapudi, R., Balachandran, P. K., Colak, I., et al. (2024). Simulation of grid/standalone solar energy supplied reduced switch converter with optimal fuzzy logic controller using golden BallAlgorithm. Frontiers in Energy Research 12, 1370412. doi:10.3389/fenrg.2024.1370412
Su, H., Zhao, D., Heidari, A. A., Liu, L., Zhang, X., Mafarja, M., et al. (2023). RIME: a physics-based optimization. Neurocomputing 532, 183–214. doi:10.1016/J.NEUCOM.2023.02.010
Teng, Y., Chen, Y., Chen, X., Zuo, S., Li, X., Pan, Z., et al. (2024). Revealing the adulteration of sesame oil products by portable Raman spectrometer and 1D CNN vector regression: a comparative study with chemometrics and colorimetry. Food Chem 436, 137694. doi:10.1016/J.FOODCHEM.2023.137694
Tziolis, G., Lopez-Lorente, J., Baka, M. I., Koumis, A., Livera, A., Theocharides, S., et al. (2024). Direct short-term net load forecasting in renewable integrated microgrids using machine learning: a comparative assessment. Sustainable Energy, Grids and Networks 37, 101256. doi:10.1016/J.SEGAN.2023.101256
Xu, T., Xu, P., Yang, C., Li, Z., Wang, A., and Guo, W. (2024). An LSTM-stacked autoencoder multisource response prediction and constraint optimization for scaled expansion tubes. Appl Soft Comput. 153, 111285. doi:10.1016/J.ASOC.2024.111285
Keywords: deep learning, stacking, forecasting, optimization, cost of electricity (COE), total net present cost (TNPC)
Citation: Kumar M, Namrata K, Samadhiya A, Kumar N, Azar AT, Kamal NA and Hameed IA (2024) Multilevel stacked deep learning assisted techno-economic assessment of hybrid renewable energy system. Front. Energy Res. 12:1500190. doi: 10.3389/fenrg.2024.1500190
Received: 22 September 2024; Accepted: 24 October 2024;
Published: 14 November 2024.
Edited by:
Petru Adrian Cotfas, Transilvania University of Brașov, RomaniaReviewed by:
Devakirubakaran S., SRM Institute of Science and Technology, IndiaKoganti Srilakshmi, Sreenidhi Institute of Science and Technology, India
Copyright © 2024 Kumar, Namrata, Samadhiya, Kumar, Azar, Kamal and Hameed. This is an open-access article distributed under the terms of the Creative Commons Attribution License (CC BY). The use, distribution or reproduction in other forums is permitted, provided the original author(s) and the copyright owner(s) are credited and that the original publication in this journal is cited, in accordance with accepted academic practice. No use, distribution or reproduction is permitted which does not comply with these terms.
*Correspondence: Akshit Samadhiya, YWtzcGlubmFjbGUxQGdtYWlsLmNvbQ==; Kumari Namrata, bmFtcmF0YS5lZUBuaXRqc3IuYWMuaW4=; Ahmad Taher Azar, YWF6YXJAcHN1LmVkdS5zYQ==; Ibrahim A. Hameed, aWJpYkBudG51Lm5v; Nishant Kumar, a3JuaXNoYW50MTI1QGdtYWlsLmNvbQ==
 Mantosh Kumar
 Kumari Namrata
 Akshit Samadhiya
 Nishant Kumar
 Ahmad Taher Azar
 Nashwa Ahmed Kamal7
 Ibrahim A. Hameed