- 1State Grid Hubei Electric Power Company Electric Power Research Institute, Wuhan, Hubei, China
- 2Hubei Engineering and Technology Research Center for AC/DC Intelligent Distribution Network, School of Electrical Engineering and Automation, Wuhan University, Wuhan, China
- 3State Grid Hubei Electric Power Co., Ltd. Wuhan Power Supply Company, Wuhan, Hubei, China
Introduction: The key nodes of an intelligent distribution network significantly impact the reliability and stability of the distribution network’s operation. The failure of these key nodes can severely affect the safe operation of the distribution network. Therefore, vulnerability analysis of key nodes is particularly important.
Methods: This article proposes a comprehensive weighting method for evaluating indicators,combining the analytic hierarchy process (AHP) and entropy weighting method, while considering the structure and operational status of the power system grid. Key node structural evaluation indicators, such as node degree, node shrinkage centrality, and electric mediator, are established considering “significance” and “destructiveness.” State indicators are established based on the degree of impact of current, voltage, and load changes on the grid, as well as the uniformity of their distribution, including the improved current distribution entropy, voltage terre entropy, and three-phase state indicators of lost load. Subsequently, based on the AHP and entropy weighting method, a comprehensive weighting method is proposed to assign subjective and objective weights to the comprehensive evaluation indicators, obtaining the comprehensive weights of the indicators. Finally, the gray correlation degree is introduced to improve the ideal solution of the multi-objective decision making method, obtaining the criticality of the grid nodes and then identifying the critical nodes.
Results and Discussion: The example analysis presented in this article shows that the identified critical nodes of the power grid have a high degree of overlap with the identification results of different methods, can better identify edge nodes, and validate the effectiveness of the proposed evaluation indicators and key node identification methods.
1 Introduction
In recent years, frequent major power outages have had a negative impact on many aspects of society. Studies have shown that major blackouts are mostly chain reactions triggered by the failure of critical components. Therefore, accurately identifying critical links in the power grid can effectively ensure the safe operation of the power grid.
Since Petroianu et al. proposed grid vulnerability analysis in 1974 (Chen, 2004), research in this direction has been deepening and developing. At present, research on power system vulnerability mainly includes two aspects: vulnerability mechanism research and vulnerability assessment index research, in which the vulnerability mechanism research includes research on state vulnerability and structural vulnerability. This category of research provides the theoretical basis for the identification of key nodes of the power grid.
Chen et al. (2022a) establish node vulnerability assessment indexes through a Jacobi matrix, which is better adapted to the voltage stability calculation of large power grids to achieve the ranking of vulnerable nodes. Huang et al. (2012) establish a static energy function model for power supply branches by using a static energy function and constructing energy information vulnerability indexes to assess the vulnerability of power grid branches. The above studies are based on security analysis and assessment methods and construct different vulnerability indicators to identify the key links in the network from two research perspectives: steady state and transient.
Wang et al. (2010) use the accident chain model generated online, consider the operational risk of the intermediate links in the accident chain, establish the accident chain risk indicators and the risk indicator severity assessment function, identify the key links through the standard arithmetic system simulation, and verify the effectiveness of the proposed method. Wu (2017) define line importance based on network cohesion metrics using the change in network cohesion before and after line disconnection, which identifies critical lines in the power grid. Sun et al. (2024) use deep reinforcement learning to identify critical nodes in the power grid. However, the definition of critical nodes is based solely on a single structural indicator as the evaluation criterion. As a result, despite using a sophisticated algorithm, the identification of critical nodes remains somewhat vague and inaccurate. Chen et al. (2021a) do not use complex network theory; instead, they adopt a vulnerability assessment of power grid nodes based on electrical centrality indicators. This approach has certain limitations.
Xia et al. (2014) define the power system as a vulnerable system based on risk theory, integrating the effects of various uncertain factors. They also combine a static energy function to establish a static energy function model for the power supply branches and construct an energy information vulnerability index to assess the vulnerability of the grid branches. Chen et al. (2021b) suggest that using centrality indicators of general complex networks for power grid vulnerability assessment may result in a “shovel effect.” Therefore, this article redefines the centrality indicators based on electrical parameters to better assess vulnerability. Sun et al. (2020) propose selecting important evaluation indicators for key nodes in the power grid and establish a directed weighted network model for the power system. They then use PSNodeRank values to assess the vulnerability of nodes and specifically describe the importance of each node. Fu et al. (2017) combine several indicators, such as degree, betweenness, cohesion, and closeness, and apply the entropy method and analytic hierarchy process (AHP) to assign weights for describing the vulnerability of nodes. Tan et al. (2006) propose the node contraction method to assess network node importance based on network cohesion, which has the advantage of fast computing speed.
Because any single assessment index has a certain degree of inadequacy, most researchers have chosen multiple indexes to assess the critical links of the network. Wu et al. (2016) select the structural centrality assessment index, cohesion assessment index, and the method based on D-S evidence theory to comprehensively assess the node importance in the network. Wu et al. (2017) select four indicators of degree, median, cohesion, and tightness; verify the validity of the indicators; and rank the distribution network node fragility based on the multi-objective decision-making method. In order to characterize the electrical characteristics of the network to a certain extent on the basis of topology, Xie et al. (2009) characterize the importance of grid nodes using the cohesion degree of the network with weights based on the right network model and verify the model validity through transient simulation. Shi et al. (2018) propose an evaluation system for the vulnerability of distribution networks based on complex network theory and risk theory. The weights of the system were obtained through the analytic hierarchy process (AHP) and were then used to derive comprehensive evaluation indicators for the nodes and lines. The method proposed by Xu et al. (2016) evaluates key components by improving complex network theory and incorporating factors from the operation of power systems, such as the actual transmitted power and transmission capacity of lines. This approach enhances the ability to identify vulnerable critical components to some extent.
In summary, the study of grid vulnerability based on complex network theory initially identifies the vulnerable links from the structural point of view. The consideration of the electrical characteristics of the grid in the assessment of grid structural vulnerability is the focus of the study. However, grid vulnerability is not only related to the topology of the grid but also to the operating state of the grid. Identifying key links in the grid, taking into account the network structure and the operating state, is the trend of the current study. The establishment of scientific and comprehensive assessment indexes and reasonable assignment of multiple indicators, as well as the establishment of a reasonable and accurate identification model of key links in the grid, are also the focus of the study.
Table 1 shows the advantages and disadvantages of using complex network theory for node vulnerability research. Clearly, with the powerful computational capabilities of modern computers, using complex network theory that considers multiple factors for key node analysis is superior. The establishment of scientific comprehensive assessment indicators, the reasonable assignment of multiple indicators, and the establishment of a reasonable and accurate identification model of critical links in the power grid are also the focus of the research. Comprehensive assessment indexes taking into account the topology and operation state are established based on the consideration of the grid structure and further considering the operation state of the grid. Then, the hierarchical-entropy weighting method is adopted to reasonably assign weights to the comprehensive assessment indexes to obtain the comprehensive weights. Finally, the proposed assessment indexes, the proposed assessment indexes, and the proposed assessment indicators based on the improved multi-objective decision-making technique for order preference by similarity to ideal solution (TOPSIS) method to identify the key nodes of the grid are analyzed and verified using the simulation results of the standard example. The analysis verifies the effectiveness of the proposed assessment indexes and methods.
2 Indicators for the assessment of critical nodes of the grid
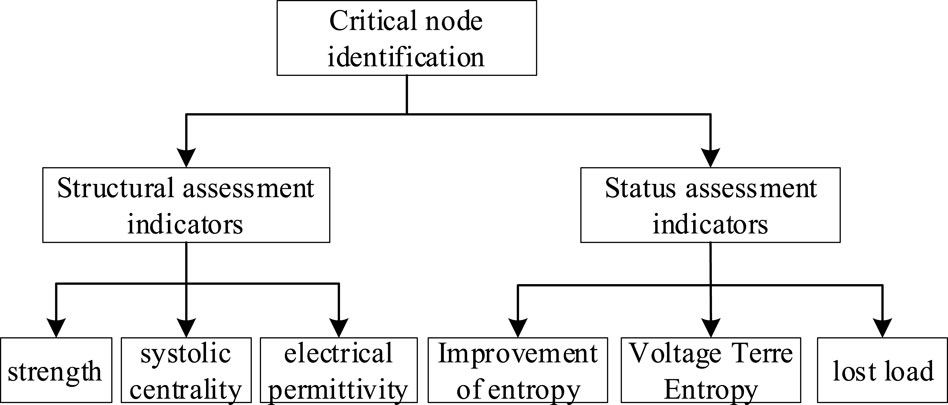
Many assessment indicators have been proposed for the identification of critical nodes in power grids, which are mainly divided into two main categories: one is the structural indicators based on the theory of complex networks, and the other is the node state indicators based on the analysis of traditional methods. It is not sufficiently scientific to use a single indicator to identify the key nodes of the power grid, so a comprehensive assessment indicator system is established by taking into account the topology and operation status of the network.
For the structural indicators, in order to make the selected indicators both reasonably represent the power grid and not too redundant, three assessment indicators, namely, node degree, contraction centrality, and electrical mediator, are selected. The three indicators take into account the two core ideas of assessing key nodes in complex networks: “importance equals significance” and “importance equals destructiveness” (Chen CY. et al., 2022). In addition, the network structure based on the electrical characteristics is considered. Three assessment indicators, namely, the entropy of improved current distribution, the voltage terre entropy, and the amount of lost load, are selected as indicators of grid operation status by considering the change of system current, the change of voltage, and the load-shedding phenomenon that may be caused by the nodes after they are out of operation.
In summary, to consider the comprehensiveness and reasonableness of the assessment indexes, this article selects six indexes, namely, node degree, contraction centrality, electrical dielectric number, improved tidal current distribution entropy, voltage terre entropy, and loss of load, to assess the key nodes of the power grid.
2.1 Indicators for assessing the structure of key nodes
2.1.1 Nodal degree
The nodes in a power grid maintain a certain level of correlation, and the degree expresses the ability of a node to establish an intuitive connection with its set of neighboring nodes. The greater the degree, the stronger the correlation between nodes and the more critical they are in the system. Its expression is shown in Equation 1:
where
2.1.2 Node contraction centrality
The node contraction centrality metric measures the criticality of a node by comparing the network cohesion obtained after the contraction of different nodes. The node shrinkage diagram is shown in Figure 1.
Network cohesion is defined in Equation 2:
where
Node contraction centrality takes into account the impact of the number of neighboring nodes and its own position on the node’s criticality. The larger the node contraction centrality, the more important the node is, indicating that the node is in a “stronghold position” and the better the network connectivity. The contraction centrality is defined in Equation 3:
where
2.1.3 Electrical permittivity
In the power grid, there is power transmission between nodes, and the node’s mediator reflects the node’s impact on information flow and dynamic transmission. The larger the value, the stronger the node’s “pivotal position” in the entire network and the more critical the node. Based on the concept of node dielectric number, to a certain extent, taking into account the electrical characteristics of the network, the electrical dielectric number expression is determined by Equation 4:
where
2.2 Critical node status assessment indicators
2.2.1 Improvement of entropy of tidal current distribution
The withdrawal of nodes from operation results in uneven distribution of line currents, which can easily lead to chain failures. The traditional current distribution entropy index only evaluates the unevenness of current redistribution but does not consider the heterogeneity of each line’s ability to carry current impact and cannot reflect the risk of line overload. For this reason, this article adopts the improved current distribution entropy index.
Assume that the true current of line l is
where
The line load factor is divided into n reasonable zones, and a constant sequence
where
The greater the entropy of the improved current distribution, the more uneven the redistribution of line currents, the lower the level of grid security, and the more vulnerable the network nodes become.
2.2.2 Voltage terre entropy
Terre entropy is an indicator proposed by Tel to reflect income differences between regions. The Tel entropy
where k is the number of classified objects in the system; N is the total number of classified objects;
Considering the global variation, the improved Terrell entropy metric is Equation 8
where
Based on the definition of terre entropy, the power network containing N nodes is partitioned according to the type of nodes, with PQ nodes as zone 1 and PV nodes and balancing nodes as zone 2.
Node i increases the unit load to get the amount of voltage change that triggers node j, which in turn gives the amount of node voltage change in the global network as Equation 9:
where
Combining Equations 7–9 gives the voltage terre entropy
2.2.3 Node loss of load
Based on the differences in the degree of reliability required, power system loads are divided into three categories: primary, secondary, and tertiary loads. A social impact factor is introduced to account for load differences. The magnitude of the load impact factor is aligned with the degree of impact on society. Based on this, the amount of nodal load loss is defined as shown in Equation 11:
where
This article defines the social impact quotients of primary, secondary, and tertiary loads as 2, 1.5, and 1.2, respectively, and divides the load classes according to the amount of loads, with
After a system failure, the general self-adjustment capability of the system will restore the system operation to a safe state. If the adjustment is still not satisfied, the safe operation state of the system is generally ensured by load cutting. The amount of load cutting is solved based on the DC model according to Equation 12.
where
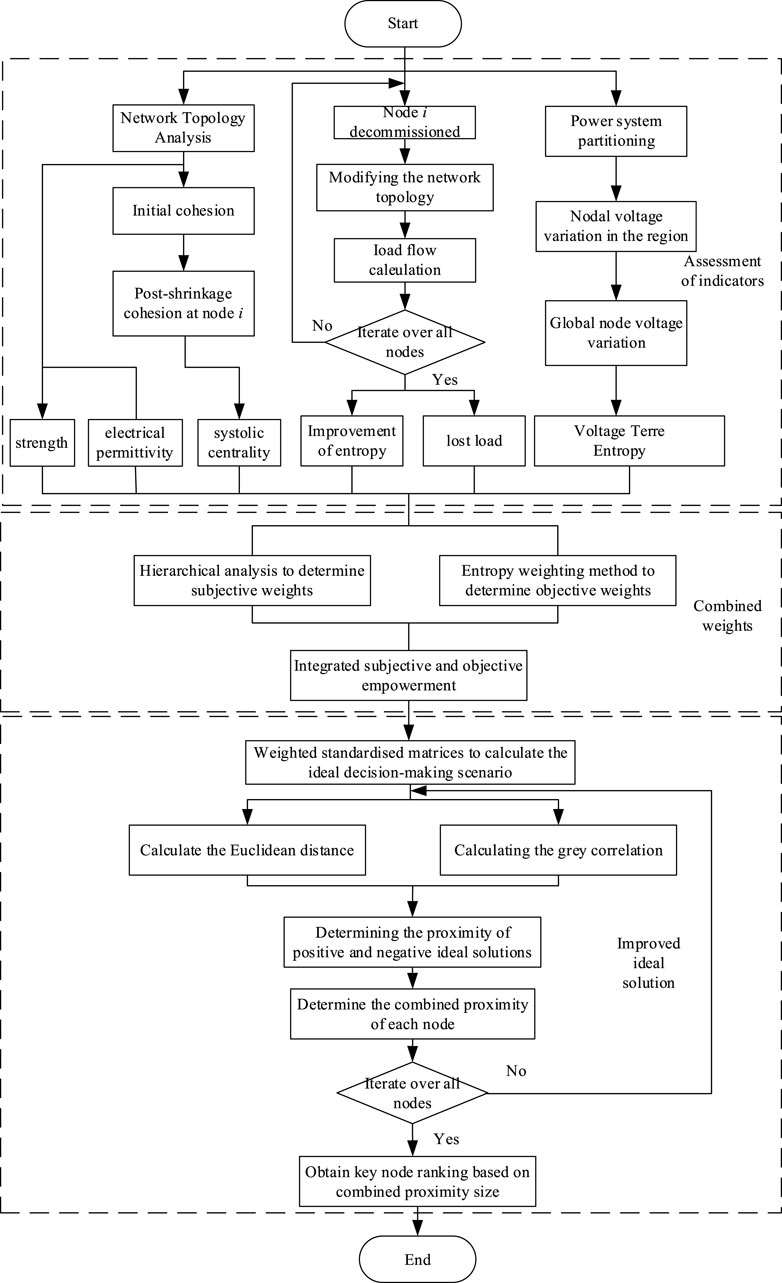
3 Methods for identifying critical nodes of the grid taking into account structure and state
3.1 Hierarchical analysis
The hierarchical analysis method (AHP) is used to obtain the subjective weights of the experts, and the multilevel structural model is established to calculate the importance of each decision object by taking into account the representational attributes of the decision object as well as the affiliation relationship. The specific process is as follows:
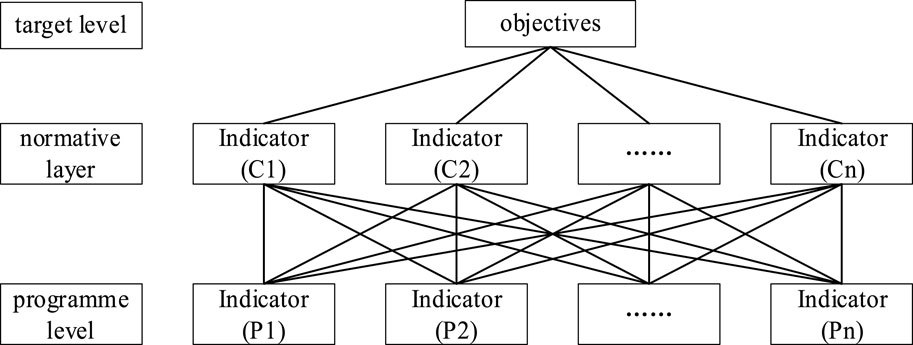
(a) Establish a progressive hierarchy of networks. As shown in Figure 2.
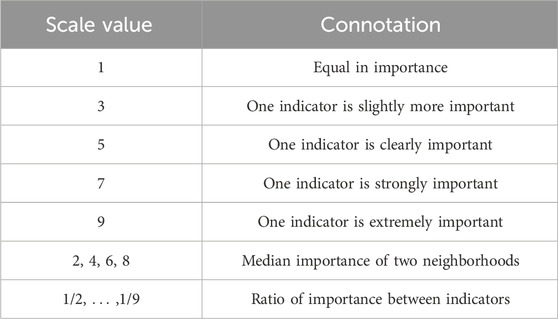
(b) Construct a two-by-two comparison matrix of decision objects based on a nine-level scale, as shown in Table 2. The decision matrix A is obtained as shown in Equation 13:
where
(c) Calculate the weights of the indicators
where n is the number of assessment indicators selected.
(d) Consistency calibration and adjustment of the decision matrix based on the calibration results. The above matrix is shown in Equation 15:
where CI is the general consistency index of the decision matrix;
If
The hierarchical analysis method (AHP) is a subjective assessment method that evaluates weights based primarily on expert experience. Its advantage is that it reduces computational complexity and the need for data information; its disadvantage is that it relies on subjective choices and is prone to biased results due to errors in subjective judgment, which has certain limitations.
3.2 Entropy weight method
The entropy weight method for solving objective weights relies mainly on the information in the indicator data itself. Its principle is that the smaller the degree of variability of the data, the smaller the information content presented and the lower the corresponding weight of the indicator. The specific calculation steps are as follows:
(a) Create an initial evaluation data matrix as shown in Equation 16:
where m is the number of grid nodes, n is the number of evaluation metrics, and
(b) As shown in Equation 17. The indicators are normalized to give a normalization matrix
where
(c) The system of equations shown as Equation 18 was used to calculate the weights of the indicators.
where
The entropy weighting method is an objective assessment method with the advantage of being weighted based on objective data and free from the interference of subjective factors. However, if the deviation of the initial sample data is large, the weights may not match the actual significance, thus affecting the effectiveness of the evaluation.
3.3 Integrated empowerment
The assessment should respect the subjective opinion of the experts and take into account the objective data information. Therefore, this article adopts the combination of subjective weights and objective weights to obtain the comprehensive weight
where
The TOPSIS method, also known as the ideal point method or the superior–inferior solution distance method, is a ranking method for multi-objective decision making. This method constructs the optimal solution and the worst solution of the evaluation object, and by calculating the distance measure of the set of decision solutions close to the optimal solution and the worst solution, the set of decision solutions is ranked, and then the optimal decision solution is obtained. Although the method is based on the evaluation data itself, the power network information data is still a “small sample,” so the introduction of a gray correlation index is an effective complement. Therefore, the ideal solution method is adopted to determine the multi-objective decision ranking of the criticality of the nodes in the power grid by introducing the gray correlation and combining it with the comprehensive weighting value obtained. The specific steps are as follows:
(a) The initial decision matrix X is constructed from m grid nodes and n evaluation indicators. As shown in Equations 20–22.
where
(b) Calculate the Euclidean distance from the set of decision options to
(c) Calculation of the gray correlation coefficient between the set of decision options and the ideal option. The calculation is shown in Equation 24.
where
(d) Calculation of the set of decision options with positive and negative scenarios in shades of gray. The calculation is shown in Equation 25.
(e) Joint Euclidean distance and gray scale to get the closeness distance. The closeness distance is shown in Equation 26.
where
(f) Calculate the relative closeness of the programs is shown in Equation 27.
The larger
The proposed comprehensive empowerment method effectively combines the advantages of two approaches, enhancing the comprehensiveness and accuracy of the method. The key node analysis based on the complex theory presented in this article not only improves the objectivity and rationality of the decision-making results but also strengthens the simplification of the complex problem, making the decision-making process more transparent and interpretable.
4 Example analysis
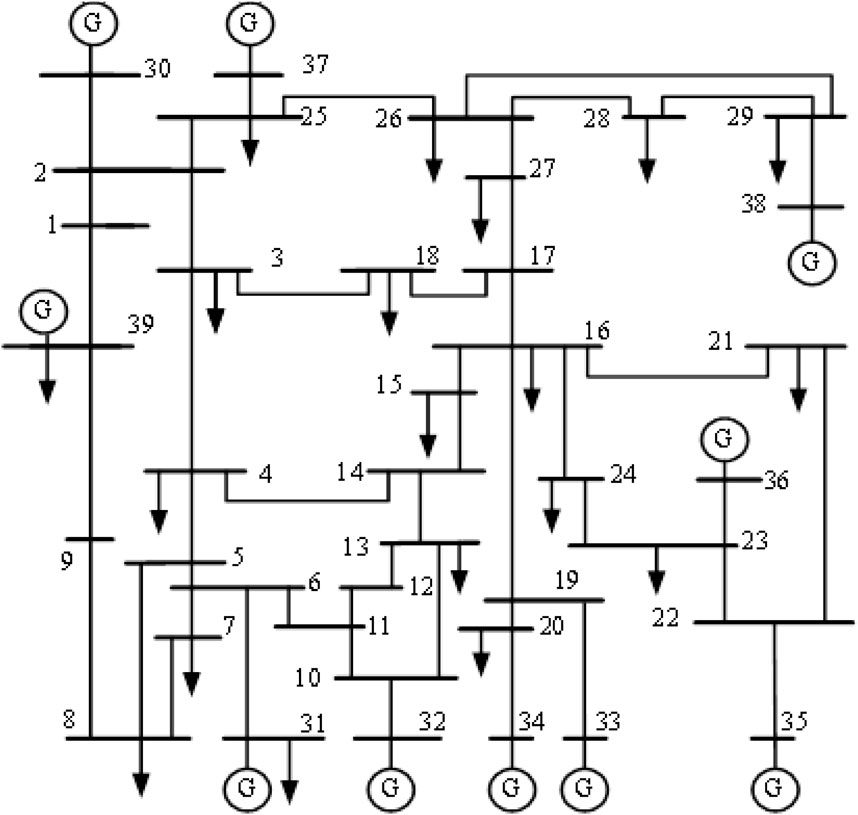
A standard IEEE39 node system is used as an example of the arithmetic, and the topology of this node system is shown in Figure 4. The system contains 39 nodes (21 load nodes of different degrees), 46 branches, and a total load of 6254.23 MW.
4.1 Determination of indicator weights
4.1.1 AHP determines subjective weights
When determining subjective weights in the hierarchical analysis method, a hierarchical structure is established, as shown in Figure 5.
The main aspects to be considered are
a) Topology indicators and operational state indicators identify the key nodes of the grid from two perspectives. Based on the model in Chapter 2, the structure indicators take into account the structure of the network and, to some extent, the electrical characteristics, and the state indicators take into account the changes in tidal currents, voltages, and loads after the nodes have been taken out of operation. These two indicators complement each other and are considered to be of equal importance.
b) Among the topology indicators, node degree only characterizes the local characteristics of the node; node contraction centrality can characterize the global information characteristics of the network, reflecting the connectivity change of the network topology after the node is out of operation. The electrical median reflects the influence of the node on the flow of information and the dynamic transmission of the node, reflecting the pivotal role of the node and taking into account some of the electrical characteristics. Therefore, the electrical median is the most important, the contraction centrality is the next most important, and the degree of importance is the smallest.
c) Among the operation state indicators, the improved trend distribution entropy and voltage Terrell entropy are two indicators that comprehensively consider the change of power trend and voltage change after the node is out of operation. They both have the same degree of importance; the loss of load indicator reflects the load cutting caused by topology and trend change after the node is out of operation, and its degree of importance is greater than that of the first two indicators.
Based on the above considerations, the judgment matrix of each indicator is derived as shown in Table 4.
Based on the judgment matrix in the above table, the weighting coefficients for each indicator layer were obtained as shown in Table 5:
According to the obtained weight coefficients of the indicator layers and then determining the scale value of each indicator, further calculations can be obtained from the weight of each indicator layer as shown in Table 6:
4.1.2 Entropy weighting method to determine objective weights
The assessment indicators were normalized, and the results are shown in Figure 6.
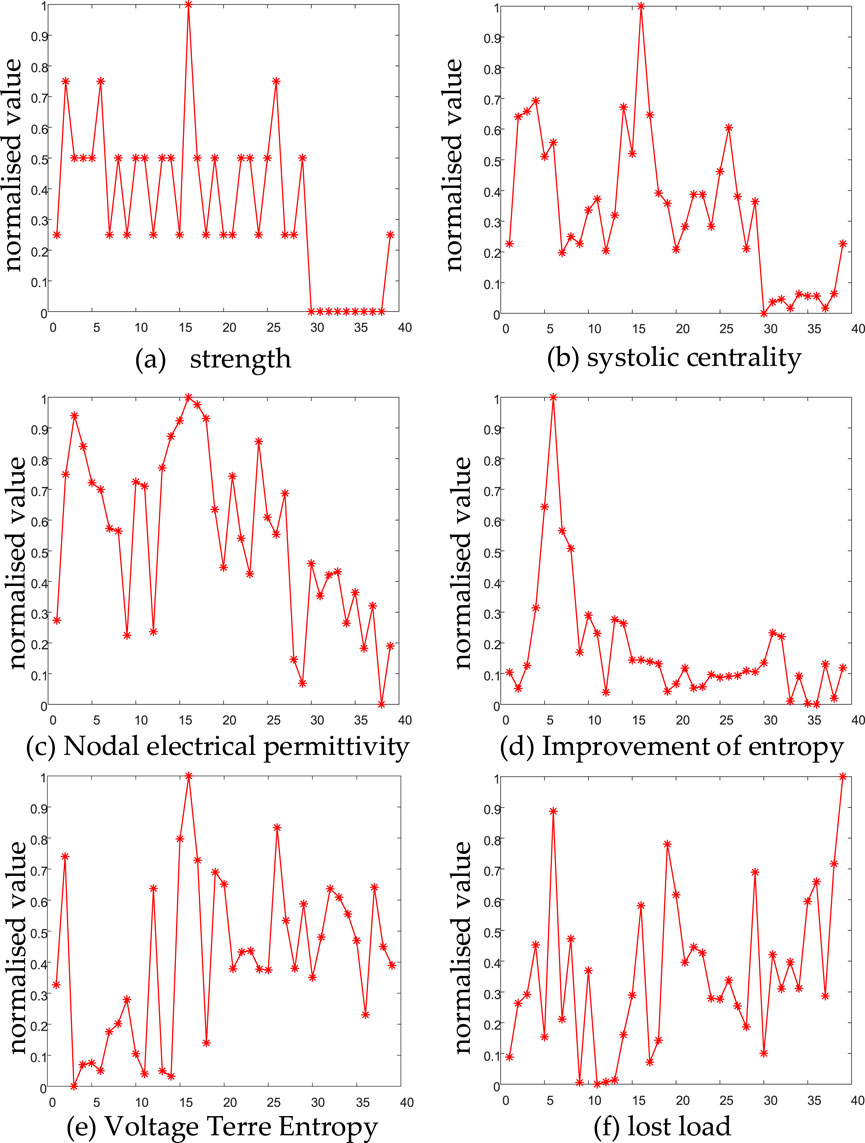
Figure 6. Indicator normalized data. (A) strength. (B) Systolic centrality. (C) Nodal electrical permittivity. (D) Improvement of entropy. (E) Voltage terre entropy. (F) lost load.
The weights of degree, contraction centrality, nodal electrical dielectrics, entropy of improved tidal current distribution, voltage terre entropy, and loss of load are obtained according to the entropy weight method, as shown in Table 7.
4.1.3 Combined weights
Finally, the combined weights of the indicators are assigned according to Equation 19, and the combined weights of degree, contraction centrality, electrical dielectric number, entropy of the improved tidal current distribution, voltage terre entropy, and loss of load are found to be 0.0650, 0.1470, 0.2260, 0.1608, 0.0849, and 0.3163, respectively.
4.2 Key node identification results
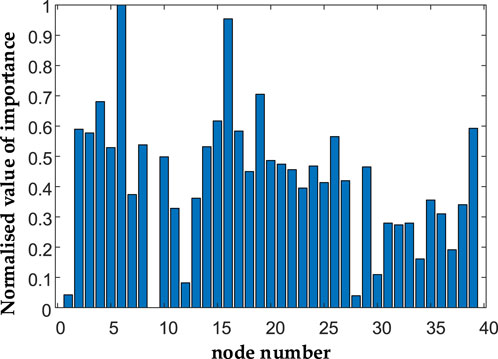
After determining the weights of each indicator, the key nodes of the standard IEEE39 node system are identified and obtained according to the improved TOPSIS method model, as shown in Figure 7.
As can be seen from Figure 7, the degree value of high criticality grid nodes is significantly higher than that of other nodes, and there is a good differentiation between the nodes, which demonstrates that the proposed method can effectively identify the critical nodes of the grid.
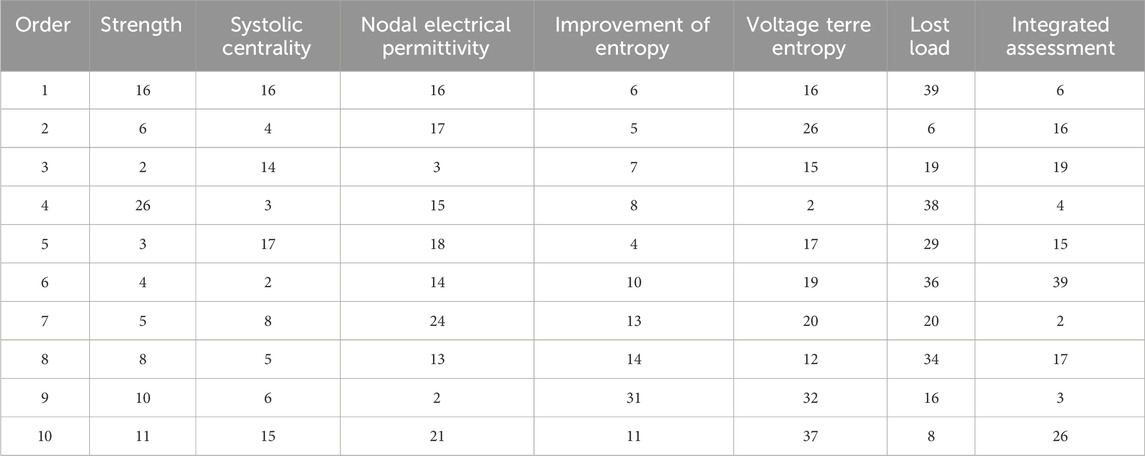
The effectiveness of the method is further analyzed by comparing the top 10 nodes identified by a single metric with a comprehensive metric, as shown in Table 8.
The top 10 grid-critical nodes identified using the method of this article are compared with each of the three methods to further demonstrate the effectiveness of the method proposed in this article. The comparison results are shown in Table 8:
Method 1: Identification of grid-critical nodes using the AHP-gray correlation method (Xu et al., 2010).
Method 2: Establishing an importance evaluation matrix to assess node importance (Sun et al., 2021).
Method 3: Considering the change of current after grid faults and constructing a current entropy index to identify critical nodes (Wang et al., 2016).
As can be seen from Table 9:
(1) The top 10 key nodes of the power grid identified by using this article’s method are the same as six of Methods 1 and 2, which have good consistency and illustrate the effectiveness of this article’s method.
(2) There is also dissimilarity between different methods because the identification indexes and models selected by various methods are not the same, and the focus on the grid is not exactly the same. The key nodes of the grid identified by Methods 1 and 2 are concentrated in the range of the interval of 3–15, which are mostly located in the middle of the connectivity region and cannot identify the edge nodes of the grid well. For example, node 39 is connected to generators with great generating capacity, making it an extremely important active power source. If this node were removed due to a fault, it would cause a great loss of important loads to the system, which would seriously affect the safe operation of the system. Therefore, the node has a high degree of criticality.
(3) There are only two identical nodes between this article’s method and Method 3. The reason is that Method 3 only assesses the criticality of nodes from the perspective of the network state, completely ignoring the inherent structural attributes of the grid and selecting a single assessment index. For example, Method 3 fails to identify key nodes occupying an important position. This outcome also indicates that not taking the complementarity of the indexes into account may result in a large discrepancy in the identification results.
In summary, the method in this article comprehensively considers structural static indicators, dynamic indicators, and multi-angle grid operation state indicators to better measure the criticality of each node, and the identified key nodes of the grid are more reasonable.
5 Conclusion
In this article, the structure and operation state of the power grid are considered comprehensively. Comprehensive assessment indexes of key nodes in the power grid are established, taking into account the topology and operation state of the power grid and avoiding the one-sidedness of a single assessment index. Then, the hierarchical-entropy weight method is used to jointly assign weights to the comprehensive assessment indexes so as to make the weight distribution more reasonable and then obtain the comprehensive weights. Finally, gray correlation is introduced to improve the TOPSIS method to identify key nodes in the power grid, and simulation analysis and comparison are carried out. The TOPSIS method is used to identify the key nodes in the power grid and carry out simulation analysis and comparison. The main conclusions are as follows:
(1) The grid structure index combines the local and global attributes of the nodes and takes into account the “significance,” “destructiveness,” and some degree of electrical characteristics of the nodes; the state index takes into account the current and voltage redistribution and the degree of equilibrium after the fault. At the same time, the self-regulation ability of the grid is considered, which makes the assessment index more scientific and reasonable.
(2) There is a difference between the key nodes identified by a single assessment index and those identified by comprehensive indexes. For example, some nodes have a large value of structural indexes but a small value of state indexes, so a comprehensive index evaluation system should be established when identifying the key links of the power grid.
(3) The simulation results show that the identified key nodes of the power grid have a high degree of overlap with the identification results of different methods and can better identify the edge nodes, which verifies the reasonableness and effectiveness of the proposed indicators and methods.
In summary, the key node identification method based on the complex theory proposed demonstrates excellent applicability. It takes into account both the structural and operational influences in the key node identification indicators and employs a more reasonable comprehensive assignment method, which not only enhances the rationality of the decision-making results but also achieves an optimal simplification of the entire complex problem. Future research directions could pursue a more comprehensive establishment of the key node identification indicator system derived from both structure and operation. Additionally, more advanced solution methods should be proposed for solving the complex problem of key node identification, making the indicator and method systems more robust and refined, thereby enabling the identification of key nodes to be more rational and efficient.
Data availability statement
The original contributions presented in the study are included in the article/supplementary material; further inquiries can be directed to the corresponding author.
Author contributions
ZY: methodology, project administration, funding acquisition, writing–review and editing, resources, and supervision. HM: formal analysis, methodology, validation, visualization, and writing–review and editing. JZ: conceptualization, data curation, formal analysis, and writing–original draft. XD: methodology, writing–review and editing, supervision, and visualization. FY: writing–review and editing, investigation, methodology, and supervision. CW: investigation, validation, and writing–original draft. NZ: data curation, formal analysis, and writing–original draft.
Funding
The author(s) declare financial support was received for the research, authorship, and/or publication of this article. This work is supported by State Grid Hubei Electric Power Co., Ltd. (Project Number: 521532220008).
Conflict of interest
Authors ZY, HM, and FY were employed by State Grid Hubei Electric Power Company Electric Power Research Institute. Author NZ was employed by State Grid Hubei Electric Power Co., Ltd. Wuhan Power Supply Company.
The remaining authors declare that the research was conducted in the absence of any commercial or financial relationships that could be construed as a potential conflict of interest.
The authors declare that this study received funding from State Grid Hubei Electric Power Co., Ltd. The funder had the following involvement in the study: The organization has proposed the title of this article and provided the initial data for the example verification in the paper.
Publisher’s note
All claims expressed in this article are solely those of the authors and do not necessarily represent those of their affiliated organizations, or those of the publisher, the editors, and the reviewers. Any product that may be evaluated in this article, or claim that may be made by its manufacturer, is not guaranteed or endorsed by the publisher.
References
Chen, B., Chen, Q. Y., Zhen, F. Y., Gui, R., Luo, Q., and Li, J. Y. (2022a). A static voltage safety domain assessment method for AC/DC power systems based on voltage sensitivity[J]. Intell. Power 50 (06), 28–34. doi:10.3969/j.issn.1673-7598.2022.06.006
Chen, C. Y., Zhou, Y., Chi, M., and Wang, B. H. (2022b). A review of large grid vulnerability research based on complex network theory [J]. Control Decis. 37 (04), 782–798. doi:10.13195/j.kzyjc.2021.0126
Chen, D. S. (2004). A preliminary investigation on the security protection technology of large power grids [J]. Power Grid Technol. 28 (9), 14–17, 27.
Chen, S. N., Liang, S., Li, S., Zhou, Y., and Yu, X. (2021a). Grid vulnerability assessment based on electrical centrality index[J]. Power Supply 38 (08), 70–76. doi:10.19421/j.cnki.1006-6357.2021.08.010
Chen, S. N., Liang, S., Li, S., Zhou, Y. J., and Yu, X. Y. (2021b). Grid vulnerability assessment based on electrical centrality index[J]. Power Supply 38 (08), 70–76. doi:10.19421/j.cnki.1006-6357.2021.08.010
Fu, J., Zou, Y. L., and Xie, R. (2017). Identification of critical lines in power networks based on complex network theory [J]. Complex Syst. Complex. Sci. 14 (03), 91–96. doi:10.13306/j.1672-3813.2017.03.009
Huang, Z. M., Li, H. Q., Du, T., and Lin, M. J. (2012). Fragile branch evaluation based on branch energy function [J]. Power Syst. Prot. Control 40 (15), 7–11, 115. doi:10.3969/j.issn.1674-3415.2012.15.002
Shi, W. C., Li, X. M., Wang, X. L., Sun, S. X., Zhou, Y. X., and Hao, C. C. (2018). Vulnerability assessment method for distribution networks[J]. J. Power Syst. Automation 30 (12), 125–131.
Sun, K., Cao, Y., Chen, T. Y., Ge, L. J., Ge, X. J., and Zhu, X. Z. (2021). A tidal current meshing analysis method for large grid vulnerability assessment [J]. Power capacitors React. power Compens. 42 (01), 101–107. doi:10.14044/j.1674-1757.pcrpc.2021.01.017
Sun, Z. H., Chang, X. F., Wang, F. F., and Yang, K. Y. (2024). Deep reinforcement learning-based identification of critical nodes in power grids[J]. Electron. Des. Eng. 32 (15), 166–171. doi:10.14022/j.issn1674-6236.2024.15.035
Sun, Z.Y., Liang, S. Y., and Fu, Y. B. (2020). A critical node identification method for power system based on PSNodeRank algorithm[J]. J. Power Sci. Technol. 35 (02), 157–162. doi:10.19781/j.issn.1673-9140.2020.02.021
Tan, Y. J., Wu, J., and Deng, H. Z. (2006). A node shrinkage method for node importance assessment in complex networks [J]. Syst. Eng. Theory Pract. (11), 79–83, 102. doi:10.3321/j.issn:1000-6788.2006.11.011
Wang, A. S., Luo, Y., Xu, G. Y., and Liu, P. (2010). Online assessment method of transmission vulnerability based on accident chain risk index [J]. Chin. J. Electr. Eng. 30 (25), 44–50.
Wang, T., Yue, X. L., Gu, X. P., Zhang, S., and Zhao, B. P. (2016). Identification of critical nodes in power grids based on singular value entropy and tidal distribution entropy [J]. Power Autom. Equip. 36 (04), 46–53. doi:10.16081/j.issn.1006-6047.2016.04.008
Wu, H. (2017). Vulnerability assessment of distribution networks based on complex network theory[D]. Hunan University.
Wu, G., Fang, L., and Li, Z. (2016). Importance assessment of complex network nodes based on multi-metric synthesis [J]. Comput. Eng. Des. 37 (12), 3146–3150. doi:10.16208/j.issn1000-7024.2016.12.002
Wu, H., Peng, M. F., Zhang, H. Y., Zhu, L., Che, W. H., and Liu, Z. Y. (2017). Vulnerability assessment of distribution network nodes based on complex network theory. Complex Syst. Complex. Sci. 14 (01), 38–45. doi:10.13306/j.1672-3813.2017.01.006
Xia, L. Y., Xiao, K. X., and Liu, E. H. (2014). Vulnerability assessment of power system based on complex network and risk theory[J]. Electron. World (09), 46–47+146.
Xie, Q. Y., Deng, C. H., Zhao, H. S., and Wen, Y. X. (2009). Power network node importance assessment based on the entitled network model [J]. Power Syst. Autom. 33 (04), 21–24. doi:10.3321/j.issn:1000-1026.2009.04.005
Xu, J. Y., Chen, C., Luo, C. J., Chen, X., Xiong, W., and Lin, X. N. (2016). Identification of critical links in power grid based on improved complex network model[J]. Power Syst. Autom. 40 (10), 53–61. doi:10.7500/AEPS20150824006
Keywords: comprehensive weights, key nodes, improved TOPSIS method, AHP, comprehensive evaluation indexes
Citation: Yang Z, Min H, Zhao J, Dong X, Yang F, Wang C and Zhang N (2025) Vulnerability analysis of power grid structure based on complex network theory. Front. Energy Res. 12:1498678. doi: 10.3389/fenrg.2024.1498678
Received: 19 September 2024; Accepted: 26 November 2024;
Published: 03 January 2025.
Edited by:
Feng Liu, Nanjing Tech University, ChinaReviewed by:
Cong Zhang, Hunan University, ChinaYe Cai, Changsha University of Science and Technology, China
Copyright © 2025 Yang, Min, Zhao, Dong, Yang, Wang and Zhang. This is an open-access article distributed under the terms of the Creative Commons Attribution License (CC BY). The use, distribution or reproduction in other forums is permitted, provided the original author(s) and the copyright owner(s) are credited and that the original publication in this journal is cited, in accordance with accepted academic practice. No use, distribution or reproduction is permitted which does not comply with these terms.
*Correspondence: Jie Zhao, amllel93aHVAd2h1LmVkdS5jbg==
 Zhichun Yang1
 Jie Zhao
 Chenhao Wang

