 Anna-Lena Lane
 Andreas Selhammer
 Patrik Thollander1,3
 Mathias Cehlin
- 1Department of Building, Energy and Environmental Engineering, University of Gävle, Gävle, Sweden
- 2RISE Research Institutes of Sweden, Gothenburg, Sweden
- 3Department of Management and Engineering, Division of Energy Systems, Linköping University, Linköping, Sweden
Energy efficiency has been identified as a way of addressing the need to reduce climate impact from fossil fuels. Furthermore, the ongoing twin transition may provide better and more energy-efficient control of buildings with systems such as building management systems (BMS). However, there appear to be barriers to investments in functional digital tools, as there are for other energy-efficient technologies for buildings. This paper is based on a questionnaire study with technology providers, decision makers and users of building management systems. The questionnaire included questions regarding barriers, drivers, and motivations for investments in BMS. Improved energy efficiency was found to be an important motivation for investments in BMS for users and decision makers, but the technology providers elevated more easy work as important. The main driver for investments in BMS was related to reduced energy costs, while for the decision makers, financial barriers such as risks and hidden cost were ranked highest. An important knowledge barrier was found as knowledge is needed for decisions about investments, use of BMS and decisions regarding IT security, such as handling of data. A key conclusion is the need for a facilitator, as knowledge is needed for decisions about BMS investments and for its use. On a broader scale, the paper argues for the need to include facilitators as a core part of future policies within the twin transition.
1 Introduction
Successfully executing the twin transition—the interplay between digital and green transition—is essential for achieving the United Nations Sustainable Development Goals (SDGs) (Adenle et al., 2023; Burinskienė and Nalivaikė 2024). The digital transition can greatly enhance the green transition by using technology to optimize energy use, reduce emissions, and promote sustainable practices. Nevertheless, undergoing digital transformation alone does not inherently result in improved energy and environmental performance; it must be coupled with green solutions (Bianchini et al., 2023). Implementing effective science, technology, and innovation policies is essential to tackling the complex challenges posed by the SDGs (Adenle et al., 2023).
Moreover, the European Union considers the twin transition as a pivotal strategy for achieving climate neutrality by 2050, aligning with broader global sustainability efforts (Eurecative 2022; European et al., 2022). The green transition encompasses the strategies for achieving the goals set out in the European Green Deal (Com 2019). Embracing the green transition offers Europe the opportunity to pursue sustainable and inclusive growth. Additionally, the European Green Deal contributes to reducing energy use and lessening dependence on fossil fuel imports (Com 2022). Therefore, integrating digital and green initiatives is essential for enhancing resource efficiency and reducing environmental impacts, all of which are key elements in the roadmap for meeting the SDGs by 2030 as well as reaching a climate-neutral EU by 2050.
The twin transition is a cornerstone in climate change mitigation where buildings have a critical role to play since buildings use high shares of national energy use (Paiho et al., 2023). The building sector represented around 37% of the global final energy use in 2021, where heating and cooling alone correspond to 38% of buildings’ energy use (Pérez-Lombard et al., 2008; IEA, 2023). World-wide, final energy usage in the building sector increased from 28,800 TWh/year in 1990 to 39,000 TWh/year in 2021. In Sweden, energy usage for the same sector has remained relatively stable, with 150 TWh/year in 1990 and 139 TWh/year in 2022 (SEA 2023). Meanwhile, the heated area in Swedish dwellings and non-residential premises increased from 580 to 700 million square meters between 1990 and 2021 (SEA 2023). This means that energy efficiency in buildings has improved according to energy usage per square meter over this period. Nevertheless, there is a need for accelerated process towards energy efficiency and decarbonising of the building sector.
Key technology areas within the twin transition in the building sector include various building energy-efficient technologies (EETs) (Yeatts et al., 2017; Paiho et al., 2023; Belussi et al., 2019; Gibbons and Javed 2022; Zhang et al., 2022) or building energy-efficient (BEE) technologies (Cristino et al., 2021a; Cristino et al., 2021b) that have the possibility to contribute to more energy-efficient buildings. One EET is to optimize energy usage according to the preferences of indoor climate with control of the building energy systems, which have been an ongoing activity in the building industry for decades, through means such as thermostatic valves. The development of digital technologies in all parts of the society has also affected the possibilities to control energy systems in buildings. There is potential to reduce energy usage in buildings with more optimized control of installations by building automation systems (BAS), also known as building management systems (BMS) according to requirements for indoor environment (Määttänen et al., 2014; Thyer et al., 2018; Burak Gunay et al., 2019). However, there are barriers for digitalization in buildings that can be related to factors such as IT security, increased vulnerability and lack of resilience in the event of crisis (Wang et al., 2017). In larger buildings such as non-residential buildings, it is common with use of BMS as a part of the everyday work in facility management (FM) (Brackley et al., 2023; Lane et al., 2024). Even further implementation of digital systems to support energy performance in buildings is possible, as has been advocated in previous studies (Rafiq et al., 2017; Pritoni et al., 2022). In Australia, a lack of energy meters and rigid building automation system have been presented as technical barriers for efforts to join green transition (Rock et al., 2019). Benchmarking tools and energy information systems were proposed by Brackley et al. (2023) as tools that could support EM to improve energy efficiency in buildings. Lack of BMS or upgraded BMS has also been pointed out as a technical barrier for buildings to be a part flexibility markets (Ma and Jørgensen 2018) and therefore a motivation for investments in BMS (Thyer et al., 2018) even for local possibilities for flexible energy usage. Some studies have noted that there seem to be essential barriers for investments in functional and supporting digital tools for FM (Harris et al., 2018; Brackley et al., 2023; Lane et al., 2024), especially when it comes to more advanced tools such as fault detection and diagnostics (FDD) tools (Heimar Andersen et al., 2024). Barriers for implementation of FDD-tools related to high costs for additional sensors have previous been investigated by Ejenakevwe et al., 2021. A further investigation according barrier and drivers for investments in building automation systems is motivated since only a few studies related to barriers to BMS and BAS exist (e.g., Brackley et al., 2023; Woradechjumroen and Li, 2015), but none of them has main focus on barriers to investments in BMS or BAS and no studies have addressed the specific settings and stakeholders in the Swedish building industry. BMS, as an EET, contributes with possibilities of better control of energy usage, especially if energy meters and key indicators are included in the system as a building energy management system (BEMS).
In conclusion, there is a need for accelerated development towards energy efficiency and decarbonising of the building sector. The twin transition is a cornerstone, and the use of building automation systems may have a great potential for energy and emissions savings in the buildings sector. However, there is a vast scarcity of studies related to barriers to and drivers for in-vestments in building automation systems. Therefore, there is a great need for a deeper understanding of how building automation could be implemented in buildings.
Due to the urgent necessity for decarbonising the building sector, this article focuses on how the ongoing twin transition could offer enhanced and more energy-efficient control of buildings, utilizing systems like building management systems (BMS). The aim of this paper is to investigate drivers for and barriers to investments in building automation system in the Swedish building industry among different stakeholders involved in development, design, construction, facility, and property management of buildings.
The study is based on following research questions:
• How is decision making of building automation motivated and what are the driving forces?
• What are the barriers for increased building automation in the Swedish building industry?
2 Background and theoretical concepts
2.1 Building automation
Building automation, as an overall concept for automatic control of building systems that has been under development for a long time, is related to control of indoor climate and operation of building systems. BAS and BMS could be understood as a system where different systems such as heating, ventilation and cooling are connected and could be controlled. BEMSs include energy data, and planned maintenance, error reports, and so on can also be handled in digital systems. Other possibilities with BMS are to use buildings systems in a more flexible way according to local PV power production and energy prices (Thyer et al., 2018). In recent times, the rapid development in digitalization and Internet of Things (IoT) have been connected to the operation and control of building systems and even further connections and development is ongoing, such as use of artificial intelligence (AI) (Bagheri et al., 2021; Halhoul Merabet et al., 2021; Yan et al., 2021), with contributions to energy efficiency in buildings. Examples of ongoing development are digital twins (Hosamo et al., 2023) in combination with user satisfaction and fault detection and diagnosis (FDD) (Pritoni et al., 2022); however, according to Heimar Andersen et al. (2024), FDD is not selling on the market and is more of an academic definition. Building information models (BIMs) (Gerrish et al., 2017; Tang et al., 2019) are another digital development that could support both during design, construction and operation of buildings with handling of detailed information about parts in the building. Data management is an important barrier to overcome for BIM solutions in operation of buildings (Gerrish et al., 2017) which also is important for BAS and connections to I oT (Nesztler et al., 2016).
2.2 Barriers and drivers to investments
The energy efficiency gap is defined as non-investments of cost-effective technical measures that improve energy efficiency (Hirst and Brown 1990; Jaffe and Stavins 1994; Sorrell et al., 2004) and is the theoretical concept for barriers used in the present study. In previous research, barriers for investment and thereby implementation of the cost-effective energy-efficient technologies have been divided into three groups: economic, organizational, and behavioral barriers (Sorrell et al., 2004; Thollander and Palm 2013). This type of categorization for barriers has been used in previous studies in the industry (Thollander and Ottosson 2008; Thollander et al., 2020) and in the building industry (Kangas et al., 2018; Lane et al., 2019; Blomqvist et al., 2022; Carlander and Thollander 2023; Palm and Bryngelson 2023).
Barriers for the use of EETs could also include some non-cost-effective EETs outside the energy efficiency gap, according to Jaffe and Stavins (1994). These barriers could be categorized according to knowledge of, access to, and desire to use EETs (Yeatts et al., 2017) with related drivers as a way to overcome barriers.
Drivers for investments in energy-efficient technology have been investigated in several studies in industry and the building sector (Yeatts et al., 2017; Lane et al., 2019; Cristino et al., 2021a; Cristino et al., 2021b; Carlander and Thollander 2022; Palm and Bryngelson 2023; Heimar Andersen et al., 2024). Financial or economic drivers for investments in energy-efficient technology is one obvious aspect (Thollander and Ottosson 2008; Heimar Andersen et al., 2024) of drivers, but investments could also be motivated by sustainability such as companies environmental profile (Rohdin et al., 2007), client demands (Persson and Grönkvist 2015) or responsibility for future generations (Brudermann et al., 2013; Lane et al., 2019). Another driver is related to contribute to implementation of new technologies (Brudermann et al., 2013; Lane et al., 2019) as an early adopter (Rogers 1995) or later in the innovation process. There are also other similar terms used in the literature, such as enabler (Harris et al., 2018). Building automation systems are constantly evolving, which means that there are both older developed technologies and newer ones that are not proven to the same extent.
3 Methods
The research design in this paper mainly has a qualitative perspective. This requires us to answer questions such as “why,” “what” and “how” (Brinkmann and Kvale 2015). From a quantitative perspective, compared numbers are used as indications about the differences between participating groups in the investigation.
In order to possibly reach a larger group than is possible with interviews with limited resources in the research project, a questionnaire was chosen for data collection. This also provides anonymity for the informants.
A questionnaire study (Trost and Hultåker 2016) was designed to identify the driving forces for and barriers to investments in building automation. In Table 1, the theoretical barriers (Sorrell et al., 2004) used in this study are listed, explained, and connected to numbered questions from the questionnaire.
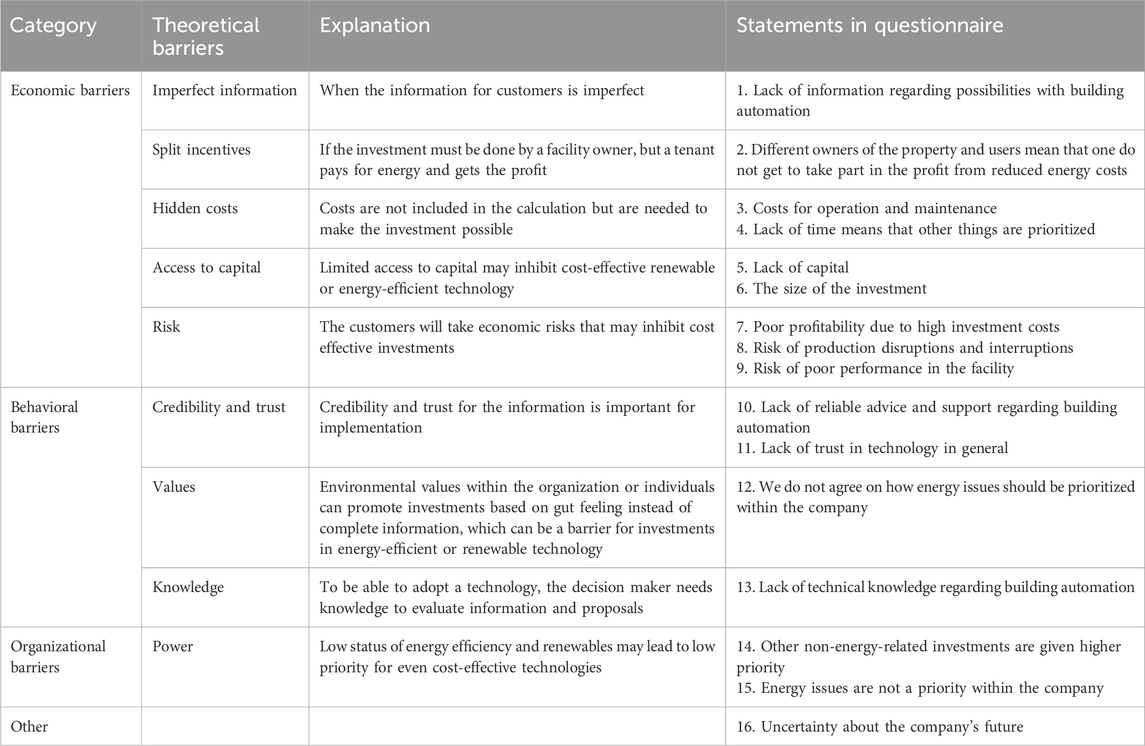
Table 1. Barriers used in the study and statement in the questionnaire connected to the question “What would prevent you to investment in building automation?”
There were also questions with statements related to drivers, the importance of energy and sustainability in general, among others. The formulation of questions was inspired by Lane et al. (2019). All formulation of questions was tested on both people without experience of the subject and professional before it was used in the study. The drivers were divided into three main categories–financial, sustainability and technology development drivers–according to Lane et al. (2019). The questions took the form of multiple-choice questions, estimates, and free text responses. The scales of the multiple-choice questions were mainly divided into four to six different levels. In the analysis data, these levels were converted to a scale from 0 to 1. Presented values shows the average value of the answers in the presented group. The scale for each question can be found in Table 2.
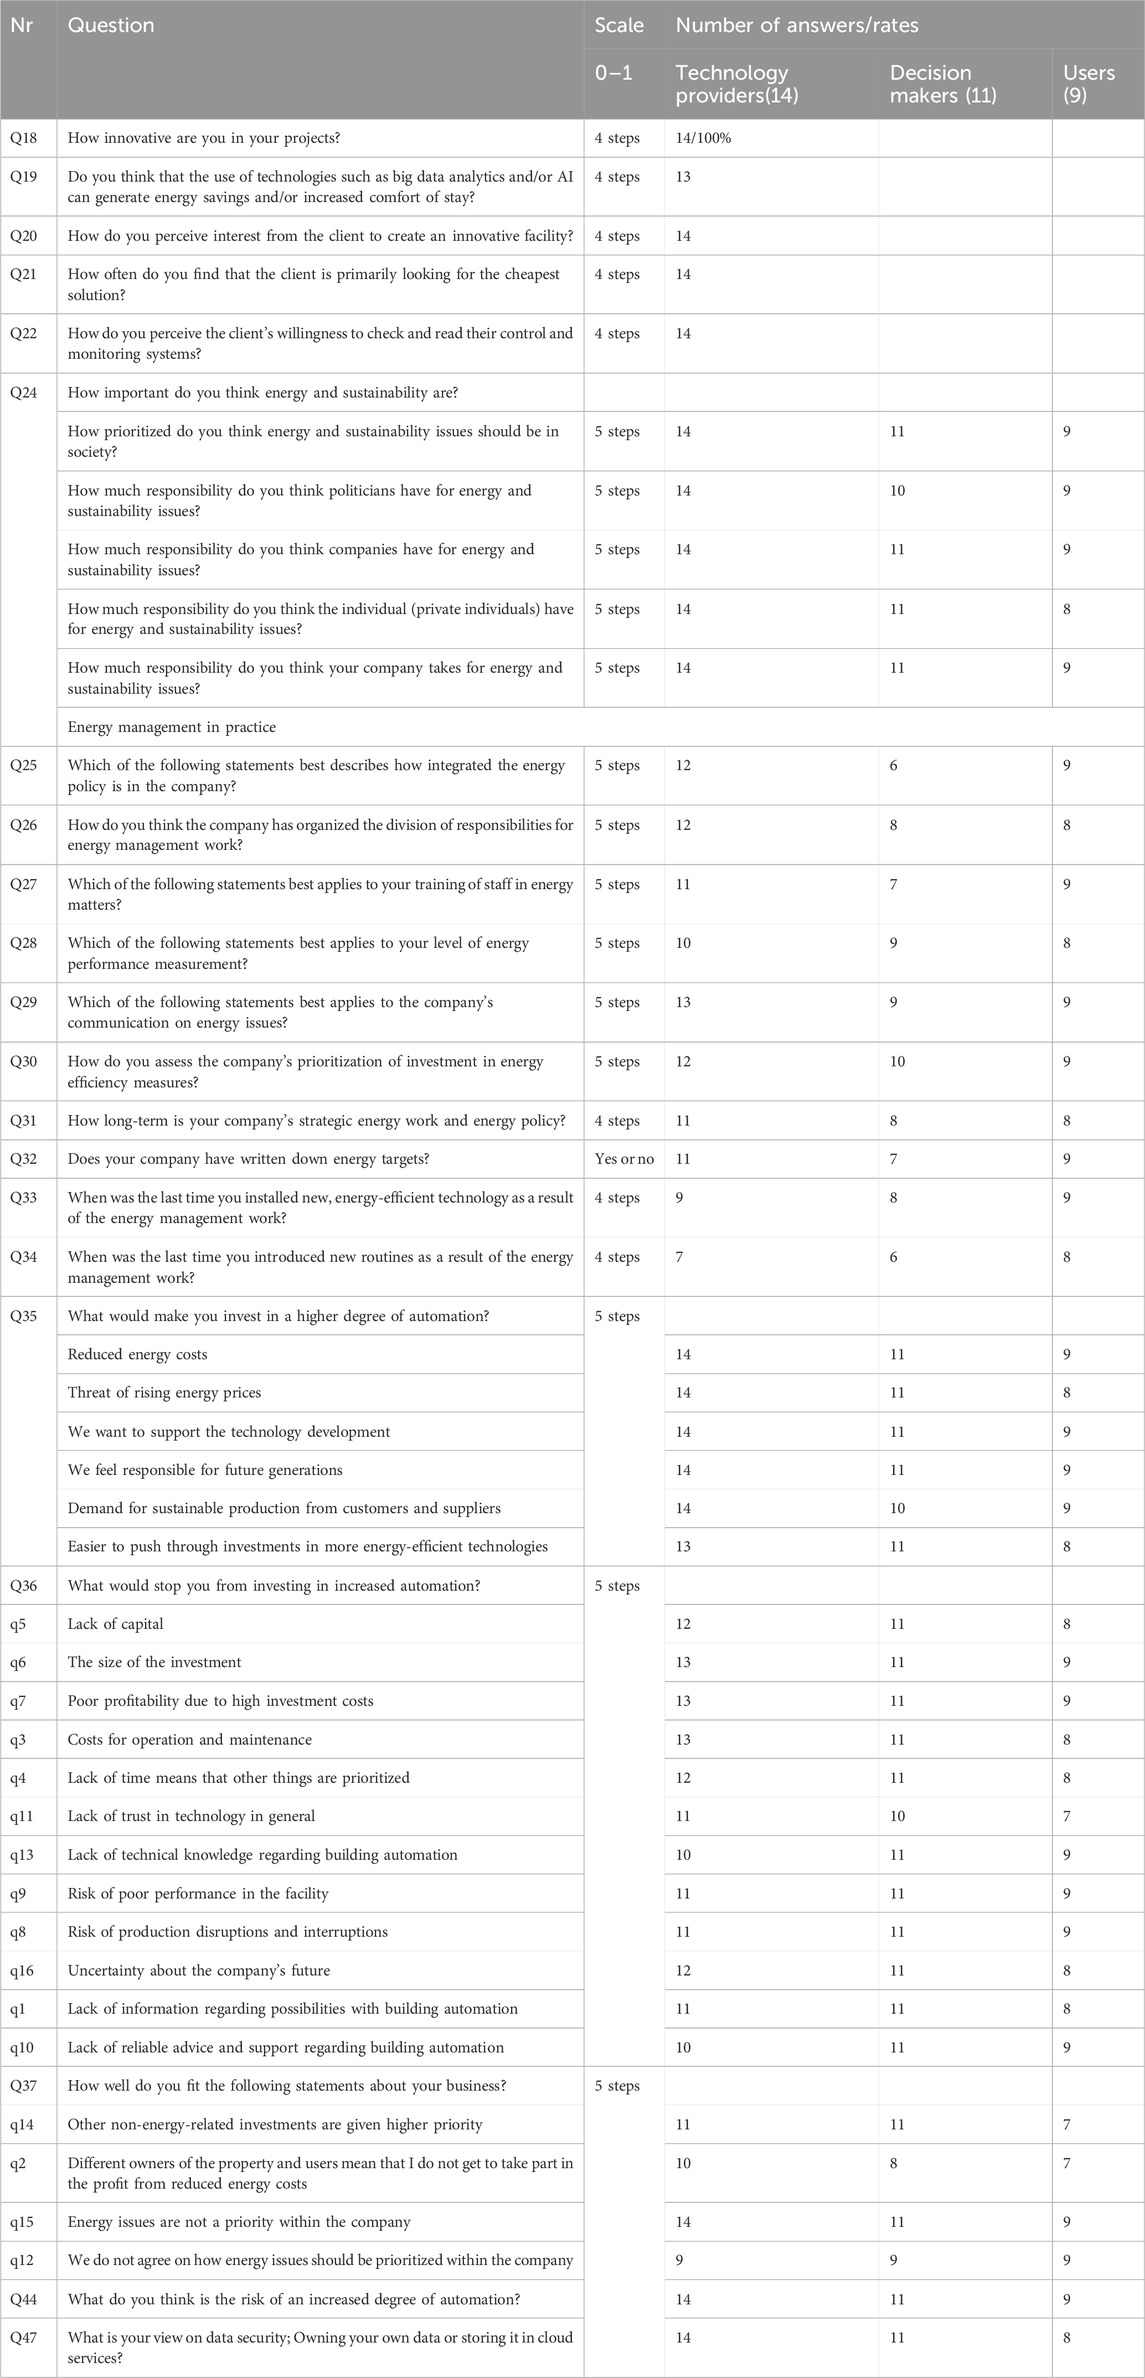
Table 2. Questions in the form, steps in the scale for answers, and number of responses.
The selection of participants was strategic to catch variations among the informants in relation to which group they belong (Trost and Hultåker 2016) according to the qualitative perspective of the investigation, rather than to catch quantitative statistical variations. An invitation to participate in the study, including a digital link to the questionnaire in Microsoft Forms, was sent by e-mail to people in the professional network of the authors. In total, 34 anonymous answers were collected during April 2022, divided into the following categories and number: five property managers, four people in facility management, two property owners, nine construction project managers, 10 consultants, and four building automation contractors. These categories were placed into three groups–technology providers, decision makers and users–according to Table 3.
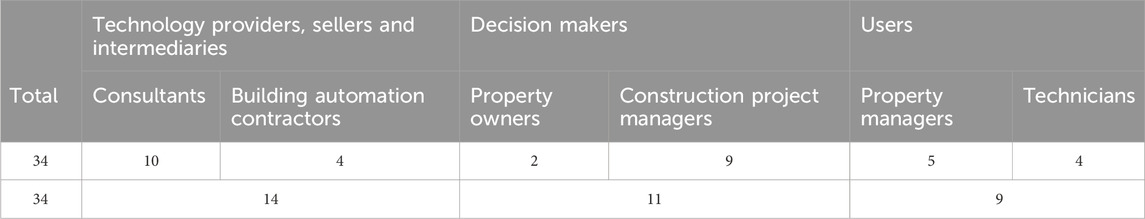
Table 3. Overview of informants in the study.
Figure 1 illustrates the stakeholders and the decision-making process. The technology providers include consultants, which could also could be described as intermediaries (Janda and Parag 2013) and building automation contractors. The building automation contractors are also providers and sellers. The group decision makers include property owners and construction project managers as they make decisions about investments in building automation. Finally, users as property managers and technicians in facility management are those that benefit from the investment in their everyday work as they use software and interact with building systems. Notably, the process describes investments in new construction and major renovation projects. Investments or supplementary investments in existing buildings are also possible and then the end-users or management in their organization may be decision makers.

Figure 1. The stakeholders in the decision-making process in construction projects and how the various stakeholders are located in the value chain of a BMS or BAS.
3.1 Description of the groups in the study and their relations to building automation
The questionnaire included some questions regarding the informants’ background, their view on sustainability questions (see Figure 2), integration of energy management practice (see Figure 3), and their experience and knowledge of building automation. These questions provide the basis for the following description of the groups in the study, which is valuable information since there are few respondents and important for the understanding of the reliability of the study. It should be noted that it is not known whether there are business relations between the informants in the answering groups. This section starts with general views on energy and climate questions for all groups.
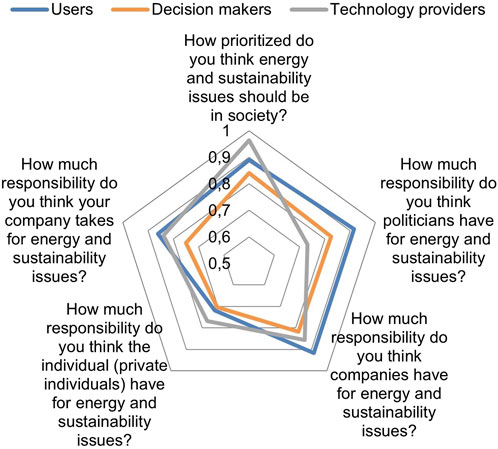
Figure 2. General views on energy and sustainability question among the respondents in the groups. The scale was divided into five steps, where one corresponds to very important and 0 not important at all. The diagram shows the average of the answers of each group: 0 means that the respondents do not agree with the statement and 1 means that they fully agree with the statement. Details about answering rate can be found in Table 2, Question 24.
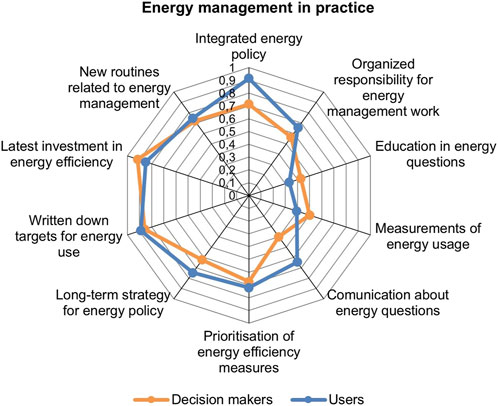
Figure 3. The diagram shows the average of the answers of the user group for the statements related to energy management in practice. The scale was divided into five steps for most of the statements. The diagram shows the average of the answers of each group: 0 means that the respondents do not agree with the statement and 1 indicates that they fully agree with the statement. More details about answering rate could be found in Table 2, Questions 25–34.
3.1.1 General views on energy and climate questions
Figure 2 presents the average of the answers of each group to five questions regarding prioritization and responsibility for energy and sustainability issues. Energy and sustainability questions are important to all the respondents. Some small differences between the answering groups could be noticed. The technology providers think that the overall prioritization of sustainability questions should be higher than the levels of responsibility of politicians, companies, and individuals, but companies must take most of the responsibility for sustainability questions. Users and investment decision-makers think that the general prioritizing of energy and sustainability issues should be at the same level as the responsibility of politicians and companies for sustainability and energy questions. Individuals have the lowest responsibility, according to the informants in these groups.
3.1.2 Users
The group of users have a mixture of small (1–50) and larger (100+) number of buildings to handle in their companies. There is a mixture of levels in building automation, from local self-acting systems such as thermostatic valves to superior building automation system with advanced functions. Half of the group use the superior building automation system on a daily basis and almost all of the others do so sometimes every month. The primary use is for alarm handling, but as multiple choice was not possible in the questionnaire, other use is not investigated in the study. Knowledge about building automation system varies among the informants in the study. Most have knowledge within their organizations to handle superior building automation systems, but some only have some knowledge from the subcontractor. When it comes to questions about how to build up building automation systems, half of the group must rely on subcontractors and the other half have varying resources and skills within their organization. All of the users have some support and knowledge about building automation systems within their organization or from subcontractors. Users without any knowledge or support for building automation are not represented in the study. To be too dependent of subcontractors for support for setting in BMS was the situation for FM in a study in Canada (Brackley et al., 2023).
3.1.3 Decision makers
Decision makers are those who make decisions about investments in building automation. Most of the informants in the study are building project leaders; see Table 2. On average, these decision makers perceive themselves as moderately innovative in their projects. When it comes to projects with extension and conversion of buildings, the decision makers in the study think that it is important to a certain extent to make buildings ‘smarter’, but it is driving costs. The support within their own organization to manage and set requirements for design of building automation systems varies among the informants on the entire scale, ranging from no such support at all to a high degree of support.
3.1.4 Technology providers
The technology providers in the study indicated that clients are cost-driven to a fairly high degree (Q21). They described their own projects more innovative (Q18) than they perceives the client’s interest in innovative buildings and to monitor their building automation systems (Q20, Q22). They think that Big Data and AI technology can contribute to energy efficiency and better indoor comfort to a fairly high degree (Q19).
3.1.5 Energy management practice
The questionnaire contained some questions related to energy management practice in the companies based on energy management in practice for the industry, according to Brunke et al. (2014). The energy management practice could be divided into categories such as long-term energy strategy, top management commitment, and submetering, according to previous research (Thollander and Ottosson 2010; Trygg et al., 2010; Worrell et al., 2010). The questions are most relevant for the group users, but all groups answered the questions. The answers for users and decision makers are presented in Figure 3.
Energy policy is high and integrated in the organizations of the users, according to Figure 3, and both the users and decision makers make investments in energy-efficient technologies. Weakness in energy management practice is related to education in energy questions for all the employees, the level of measurements of energy usage, and formal organized responsibility for energy management. There is diversity in the study regarding communication about energy questions as the decision makers have the lowest level of communication and the users have the highest level.
3.2 Limitations
The study was conducted in a Swedish context that imitates the conditions in the Swedish Construction and Real Estate Sector. This is a small study, as only a limited group of informants answered the questions. The informants had high prioritization according to sustainability in society, which may differ among other potential informants. The study highlights differences in perspective between the answering groups that would be valuable to explore further, both from a qualitative and quantitative perspective, to gain an even deeper understanding of the perspective of benefits and risks of building automation among different stakeholders, especially with a focus on energy-efficient buildings.
The quantitative perspective would contribute to a better understanding of the building industry at large, such as differences between small and large building owners.
4 Results
This section shows the weighted results from the questionnaire study and is divided into two parts, one for each research question.
4.1 Motivation and drivers for investments in building automation
Investments in building automation could be motivated in different ways. In Figure 4, expectations as improvement of work and contribution to energy efficiency in the building are presented for the three groups in the study.
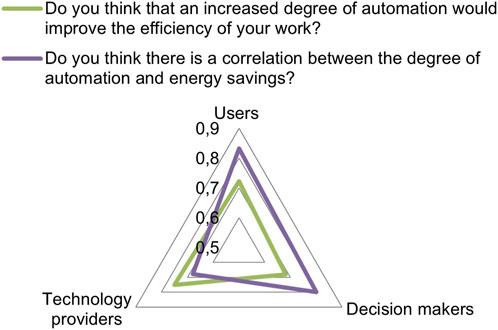
Figure 4. Expectations on building automation systems (asymmetric information). The scale was divided into three steps for most of the questions. The diagram shows the average of the answers of each group: 0 means that the respondents do not agree with the statement and 1 means that they fully agree with the statement. More details about answering rate can be found in Table 2, Question 42.
There are differences between the groups of informants, as the technology drivers in the study have more expectations regarding the contribution to easier work when there is building automation installed than the end users and decision makers have. These groups lift energy efficiency as an expectation on investment in building automation. One informant of the technology providers struggled with how to explain the benefits of building automation for customers.
“I think, after a number of years in the industry, we have been bad at explaining and talking about what automation can do for a business. At the same time, it requires work from those who are going to use it! It does not work as if just because something is automatic, everything is ready, but must be worked on even after the final inspection” (Building automation contractor, born 1965).
The informant said that it is hard to explain the value of building automation and how it could be used as a tool rather than something fully automatic, even though the term “automatic” indicates that no work is needed. This could contribute to a misconception between technology providers and their customers and users about what a building automation system is and how it should be used. In general terms, there seems to be an asymmetry between the technology providers’ and the end-users’ and customers’ understanding, values (see Figure 4) and knowledge on what building automation is. Previous energy service research has stated that this ontological, value- and knowledge-related challenge is, in part, solved by adding a facilitator serving the end-user in understanding the technology and service providers’ value proposition (Bleyl et al., 2013).
There were questions regarding drivers for investments in building automation in the study. The result is illustrated in Figure 5.
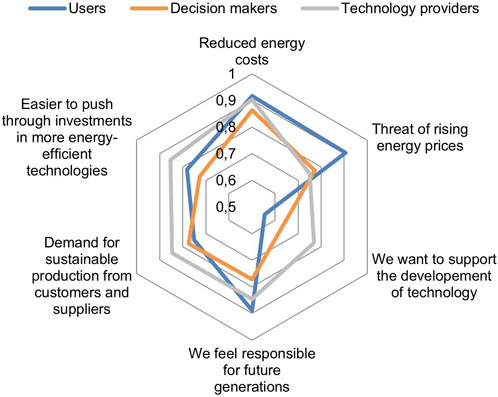
Figure 5. Drivers for investments in building automation (Q35 Appendix). The scale was divided into five steps for most of the questions. The diagram shows the average of the answers of each group: 0 means that the respondents do not agree with the statement and 1 means that they fully agree with the statement. More details about answering rate could be found in Table 2 Question 35.
Drivers for investments in building automation have been divided into three categories: financial driving forces, sustainability drivers and technology development drivers according to (Brudermann et al., 2013; Lane et al., 2019).
4.1.1 Financial driving forces
Financial driving forces that have been investigated in the study are “reduced energy cost” and “threat of rising energy prices”. All of the groups agreed that reduced energy cost is a high driver for investments in building automation. The end-users ranked the threat of rising energy prices as high, but the decision makers and technology providers only ranked it as medium. Financial driving forces as reduced cost is lifted in other studies related to FDD tools (Heimar Andersen et al., 2024) and EETs in general (Carlander and Thollander 2022).
4.1.2 Sustainability as a driver
Some questions are related to sustainability as a driver. The questions “demand for sustainable production from customers” and “easier to push through investments in more energy-efficient technologies” are ranked highest by the technology providers. The question “we feel responsible for future generations” was the highest-ranked driver by the users in the study. A motivation and driver raised in previous studies regarded installations of PV (Brudermann et al., 2013) and battery storage (Lane et al., 2019).
4.1.3 Technology development as a driver
Finally, the driver that divided the responding groups most was, “We want to support the development of technology”. The users give low priority to support technology development, but the technology providers rank it higher than both decision makers and users. A conclusion that can be made is that the end-users in the study do not see themselves as early adopters (Rogers 1995) as much as the technology providers do.
According to all the presented drivers, the decision makers in the study are those who are less motivated to invest in building automation.
4.2 Barriers to investments in building automation
In this section, we present the empirical result in the questionnaire according to barriers for investments in building automation. Barriers are related to non-investments in energy-efficient technology (Hirst and Brown 1990; Jaffe and Stavins 1994; Sorrell et al., 2004) where building automation is the energy-efficient investment in this study. The results connected to the questions in Table 1 are visualized according to category of barriers in Figure 6 and ranked according to decision makers in Figure 7.
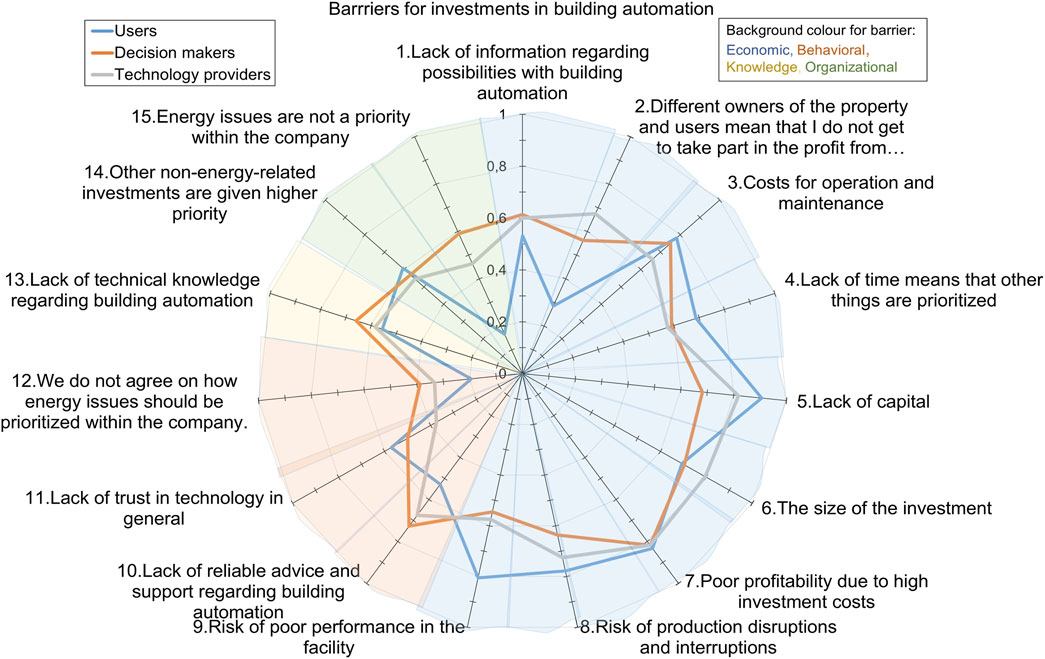
Figure 6. Barriers for investments in building automation. The full text connected to each numbered statement in the diagram can be found in Table 1. The scale was divided into five steps for most of the questions. The diagram shows the average of the answers of each group: 0 means that the respondents do not agree with the statement and 1 means that they fully agree with the statement. More details about answering rate could be found in Table 2 Question 36.
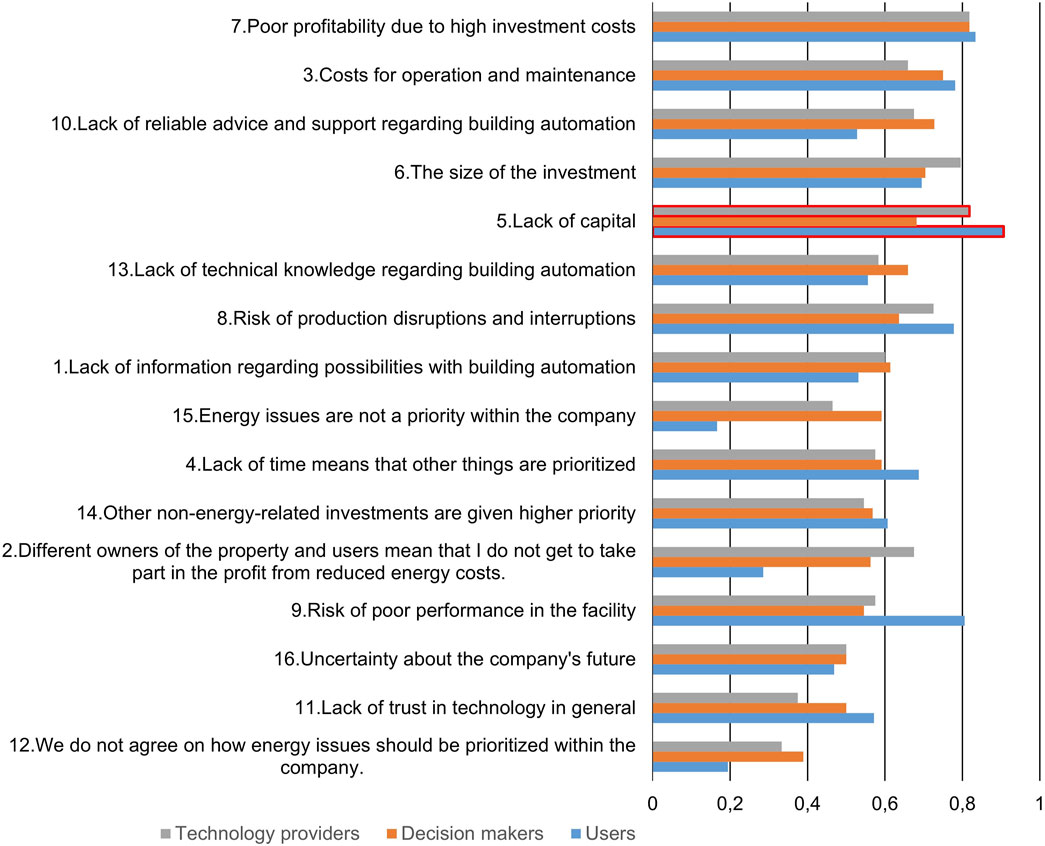
Figure 7. Barriers for investments in building automation sorted according to the ranking of the decision makers. The highest-ranked barrier for technology providers and users is “5. Lack of capital” and is marked with a red outline. The full text connected to each numbered statement in the diagram can be found in Table 2. The scale was divided into five steps for most of the questions. The diagram shows the average of the answers of each group: 0 means that the respondents do not agree with the statement and 1 means that they fully agree with the statement. More details about answering rate can be found in Table 2 Question 36.
The results are presented according to the categories of barriers in Table 1, and then summarized in relation to the groups in the study.
4.2.1 Economic barriers
The economic barriers were ranked high to medium ranked among all groups in the study. Risk (q7) as poor profitability due to high investment costs is the highest-ranked barrier among the decision makers and ranked second by users and technology providers. Poor profitability means that the investment still is cost-effective, but the technology must be more cost-effective for investments that is founded only on improved energy efficiency. Access to capital (q5) is the highest-ranked barrier among users in the study and second for technology providers (q5, q6). The decision makers ranked access to capital in fourth and fifth place compared to other barriers, which makes access to capital a slightly less important barrier for more investments in building automation in building projects. Hidden costs (q7) are the second barrier according to the decision makers in the study. High investment cost for BMS has been identified as a barrier in previous studies by (Woradechjumroen and Li 2015; Syah and Ieee 2016; Brackley et al., 2023). In general, high investments costs and long payback time are common barriers for investments in EETs according to a literature review by (Cristino et al., 2021a).
4.2.2 Behavioral barriers
The behavioral barrier credibility and trust (q10) is the third-ranked barrier among the decision makers in the study (Figure 7), and according to Figure 6 the decision makers ranked it highest among the groups in the study. It is therefore an important barrier to overcome for more investments in building automation. Other behavioral barriers (q12) are ranked lower. There is a difference between the groups according to lack of trust in technology (q11) as it ranked higher by the users and ranked very low by the technology providers.
4.2.3 Knowledge barrier
The introduced knowledge barrier in the diagrams in Figures 6 and 7 is ranked in the middle in this study. Notably, it is ranked highest by the decision makers in the study, which will prevent implementation of building automation in building projects. According to Carlander et al. (Carlander and Thollander 2022), it is an important driving force to have knowledge about energy-efficient technologies before a new building project is started up. Otherwise, a knowledge barrier (Cooke et al., 2007; Kangas et al., 2018; Solnørdal and Thyholdt 2019) occurs as information and knowledge must be collected during the project if the technology is to be implemented. This drives costs for the specific project and implements uncertainties as risks of production interruptions (q8) and risk of poor performance in the facility (q9) as the technology is new for the project team and later for the users. This is in line with the view of decision makers as they think that it drives costs to make buildings smarter. Building automation systems used for control of systems as heating, ventilation and cooling of the building has the potential to optimize and reduce energy usage (Thyer et al., 2018), but also to increase energy usage as there are several settings that require knowledge to regulate.
4.2.4 Organizational barrier
The organizational barriers (q14, q15) are ranked in the middle by participants in all groups, except users, who did not agree that energy issues have a low prioritization in their organization (q15); however, in practice, other non-energy-related investments have higher prioritization (q14) for the users.
4.2.5 The view of barriers for the groups
The highest-ranked barrier among the decision makers in the study is risk (q7), as poor profitability is due to high investment costs. Hidden costs are in second place and then the behavioral barrier credibility and trust (10). Access to capital (q5, q6) comes next in the ranking.
The highest-ranked barriers among the technology providers are economic barriers such as risk (q7), access to capital (q5 and q6) and risk (q8).
The highest-ranked barriers among the users in the study are economic barriers, such as access to capital (q5), risk (q9), and hidden cost (q3). According to the users, there is high investment cost for building automation, and it is also connected with risks such as poor performance and production interruptions, together with hidden costs for operation and maintenance. Barriers related to knowledge (q13), imperfect information (q1) and credibility and trust (q10) are ranked in the middle by the users.
4.2.6 Non-energy risks
If barriers or risks other than energy efficiency are included in the decision about investments, the energy efficiency gap may be increased even more. Non-energy risks and barriers is a newly introduced concept based on the results in this study. Handling of data in building automation systems have been found to be one such non-energy risk/barrier. If the same energy efficiency could be reached with internal data handling as in clouds, there is a non-energy risk. Figure 8 presents the view of handling data and IT security.
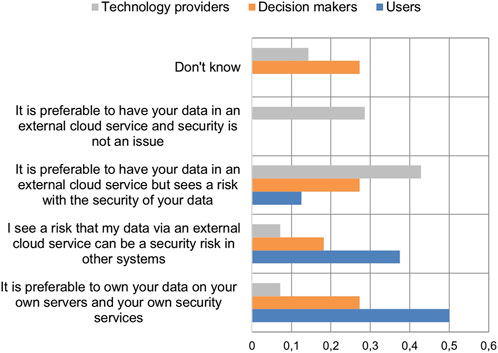
Figure 8. The view of handling data and IT security. The presented values show the share of the answering group for each statement. The value of one means that the whole answering group chose the statement and 0 means that no one in the group choose that statement. More details about answering rate can be found in Table 2 Question 47.
A deal-breaker between the groups in the study was the way in which data were to be handled. Owning and handling one’s own data is crucial for the end users in this study, and they see risks with data in external clouds. The technology providers in the study prefer to have data in external cloud services, and they are divided in their opinion regarding security risks. The decision makers’ opinions varied and the most uncertain ones in the study had the highest share of “do not know” responses.
There were even more statements about risks with increased building automation that the respondents had to answer. It was possible to select several risks. The result is weighted according to the number of respondents in each group and presented in Figure 9.
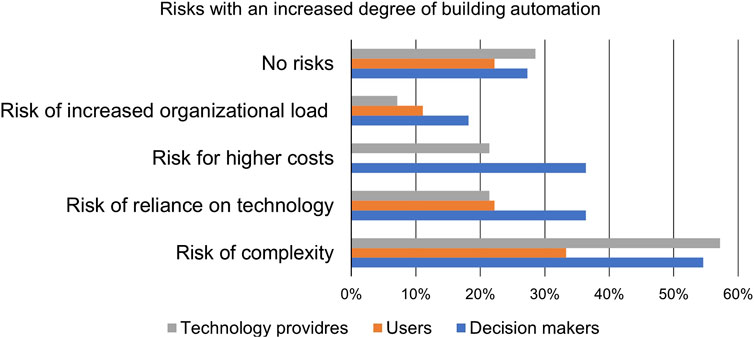
Figure 9. The view of risks with increased degree of building automation. This was multiple choice questions with possibility to choose more than one answer. The presented values show the share of the answering group for each statement. The value 100% means that the whole answering group chose the statement. More details about answering rate can be found in Table 2 Question 44.
Complexity is seen as the highest risk among all groups and over half of the respondents among decision makers and technology provider believe that complexity is a risk that comes with increased building automation. At least one-third of the decision makers thinks that there are risks with increased building automation, such as complexity, reliance on technology, and higher costs. One in four participants did not see any risks with higher implementation of building automation.
5 Discussion
Building project leaders must handle and make decisions about a wide spectrum of technologies. Building automation acts at the interface between physical buildings and digital technologies, and competence in both areas is needed to take informed decisions about investments in these systems. At the same time the twin transition provides unique new means for mitigating climate change in the built environment. One such technology is BMS which in fact is one of the more mature technologies within the clean transition. In this study a research gap was identified as few studies were found to be related to motivation, drivers and barriers for building automation, especially in the setting of the Swedish building industry.
A general finding from the study is that even though building automation is a part of everyday work for the users in the study, as well as in the study by Brackley et al. (2023), there is still believed to be potential for a higher degree of implementation.
Improvement of energy performance in buildings was a high motivation factor and anticipation of BMS, together with financial drivers such reduced energy costs among to the users and decision makers in this study. Supporting daily work in FM was a higher expectation and driver among the technology providers, and a challenge to explain the non-energy benefits (NEB) (Nehler et al., 2014) for customers. Both of these perspectives are in line with the drivers, motivation, and challenges found by Heimar Andersen et al. (2024) regarding implementing of even more advanced digital technology for buildings as FDD tools. Another driver found in the present study was that the participating groups had divided opinions of whether or not to support technology development. This difference could be related to whether they are early adopters (Rogers 1995) or not. Safe and secure operation had higher priority among users than experimental development. This aspect of implementation of BMS and building-related digitalization has not been found in the literature referred to in this paper.
The findings that investments in BMS are connected to high investment cost and poor profitability according to these high investments costs is in line with the findings in a paper (Woradechjumroen and Li 2015) from 2015; this means that nearly a decade of digital development has not contributed with more cost-effective BMS, even though there has been extensive technology development of the tools and proposals for other solutions to minimize investment costs (Syah and Ieee 2016). According to the informants in the study by Brackley et al. (2023), further investments in BMS for optimization in existent buildings were also connected to barriers such as high cost and lack of capital, which is in line with the results of the present study. Improvements that were pinpointed were upgrades of BMS including submeters, which were connected to high cost and uncertain pay back. Also, Rock et al. (2019) and Lane et al. (2024) promoted the need for meters and updated BMS to functional digital tools that could support FM in their daily work to improve energy efficiency in buildings and contribute to the green transition. This allows for a more general applicability of our study. BMS is one of the more mature technologies in the twin transition according to Paiho et al. (2023) and even so, the cost-effectiveness seems to be one key barrier to higher deployment levels. This in turn leads us to propose that generally speaking, high level of adoptions of twin technologies including BMS, most likely needs some sort of policy adoption such as has been the case for PVs.
A knowledge barrier (Cooke et al., 2007; Kangas et al., 2018; Solnørdal and Thyholdt 2019; Carlander and Thollander 2023) was found in the study, as knowledge is needed for both decisions about investments and for use of building automation. Knowledge is also connected to and needed for decisions regarding IT security (Wang et al., 2017) and how to handle data. The evolution of digital systems such as BMS has meant a transition from the traditional means of managing buildings based on one or a few members of the facility management team that manually serves the building-related technical systems based on their practical knowledge, to a specialist management model where the building automation system can only be fully understood by a few specialists who possess specialist knowledge and are often located outside the core facility management team. Further, the knowledge that traditional facility management staff possess and the knowledge that specialist building automation experts possess needs to be bridged, since their respective knowledge does not appear to overlap sufficiently.
Apart from operational knowledge parts (that is, FM and building automation expert staff), a BEM decision-maker must also possess knowledge about the pros and cons when making the decision of the investments. In this study, decision makers were found to be less motivated to invest in such systems than users. This is further complicated by the fact that the decision makers in this study do not use building automation systems themselves. We found few studies that highlight how decisions in building projects about investments in BMS and other digital tools could be made by others than the users, which makes the present study stand out. Barriers for implementing digital tools for monitoring-based commissioning in the field was found by Harris et al. (2018) related to the disconnect between decision makers and expertise in building technology, which could be compared with the situation in the present study, as decision makers have less knowledge and information about building automation.
Within the energy service research area, the existence of a facilitator is of key importance (Bleyl et al., 2013). This is an important result from the present study–that a facilitator serving the decision-makers when making investments in BMS seems to be highly needed. Knowledge networks in industry have been shown function as such facilitator to resulting in higher improvement levels in relation to energy efficiency (Johansson et al., 2022). A general take away from this is that twin transition technologies may sometimes be in need for facilitators for successful adoption.
In Sweden, several networks exist for buildings in general, such as Belok for non-residential buildings, Bebo for residential buildings, and industry associations for specific stakeholders as for instance property owners. However, our study seems to show limited support for building-automation-related services and facilitators/networks that serve decision makers, apart from the large real-estate owners that have the opportunity to have in-house competence. But according to the Swedish Property Federation (Fastighetsägarna, 2024), 80 percent of Swedish real estate companies only have one to four employees. This may explain why there was a vast difference in the knowledge that the decision makers have about building automation systems. Thus, a key conclusion is that a facilitator is needed, as knowledge is required for both decisions about BMS investments as well as for its use.
6 Conclusion
This study aimed to contribute to knowledge about drivers for and barriers to investments in building automation system in the Swedish building industry among different stakeholders involved in development, design, construction, facility, and property management of buildings. Improved energy efficiency was found to be an important motivation for investments in BMS for users and decision makers, but the technology providers elevated more easy work as important. The main driver for investments in BMS was related to reduced energy costs, while for the decision makers, financial barriers such as risks and hidden cost were most important. An important knowledge barrier was found as knowledge is needed for decisions about investments, use of BMS and decisions regarding IT security, such as handling of data. The study was limited with few respondents but highlights differences in perspective between the answering groups that would be of importance to explore further. Also, differences between different types of buildings and ownership would be of importance to include in future research. Deeper knowledge is required about how to facilitate the need among different decision-makers and users about BMS investments and use. On a broader scale, the paper argues for the need to include facilitators as a core part of future policies within the twin transition.
Data availability statement
The raw data supporting the conclusions of this article will be made available by the authors, without undue reservation.
Ethics statement
Ethical review and approval was not required for the study on human participants in accordance with the local legislation and institutional requirements. Written informed consent from the [patients/participants OR patients/participants legal guardian/next of kin] was not required to participate in this study in accordance with the national legislation and the institutional requirements.
Author contributions
A-LL: Conceptualization, Formal Analysis, Investigation, Methodology, Visualization, Writing–original draft. AS: Investigation, Methodology, Writing–review and editing. PT: Conceptualization, Supervision, Writing–review and editing. MC: Funding acquisition, Supervision, Writing–review and editing.
Funding
The author(s) declare that financial support was received for the research, authorship, and/or publication of this article. The work was carried out under the auspices of the PhD school Reesbe, which is financed by the Swedish Knowledge Foundation (KK-stiftelsen, project number 20150133).
Conflict of interest
Author AS was employed by ÅF-infrasturcture.
The remaining authors declare that the research was conducted in the absence of any commercial or financial relationships that could be construed as a potential conflict of interest.
Publisher’s note
All claims expressed in this article are solely those of the authors and do not necessarily represent those of their affiliated organizations, or those of the publisher, the editors and the reviewers. Any product that may be evaluated in this article, or claim that may be made by its manufacturer, is not guaranteed or endorsed by the publisher.
References
Adenle, A. A., De Steur, H., Mwongera, C., Rola-Rubzen, F., de Barcellos, M. D., Vivanco, D. F., et al. (2023). Global UN 2030 agenda: how can science, technology and innovation accelerate the achievement of sustainable development goals for all? PLOS Sustain. Transformation 2 (10), e0000085. doi:10.1371/journal.pstr.0000085
Bagheri, A., Genikomsakis, K. N., Koutra, S., Sakellariou, V., and Ioakimidis, C. S. (2021). Use of AI algorithms in different building typologies for energy efficiency towards smart buildings. Buildings 11, 613. doi:10.3390/buildings11120613
Belussi, L., Barozzi, B., Bellazzi, A., Danza, L., Devitofrancesco, A., Fanciulli, C., et al. (2019). A review of performance of zero energy buildings and energy efficiency solutions. J. Build. Eng. 25, 100772. doi:10.1016/j.jobe.2019.100772
Bianchini, S., Damioli, G., and Ghisetti, C. (2023). The environmental effects of the “twin” green and digital transition in European regions. Environ. Resour. Econ. 84 (4), 877–918. doi:10.1007/s10640-022-00741-7
Bleyl, J. B., Markus, K., Geir, C., Sung-Hwan Adilipour, N., Bourgois, C.-H., Coolen, J., et al. (2013). A role for Facilitators to play. ECEEEE Summer Study.
Blomqvist, S., Glad, W., and Rohdin, P. (2022). Ten years of energy efficiency—exploring the progress of barriers and drivers in the Swedish residential and services sector. Energy Rep. 8, 14726–14740. doi:10.1016/j.egyr.2022.10.439
Brackley, C., Nojedehi, P., Darwazeh, D., Ouf, M. M., and O'Brien, W. (2023). It's not just technical - socio-technical challenges to the efficient operation of commercial office buildings. Energy Res. and Soc. Sci. 100, 103101. doi:10.1016/j.erss.2023.103101
Brinkmann, S., and Kvale, S. (2015). InterViews: learning the craft of qualitative research interviewing. Los Angeles: Sage Publications, cop. 2015.
Brudermann, T., Reinsberger, K., Orthofer, A., Kislinger, M., and Posch, A. (2013). Photovoltaics in agriculture: a case study on decision making of farmers. Energy Policy 61, 96–103. doi:10.1016/j.enpol.2013.06.081
Brunke, J.-C., Johansson, M., and Thollander, P. (2014). Empirical investigation of barriers and drivers to the adoption of energy conservation measures, energy management practices and energy services in the Swedish iron and steel industry. J. Clean. Prod. 84, 509–525. doi:10.1016/j.jclepro.2014.04.078
Burak Gunay, H., Shen, W., and Newsham, G. (2019). Data analytics to improve building performance: a critical review. Automation Constr. 97, 96–109. doi:10.1016/j.autcon.2018.10.020
Burinskienė, A., and Nalivaikė, J. (2024). Digital and sustainable (twin) transformations: a case of SMEs in the European union. Sustainability 16, 1533. doi:10.3390/su16041533
Carlander, J., and Thollander, P. (2022). Drivers for implementation of energy-efficient technologies in building construction projects — results from a Swedish case study. Resour. Environ. Sustain. 10, 100078. doi:10.1016/j.resenv.2022.100078
Carlander, J., and Thollander, P. (2023). Barriers to implementation of energy-efficient technologies in building construction projects — results from a Swedish case study. Resour. Environ. Sustain. 11, 100097. doi:10.1016/j.resenv.2022.100097
Com (2022). Towards a green, digital and resilient economy: our European Growth Model. Brussels: Press Release.
Cooke, R., Cripps, A., Irwin, A., and Kolokotroni, M. (2007). Alternative energy technologies in buildings: stakeholder perceptions. Renew. Energy 32 (14), 2320–2333. doi:10.1016/j.renene.2006.12.004
Cristino, T. M., Faria Neto, A., Wurtz, F., and Delinchant, B. (2021a). Barriers to the adoption of energy-efficient technologies in the building sector: a survey of Brazil. Energy Build. 252, 111452. doi:10.1016/j.enbuild.2021.111452
Cristino, T. M., Lotufo, F. A., Delinchant, B., Wurtz, F., and Faria Neto, A. (2021b). A comprehensive review of obstacles and drivers to building energy-saving technologies and their association with research themes, types of buildings, and geographic regions. Renew. Sustain. Energy Rev. 135, 110191. doi:10.1016/j.rser.2020.110191
Ejenakevwe, K. A., and Song, L.Asme (2021) “Review of fault detection and diagnosis studies on residential HVAC systems,” in Proceedings of ASME 2021 International mechanical engineering congress and exposition (IMECE2021), 8B.
European, C., Joint Research, C., Muench, S., Stoermer, E., Jensen, K., Asikainen, T., et al. (2022). Towards a green and digital future – key requirements for successful twin transitions in the European Union. Luxembourg: Publications Office of the European Union, 2022.
Fastighetsägarna (2024). The Swedish property federation. (Fastighetsägarna). Available at: https://www.fastighetsagarna.se/fakta/om-fastighetsbranschen---statistik-och-fakta/(Accessed March 1, 2024).
Gerrish, T., Ruikar, K., Cook, M., Johnson, M., Phillip, M., and Lowry, C. (2017). BIM application to building energy performance visualisation and management: challenges and potential. Energy Build. 144, 218–228. doi:10.1016/j.enbuild.2017.03.032
Gibbons, L., and Javed, S. (2022). A review of HVAC solution-sets and energy performace of nearly zero-energy multi-story apartment buildings in Nordic climates by statistical analysis of environmental performance certificates and literature review. Energy 238, 121709. doi:10.1016/j.energy.2021.121709
Halhoul Merabet, G., Essaaidi, M., Ben Haddou, M., Qolomany, B., Qadir, J., Anan, M., et al. (2021). Intelligent building control systems for thermal comfort and energy-efficiency: a systematic review of artificial intelligence-assisted techniques. Renew. Sustain. Energy Rev. 144, 110969. doi:10.1016/j.rser.2021.110969
Harris, N., Shealy, T., Kramer, H., Granderson, J., and Reichard, G. (2018). A framework for monitoring-based commissioning: identifying variables that act as barriers and enablers to the process. Energy Build. 168, 331–346. doi:10.1016/j.enbuild.2018.03.033
Heimar Andersen, K., Pommerencke Melgaard, S., Johra, H., Marszal-Pomianowska, A., Lund Jensen, R., and Kvols Heiselberg, P. (2024). Barriers and drivers for implementation of automatic fault detection and diagnosis in buildings and HVAC systems: an outlook from industry experts. Energy Build. 303, 113801. doi:10.1016/j.enbuild.2023.113801
Hirst, E., and Brown, M. (1990). Closing the efficiency gap: barriers to the efficient use of energy. Resour. Conservation Recycl. 3, 267–281. doi:10.1016/0921-3449(90)90023-w
Hosamo, H. H., Nielsen, H. K., Kraniotis, D., Svennevig, P. R., and Svidt, K. (2023). Digital Twin framework for automated fault source detection and prediction for comfort performance evaluation of existing non-residential Norwegian buildings. Energy Build. 281, 112732. doi:10.1016/j.enbuild.2022.112732
Jaffe, A. B., and Stavins, R. N. (1994). The energy-efficiency gap: what does it mean? Energy Policy 22 (10), 804–810. doi:10.1016/0301-4215(94)90138-4
Janda, K. B., and Parag, Y. (2013). A middle-out approach for improving energy performance in buildings. Build. Res. and Inf. 41 (1), 39–50. doi:10.1080/09613218.2013.743396
Johansson, I., Johnsson, S., and Thollander, P. (2022). Impact evaluation of an energy efficiency network policy programme for industrial SMEs in Sweden. Resour. Environ. Sustain. 9, 100065. doi:10.1016/j.resenv.2022.100065
Kangas, H.-L., Lazarevic, D., and Kivimaa, P. (2018). Technical skills, disinterest and non-functional regulation: barriers to building energy efficiency in Finland viewed by energy service companies. Energy Policy 114, 63–76. doi:10.1016/j.enpol.2017.11.060
Lane, A.-L., Boork, M., and Thollander, P. (2019). Barriers, driving forces and non-energy benefits for battery storage in photovoltaic (PV) systems in modern agriculture. Energies 12, 3568. doi:10.3390/en12183568
Lane, A.-L., Cehlin, M., and Thollander, P. (2024). Success factors and barriers for facility management in keeping nearly-zero-energy non-residential buildings energy-efficient over time. Buildings 14, 242. doi:10.3390/buildings14010242
Ma, Z., and Jørgensen, B. N. (2018). A discussion of building automation and stakeholder engagement for the readiness of energy flexible buildings. Energy Inf. 1 (1), 54. doi:10.1186/s42162-018-0061-z
Määttänen, E., Kyrö, R., Aaltonen, A., Sarasoja, A.-L., and Junnila, S. (2014). Remote energy management benefits in retail building portfolios. J. Facil. Manag. 12 (1), 56–71. doi:10.1108/jfm-09-2012-0043
Nehler, T., Thollander, P., Ottosson, M., and Dahlgren, M. (2014). Including non-energy benefits in investment calculations in industry – empirical findings from Sweden. ECEEE Ind. Summer Study. Arnh.
Nesztler, T., Kasper, D., Cieorgescu, M., Loire, S., and Mezic, I. (2016) “Uniformization, organization, association and use of metadata from multiple content providers and manufacturers: a close look at the Building Automation System (BAS) sector,” in 2016 IEEE international conference on Big data (BIG DATA), 1633–1638.
Paiho, S., Wessberg, N., Dubovik, M., Lavikka, R., and Naumer, S. (2023). Twin transition in the built environment – policy mechanisms, technologies and market views from a cold climate perspective. Sustain. Cities Soc. 98, 104870. doi:10.1016/j.scs.2023.104870
Palm, J., and Bryngelson, E. (2023). Energy efficiency at building sites: barriers and drivers. Energy Effic. 16 (2), 7. doi:10.1007/s12053-023-10088-7
Pérez-Lombard, L., Ortiz, J., and Pout, C. (2008). A review on buildings energy consumption information. Energy Build. 40 (3), 394–398. doi:10.1016/j.enbuild.2007.03.007
Persson, J., and Grönkvist, S. (2015). Drivers for and barriers to low-energy buildings in Sweden. J. Clean. Prod. 109, 296–304. doi:10.1016/j.jclepro.2014.09.094
Pritoni, M., Lin, G. J., Chen, Y. M., Vitti, R., Weyandt, C., and Granderson, J. (2022). From fault-detection to automated fault correction: a field study. Build. Environ. 214, 108900. doi:10.1016/j.buildenv.2022.108900
Rafiq, N. R., Mohammed, S. F., Pandey, J., and Singh, A. V. (2017) “Classic from the outside, smart from the inside: the era of smart buildings,” in 2017 6th International conference on reliability, infocom technologies and optimization (trends and future directions) (ICRITO), 580–584.
Rock, S., Hosseini, M. R., Nikmehr, B., Martek, I., Abrishami, S., and Durdyev, S. (2019). Barriers to “green operation” of commercial office buildings. Facilities 37 (13/14), 1048–1065. doi:10.1108/f-08-2018-0101
Rohdin, P., Thollander, P., and Solding, P. (2007). Barriers to and drivers for energy efficiency in the Swedish foundry industry. Energy Policy 35 (1), 672–677. doi:10.1016/j.enpol.2006.01.010
Solnørdal, M. T., and Thyholdt, S. B. (2019). Absorptive capacity and energy efficiency in manufacturing firms – an empirical analysis in Norway. Energy Policy 132, 978–990. doi:10.1016/j.enpol.2019.06.069
Sorrell, S., O'Malley, E., Schleich, J., and Scott, S. (2004). The economics of energy efficiency - barriers to Cost-Effective Investment. UK Northampton, MA, United States: Edward Elgar Publishing.
Syah, R. A.Ieee (2016) “IoT/Smart Building as employee gamification engine for Measurable ROI,” in 2016 International electronics symposium. IES, Denpasar, Indonesia, September 29, 2016, 395–398.
Tang, S., Shelden, D. R., Eastman, C. M., Pishdad-Bozorgi, P., and Gao, X. (2019). A review of building information modeling (BIM) and the internet of things (IoT) devices integration: present status and future trends. Automation Constr. 101, 127–139. doi:10.1016/j.autcon.2019.01.020
Thollander, P., Karlsson, M., Rohdin, P., Wollin, J., and Rosenqvist, J. (2020) “15 - barriers to energy efficiency,” in Introduction to industrial energy efficiency. Academic Press, 291–305.
Thollander, P., and Ottosson, M. (2008). An energy-efficient Swedish pulp and paper industry: exploring barriers to and driving forces for cost-effective energy efficiency investments. Energy Effic. 1 (1), 21–34. doi:10.1007/s12053-007-9001-7
Thollander, P., and Ottosson, M. (2010). Energy management practices in Swedish energy-intensive industries. J. Clean. Prod. 18 (12), 1125–1133. doi:10.1016/j.jclepro.2010.04.011
Thollander, P., and Palm, J. (2013) “Improving energy efficiency in industrial energy systems: an interdisciplinary perspective on barriers,” in Energy audits, energy management, policies, and programs. London: Springer.
Thyer, S., Thomas, S., McClintock, C., and Ridd, M. (2018). Optimising energy use in an existing commercial building: a case study of Australia’s Reef HQ Aquarium. Energy Effic. 11 (1), 147–168. doi:10.1007/s12053-017-9556-x
Trygg, L., Thollander, P., Backlund, S., and Olsson, L. (2010). Uthålliga energisystem i praktiken - implementering av energieffektivitet inom industrier.
Wang, X. L., Habeeb, R., Ou, X. M., Amaravadi, S., Hatcliff, J., Mizuno, M., et al. (2017) “Enhanced security of building automation systems through microkernel-based controller platforms,” in 2017 IEEE 37th International conference on ditributed computing systems workshops (ICDCSW), 37–44.
Woradechjumroen, D., and Li, H. (2015) “Building energy efficiency improvement via smart building solutions: introduction to methodologies,” in Proceedings of the International conference on computer information systems and industrial applications. Atlantis Press, 980–982.
Worrell, E., Blinde, P., Neelis, M., Blomen, E., and Masanet, E. (2010). Energy efficiency improvement and cost saving opportunities for the U.S. Iron and steel industry an ENERGY STAR(R) guide for energy and plant managers. United States.
Yan, B., Hao, F., and Meng, X. (2021). When artificial intelligence meets building energy efficiency, a review focusing on zero energy building. Artif. Intell. Rev. 54 (3), 2193–2220. doi:10.1007/s10462-020-09902-w
Yeatts, D. E., Auden, D., Cooksey, C., and Chen, C.-F. (2017). A systematic review of strategies for overcoming the barriers to energy-efficient technologies in buildings. Energy Res. and Soc. Sci. 32, 76–85. doi:10.1016/j.erss.2017.03.010
Zhang, S., Ocłoń, P., Klemeš, J. J., Michorczyk, P., Pielichowska, K., and Pielichowski, K. (2022). Renewable energy systems for building heating, cooling and electricity production with thermal energy storage. Renew. Sustain. Energy Rev. 165, 112560. doi:10.1016/j.rser.2022.112560
Nomenclature
BMS Building management systems
SDG United Nations Sustainable Development Goals
EET Energy-efficient technology
BEE Building energy-efficient technologies
BAS Building automation systems
FM Facility management
FDD Fault detection and diagnostics tools
BEMS Building energy management system
IoT Internet of Things
AI Artificial intelligence
BIM Building information model
Keywords: energy efficiency gap, twin transition, building automation system (BAS), building management system (BMS), energy efficiency, questionnaire, energy-efficient technology (EET)
Citation: Lane A-L, Selhammer A, Thollander P and Cehlin M (2025) Decision making about increased building automation – barriers, drivers and motivation factors. Front. Energy Res. 12:1498140. doi: 10.3389/fenrg.2024.1498140
Received: 18 September 2024; Accepted: 30 December 2024;
Published: 22 January 2025.
Edited by:
A. S. M. Monjurul Hasan, University of Technology Sydney, AustraliaReviewed by:
Elisa Marrasso, University of Sannio, ItalyMd Ahsan Kabir, Military Institute of Science and Technology (MIST), Bangladesh
Copyright © 2025 Lane, Selhammer, Thollander and Cehlin. This is an open-access article distributed under the terms of the Creative Commons Attribution License (CC BY). The use, distribution or reproduction in other forums is permitted, provided the original author(s) and the copyright owner(s) are credited and that the original publication in this journal is cited, in accordance with accepted academic practice. No use, distribution or reproduction is permitted which does not comply with these terms.
*Correspondence: Mathias Cehlin, bWF0aGlhcy5jZWhsaW5AaGlnLnNl