- 1School of Resource and Earth Science, China University of Mining and Technology, Xuzhou, China
- 2Xining Center of Natural Resources Comprehensive Survey, CGS, Xining, China
Carbon capture and its storage is widely recognized as one of the primary approaches for reducing anthropogenic carbon emissions. The role of geophysical investigation is then for the selection of a suitable site for the geological storage of CO2 and the monitoring of the injection and storage process. The monitoring of the dynamic process can both detect leakage and minimize leakage potentials. To achieve this goal, this paper suggested the use of transient electromagnetic 3D finite-difference method to help realize the geospatial quantification of in-situ CO2. First, the horizontal model and the deep saline aquifer inclined were developed to analyze the low resistivity response which is the characteristic of typical aquifers. Second, the geoelectrical modeling which demonstrates the changes at the time of the CO2 injection, can be used to examine the temporal variations in subsurface resistivity. Thus, the impact to the volumetric changes due to the CO2 injection can be quantified. The significance of the results of this study confirmed the potential of the development of efficient dynamic monitoring and boundary delineation strategies for CO2 geological storage. Finally, a geoelectrical model for leakage has been established to investigate the likely changes in the resistivity of the subsurface strata because of CO2 leakage, which is reflected in the transient electromagnetic response patterns along with the leakage paths. This contributes to the monitoring of CO2 leakage in real time as well as detecting the location of leakage. This paper provided the theorical support of the transient electromagnetic method which has the potential to capture the dynamic diffusion process of CO2 storage in a deep saline aquifer. Furthermore, it could be used to an efficient monitor of CO2 leakage and identify the leakage paths.
1 Introduction
Recently, the global warming management has widely become a priority. Countries worldwide have adopted the concept of carbon neutrality, world green and low-carbon development as a common action. The development of a green economic and carbon emission reduction have become crucial issue in contemporary times, with a potential to a significant influent the way and direction of a global economic and social development in the future. China faces several challenges in fully eliminating the use of fossil fuels such as coal, oil, and natural gas due to its energy shortage and coal-rich characteristics. Consequently, Carbon Capture, Using, and Storage (CCUS) or Carbon dioxide Capture and Storage (CCS) play an important role in China’s transition towards a low-carbon future. Accordingly, China is actively exploring and demonstrating CCUS technology (Li G. J. et al., 2012; Annual Report, 2023; Zhang et al., 2021).
Geological carbon storage is the process of injecting, captured carbon dioxide (CO₂) into underground spaces for permanent storage, so reducing CO₂ emission into the atmosphere. Underground cavities, depleted oil and gas pools, and saline aquifers are suitable subsurface spaces for geological CO₂ storage. As long as there are waterproof rock layers that prevent CO₂ from escaping, any sufficient deep formation with a sufficient pore space and permeability would be a potential storage space, Deep coal seams and saline aquifers deeper than 800 m are excellent spaces for CO2 sequestration (Yao et al., 2023; Sang et al., 2018). A process of purification, dehydration, multistage compression, and heat transforms the captured CO₂ from gas into a liquid. Tanker trucks, ships, pipelines, and other conveyance items are used to transport the liquid CO₂ the storage site, where it is injected into the target formation through injection as well as to achieve carbon storage (Li G. J. et al., 2012; Li et al., 2013; Ran et al., 2013; Li and Wei, 2013; Liu et al., 2015; Zhang, 2011).
The site selection of CO₂ storage is often based on the presence of stable regional geology, active fractures, and minimal geological movement, with the objective of reducing the likeliness of CO₂ leakage (Xu and Jiang, 2018; Li and Wang, 2022). Consequently, the preliminary geological investigation of the intended storage site is of paramount importance. On the other hand, after the CO₂ storage operations conclude, it is crucial to continue monitoring and investigating the reservoir where CO₂ is stored. This is intended to determine the trajectory of the CO₂ plume and its penetration into the underlying rock layers (Sun et al., 2023; Lu et al., 2021; Hu et al., 2019).
Reservoirs are more suitable for CO₂ storage and are usually basins or first level tectonic units characterized by wide dispersion and exceptional continuity, with depths ranging from 800 to 3,500 m. Such depths present a challenge for storage geological investigation, as well as post-storage tracking and monitoring (Gan et al., 2024; Zhang et al., 2019; Liu et al., 2023; Wang et al., 2022). The traditional drilling method can directly obtain a geological information about the tank. However, this method is also featured with its limited coverage, length labor time, and high cost. Consequently, it is highly challenging to gain an overall representation of the tank situation within a brief timeframe. In this case, the noncontact indirect geophysical method, featured with large detection depth, minimal interference, and extensive coverage, has become the preferred method for addressing the aforementioned issues.
Time Domain Electromagnetic Method (TEM) has shown the great potential as an efficient geophysical monitoring technology in the application of CCUS. This method allows for real-time monitoring of CO₂ distribution in the underground storage layers, thus providing information on its dynamic changes, which helps detect potential leakage. Additionally, TEM can assess the geological characteristics of the storage formation, such as porosity and permeability, which directly influence the storage capacity and effectiveness of CO₂. Through long-term monitoring, TEM not only contributes to ensuring the safety of storage sites but also evaluates the potential environmental impacts of CCUS projects. In recent years, China United Coalbed Methane Corporation has conducted CO₂ injection experiments in the Qinshui Basin to enhance coalbed methane recovery, which have yielded positive results. Meanwhile, in a CCUS project in North Dakota, United States, a combination of Long Offset Transient Electromagnetic Method (LOTEM) and Magneto telluric (MT) method was used for time-lapse surveys to observe changes in resistivity resulting from CO₂ injection and subsequent movement. In summary, TEM provides strong technical support for the implementation of CCUS, facilitating its application in affect the climate change (Cui et al., 2020).
These geologic anomalies existing around the tank would change its physical properties, such as density, electrical conductivity and dielectric. With geophysical methods such as the ground (in-well or inter-well) electromagnetic method, seismic, gravity, the suitability of a tank can be evaluated by minding and interpreting different parameters such as electrical conductivity, wave velocity, density, and the surrounding rock medium. Therefore, this study employed numerical simulation to establish the typical geological characteristics of the CO2 storage environment and explored its transient electromagnetic response law. By simulating the CO2 diffusion process, this study reveals its electromagnetic field response law and provides the theoretical basis for real time monitoring.
2 Theoretical foundation and numerical simulation of transient electromagnetic method
2.1 Rationale
The vertical magnetic dipole source under uniform full space conditions is expanded in the right angle coordinate system by Equation 1 (Yu et al., 2017):
where H denotes the magnetic field strength component, in A/m; E is the electric field strength in m; (x, y, z) represents the spatial position and r is the in and out distance, r = x2 + y2 + z2, in m;
The finite difference method is used to approximate the continuous variables by a system of different discrete equations containing a finite number of uncertainties. Therefore, it is necessary to establish a different format that preserves the essence of the main problem while remaining accurate. The basic for establishing the different equation is to discretize the variables and then approximate the differential quotient in the different equation and quotient. Thus, the different format is obtained for the different components of the magnetic and electric fields, as shown in Equations 2–7:
The initial moments are selected with reference to the empirical equations proposed by Wang and Hohmann (1993), as shown in Equation 8:
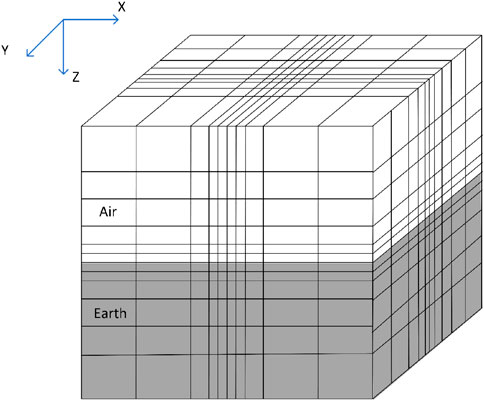
where μ0 is the vacuum permeability; σ1 denotes the air conductivity; and ∆1 is the grid step at the return line. With a non-uniform grid, a smaller spatial grid step is used near the return line source, anomalies, and measurement points to ensure computational accuracy and facilitate the extraction of observations. The grid step is gradually increased outward by a certain ratio. The air-ground boundary is treated by setting the air layer, while the Dirichlet boundary conditions are adopted as the other boundaries.
The grid subdivision of the model is shown in Figure 1. Generally, in TEM, the ratio of adjacent grid step sizes is required to be less than 1.2, and that between the largest and smallest grid sizes is limited to 20. However, the method proposed in this study can still achieve stable and reliable results when the ratio of adjacent grid step sizes exceeds 2, and no limitations have been observed on the ratio between the largest and smallest grid step sizes. Due to the allowance for larger ratios between adjacent grid step sizes and no restrictions on the maximum-to-minimum grid step ratio, a large model can be constructed with fewer grids. This makes the method highly suitable for applying Dirichlet boundary conditions (Li et al., 2022).
2.2 Validation of numerical simulations
For the based large ground fixed source device form, the emission source is located at the surface, and an analytical solution as shown in Equations 9, 10 exists when the stratigraphic medium is a homogen geologic model for:
where I is the emission current, representing the apparent resistivity of the half space; a is the radius of the emission frame, denoting the permeability of the homogeneous half space; and T is the time, counting from the time when the current is switched off, where
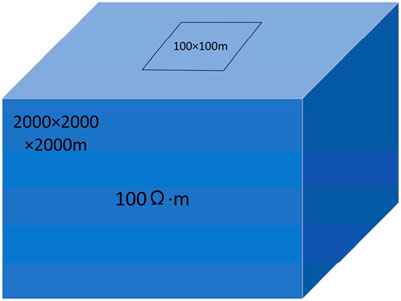
In order to verify the accuracy of the algorithm, a simple model was built with the underground half space as a homogeneous medium with a resistivity of 100 Ω−m, the transmitting Transforming coil a 100 × 100 rectangular wireframes, and the supply current being 1A, as shown in Figure 2.
Numerical and analytical solutions were computed separately according to the model.
Figure 3 (left) displays a good agreement between the relationship curves of the numerical solution and the analytical solution, while Figure 3 (right) shows that the deviations between the computed results and the analytical solution are all within 0.01, and the error decreases as the time increases. The results indicate that the numerical solution is in excellent agreement with the analytical solution, demonstrating a high computational accuracy.
3 Numerical simulation study of transient electromagnetic response characteristics in deep saline reservoirs of carbon dioxide
Currently, the more advanced treatment technology in use stores CO2 below 800 m from the surface, where CO2 is in a supercritical state, thus raising no special requirement upon pressure conditions. The main formations suitable for CO2 storage are: abandoned or commercially unproductive oil and natural gas fields, brackish aquifers in sedimentary basins, oil and gas fields under exploitation, and deep coal seams with no commercial exploitation value (Xu et al., 2005). Hydrodynamic capture is the main mechanism for storing CO2 in brackish aquifers within sedimentary basins; it is not a pure physical or chemical process but a combination of the four mechanisms mentioned above. During the process of CO2 injection, buoyancy propels a portion of CO2 to the aquifer’s surface, which is then blocked by the water barrier at the top, causing it to flow under pressure from the top to the sides. At this point, the gas-liquid interfacial tension retains a portion of CO2 in the pores of rock particles for an extended period of time. Large amounts of CO2 typically isolate themselves in the middle of the rock pores as spherical droplets, a phenomenon known as residual gas storage. As the porosity increases, the pores become more developed, allowing more CO2 to pass through and become bound in the rock pores. If there is a small geologic trap in the aquifer, CO2 would converge there to form tectonic stratigraphic storage. Formation water gradually dissolves CO2 as they come into contact with each other, a process akin to dissolution storage. The extent of this dissolution primarily hinges on the presence of a large, thick reservoir with high permeability, and fluctuates based on the ambient temperature, pressure, and mineralization of the reservoir. At the same time, CO2 would be moved around under the action of diffusion, transformation, and dispersion. This reacts chemically with the minerals around it to start mineral storage. The above process classifies tectonic stratigraphy and residual gas storage as physical storage mechanisms, and dissolution and mineral storage as chemical storage mechanisms.
3.1 Numerical simulation of the characteristics response and the deep brackish water layer
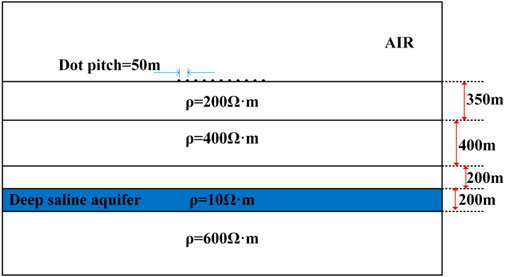
The geoelectric numerical simulation model was developed based on the aforementioned theory and the real geological conditions. The model includes a deep saline water layer, as depicted in Figure 4. The depth range of the deep saline water layer is between 950 m and 1150 m below the ground. As the depth increases, the resistivity of the ground also increases gradually. The cap layer above the deep saline water layer can be classified as a high resistance ground layer. Using this geoelectric model, a measuring line was established on the ground consisting of 11 measurement points, with each point spaced 50 m apart. A numerical simulation was conducted for this model, and the response characteristics were derived as depicted in Figure 4.
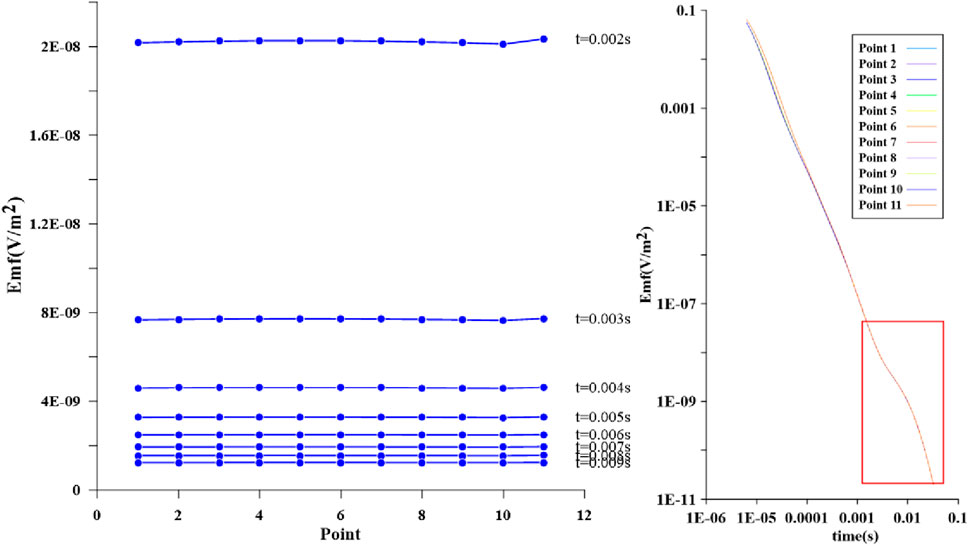
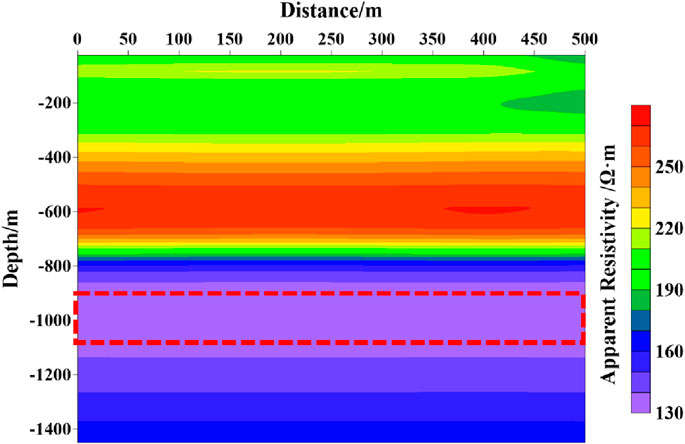
As can be seen in Figure 5 (left), that the multi-channel curve is horizontally dispersed without any irregularity undulation. The decay curve of inductive potential in Figure 5 (right) indicates that the inductive potentials of all the measurement points decrease progressively over time. At the later stage of decay, a small bulging section of the curve is clearly visible, indicated by the red box. Additionally, the decay rate of the inductive potential curve is diminished, which is a prominent feature of the low-resistive body’s response. The analysis of the apparent resistivity profile in Figure 6 reveals that the apparent resistivity is evenly distributed throughout the layer, with a progressive increase from the top to the bottom. According to the established model of the deep brackish water layer, the interface of the first layer of apparent resistivity is located at 350 m below the ground surface; that of the second layer is at 750 m below the ground surface; and the location of the low-resistive body is between 950 m and 1150 m below the ground surface. Due to the inherent low resistance of the deep brackish water layer, the apparent resistivity steadily declines from 750 m, resulting in a low resistance response in the overburden layer above the deep brackish water layer on the map.
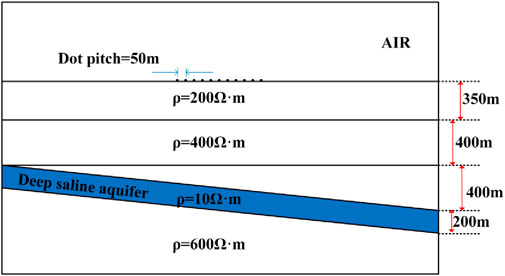
Considering the complexity and diversity of the geological underground situation, where the strata is not possibly distributed completely horizontally, a geoelectric numerical simulation model was developed for the inclined deep saline layer. As shown in Figure 7, the model covers a depth range of 750 to,350 m. By using this geoelectric model, a reference line was established on the ground consisting of 11 points with a spacing of 50 m. Subsequently, numerical simulations were conducted by using this model. The response properties are depicted in Figure 8.
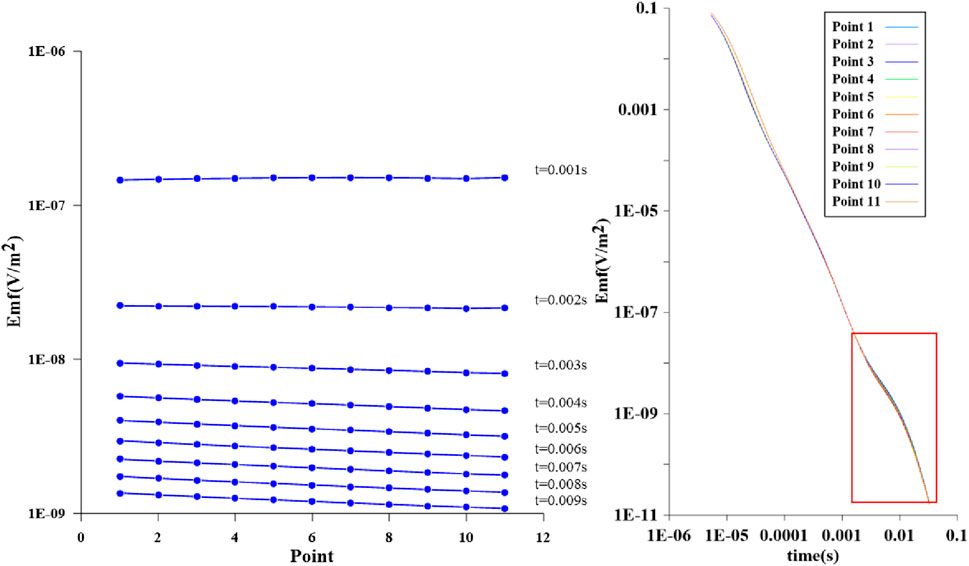
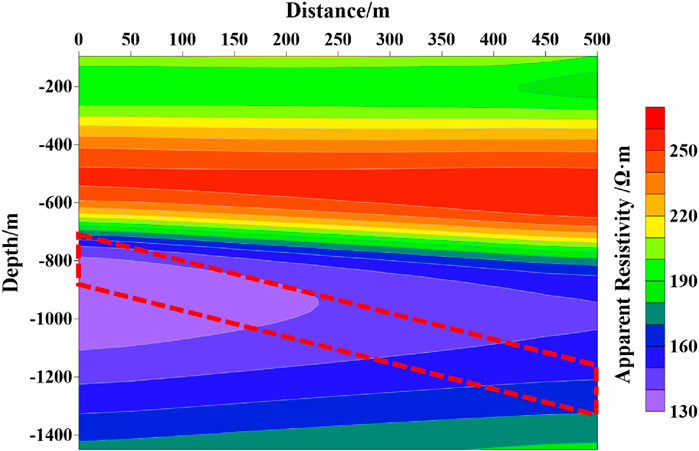
The multi-channel curves in Figure 8 (left) display a progressive shift from horizontal to inclined distribution as time progresses. This change is consistent with the inclined direction of the deep saline layer. On the other hand, the decay curves of the induced potentials in Figure 8 (right) demonstrate a gradual decay of the induced potentials at all measurement points. In the later stage of the decay period, a marginal bulge is observed in the decay curves, which differs from the horizontal model decay curve. Specifically, the bulge position of 11 measurement points is gradually backward, leading to a gradual increase in response time for the low resistance anomaly on the decay curve. This is illustrated in the red box. As opposed to the horizontal model decay curve, the 11 measurement points exhibit a progressive backward shift in their bulge positions. Consequently, the depth of the anomalies increases from left to right, leading to a gradual increase in the onset response time of the low-resistance anomalies on the decay curve, as depicted in the red box. The apparent resistivity profile in Figure 9, which aligns with the horizontal saline layer model, reveals an even distribution of apparent resistivity throughout the layer, rising gradually from the top to the bottom. Affected by the low resistance of the inclined saline layer, the interface of the first layer of apparent resistivity is located 350 m below the ground surface, while that of the second layer is situated 750 m below the ground surface. In contrast to the horizontal deep saline layer profile, the apparent resistivity contour does not move horizontally from a depth of 750 m onwards. Instead, it exhibits a downward tilt from left to right. Similarly, the apparent resistivity contour tilts downwards from left to right at depths of 1,100–1,400 m.
3.2 Numerical modeling study of CO2 geologic sequestration monitoring
The greenhouse effect caused by the large quantity of CO₂ emission has attracted worldwide attention. Geological storage of CO₂ is an effective method to mitigate its impact. The process of CO2 geological storage involves the compression of CO2 into a supercritical fluid (35°C, 11 MPa) and its subsequent storage in media such as oil wells, coal beds, and deep saline aquifers at a depth of 800 m. In this study, the primary objective is to characterize the transient electromagnetic response of CO2 injected into deep saline aquifers.
Physically, the resistivity of the deep saline layer is small. But as fluid CO2 is injected into the deep saline layer, the water in the rock pores is replaced by fluid CO2, which leads to a decrease in the electrical conductivity and an increase in the resistivity of the deep saline layer. There is a significant electrical difference with the deep saline layer where CO2 has not been injected, and the sequestration process is changing with time. Therefore, it is possible to differentiate them by transient electromagnetic methods and to monitor the degree of CO2 sequestration simultaneously.
In this study, CO2 was disposed of in a liquid landfill by storing CO2 in the form of a supercritical fluid under a low-permeability rock cap layer (e.g., mudstone, shale, etc.) and CO2 in a “sealed canister”. It is required that the storage geological body, i.e., deep water-bearing saline aquifer, should be buried at a depth of more than 800 m (at which depth CO2 is in the liquid state), the thickness of the underground saline aquifer should be more than 50 m, and that of the cap layer more than 100 m (Zhang et al., 2009). These key parameters guided the construction of the model, as shown in Table 1: 800–1,000 m below the ground is the saline aquifer, with a resistivity of 10 Ω ·m. Three overlaying layers cover the saline aquifer. The first layer, located at 0–100 m, has a resistivity of 200 m. The second layer, located at 100–500 m, has a resistivity of 150 m. The third layer, located at 500–800 m, has a resistivity of 100 m. The uniform half-space below the brackish water layer is bedrock, with a resistivity of 300 m.
Injecting CO2 into the underground brackish water layer inevitably results in changes in resistivity due to the flow of supercritical CO2. In order to simplify the analysis, the complex change of the resistivity of the brackish water aquifer is not considered for the time being. It is assumed that after the injection of CO2, the resistivity changes to 80 Ω ·m due to the reduction of water saturation of the formation. Along with the injection of CO2, the area with a resistivity of 80 Ω m gradually extends in all directions, as shown in Figure 10. In total, four CO2 injection areas were set up to simulate the change of CO2 volume with the rise of the injection time of CO2 into the deep saline aquifer. The specific size of the four injection areas is as follows: 300 m × 300 m × 200m, 500 m × 500 m × 200m, 700 m × 700 m × 200m, and 900 m × 900 m × 200 m. Three measurement lines were set up, respectively, in the CO2 injection body center directly above the center, 300 m to the right side of the center, and 500 m to the right side of the center. Each measurement line consisted of 11 measurement points with a point spacing of 200 m. Through numerical simulation, the transient electromagnetic response characteristics of the different volumes of the CO2 injection body were explored, which in turn facilitated to monitor the geological storage of CO2.
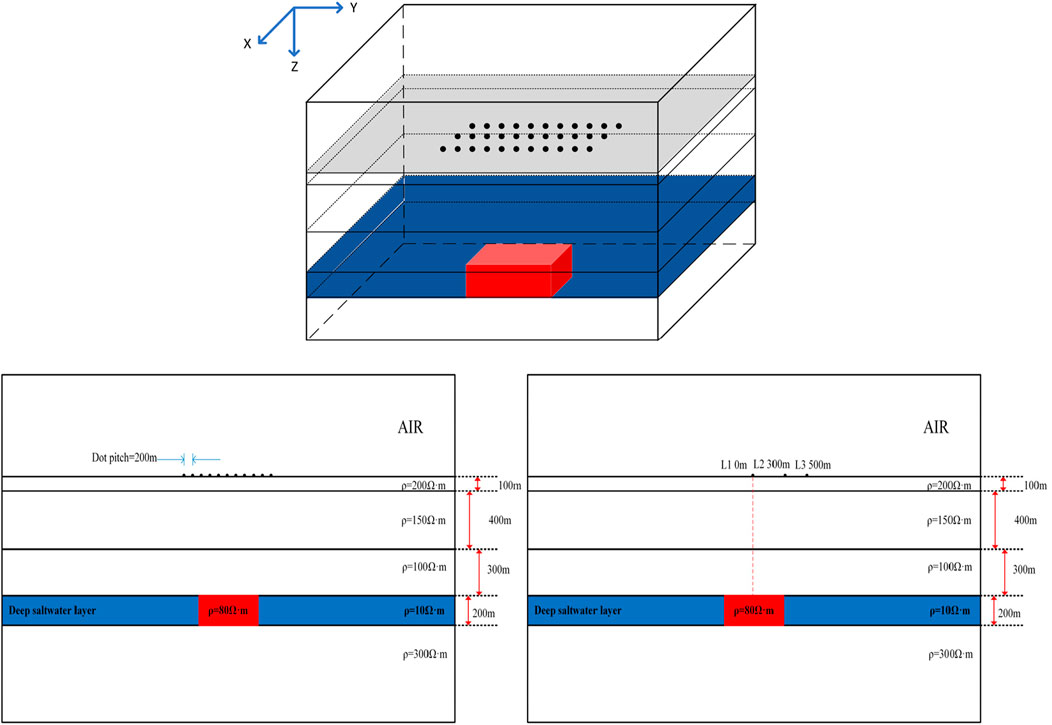
Figure 10. Model diagram and its YZ cross-section (bottom left) and XZ cross-section (bottom right).
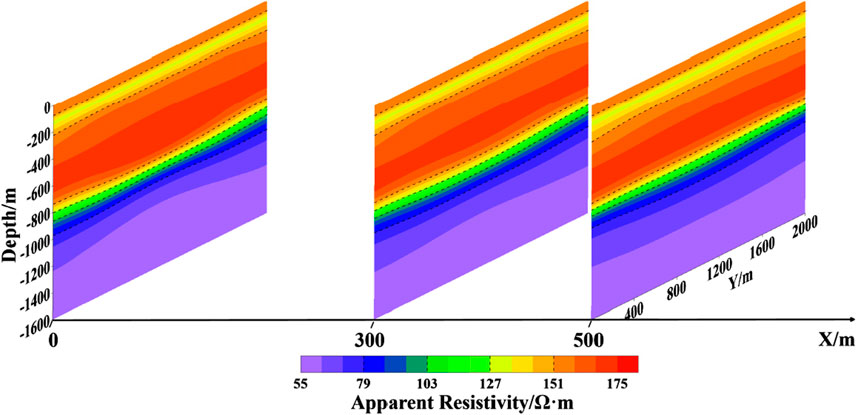
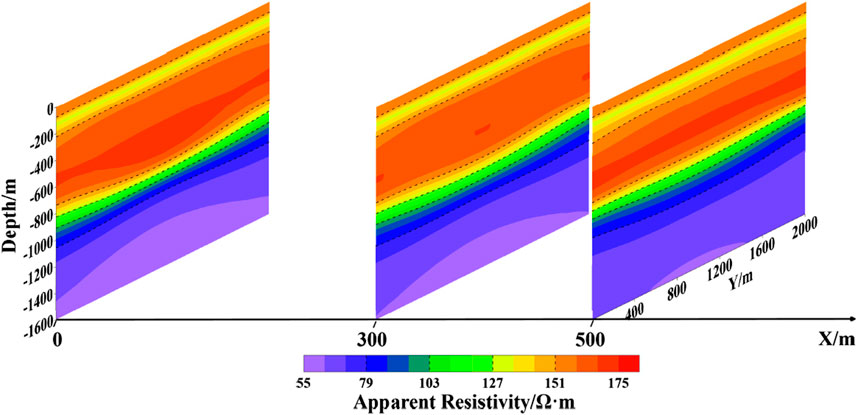
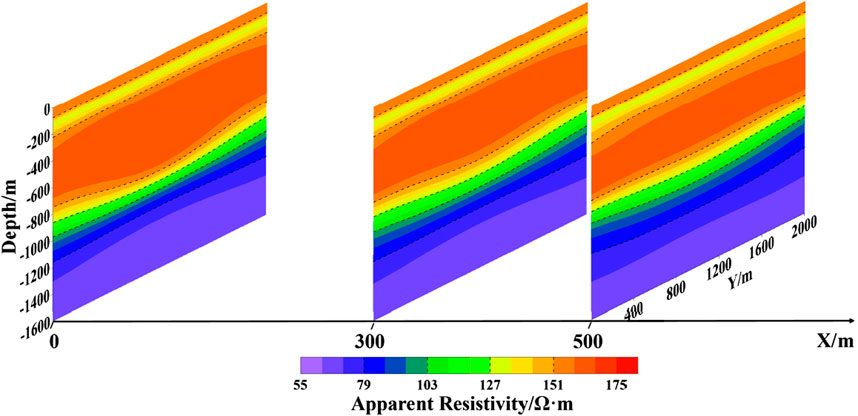
From Figures 11–15, it can be seen that the forward calculation of the initial model (i.e., the model without CO2 injection) yields the apparent resistivity, which demonstrates good stratification and consistent data across the three measurement lines without any irregularity changes. As the quantity of CO2 in the deep saline layer gradually rises, the contour lines of Measurement line 1 change. The contour lines between 800 and 1,000 m become concave, and the contour lines below 1000 m are affected by the high resistance, taking on an upward-convex shape with dense contour lines. The apparent resistivity in the middle position is higher than that at the two ends, which is a clear sign of a high resistance response. Measurement lines 2 and 3 are not situated on top of the anomaly or far away from it, resulting in a laminar response that is not immediately apparent.
When the volume reaches 500 m × 500 m, the contour of Measurement line 1 changes, displaying the same high-resistance response, but the up-convex and down-concave morphology is more powerful. The contour is dense, and the apparent resistivity in the middle position is higher than that at the two sides, which indicates an obvious high-resistance response characteristic. Due to the increased volume of the anomalies, the anomalous response begins to appear in Measurement lines 2 and 3. When the injection of CO2 reaches 700 and 900 m in length and width, the anomalous response of Measurement line 1 intensifies, leading to further concavity in the apparent resistivity contours. Conversely, the high resistance more strongly affects the part of the apparent resistivity profile below 1,000 m. The value of the apparent resistivity gradually rises, which is shown by the profile’s color gradually becoming bluer and deeper. Simultaneously, the responses of Measurement lines 2 and 3 also gradually intensify, which can play a role in determining the boundary of the CO2 injector.
3.3 Numerical simulation study of CO2 leakage from geological storage
As CO2 is sequestered into the subsurface, the changes in time, strata movement, and the effects of anthropogenic activities lead to the emergence of fissures in the overlying layers of the deep brackish water layer. These fissures result in the escape of CO2 outward, causing leakage. The escaped CO2 may leak upward along the crack channels; and due to the pressure reduction in the overlying strata, its form would also transform from fluid to gas. At this point, CO2 fills the pore water of the overlying formation, increases the resistivity of the rock layer, and creates a clear electrical difference with the original rock layer, thus allowing to detect CO2 leakage with TEM.
Based on the information given above about CO2 leakage, a numerical model was established. The saline aquifer that is 800–1,000 m below the ground has a resistivity of 80 Ω ·m. The overlay contains three layers of saline water: the surface layer, located between 0 and 100 m, has a resistivity of 200 Ω ·m; the second layer, located between 100 and 500 m, has a resistivity of 150 Ω ·m; and the third layer, located between 500 and 800 m, has a resistivity of 100 Ω ·m. This layer, along with the uniform half space below the bedrock, has a resistivity of 300 Ω ·m. The resistivity of the CO2 leakage area is set to 1,000 Ω ·m. At a distance of 800m, the resistivity is set to 100 Ω ·m. The same layer of brackish water and the uniform half-space below, known as bedrock, have a resistivity of 300 Ω ·m.
Figure 16 displays the CO2 leakage model which was established based on the relevant parameters mentioned above. Three measurement lines were set up at three different positions: directly above the center of the CO2 injection body, 300 m to the right side of the center, and 500 m to the right side of the center. Each line consisted of 11 measurement points spaced 200 m apart. The transient electromagnetic response characteristic of CO2 leakage were investigated through numerical simulation.
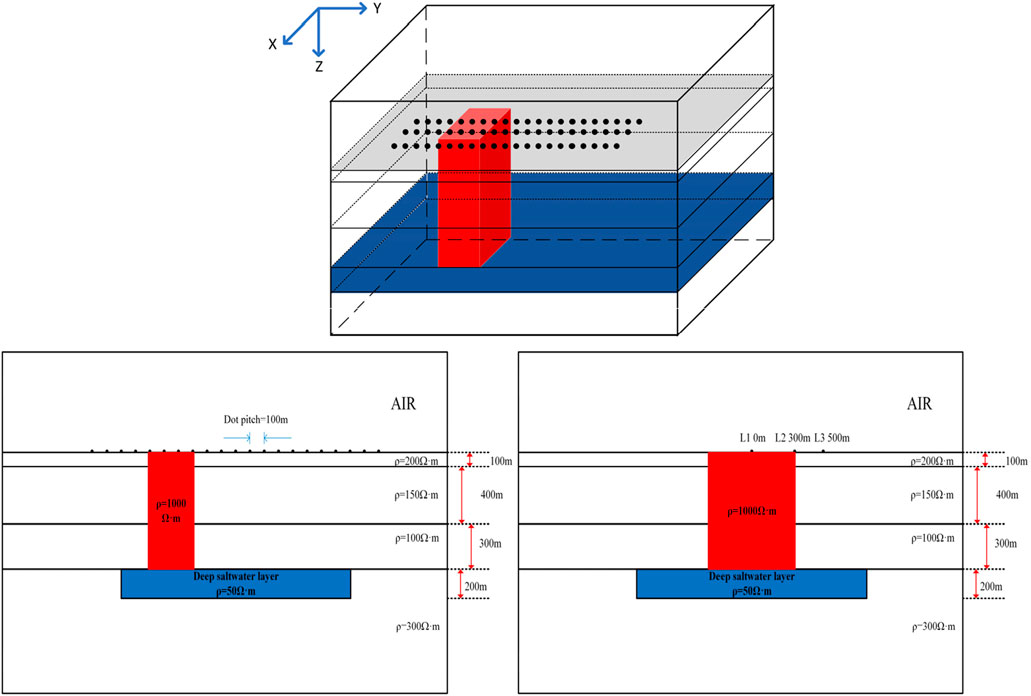
Figure 16. Model diagram and its YZ cross-section (bottom left) and XZ cross-section (bottom right).
It can be seen from Figures 17, 18 that when there is no CO2 leakage, the apparent resistivity profile displays a very good laminar distribution. As CO2 leaks out, a clear high-resistance region appears, with the strongest high-resistance response right above the leakage location. The high-resistance irregularity response gradually decreases as it moves away from the leakage location. In this case, the location of the CO2 leakage channel can be determined clearly.
4 Conclusion
(1) Horizontal and inclined models of the deep underground saline water layer were established to investigate the geological siting problem of CO2. These models exhibit good low-resistance response characteristics, and the results of the apparent resistivity profiles demonstrate an improved layering effect, making it possible to accurately observe the morphology distribution of the deep underground saline water layer.
(2) To investigate the monitoring of CO2 geological storage, a geoelectric model that varies with the CO2 injection time was established. This model can be used to approximate the change in underground resistivity while monitoring the dynamic storage of CO2. Similarly, it can also be employed to simulate the change in underground resistivity as the amount of CO2 injection changes. This model is useful for both dynamic monitoring and boundary delineation in CO2 geological storage.
(3) To study CO2 leakage, a geoelectric model was established after geological storage. The model investigates the resistivity change trend of underground rock layers during CO2 leakage and the transient electromagnetic response law of the leakage channel. This allows for real-time monitoring and localization analysis of the leakage channel.
Data availability statement
The raw data supporting the conclusions of this article will be made available by the authors, without undue reservation.
Author contributions
HY: Writing–original draft, Writing–review and editing. MS: Data curation, Investigation, Software, Writing–original draft. HZ: Investigation, Writing–review and editing. KM: Writing–review and editing. YX: Visualization, Writing–review and editing. RC: Formal Analysis, Writing–review and editing. ZL: Methodology, Writing–review and editing.
Funding
The author(s) declare that financial support was received for the research, authorship, and/or publication of this article. The authors acknowledge the financial support from the National Natural Science Foundation of China (Grant No. 42374082, 42230811) and the Fundamental Research Funds for the Central Universities (Grant No. 2024KYJD 2009).
Conflict of interest
The authors declare that the research was conducted in the absence of any commercial or financial relationships that could be construed as a potential conflict of interest.
Publisher’s note
All claims expressed in this article are solely those of the authors and do not necessarily represent those of their affiliated organizations, or those of the publisher, the editors and the reviewers. Any product that may be evaluated in this article, or claim that may be made by its manufacturer, is not guaranteed or endorsed by the publisher.
References
Annual Report (2023). Annual Report on carbon dioxide capture utilization and storage (CCUS) in China (2023) released. Polyvinyl chloride 51 (8), 42. doi:10.3969/j.issn.1009-7937.2023.08.013
Cui, F. Z., Zhou, T., and Zhang, B. (2020). Exploration of transient electromagnetic monitoring technology for CO2 injection and migration in coal seams. Geophys. Geochem. Explor. 44 (3), 573–581. doi:10.11720/wtyht.2020.1429
Gan, M. G., Lei, H. W., Zhang, L. W., Li, X. C., and Li, Q. (2024). Quantitative evaluation method for wellbore leakage risk in CO2 geological storage projects based on numerical simulation. Eng. Sci. Technol. 56 (01), 195–205. doi:10.15961/j.jsuese.202201228
Hu, Y. L., Hao, M. Q., Chen, G. L., Sun R, Y., and Li, S. (2019). Technologies and practice of CO2 flooding and sequestration in China. Petroleum Explor. Dev. 46 (4), 753–766. doi:10.1016/s1876-3804(19)60233-8
Li, F., Wen, L. F., and Zheng, G. Q. (2022). Half space TEM three-dimensional FDTD forward modeling based on full space initial field source. Prog. Geophys. 37 (5), 2147–2155. doi:10.6038/pg2022FF0554
Li, H. F., and Wang, Q. (2022). Research on CO2 utilization and geological storage in CCUS. Mod. Chem. Ind. 42 (10), 86–90+95. doi:10.16606/j.cnki.issn0253-4320.2022.10.017
Li, H. Y., Peng, S. M., Xu, M. Y., Luo, C., and Gao, Y. (2013). CO2 storage mechanism in deep saline aquifers. Science& Technol. Rev. 31 (2), 72–79. doi:10.3981/j.issn.1000-7857.2013.02.010
Li, Q., and Wei, Y. N. (2013). Progress in combination of CO2 geological storage and deep saline water recovery. Sci. and Technol. Rev. 31 (27), 65–70. doi:10.3981/j.issn.1000-7857.2013.27.010
Li, Y. M., Pang, Z. H., Li, J., and Kong, Y. L. (2012). CO2 sequestration and utilization in deep saline aquifers. Science& Technol. Rev. 30 (19), 70–79. doi:10.3981/j.issn.1000-7857.2012.19.011
Li G. J, G. J., Zhang, J., Li, X. C., and Jia, L. (2012). Analysis of the roadmap for carbon dioxide capture and storage technology and its implications. Sci. Technol. Manag. Res. 32 (12), 17–19. doi:10.3969/j.issn.1000-7695.2012.07.005
Liu, S. Q., Huang, F. S., Du, R. B., Chen, S. H., Guan, Y. T., Liu, Y. H., et al. (2023). Progress and typical case analysis of CO2 geological storage and utilization demonstration projects. Coal Geol. Explor. 51 (02), 158–174. doi:10.3969/j.issn.1001-1986.2023.02.012
Liu, Z. J., Zhang, N., and Zhang, F. J. (2015). Reviewing CO2 geological storage technologies and chemical behaviors of isotope in salty water layer. Sci. Technol. Rev. 33 (11), 108–113. doi:10.3981/j.issn.1000-7857.2015.11.019
Lu, Y. Y., Zhou, J. P., Xian, X. F., Tang, J. R., Zhou, L., Jiang, Y. D., et al. (2021). Progress and prospects of integrated research on supercritical CO2 enhanced shale gas extraction and geological storage. Nat. Gas. Ind. 41 (06), 60–73. doi:10.3787/j.issn.1000-0976.2021.06.007
Ran, L. N., Wu, Z. D., and Han, B. J. (2013). Utilization and development of salt caverns in the field of energy underground storage. Sci. and Technol. Rev. 31 (35), 76–79. doi:10.3981/j.issn.1000-7857.2013.35.014
Sang, S. X. (2018). Review on the effectiveness of carbon dioxide geological storage and enhanced development of coalbed methane. Coal Geol. Explor. 46 (5), 1–9. doi:10.3969/j.issn.1001-1986.2018.05.001
Sun, J., Liu, K., Tan, K. L., Lin, Z. Y., Sang, S. X., Xu, H., et al. (2023). Preliminary study on the construction of GIS basic data platform for CO2 geological storage. J. China Coal Soc. 48 (07), 2936–2948. doi:10.13225/j.cnki.jccs.CN23.0259
Wang, T., and Hohmann, G. W. (1993). A finite-difference, time-domain solution for three-dimensional electromagnetic modeling. Geophysics 58 (1), 797–809. doi:10.1190/1.1443465
Wang, Z. J., Tang, X., Jing, T. Y., You, M. X., Zhang, J. C., Li, Z., et al. (2022). Site selection strategy for CO2 geological storage with an annual storage capacity of millions of tons in China. Géoscience 36 (05), 1414–1431. doi:10.19657/j.geoscience.1000-8527.2022.044
Xu, J., Zhang, J. Y., Pan, X., and Zheng, C. G. (2005). Research status of carbon dioxide storage technology. Coal Convers. 28 (3), 80–86. doi:10.3969/j.issn.1004-4248.2005.03.020
Xu, R. N., and Jiang, P. X. (2018). Research progress on CO2 geological storage and utilization technology. China Basic Sci. 20 (04), 44–48. doi:10.3969/j.issn.1009-2412.2018.04.008
Yao, Y. B., Sun, X. L., and Wan, L. (2023). Study on the microscopic mechanism of coal seam CO2 geological storage. Coal Geol. Explor. 51 (2), 146–157. doi:10.3969/j.issn.1001-1986.2023.02.011
Yu, X., Wang, X. B., Li, X. J., Lin, X. J., Yang, F., and Tang, M. E. (2017). Research on three-dimensional finite difference forward modeling technique of time-domain transient electromagnetic method. Chin. J. Geophys. 60 (2), 810–819. doi:10.6038/cjg20170231
Zhang, B., Liang, K. Q., Wang, W. B., Chen, L. L., and Wang, H. (2019). Evaluation of effective geological storage potential of CO2 in deep saline water layers of ordos basin. Unconv. Oil Gas 6 (03), 15–20. doi:10.3969/j.issn.2095-8471.2019.03.003
Zhang, D. P. (2011). CO2 Flooding enhanced oil recovery technique and its application status. Sci. and Technol. Rev. 29 (13), 75–79. doi:10.3981/j.issn.1000-7857.2011.13.011
Zhang, E. Y., Li, X. F., He, J., and Zhang, F. C. (2009). Research on key technologies for CO2 storage in brackish aquifers. Ground Water 31 (03), 15–19. doi:10.3969/j.issn.1004-1184.2009.03.005
Keywords: transient electromagnetic method, finite difference, deep saline aquifer, CO2 geologic sequestration, CO2 leakage
Citation: Yang H, Sun M, Zhao H, Mohamed K, Xu Y, Che R and Li Z (2024) Numerical simulation on CO2 geology storage based on transient electromagnetic theory. Front. Energy Res. 12:1494735. doi: 10.3389/fenrg.2024.1494735
Received: 11 September 2024; Accepted: 27 November 2024;
Published: 19 December 2024.
Edited by:
Marwan Fahs, National School for Water and Environmental Engineering, FranceReviewed by:
Zhen Huang, Jiangxi University of Science and Technology, ChinaHaibo Wu, Anhui University of Science and Technology, China
Copyright © 2024 Yang, Sun, Zhao, Mohamed, Xu, Che and Li. This is an open-access article distributed under the terms of the Creative Commons Attribution License (CC BY). The use, distribution or reproduction in other forums is permitted, provided the original author(s) and the copyright owner(s) are credited and that the original publication in this journal is cited, in accordance with accepted academic practice. No use, distribution or reproduction is permitted which does not comply with these terms.
*Correspondence: Haibo Zhao, dGlnZXJfemhhb2hiQDE2My5jb20=
 Haiyan Yang
 Menglang Sun
 Haibo Zhao2*
 Koulibaly Mohamed
 Rongqi Che