- State Grid Gansu Electric Power Company, Lanzhou, China
Currently, the time-of-use pricing model for electricity focuses on a single objective, often overlooking various factors that influence electricity costs. This oversight can lead to significant disparities in peak and off-peak electricity usage within the distribution network following optimization. Therefore, a new time of using electricity price optimization method is proposed that takes into account the losses of distributed photovoltaic access to the distribution network. Considering the topology structure of the distribution network after the integration of distributed photovoltaic, this paper calculates the comprehensive losses generated by the operation of the distribution network. Also, this paper constructs a time of use electricity price optimization mathematical model with the objectives of minimizing network loss, minimizing load variance, minimizing peak valley difference of equivalent load, and maximizing user satisfaction. And refer to the basic requirements for electricity pricing in the distribution network, set a series of constraints for optimizing electricity prices. Applying an improved imperialist competition algorithm this paper integrates Tent chaotic reverse learning to solve a multi-objective optimization model and obtain an optimized time of use electricity pricing plan. The experimental results show that after the implementation of this optimization method, the peak valley difference of the daily power load curve of the distribution network is only 350 MW, demonstrating superior peak shaving and valley filling effects.
1 Introduction
Time of use electricity pricing strategy, as an effective demand side management tool, can guide users to adjust their electricity consumption behavior reasonably by setting different electricity prices at different time periods, reducing peak valley differences, improving load rates, and thereby reducing the power supply pressure on the distribution network. However, with the large-scale integration of distributed photovoltaics into the distribution network, while changing the power flow distribution of the distribution network (Pang et al., 2023), it also affects the loss of lines and the stability of power supply. The current time of use electricity price adjustment method is difficult to adapt to this operating scenario.
In recent years, the increasing integration of renewable energy sources, especially distributed photovoltaics, has introduced significant changes to the way distribution networks operate. These changes not only influence power flows but also increase operational complexity, impacting line losses and the stability of power supply. Traditional time of use electricity pricing models mainly focus on reducing peak loads but often fail to account for these new variables introduced by distributed energy sources. Therefore, there is an urgent need for a multi-objective optimization method for time of use electricity pricing that fully considers the effects of distributed photovoltaic access, line losses, and user consumption behavior. This new approach will help to better balance grid efficiency, reduce operational costs, and improve system reliability under the current energy landscape.
Scholars have conducted extensive research on electricity price optimisation strategies, and the factors considered mainly include both cost and user demand. On the cost side, factors such as coal consumption rate and cost structure were considered; on the user side, aspects such as user behavior and user dynamic demand were considered (Yu et al., 2024; Wang et al., 2024; Ren et al., 2024; Zhan et al., 2024). Yu X et al. proposed a method for optimizing electricity prices by considering consumer psychology and the coal consumption rate on the power generation side (Yu et al., 2024). However, the optimization model focuses on the analysis of peak periods and ignores the long-term impact of non peak periods on the coal consumption rate of the power generation side, resulting in high long-term operating costs of the power system after the implementation of this optimization method. Wang Dai et al. proposed a time of use electricity price optimization method based on a diversified cost structure (Wang et al., 2024), which deeply analyzes the fixed and variable costs of power system operation. However, there are differences in the sensitivity and response methods of different user groups to changes in electricity prices, which makes it difficult to predict user response behavior and leads to deviations between the actual and expected effects of current electricity price optimization strategies.
The primary methods employed in the study of electricity pricing consist of optimization modeling approaches and game theory analysis. Optimization models for electricity pricing are commonly developed using swarm intelligence algorithms, such as particle swarm optimization (PSO) and genetic algorithms (GA), or other advanced algorithms. Ren Hengyu et al. proposed a time of use electricity price optimization method based on time-varying price elasticity matrix (Ren et al., 2024), which utilizes fuzzy membership theory to divide the peak and valley periods of distribution network operation. A price elasticity matrix is then established to evaluate the dynamic demand response of users at different time periods. The method constructs a multi-objective electricity pricing optimization model with the goal of minimizing peak valley difference and maximizing user satisfaction, using non dominated sorting genetic algorithm to solve for the optimal pricing result. However, the implementation of this optimization strategy requires the electricity market to have a high level of informatization and intelligence, as well as a sound measurement and monitoring system, which leads to significant limitations in its application. Cai Zhan et al. proposed a time of use electricity price optimization method based on load transfer (Zhan et al., 2024), which considers the cost-benefit of electricity sales companies and the cost of load transfer for electricity users, and establishes a two-layer time of use electricity price optimization model. By using adaptive learning algorithms to solve the model, a power pricing scheme that meets optimization requirements can be obtained (Dengfeng et al., 2024). However, this optimization strategy involves complex mathematical models and algorithms, resulting in poor real-time response capability of the time of use electricity price optimization method.
To address the limitations of existing methods, a new method for optimizing time of use electricity prices is proposed, which fully accounts for the losses associated with distributed photovoltaic integration into distribution networks. This method involves a comprehensive analysis of the impact of distributed photovoltaic access on line losses and establishes a dynamic network loss calculation scheme. By considering factors such as network loss, user satisfaction, minimum load variance, and equivalent load peak valley difference, establish a time of use electricity price optimization model, a time-of-use electricity price optimization model is established, and the model is then solved using an improved imperialist competition algorithm to generate the optimal time-of-use electricity pricing strategy.
2 Optimization method for time of use electricity price considering losses in distributed photovoltaic access distribution network design
2.1 Calculate the loss of distributed photovoltaic access to the distribution network
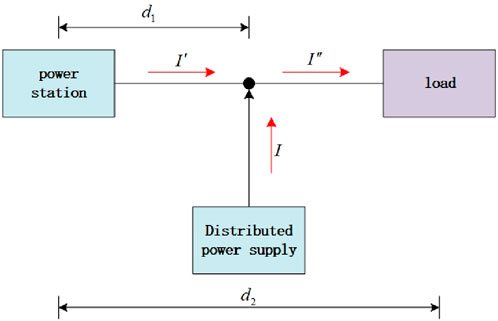
After the distributed photovoltaic power source is connected to the distribution network, in order to observe the changes in system network losses, a simple model as shown in Figure 1 is established by referring to the connection form of the distribution network topology.
In Figure 1,
The relationship between the three current parameters marked in the distribution network model can be expressed as:
Based on the parameters given in Formula 1, two types of key network losses generated during the operation of distributed photovoltaic access distribution networks can be derived (Dengfeng et al., 2024)
In the formula,
By combining the two types of losses, the comprehensive losses generated by the operation of distributed photovoltaic access to the distribution network can be calculated (Wan et al., 2022).
In the formula,
2.2 Constructing a multi-objective optimization model for time of use electricity pricing
When constructing the time of use electricity price optimization model, which accounts for the losses caused by distributed photovoltaic integration into the distribution network, the first optimization objective function is defined as follows:
In the equation,
Subsequently, starting from the three aspects of load variance, equivalent load peak valley difference, and user satisfaction, the optimization objective functions of time of use electricity price are given respectively:
In the given,
Combine the four objective functions given in Formulas 2–5 to generate a multi-objective optimization model for time of use electricity pricing.
2.3 Set constraints for optimizing time of use electricity prices
To ensure the smooth implementation of the time of use electricity price optimization method obtained by the multi-objective optimization model, considering the requirements of electricity pricing optimization (He et al., 2022), time of use electricity price optimization constraints are proposed for the three aspects of power supply company revenue, electricity consumption, and user satisfaction to assist in the subsequent optimization model solving. Changes in power supply companies can directly impact residents' electricity costs and consumption, in order to avoid affecting people’s normal daily activities. In the process of optimizing time of use electricity prices, it is necessary to ensure stable revenue (Li et al., 2022).
In the formula,
At the same time, in order to ensure the stability of power consumption and user satisfaction in the distribution system, time of use electricity price optimization constraints are set for both, as shown in Formulas 6, 7 (Li et al., 2022).
In this formula,
2.4 Solving the optimal time of use electricity pricing plan
After determining the constraints of time of use electricity price optimization in the distribution network, an improved imperialist competition algorithm combined with Tent chaotic reverse learning algorithm (Zhang et al., 2022) is used to solve the multi-objective optimization model and generate the optimization setting results of time of use electricity price. The imperialist competitive algorithm (ICA), proposed by Atashpaz and Lucas in 2007, is an intelligent optimization algorithm based on the mechanism of imperialistic competition (Atashpaz-Gargari and Lucas, 2007). Compared to other optimization algorithms, ICA demonstrates superiority in terms of computational efficiency and optimization performance. In the actual solving process, multiple parameters such as maximum iteration times, number of empires, and number of colonies are set based on the daily load data and line operation parameters of the distribution network. Each time of use electricity price optimization scheme is treated as an initialization population individual (Bai et al., 2021), and the chaotic sequence values corresponding to each individual in the initial population are obtained through Tent mapping operation (Bai et al., 2021).
In the formula,
By inverse mapping the chaotic sequence using Formula 8, the initial position of individual countries can be derived as follows (Bai et al., 2021):
In the equation,
In the formula,
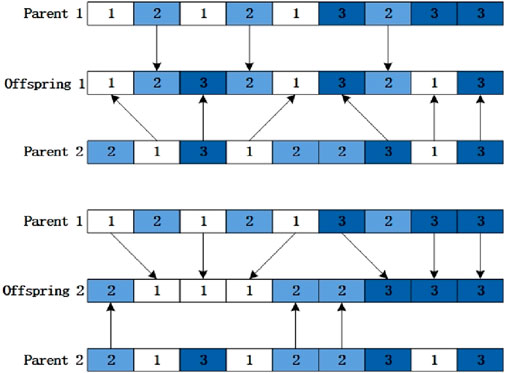
Through assimilation and reform, the colonies within the empire are replaced to increase group diversity. On this basis, multiple empire groups are controlled to compete with each other. If the competition fails, the empire will perish. If the competition succeeds, the remaining colonies will be merged to enhance the empire’s power value until the algorithm termination condition is met. The empire with the highest current power value will be found, and its corresponding time of use electricity price optimization scheme will be the optimal solution of the model.
3 Experiment
3.1 Set up experimental environment
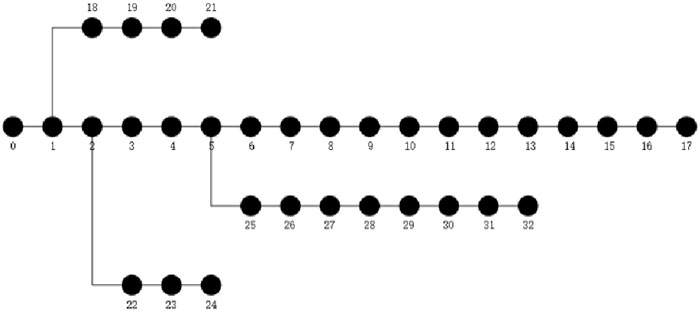
After considering the losses of distributed photovoltaic access to the distribution network, a new time of use electricity price optimization method was designed. In order to test the practical application effect of this method, referring to the distribution network structure shown in Figure 4, a power experimental system consisting of 33 nodes was built using an experimental institution.
At nodes 17 and 28, distributed photovoltaic power sources were respectively connected, and the final experimental scene is shown in Figure 5.
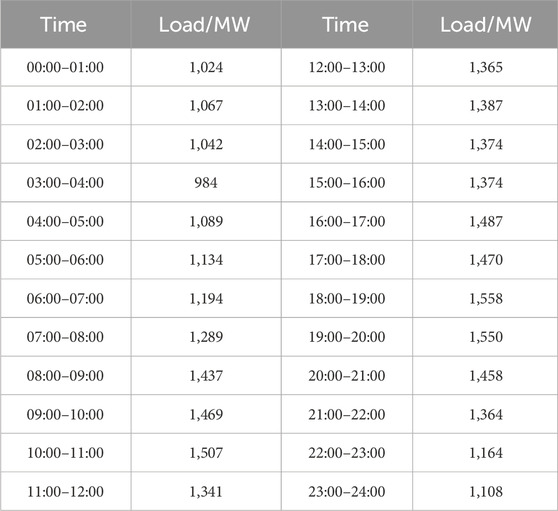
All nodes in the distribution network, except for node 0, are treated as residential load nodes. The typical daily load data of residents, as shown in Table 1, were obtained from the power supply bureau and injected into the distribution network. A simulation of the normal operation mode of distributed photovoltaic integration into the distribution network was then performed.
From the daily load data provided in Table 1, it can be seen that there are significant differences in residential electricity consumption at different times. In order to facilitate the optimization of time of use electricity prices, the entire operation period of the distribution network is divided into three periods. Among them, the peak period is from 07:00 to 11:00 and from 17:00 to 21:00, the valley period is from 24:00 to 03:00 and from 03:00 to 06:00 the next day, and the normal period is from 12:00–16:00 and from 22:00 to 23:00.
Apply the newly designed time of use electricity price optimization method, time of use electricity price optimization method based on multiple cost structure, and time of use electricity price optimization method based on time-varying price elasticity matrix to experimental scenarios, generate new time of use electricity price formulation strategies, and implement the new strategies to test the application performance of various methods.
3.2 Loss of photovoltaic access to distribution network
When analyzing the losses of photovoltaic access to the distribution network, the access capacity of two distributed photovoltaic power sources is set to be fixed and unchanged, while the power factors are taken as 1, 0.9, 0.8, 0.7, and 0.6 respectively. The changes in network losses under different power factors are observed, and the statistical results shown in Figure 6 are obtained.
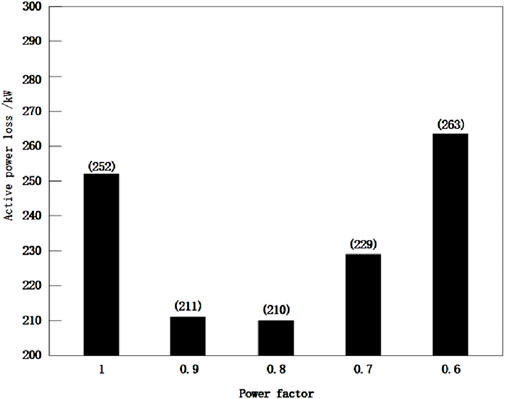
Figure 6. Loss of distributed photovoltaic access to distribution network under different power factors.
From Figure 6, it can be seen that when the power factor value is 0.6, the maximum loss of distributed photovoltaic access to the distribution network reaches 263 kW. When the power factor is 0.8, the active power loss of the power grid is only 210 kW, and the operating loss of the distribution network is the lowest at this time. According to the analysis results, adjust the topology structure of the distribution network in the experimental scenario, and based on this, carry out subsequent optimization of time of use electricity prices.
3.3 Time of use electricity price optimization plan
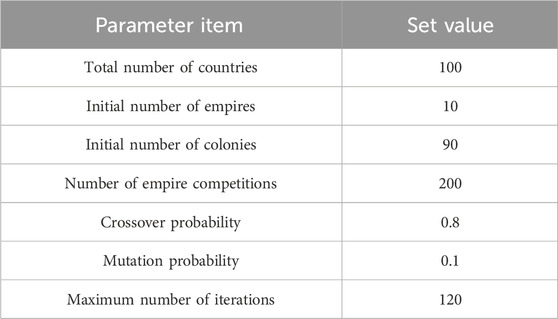
After constructing a multi-objective time of use electricity price optimization model, the optimal solution of the model can be obtained by improving the imperialist competition algorithm. In the process of determining the optimal time of use electricity pricing plan, the parameter settings related to improving the imperialist competition algorithm are shown in Table 2.
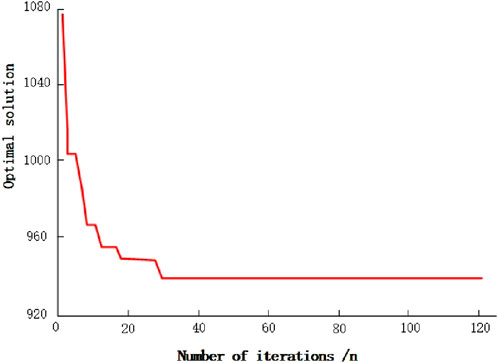
Complete the basic parameter layout according to Table 2, and based on this, solve the multi-objective time of use electricity price optimization model, and finally obtain the optimal solution variation curve as shown in Figure 7.
As shown in Figure 7, after 30 repetitions of the improved imperialist competition algorithm, the optimal solution obtained meets the requirement of stable convergence. After meeting the termination criteria for iteration, an optimized time of use electricity pricing plan is obtained, which is 0.5 yuan (kW⋅h)−1 during normal periods, 0.245 yuan (kW⋅h)−1 during valley periods, and 0.81 yuan (kW⋅h)−1 during peak periods.
3.4 Performance comparison of optimization methods
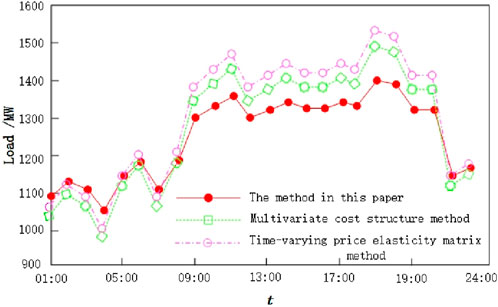
From the above tests, it can be seen that the new research on time of use electricity price optimization method is feasible. Subsequently, two additional methods were applied to optimize electricity pricing, and the optimization strategies proposed by the three methods were implemented separately, resulting in the daily load curve of the distribution network shown in Figure 8.
From Figure 8, it can be seen that after implementing the time of use electricity price optimization method that takes into account the losses of distributed photovoltaic access to the distribution network, the peak to valley difference of the power load curve is only 350 MW. Compared with the peak to valley difference of 574 MW before optimization, and the peak to valley differences of 502 MW and 534 MW presented by the other two methods after optimization, there has been a significant reduction. This proves that the new research optimization method has superior peak shaving and valley filling effects.
4 Conclusion
The study proposed a novel multi-objective optimization method for time of use electricity prices, taking into account the losses associated with distributed photovoltaic access in distribution networks. Through in-depth analysis, it was determined that the integration of distributed photovoltaic systems alters the power flow distribution, increases line losses, and affects the overall stability of power supply. By incorporating these factors into the time of use electricity price optimization model, the proposed approach demonstrated significant improvements in reducing system losses, minimizing load variance, and enhancing user satisfaction. The use of intelligent algorithms, such as the improved imperialist competition algorithm, further optimized the pricing strategies, ensuring that both peak shaving and valley filling were effectively achieved.
The experimental results showed that after applying the proposed optimization method, the peak-valley difference of the power load curve was significantly reduced to 350 MW, compared to the 574 MW before optimization. This underscores the effectiveness of the method in balancing electricity demand across different time periods. Furthermore, the study highlights the importance of considering multiple objectives, including network losses, user behavior, and system operational constraints, when designing pricing strategies for modern distribution networks.
In practice, this optimization method provides valuable insights for policymakers, electricity providers, and grid operators. It enables a more efficient and sustainable approach to electricity pricing, which is particularly critical as renewable energy sources like photovoltaics become more prevalent. By addressing the challenges associated with distributed generation, this research contributes to the broader goal of achieving a more reliable, resilient, and cost-effective power system.
Data availability statement
The datasets presented in this article are not readily available because we used few data in the paper, so there is no need to share the data. Requests to access the datasets should be directed to Tianshou, Li. MTU5NTE5MDAzODhAMTYzLmNvbQ==.
Author contributions
TL: Investigation, Formal Analysis, Writing–original draft, Methodology. QX: Writing–original draft, Software, Methodology. WL: Writing–review and editing, Supervision. XW: Writing–original draft, Data curation. ZL: Writing–review and editing, Visualization, Conceptualization.
Funding
The author(s) declare that financial support was received for the research, authorship, and/or publication of this article. This research was supported by Technical service Project of State Grid Jiangsu Electric Power Co., Ltd. (Grant No. W24FZ2730030). The funder was not involved in the study design, collection, analysis, interpretation of data, the writing of this article, or the decision to submit it for publication.
Conflict of interest
Authors TL, QX, WL, XW, and ZL were employed by State Grid Gansu Electric Power Company.
Publisher’s note
All claims expressed in this article are solely those of the authors and do not necessarily represent those of their affiliated organizations, or those of the publisher, the editors and the reviewers. Any product that may be evaluated in this article, or claim that may be made by its manufacturer, is not guaranteed or endorsed by the publisher.
References
Atashpaz-Gargari, E., and Lucas, C. (2007) “Imperialist competitive algorithm: an algorithm for optimization inspired by imperialistic competition,” in IEEE congress on evolutionary computation. Singapore: IEEE, 4661–4667. doi:10.1109/cec.2007.4425083
Bai, X., Zhang, R., and Xu, L. (2021). Research on the optimization strategy of time of use electricity pricing for E-commerce under the background of electricity reform: analysis considering user side price based demand response. Price Theory Pract. (10), 54–57+193. doi:10.19851/j.cnki.CN11-1010/F.2021.10.377
Dengfeng, L., Zhonghao, L., Xiaoju, L., Juan, Y., Mincai, Y., and Xinyu, L. (2024). Optimization method of time-of-use electricity price for the cost savings of power grid investment. Front. Energy Res. 12, 1232–1245. doi:10.3389/fenrg.2024.1361116
He, Y., Ye, Ze, and Wen, W. (2022). Study on time of use electricity price period division considering price elasticity of user demand. Price Mon. (12), 1–9. doi:10.14076/j.issn.1006-2025.2022.12.01
Li, Y., Ren, H., Zhang, Z., and Zhao, H. (2022). Research on the optimization model of Peak Valley time of use electricity price considering energy storage system scheduling and wind power consumption. Grid Technol. 46 (11), 4141–4149. doi:10.13335/j.1000-3673.pst.2022.0524
Pang, Bo, Zhang, L., Yufei, T., Zhengwei, C., Chao, T., Chunqiang, H., et al. (2023). A peak valley time of use electricity price incentive scheme based on differential privacy. J. Chongqing Univ. 46 (11), 56–68. doi:10.11835/j.issn.1000.582X.2023.11.006
Ren, H., Han, D., Ren, X., and Liang, X. (2024). Multi objective pricing strategy for deep valley electricity prices based on time-varying price elasticity matrix. Grid Technol. 48 (3), 958–969. doi:10.13335/j.1000-3673.pst.2023.1244
Wan, Y., Shang, G., Liu, M., Chen, Y., Wencai, L., et al. (2022). Study on the dynamic correction mechanism of time of use electricity price considering source load uncertainty. J. Sol. Energy 43 (11), 493–500. doi:10.19912/j.0254-0096.tynxb.2021-0547
Wang, B., Zhang, Y., Liu, X., Jie, L., and Tong, L. (2023). Etc Time of use electricity pricing mechanism for source load interaction in low-voltage substations in China under the “dual carbon” goal. J. Beijing Inst. Technol. Soc. Sci. Ed. 25 (06), 34–45. doi:10.15918/j.jbitss1009-3370.2023.2504
Wang, D., Liu, Y., Pan, C., Li, C., and Li, F. (2024). Time of use electricity pricing mechanism based on diversified cost structure. J. Hunan Univ. Sci. Technol. Nat. Sci. Ed. 39 (01), 60–69. doi:10.13582/j.cnki.1672-9102.2024.01.008
Yu, X., Dong, Z., Zheng, D., and Deng, S. (2024). Analysis of critical peak electricity price optimization model considering coal consumption rate of power generation side. Environ. Sci. Pollut. Res. 31 (29), 41514–41528. doi:10.1007/s11356-023-29754-5
Zhan, C., Zewen, L., Zou, R., Hao, L., and Chongshan, W. (2024). Time of use electricity pricing optimization strategy for power sales companies based on load transfer. South. Power Grid Technol. 18 (01), 77–84. doi:10.13648/j.cnki.issn1674-0629.2024.01.008
Keywords: distributed photovoltaics, network loss, time of use electricity price, multi objective optimization, improve imperialist competition algorithms, peak valley difference
Citation: Li T, Xu Q, Li W, Wang X and Liu Z (2025) Optimization method of time of use electricity price considering losses in distributed photovoltaic access distribution network. Front. Energy Res. 12:1486478. doi: 10.3389/fenrg.2024.1486478
Received: 26 August 2024; Accepted: 27 September 2024;
Published: 03 January 2025.
Edited by:
Lun Yang, Xi’an Jiaotong University, ChinaReviewed by:
Bo Liu, Nanjing Normal University, ChinaJianbo Zhu, Southeast University, China
Fan Liu, Nanjing University, China
Copyright © 2025 Li, Xu, Li, Wang and Liu. This is an open-access article distributed under the terms of the Creative Commons Attribution License (CC BY). The use, distribution or reproduction in other forums is permitted, provided the original author(s) and the copyright owner(s) are credited and that the original publication in this journal is cited, in accordance with accepted academic practice. No use, distribution or reproduction is permitted which does not comply with these terms.
*Correspondence: Tianshou Li, MTU5NTE5MDAzODhAMTYzLmNvbQ==
 Tianshou Li
 Qing Xu