- 1Beijing Institute of Smart Energy, Beijing, China
- 2State Grid Shanxi Electric Power Research Institute, Taiyuan, China
In this paper, the electrochemical and corrosion behavior of pure titanium (TA1) in simulated Proton Exchange Membrane Water Electrolysis (PEMWE) anodic environment was investigated. In this condition, the corrosion potential of TA1 was −689 mV, with a self-corrosion current density of 232.5 μA cm–2, and a polarization resistance of 125.9 Ω cm2. During potentiostatic polarization at 2 V, the current density was maintained at approximately 6 mA cm–2. However, the passivation process exhibited instability. Furthermore, this process has been shown to significantly facilitate the formation of surface oxides, and the passive film that formed displays the lowest bound water and OH−, and the highest content of O2–, exhibiting the highest average valence. Notably, dynamic potentials caused current transients, among which square wave potential was the most remarkable. The square wave potential shows an O2– content just below that of 2V potential polarization when fluctuating potentials are applied. The interfacial contact resistance (ICR) of 2 V potentiostatic polarization was slightly higher than that of square, sine and triangular waves. Additionally, the high temperature condition of PEMWE will aggravate the corrosion of TA1 by fluoride ions.
1 Introduction
Hydrogen energy, with a high energy density of 140 MJ/kg, is a breakthrough technology for the future energy revolution (Arsad et al., 2023). The use of renewable energy for hydrogen production has the potential to play a significant role in replacing traditional fossil fuels, accelerating energy conservation and emission reduction. It is anticipated that by 2050, hydrogen energy will reduce energy consumption and emissions by around 20% (Yu et al., 2021). Currently, the ideal method for the production of hydrogen utilizing renewable energy is electrolysis, which accounts for over 4% of the global hydrogen production (Shiva and Himabindu, 2019; Doan et al., 2021). The aforementioned approach incorporates several methodologies, including alkaline water electrolysis (AWE), proton exchange membrane water electrolysis (PEMWE) and solid oxide electrolysis (SOEC) (Hui et al., 2024). Nevertheless, challenges are encountered due to the intrinsic intermittency, randomness and variability inherent to the majority of renewable energy sources, such as wind, solar, and hydropower. These issues have the potential to result in transient changes in temperature and potential within the electrolyzer, which could cause serious damage to the electrolysis and membrane systems, hence hydrogen production equipment needs to possess a certain capability to withstand load fluctuations.
PEMWE offers advantages such as high efficiency, a wide range of operating voltages, and exceptionally high hydrogen purity (99.999%). In this system, the cost of bipolar plates (BPs) materials and fabrication accounts for approximately 50% of the total costs (Feng et al., 2017). The operational environment of the plates in PEMWE is characterized by acidic high potentials, where traditional materials like graphite and stainless steel fail to fulfill the requirements. To ensure the optimal lifespan for PEMWE, corrosion-resistant titanium has become the ideal material for application in these systems (Celik et al., 2022). It is well known that TA1 was widely recognized and utilized in PEMWE fields due to its exceptional corrosion resistance, elevated thermal conductivity and high specific strength (Yasin et al., 2024). The choice to use TA1 instead of titanium alloys is based on the following two reasons: (1) good corrosion resistance, stability (Meng et al., 2024); (2) lower cost (Sverdrup and Sverdrup, 2023).
The excellent corrosion resistance of titanium is associated with the formation passive film on its surface and the characteristics of this passive film are influenced by several factors, including the applied potential, the duration of exposure, and the composition of the solution (Acevedo-Peña et al., 2013; Wang et al., 2021; Li et al., 2016). Li et al. (2016) found that increasing the potential helps to reduce the current density of titanium. Wang et al. (2021) observed that the protective effectiveness of the passive film enhanced as the applied potential increased for Ti-6Al-4V in 0.5 M sulfuric acid. The limitations of titanium are primarily due to the formation of an insulating TiO2 film in strong oxidative environment of PEMWE (Utomo and Donne, 2006). This significantly increases the ohmic resistance, leading to increased power loss and reduced hydrogen production efficiency. In addition, when exposed to F−, the TiO2 passive film will dissolve in solutions exceeding critical concentration (Li et al., 2021; Wang et al., 2014).
The core components of PEMWE primarily consist of bipolar plates, transport layers, and membrane electrode assemblies, with the bipolar plates and transport layers being composed of TA1. The oxidation and corrosion behavior of TA1 under real operating conditions is closely linked to stack performance, directly determining hydrogen production efficiency and system stability (Yasin et al., 2024). Currently, PEM electrolyzers for hydrogen production are primarily coupled with renewable energy sources, such as solar and wind energy (Xu et al., 2024). However, the inherent fluctuations in renewable energy pose the challenge of dynamic potential loading for PEM electrolyzers. Dynamic potential loading can cause transient changes in the electrode potentials within the electrolyzer. In actual hydrogen production, the impacts of fluctuating potential on the stability and durability of the components are crucial (Bazarah et al., 2022). Potential fluctuations can induce localized high temperatures and high potentials, which may cause irreversible damage to the bipolar plates and transport layers within the electrolyzer. Most notably, fluctuating potential affects the oxidation and corrosion behavior of the components, directly impacting the internal contact resistance of the stack and, consequently, hydrogen production efficiency. In practical applications, PEM electrolyzers may face a wide range of complex operating conditions and load variations. Investigating the effects of dynamic potential loading on the system is critical for understanding and addressing the challenges encountered in practical applications, while also providing a scientific basis and technical support for system design and operation. Therefore, it is essential to study the impact of different fluctuating potentials on corrosion and interface conductivity of TA1.
In this work, the electrochemical behaviors of TA1 are characterized by potentiodynamic polarization (PDP) and electrochemical impedance spectroscopy (EIS) in PEMWE working environments; the impact of different start-stop conditions resulting from photovoltaic power conditions on the composition of the surface passive film and interfacial conductivity of TA1 are investigated by three dynamic polarization methods, X-ray photoelectron spectroscopy (XPS), and interfacial contact resistance (ICR); the corrosion morphology of TA1 after immersion in a simulated PEMWE anode environment is analyzed using scanning electron microscope (SEM). Important phenomena are observed and systematically discussed based on the experimental results.
2 Experimental section
2.1 Materials
The selected material is a 2 mm thick annealed TA1 plate from Baoji Titanium Industry Co., Ltd., along with the composition details furnished by the company, as outlined in Table 1. 10 mm × 10 mm × 2 mm specimens were wire cut from larger plates. Subsequently, the samples were sequentially polished using SiC sandpaper from 240 to 3,000 grit, followed by ultrasonic cleaning in ethanol for 5 min and drying with cold air.
2.2 Electrochemical analysis
The electrochemical experiments were conducted using a three-electrode system on a Wuhan Corrtest CS2350M5 dual-channel electrochemical workstation. The counter electrode and reference electrode were Pt foil and Ag/AgCl electrodes respectively, while the working electrode was the sample. The back of the sample was soldered to a copper wire and encapsulated in a PVC tube with epoxy resin, exposing an area of 1 cm2. The test solution was a 0.5 M H2SO4 + 5 ppm NaF aqueous solution, with the operating temperature set at 70°C. The solution was pre-bubbled with air for 12 h to achieve a high dissolved oxygen. Prior to the electrochemical testing, an open circuit potential (OCP) test was conducted for 1 h. Electrochemical impedance spectroscopy (EIS) tests were performed at open circuit from 100 kHz to 0.01 Hz with a disturbance sinusoidal signal amplitude of 10 mV. The EIS data obtained were analyzed and fitted using ZSimpWin software. Potentiodynamic polarization was conducted at a scan rate of 2 mV/s from −0.5 Vocp to 4 VAg/AgCl. Unless specifically stated, all potentials mentioned in the text are relative to Ag/AgCl.
To investigate the impact of start-stop conditions during the electrolysis process on the electrodes, this study employed three types of wave signals for fluctuating polarization acceleration tests: square wave, sine wave, and triangle wave. The upper potential limit was set at 2 V, and the lower limit at 0 V. Each fluctuation cycle lasted 36s (frequency = 0.028 Hz), with the total duration being 1 h. For comparison, constant potential polarization was conducted at 2 V.
2.3 Characterization
The immersion solution consisted of 0.5 M H2SO4 + 5 ppm NaF, with the temperature maintained at 70°C and the corrosion morphology of immersed TA1 was observed using an FEI Quanta 250 scanning electron microscope (SEM).
Differences in the composition of the passive film on the sample surface after polarization acceleration tests were characterized by X-ray photoelectron spectroscopy (XPS, Thermo ESCALAB 250 Xi), with the radiation source being Al Kα (hν = 1,486.6 eV). The XPS data obtained were peak-fitted using Avantage software, and the XPS signals were calibrated using the C 1s reference peak (284.8 eV).
Interfacial contact resistance (ICR) tests were conducted on both the original samples and those subjected to fluctuating polarization tests. To perform the ICR test, the sample was sandwiched between two carbon papers (TGP-H-060T), forming a “sandwich” structure. This assembly was then placed between two copper cylindrical electrodes and compressed to record the total resistance R1 under various pressures. Furthermore, a single sheet of carbon paper was placed between the two copper cylinders, and the total resistance R2 under different pressures was similarly recorded. Assuming the bulk resistances are negligible, the contact resistance of the sample can be obtained using the following Equation 1:
3 Results and discussion
3.1 Electrochemical behavior
3.1.1 Open circuit potential
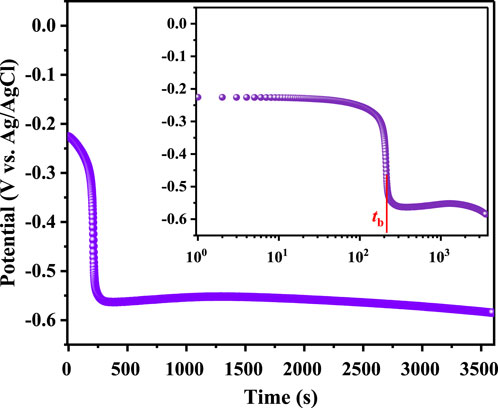
Figure 1 illustrates the open circuit potential (OCP) changes of TA1 in a simulated PEMWE anodic environment over time. Initially, the potential is relatively high at about −0.22 V, attributed to the naturally formed oxide layer on the titanium surface when exposed to air. As time extends to approximately 250 s, the potential sharply decreases due to the dissolution of surface oxides (Wang et al., 2014; Chen et al., 2020). This process involves the dissolution of TiO2 into Ti-F compounds ([TiF6]2–), as illustrated in reaction (2) (Ren et al., 2020). According to Cui (Cui et al., 2018), who define the bursting time (tb) (marked on the log-time plot), the bursting time for TA1 is about 265 s. Subsequently, the OCP gradually increases, reaching a local maximum of −0.55 V. This increase mainly corresponds to the self-passivation of the TA1 (Yin et al., 2023). However, this process is unstable; the potential slowly decreases again, ultimately stabilizing around −0.585 V, involving the reactions with F−as indicated in Equation 3. The specific reaction process is outlined as follows: in a acid solution containing fluoride ions at 70°C, the primary reactions include the passivation of titanium and the dissolution of titanium dioxide. Equation 2 describes this dissolution process. Once the titanium dioxide dissolves, the underlying pure titanium is exposed, and its subsequent reaction is described by Equation 3, forming [TiF6]3– (Ren et al., 2020).
3.1.2 Potentiodynamic polarization curve
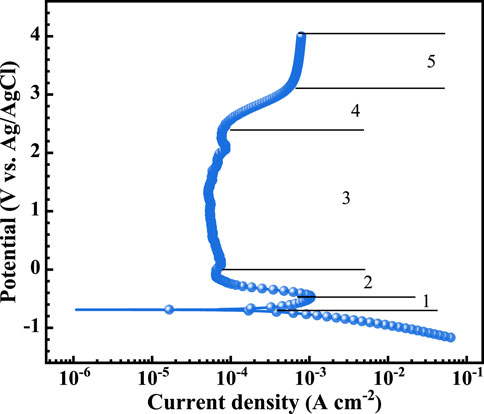
Figure 2 presents the potentiodynamic polarization curve of TA1 in a simulated PEMWE anodic environment, and Table 2 lists the fitted kinetic parameters. The corrosion potential of TA1 is −689 mV with a self-corrosion current density of 232.5 μA cm–2. The current density of TA1 gradually exceeds Ecorr, reaching the active dissolution region (1, −0.68 to −0.5 V) where the maximum current density [critical current density (icri)] is 1.05 mA cm–2. The primary reaction of Ti at this stage is dissolution forming soluble Ti (III) (Yin et al., 2023; Cheng et al., 2023). As the potential increases, Ti (III) transforms to Ti (IV), accompanied by the emergence of lower-valence oxides such as Ti2O3. Ti (IV) typically acts as a corrosion inhibitor and further reacts with water to form a TiO2 passivation film according to Equation 4 (Ningshen et al., 2015). The curve then enters the transition zone (2, from −0.5 V to 0.2 V) and the typical passivation zone (3, from 0.2 V to 2.5 V), where the passivation current density (ip,1V) at 1 V is approximately 54.04 μA cm–2. Subsequently, the curve enters the transpassive region (4, 2.5–3.2 V) and the oxygen evolution reaction (OER) region (5, 3.5–4 V).
According to the Tafel slopes from the linear region of the potentiodynamic polarization curves, the polarization resistance (Rp) can be obtained (Liu et al., 2021), which can further be used to assess the corrosion resistance. The formula is as follows Equation 5:
where βa and βc represent the Tafel slopes of the anodic and cathodic linear regions, respectively. The calculated Rp for TA1 is 125.9 Ω cm2.
3.1.3 Electrochemical impedance spectroscopy
Figure 3 shows the EIS data for TA1 under OCP conditions in a simulated PEMWE anodic environment. The Nyquist plot in Figure 3A exhibits two incomplete semicircles, indicating that the passive film is not dense and has been severely damaged (Cheng et al., 2023). The low-frequency capacitive arc indicates the dissolution of the surface passive film, and the high-frequency capacitive arc represents the double-layer capacitance at the sample-solution interface. The Bode plot in Figure 3B, two distinct peaks suggest the presence of two time constants, and the highest phase angle for TA1 is only 54.2° at mid-high frequencies. Considering that the active dissolution of TA1 in acidic solutions is mainly controlled by charge transfer and adsorption of intermediates, an equivalent circuit with two time constants is used to fit the EIS data. The total impedance Z of the circuit is given by Equation 6, Orazem and Tribollet (2008):
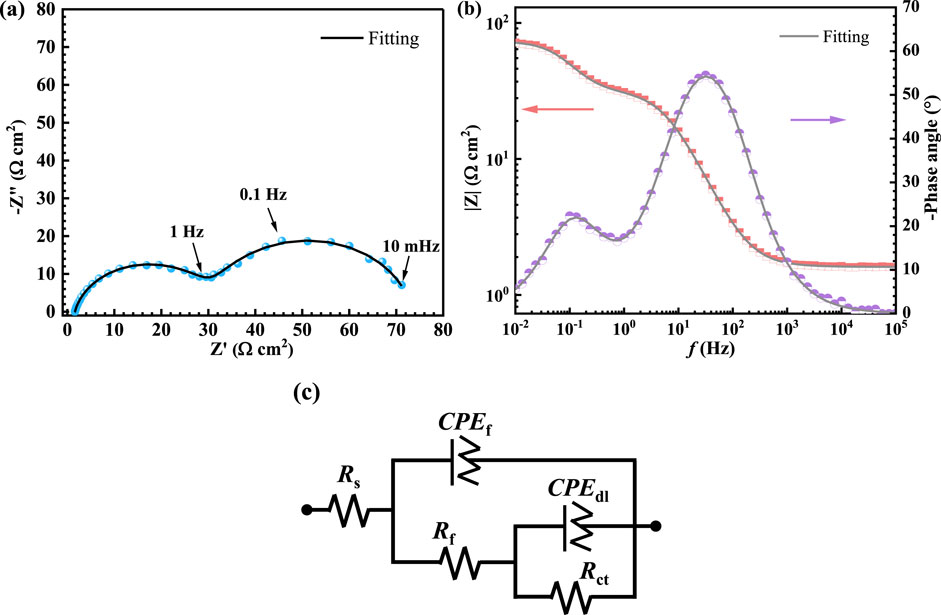
Figure 3. The EIS data of the TA1. (A) Nyquist plot, (B) Bode plot, (C) equivalent electrical circuit (EEC).
In the formula, Rs and Ra represent the electrolyte and oxide film resistances, respectively, while Rct denotes the charge transfer resistance. CPEf and CPEdl are constant phase elements, used to substitute for the capacitance behavior of the oxide film and double layer because of the surface heterogeneity and non-ideal capacitance property (Wang et al., 2023; Wang et al., 2024). The impedance of CPE is defined as following Equation 7:
Where Q represents the admittance of the CPE, n is a CPE parameter ranging between 0 and 1, and ω is the angular frequency. I represents the imaginary unit. Table 3 lists the fitting parameters for the EIS data, with Rct being 41.99 Ω cm2. The polarization resistance (Rp) is derived from the impedance modulus at the low-frequency limit (Mccafferty, 2010), and its calculation formula is simplified to Equation 8:
Further simplification to Equation 9:
The calculated polarization resistance is 72.76 Ω cm2.
3.1.4 Fluctuating acceleration tests
Fluctuating acceleration tests were conducted on TA1 under various potentials, and the current response obtained is shown in Figure 4A, with Figure 4B providing a detailed view of the 1,700–1,900 s. When a constant potential of 2 V is applied, the current density quickly decreases to around 6 mA cm–2 within 100 s and then stabilizes, exhibiting noticeable sawtooth-like current fluctuations of approximately 0.001 mA cm–2. This indicates that the passivation state of the sample is unstable under this potential, with minor active reactions occurring. This observation is supported by the polarization curve shown in Figure 2. The relationship between the current density response i and polarization time can be fitted using the Vermilyea model (Vermilyea, 1963), expressed as Equation 10:
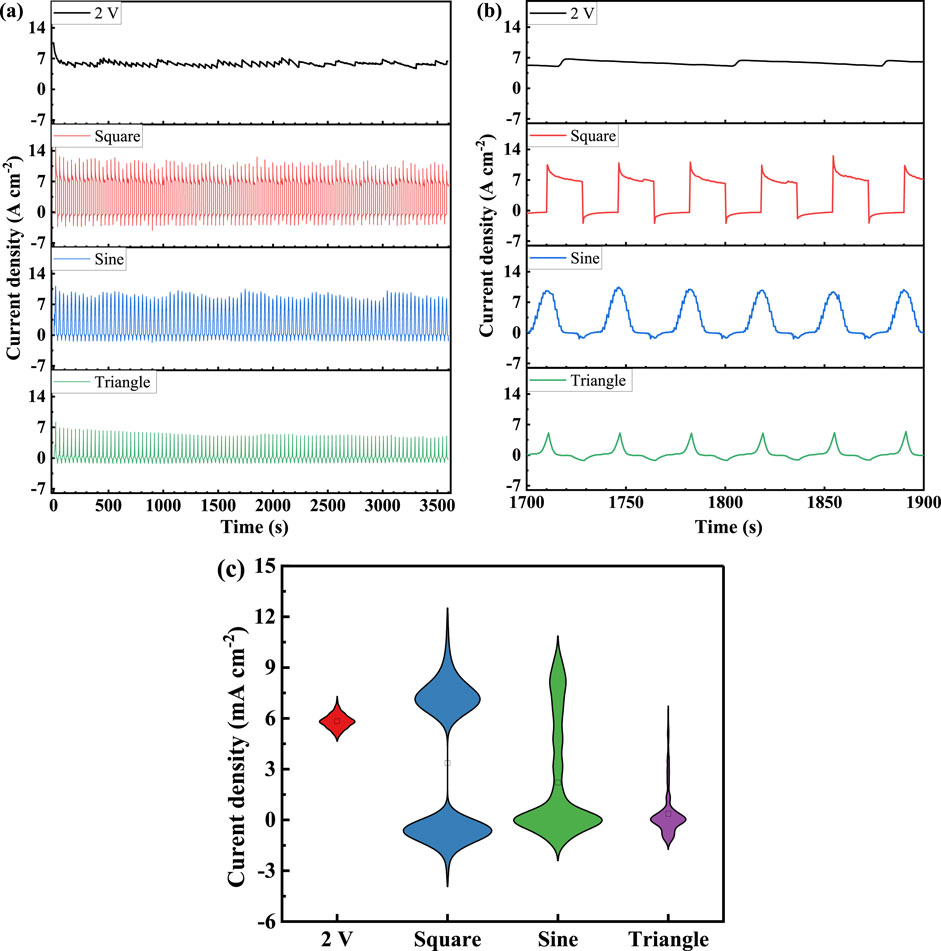
Figure 4. (A) The response of current density TA1, (B) Enlarged views in the period of 1,700∼1,900s, and (C) The statistical diagram of current density response under constant and dynamic polarization potentials.
In this equation,
A rapid oxidation reaction is observed when the potential changes from 0 V to 2 V in a square wave fluctuation, resulting in a sharp increase in current density to approximately 10 mA cm–2, followed by a gradual decrease at a diminishing rate. Conversely, when the potential shifts instantaneously from 2 V to 0 V, the current density drops suddenly to about −2.65 mA cm–2, indicating a rapid reduction reaction, followed by a gradual decrease to −0.35 mA cm–2. As shown in Figure 4C, the current density response distribution statistics indicate that the current is primarily distributed in two regions: 6–9 mA cm–2and –2∼0.6 mA cm–2.
When the fluctuating potential is a sine wave, the instantaneous current transition is not as pronounced due to the slower rate of potential change. The current density corresponding to the high potential is 8.5 mA cm–2, and the current density observed at the low potential limit is about −1.23 mA cm–2, both of which are lower than the related current densities for square wave polarization. According to Figure 4C, the current is mainly distributed in the low current area, with significantly less distribution in the high current area compared to the square wave, and a noticeable increase in the transition area current. This is a distinctive feature of the sinusoidal wave and is characterized by a higher proportion of lower potential values.
The peak current density with a triangular wave reaches about 5.06 mA cm–2 at high potential, which is the lowest among the three types of fluctuations. At peak low potential, the current density is approximately −1.22 mA cm–2, similar to that of the sinusoidal wave. As the high potential duration is very short with a triangular wave, the high current area is not prominent in Figure 4C, with the current mainly concentrated in the low current region.
3.2 Passive film composition
Figure 5 displays the XPS spectra of the passive film on the surface of TA1 after fluctuating polarization. From Figures 5A, D, G, J, the XPS signal for O1s can be deconvoluted into three distinct component peaks at 530 eV, 531.5 eV, and 533.1 eV, corresponding to O2–, OH−, and bound water, respectively (Wei et al., 2022; Jiang et al., 2024). To quantitatively compare the compositional differences of the passive film, the relative atomic content of each component was calculated using the following formula (Liu and Wu, 2007; Moulder et al., 1992):
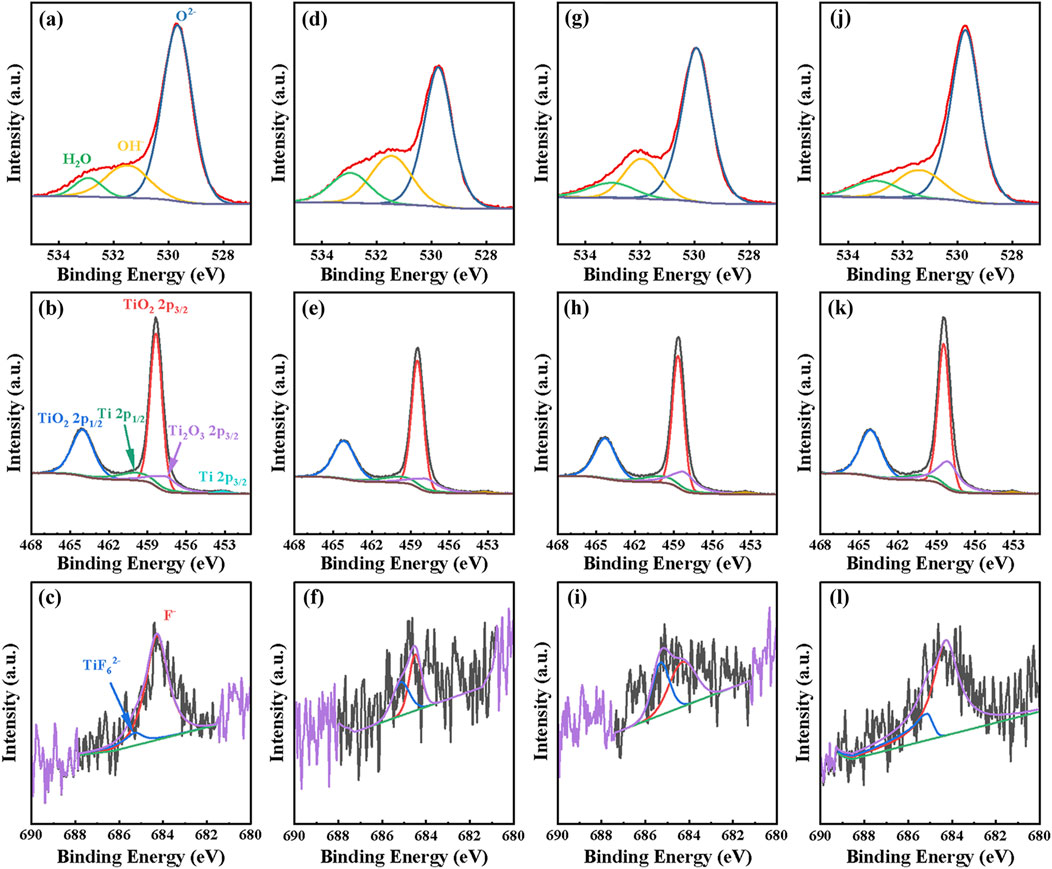
Figure 5. The XPS spectra of TA1 after polarized by constant and dynamic polarization potentials, (A–C) 2V (D–F) Square (G–I) Sine, and (J–L) Triangle.
In this formula,
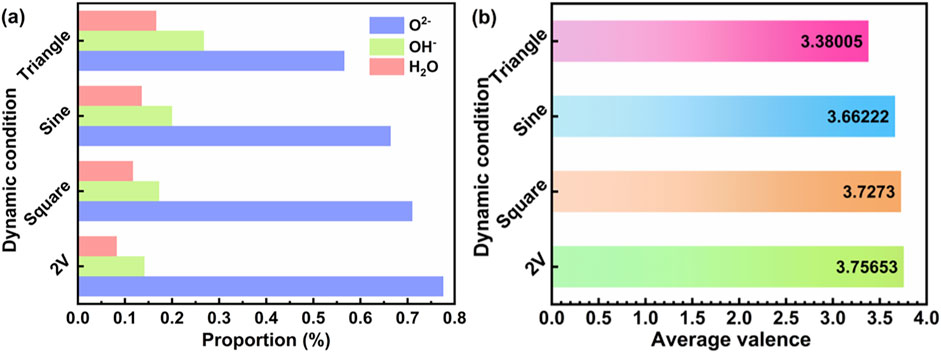
Figure 6. (A) The proportion of H2O, O2−, OH− in the passive film formed after polarized by constant and dynamic polarization potential. (B) The average valences of the passive films formed at various potentials.
Figures 5B, E, H, K shows the Ti2p XPS signals, which can be divided into five peaks: Ti 2p3/2 at 453.8 eV, Ti2O3 2p3/2 at 457.5 eV, TiO2 2p3/2 at 458.7 eV, TiO2 2p1/2 at 459.5 eV, and TiO2 2p1/2 at 464.3 eV Ti2O3 (Jiang et al., 2024; Yin et al., 2023). Ti2O3 as an intermediate product, plays a crucial role in the formation of TiO2 and is unstable at higher potentials. The types of Ti and its oxides do not vary significantly after different fluctuating polarization tests. Similarly, using Equation 11, the relative contents of Ti and its oxides can be calculated, with TiO2 percentages of 79.3%, 78.1%, 72.6%, and 71.9% respectively. Considering the presence of the suboxide Ti2O3, the average valence of the surface passivation film was calculated. The results are shown in Figure 6B, where the average valences obtained from the four polarization tests were 3.7565, 3.7273, 3.6622, and 3.38 respectively. It is evident that the highest valence of the passivation film after constant potential polarization is directly attributed to the highest content of TiO2 in the film.
Figures 5C, F, I, L displays the XPS results for F1s, and peak fitting confirms the presence of adsorbed F−and [TiF6]2–, two peaks at 684.3 eV and 685.3 eV can be identified as F−, [TiF6]2–, (Ren et al., 2020; Wang et al., 2016). Generally, oxygen migrates inward from the water at the substrate/film interface, promoting the growth of the oxide film. Additionally, the oxidation of Ti leads to the accumulation of oxygen vacancies as shown in Equation 12. Under the influence of high electric fields, these oxygen vacancies incorporate into the oxide film and are consumed at the film/solution interface as indicated in Equation 13. Fluoride ions can interact with TiO2 according to reaction (2), leading to the dissolution of the passivation layer (Stancheva and Bojinov, 2012), since the thermodynamic stability of dissolved [TiF6]2– is higher than that of TiO2.
3.3 Interface contact resistance
Figure 7A shows the relationship between ICR and compressive force for the original TA1 and after fluctuating polarization. At initial low pressures, the ICR decreases in a logarithm-like manner, which can be attributed to the effective contact between the sample and the hydrophobic carbon paper (Oyarce et al., 2013). The ICR tends to stabilize after approximately 1.5 MPa. It is evident that the ICR of the samples after fluctuating polarization increased significantly compared to the original samples, with TA1’s initial ICR at 186.5 mΩ cm2, and the final stable ICR at 1.43 mΩ cm2. For a more direct comparison, a typical pressure of 1.4 MPa is selected, with the results shown in Figure 7B. The typical ICR for the original TA1 is 16.64 mΩ cm2, after constant potential polarization at 2 V the typical ICR is 190.2 mΩ cm2, and for square wave, sine, and triangular wave polarization tests, the typical ICR values are 163.9, 160.4, and 153.8 mΩ cm2, respectively. This pattern of change is similar to the average valence state of the passive film.
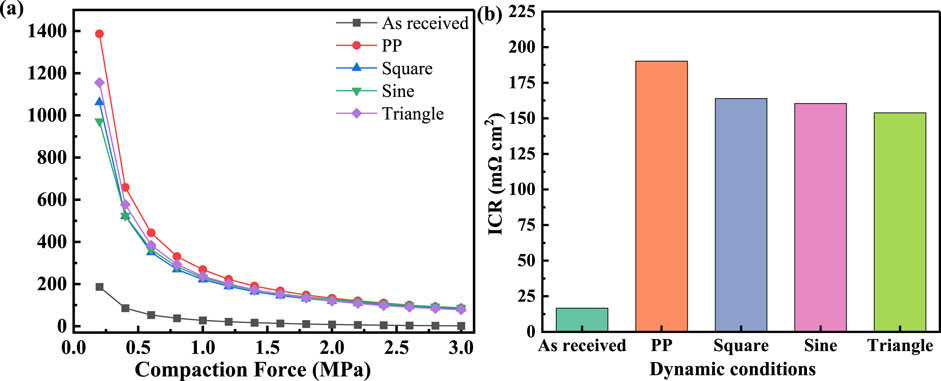
Figure 7. (A) The variation of ICRs with compaction force of TA1 before and after polarized by constant and dynamic polarization potentials. (B) Typical values of ICR at 1.4 MPa.
3.4 Corrosion morphology
Figure 8A shows the corrosion morphology of TA1 after being immersed in an high-temperature acidic solution simulating the PEMWE anode environment for 48 h. Numerous corrosion pits are visibly distributed uniformly across the entire surface of TA1, indicating significant corrosion activity. Furthermore, Figure 8B shows an enlarged view of the larger corrosion pits. This corrosion morphology is distinct from that of TA1 in a sulfuric acid environment containing fluoride ions at room temperature (Wang et al., 2014), indicating that the high-temperature conditions of PEMWE exacerbate the corrosive effects of fluoride ions on TA1.
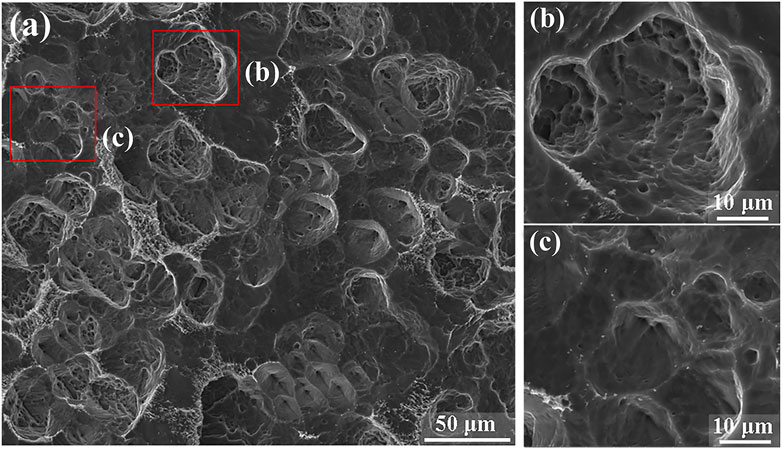
Figure 8. (A) The corrosion morphology of TA1 after immersion for 48 h in the simulated PEMWE high-temperature acidic environment, (B, C) Partial view enlargement.
4 Conclusion
This paper explores the electrochemical behaviors, composition of surface passive film, interfacial conductivity, and corrosion morphology of TA1 in simulated PEMWE working environments with fluctuating potential to analogy photovoltaic power conditions. The key findings are outlined below:
1) In the simulated PEMWE anode environment, the naturally formed oxide layer in the air dissolves quickly. TA1 has a corrosion potential of −689 mV and a self-corrosion current density of 232.5 μA cm–2 with a critical current density (icri) of 1.05 mA cm–2 by Tafel fitting and calculation, the polarization resistance of TA1 is determined to be 125.9 Ω cm2. The passivation film of TA1 is not dense and is severely damaged in this environment.
2) At a constant potential of 2V, the current density maintains around 6 mA cm–2, but the passivation state is unstable. When a fluctuating square wave potential is applied, transient changes in the potential cause sudden increases in current density, with the current distributed in two concentrated areas. When the fluctuating potential is a sine wave, the current transient phenomenon is not obvious, and the limit currents are lower than those of the square wave, with the current mainly distributed in the low current area, and a significant increase in the transition zone current. When the fluctuating potential is a triangle wave, the limit current density is the lowest, with the current mainly concentrated in the low current region.
3) After conducting tests with four different fluctuating potentials, XPS and ICR test results revealed that these varying potentials significantly affect the degree of oxidation and interfacial resistance. Under constant potentiostatic polarization, the oxidation and corrosion behavior of TA1 was found to be more pronounced compared to the fluctuating potential mode typical of new energy applications. The order of oxidation, corrosion, and interfacial resistance, from highest to lowest, is 2V constant potential polarization > square wave > sine wave > triangular wave.
4) TA1 immersion experiments indicate that the high temperature in PEMWE intensifies the corrosive impact of fluoride ions on TA1.
Data availability statement
The original contributions presented in the study are included in the article/supplementary material, further inquiries can be directed to the corresponding author.
Author contributions
YH: Data curation, Formal Analysis, Investigation, Methodology, Validation, Writing–original draft, Writing–review and editing. LL: Investigation, Methodology, Validation, Writing–review and editing. JY: Data curation, Formal Analysis, Supervision, Writing–review and editing. GZ: Data curation, Supervision, Validation, Writing–review and editing. ZD: Data curation, Resources, Supervision, Validation, Writing–review and editing. BZ: Project administration, Resources, Writing–review and editing.
Funding
The author(s) declare that financial support was received for the research, authorship, and/or publication of this article. This study was funded by research and development project of State Grid Corporation of China under the grant number: 5500-202299313A-2-0-QZ, project Study on the formulation and process of PEM hydrogen production plate composite coating suitable for new energy fluctuation. The funder was not involved in the study design, collection, analysis, interpretation of data, the writing of this article, or the decision to submit it for publication.
Conflict of interest
The authors declare that the research was conducted in the absence of any commercial or financial relationships that could be construed as a potential conflict of interest.
Publisher’s note
All claims expressed in this article are solely those of the authors and do not necessarily represent those of their affiliated organizations, or those of the publisher, the editors and the reviewers. Any product that may be evaluated in this article, or claim that may be made by its manufacturer, is not guaranteed or endorsed by the publisher.
References
Acevedo-Peña, P., Vazquez-Arenas, J., Cabrera-Sierra, R., Lartundo-Rojas, L., and González, I. (2013). Ti anodization in alkaline electrolyte: the relationship between transport of defects, film hydration and composition. J. Electrochem. Soc. 160 (6), C277–C284. doi:10.1149/2.063306jes
Arsad, A. Z., Hannan, M. A., Al-Shetwi, A. Q., Begum, R., Hossain, M., Ker, P. J., et al. (2023). Hydrogen electrolyser technologies and their modelling for sustainable energy production: a comprehensive review and suggestions. Int. J. Hydrogen Energy 48 (72), 27841–27871. doi:10.1016/j.ijhydene.2023.04.014
Bazarah, A., Majlan, E., Husaini, T., Zainoodin, A., Alshami, I., Goh, J., et al. (2022). Factors influencing the performance and durability of polymer electrolyte membrane water electrolyzer: a review. Int. J. Hydrogen Energy 47, 35976–35989. doi:10.1016/j.ijhydene.2022.08.180
Celik, S., Timurkutluk, B., Aydin, U., and Yagiz, M. (2022). Development of titanium bipolar plates fabricated by additive manufacturing for PEM fuel cells in electric vehicles. Int. J. Hydrogen Energy 47 (89), 37956–37966. doi:10.1016/j.ijhydene.2022.08.282
Chen, W. Q., Zhang, S. M., and Qiu, J. (2020). Surface analysis and corrosion behavior of pure titanium under fluoride exposure. J. Prosthet. Dent. 124 (2), 239. e1–e239.e8. doi:10.1016/j.prosdent.2020.02.022
Cheng, H., Luo, H., Wang, X., Dong, C., and Li, X. (2023). Effect of fluoride ion concentration and fluctuating conditions on titanium bipolar plate in PEM water electrolyser environment. Corros. Sci. 222, 111414. doi:10.1016/j.corsci.2023.111414
Cui, Z., Wang, L., Zhong, M., Ge, F., Gao, H., Man, C., et al. (2018). Electrochemical behavior and surface characteristics of pure titanium during corrosion in simulated desulfurized flue gas condensates. J. Electrochem. Soc. 165 (9), C542–C561. doi:10.1149/2.1321809jes
Doan, T. L., Lee, H. E., Shah, S. S., Kim, M., Kim, C., Cho, H., et al. (2021). A review of the porous transport layer in polymer electrolyte membrane water electrolysis. Int. J. Hydrogen Energy 45 (10), 14207–14220. doi:10.1002/er.6739
Feng, Q., Yuan, X. Z., Liu, G., Wei, B., Zhang, Z., Li, H., et al. (2017). A review of proton exchange membrane water electrolysis on degradation mechanisms and mitigation strategies. J. Power Sources 366, 33–55. doi:10.1016/j.jpowsour.2017.09.006
Hui, Y., Wang, M., Guo, S., Akhtar, S., Bhattacharya, S., Dai, B., et al. (2024). Comprehensive review of development and applications of hydrogen energy technologies in China for carbon neutrality: technology advances and challenges. Energy Convers. Manag., 315.
Jiang, X., Meng, Y., Ran, Q., Yang, J., and Sun, G. (2024). Corrosion resistance improvement of commercial pure titanium via compression deformation induced substructure. Corros. Sci. 229, 111891. doi:10.1016/j.corsci.2024.111891
Li, D. G., Wang, J. D., Chen, D. R., and Liang, P. (2016). Influence of passive potential on the electronic property of the passive film formed on Ti in 0.1M HCl solution during ultrasonic cavitation. Ultrason. Sonochemistry 29, 48–54. doi:10.1016/j.ultsonch.2015.08.018
Li, X., Wang, L., Fan, L., Zhong, M., Cheng, L., and Cui, Z. (2021). Understanding the effect of fluoride on corrosion behavior of pure titanium in different acids. Corros. Sci. 192, 109812. doi:10.1016/j.corsci.2021.109812
Liu, C. T., and Wu, J. K. (2007). Influence of pH on the passivation behavior of 254SMO stainless steel in 3.5% NaCl solution. Corros. Sci. 49 (5), 2198–2209. doi:10.1016/j.corsci.2006.10.032
Liu, X., MacDonald, D. D., Wang, M., and Xu, Y. (2021). Effect of dissolved oxygen, temperature, and pH on polarization behavior of carbon steel in simulated concrete pore solution. Electrochimica Acta 366, 137437. doi:10.1016/j.electacta.2020.137437
Mccafferty, E. (2010). Introduction to corrosion science, 1. New York, NY: Springer. doi:10.1007/978-1-4419-0455-3
Meng, Q., Yue, X., Shang, L., Liu, X., Wang, F., and Zhang, G. (2024). Corrosion behavior of metallic coatings on titanium bipolar plates of proton exchange membrane water electrolysis. Int. J. Hydrogen Energy 63, 1105–1115. doi:10.1016/j.ijhydene.2024.03.242
Moulder, J. F., Stickle, W. F., Sobol, W. M., et al. (1992). Handbook of X-ray photoelectron spectroscopy.
Ningshen, S., Sakairi, M., Suzuki, K., and Okuno, T. (2015). Corrosion performance and surface analysis of Ti–Ni–Pd–Ru–Cr alloy in nitric acid solution. Corros. Sci. 91, 120–128. doi:10.1016/j.corsci.2014.11.010
Okamoto, G. (1973). Passive film of 18-8 stainless steel structure and its function. Corros. Sci. 13 (6), 471–489. doi:10.1016/0010-938x(73)90031-0
Orazem, M. E., and Tribollet, B. (2008). Electrochemical impedance spectroscopy. Hoboken, New Jersey: John Wiley and Sons.
Oyarce, A., Holmström, N., Bodén, A., Lagergren, C., and Lindbergh, G. (2013). Operating conditions affecting the contact resistance of bi-polar plates in proton exchange membrane fuel cells. J. Power Sources 231, 246–255. doi:10.1016/j.jpowsour.2012.12.100
Ren, S., Du, C., Liu, Z., et al. (2020). Effect of fluoride ions on corrosion behaviour of commercial pure titanium in artificial seawater environment. Appl. Surf. Sci., 506.
Shiva, K. S., and Himabindu, V. (2019). Hydrogen production by PEM water electrolysis - a review. Mater. Sci. Energy Technol. 2 (3), 442–454. doi:10.1016/j.mset.2019.03.002
Stancheva, M., and Bojinov, M. (2012). Influence of fluoride content on the barrier layer formation and titanium dissolution in ethylene glycol–water electrolytes. Electrochimica Acta 78, 65–74. doi:10.1016/j.electacta.2012.05.093
Sverdrup, H., and Sverdrup, A. (2023). An assessment of the global supply, recycling, stocks in use and market price for titanium using the WORLD7 model. Sustain. Horizons 7, 100067. doi:10.1016/j.horiz.2023.100067
Utomo, W. B., and Donne, S. W. (2006). Electrochemical behaviour of titanium in H2SO4–MnSO4 electrolytes. Electrochimica Acta 51 (16), 3338–3345. doi:10.1016/j.electacta.2005.09.031
Vermilyea, D. A. (1963). Advances in electrochemistry and electrochemical engineering. New York: John Wiley and Sons.
Wang, P., Wang, J., Huang, Y., Cheng, X., Zhao, Z., et al. (2024). Effects of grain size on the corrosion inhibition and adsorption performance of benzotriazole on carbon steel in NaCl solution. J. Mater. Sci. and Technol. 217, 221–236. doi:10.1016/j.jmst.2024.07.050
Wang, Q., Huang, F., Cui, Y. T., Yoshida, H., Wen, L., and Jin, Y. (2021). Influences of formation potential on oxide film of TC4 in 0.5M sulfuric acid. Appl. Surf. Sci. 544, 148888. doi:10.1016/j.apsusc.2020.148888
Wang, X., Luo, H., Zhao, Q., Cheng, H., Li, Q., Pan, Z., et al. (2023). Investigations on the passive and pitting behaviors of 17–4 PH martensitic stainless steel containing Al2O3 inclusions in chlorine environment. Colloids Surfaces A Physicochem. Eng. Aspects 660, 130861. doi:10.1016/j.colsurfa.2022.130861
Wang, Z., Hu, H., Zheng, Y., Ke, W., and Qiao, Y. (2016). Comparison of the corrosion behavior of pure titanium and its alloys in fluoride-containing sulfuric acid. Corros. Sci. 103, 50–65. doi:10.1016/j.corsci.2015.11.003
Wang, Z. B., Hu, H. X., Liu, C. B., and Zheng, Y. (2014). The effect of fluoride ions on the corrosion behavior of pure titanium in 0.05M sulfuric acid. Electrochimica Acta 135, 526–535. doi:10.1016/j.electacta.2014.05.055
Wei, Y., Pan, Z., Fu, Y., Yu, W., He, S., Yuan, Q., et al. (2022). Effect of annealing temperatures on microstructural evolution and corrosion behavior of Ti-Mo titanium alloy in hydrochloric acid. Corros. Sci. 197, 110079. doi:10.1016/j.corsci.2021.110079
Xu, B., Yang, Y., Li, J., Wang, Y., Ye, D., Zhang, L., et al. (2024). Computational assessment of response to fluctuating load of renewable energy in proton exchange membrane water electrolyzer. Renew. Energy 232, 121084. doi:10.1016/j.renene.2024.121084
Yasin, M., Johar, M., Gupta, A., and Shahgaldi, S. (2024). A comprehensive review of the material innovations and corrosion mitigation strategies for PEMWE bipolar plates. Int. J. Hydrogen Energy 88, 726–747. doi:10.1016/j.ijhydene.2024.09.208
Yin, Q., Liu, S., Fu, X., et al. (2023). Transition of self-passivation and semiconductor property of titanium in the simulated environments of proton exchange membrane fuel cells. Appl. Surf. Sci., 612.
Keywords: PEMWE, dynamic loads, electrochemical, XPS, ICR
Citation: Huang Y, Li L, Yao J, Zhang G, Deng Z and Zhang B (2024) Investigation on corrosion and interface conductivity of TA1 under dynamic loads in proton exchange membrane water electrolyzer anodic environment. Front. Energy Res. 12:1478223. doi: 10.3389/fenrg.2024.1478223
Received: 09 August 2024; Accepted: 05 November 2024;
Published: 19 November 2024.
Edited by:
Vincenzo Liso, Aalborg University, DenmarkReviewed by:
Han Chen, Cambrex Corporation, United StatesTong Liu, Wuhan Institute of Technology, China
Copyright © 2024 Huang, Li, Yao, Zhang, Deng and Zhang. This is an open-access article distributed under the terms of the Creative Commons Attribution License (CC BY). The use, distribution or reproduction in other forums is permitted, provided the original author(s) and the copyright owner(s) are credited and that the original publication in this journal is cited, in accordance with accepted academic practice. No use, distribution or reproduction is permitted which does not comply with these terms.
*Correspondence: Gaoqun Zhang, YmFvYmVpZ2FvcXVuQDE2My5jb20=
†These authors have contributed equally to this work
 Yao Huang
 Lin Li1†
