- State Grid Wuxi Power Supply Company, Jiangsu, China
During the construction of cable joints, three common defects may occur on the XLPE surface: scratches, moisture exposure, and adhered contaminated particles. To evaluate the impact of these defects on joint performance, this paper establishes a sheet model of XLPE insulation in cable joints to analyze the changes in the electric field under different defects and explore the influence of different defects on the electric field and breakdown voltage. Results of the study reveal that the electric field at the scratch site on XLPE produces severe distortion, being 1.6 times that of non-scratch areas. When exposed to moisture, the more conductive impurities present in the adhered contaminated water on the XLPE surface, the higher the conductivity of the contaminated water, thereby increasing its conductive performance and the electric field strength, which is 1.22–1.4 times that of the non-moist interface. When particles adhere to the XLPE surface, severe distortion occurs at the particle-interface electric field, approximately 1.5 times that of the defect-free interface. Scratches have the most significant impact on the electric field of XLPE insulation. Experimental results also demonstrate that the breakdown voltage without defects is 129.6 kV, while the breakdown voltage with scratch defects is 59.1 kV, moisture defects is 69.7 kV, and particle contamination defects is 59.2 kV, with scratches having the most significant impact on the breakdown voltage of XLPE insulation. These findings provide important insights into the influence of different defects on the insulation performance of cable joints.
1 Introduction
The continuous development and technological advancements of XLPE cables both domestically and internationally have led to various optimized designs in cable structures (Rui et al., 2018). Due to the lower dielectric loss of cross-linked polyethylene insulation compared to paper and PVC insulation, and its relatively low capacitance, XLPE exhibits superior electrical performance, making it widely used in cable insulation materials (Liu et al., 2003; Yuxin et al., 2018; Fang et al., 2016; Liu et al., 2006).
However, in recent years, the fault rate of XLPE cables has been gradually increasing. During the overall manufacturing, laying, and long-term use of cables, various defects may occur in the XLPE insulation of cable joints (Orton, 2015). Statistics show that most XLPE cable faults are caused by improper on-site installation techniques (Zheng, 2004). Typical construction defects in cable joints include main insulation scratches, main insulation impurities, and contaminated water (Yifeng et al., 2020; Wu et al., 2010; Wang et al., 2007; Zhang Jing et al., 2014; Wang et al., 2014). Literature (Wu et al., 2010) analyzed a breakdown accident in a 220 kV cable joint, revealing that cracks in the insulation caused the joint failure. Literature (Wang et al., 2007) calculated the electric field distribution and strength at 110 kV under constant voltage, focusing on electric field distortion issues. Literature (Wang et al., 2014) primarily studied the insulation aging of 10 kV cross-linked cables within 10 years, comparing the average breakdown voltage of new and old cables. Literature (Yan et al., 2009) investigated the power frequency breakdown characteristics of water tree-resistant XLPE power cables, conducting stepwise breakdown tests on original and aged cable samples to study the power frequency breakdown characteristics of XLPE cables.
In this paper, a typical defect simulation model is established to quantitatively analyze the impact of different types of defects on cable insulation. Simulated construction defects are also used to conduct withstand voltage tests. Using COMSOL simulations, the electric field distribution characteristics of scratches, moisture, and contaminated particles on the XLPE insulation surface of cable joints are compared with normal conditions to explore the extent of electric field distortion caused by various defects. Experimental settings quantitatively establish three types of defects in the XLPE insulation of cable joints, and the average breakdown voltage for each defect is obtained based on experimental results, exploring which defect causes the most significant change in breakdown voltage. This helps understand the hazards brought by typical defects in insulation materials and evaluates the impact of typical construction defects on the operational safety of cable joints, ultimately determining the degree of insulation loss in power cables. Electric Field Distribution Characteristics Of Insulation Defects.
2 XLPE slices and defect models
Given the cylindrical structure of the cable, which includes components such as the conductor and copper shielding layer, a sheet model of XLPE insulation was established to focus solely on the electric field changes in the XLPE, consisting of a semi-conductive layer and XLPE layer. Firstly, a prismatic air gap is utilized to simulate the main insulation scratch defect, with a length and width of 300 mm and a depth of 1 mm. Next, the moisture part is simulated by a water film without gaps adhered to the insulation material, measuring 300 mm in length and width and 3.4 mm in height. Conductive metal particles with a radius of 0.1–0.3 mm are set inside the water film as contaminateds, randomly distributed on the insulation surface. Finally, metal particles are added to the XLPE insulation model, considering the impact of metal particle impurity size on breakdown voltage, with semi-spherical copper impurities of different radii (0.3, 0.4, 0.5, 0.6, 0.7 mm) randomly distributed on the insulation surface. The simulation parameters for the XLPE insulation slice model of cable joints are shown in Table 1.
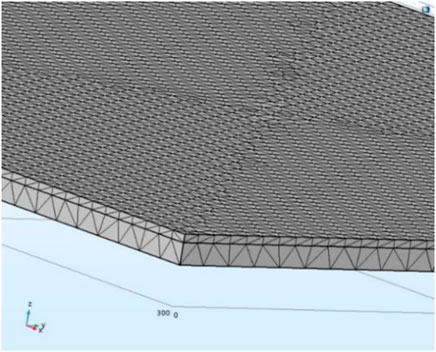
Based on the parameters in Table 1, a 3D sheet model of XLPE containing a semi-conductive layer and cross-linked polyethylene with dimensions 300 mm × 300 mm × 5.8 mm is established for electrostatic field analysis (Zhang Wei et al., 2014; Ren and Yan, 2007), as shown in Figure 1.
3 Simulation analysis of XLPE slices
3.1 Normal sample
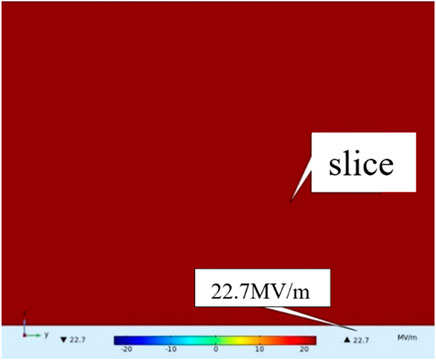
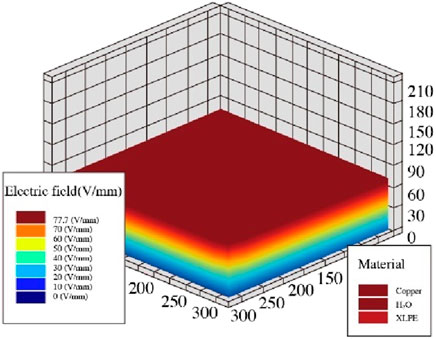
After setting up, the voltage is applied. Figure 2 shows the electric field distribution and the 3D model, indicating that the electric field distribution within the slice is uniform, with an electric field value of 22.7 MV/m.
3.2 Surface scratches
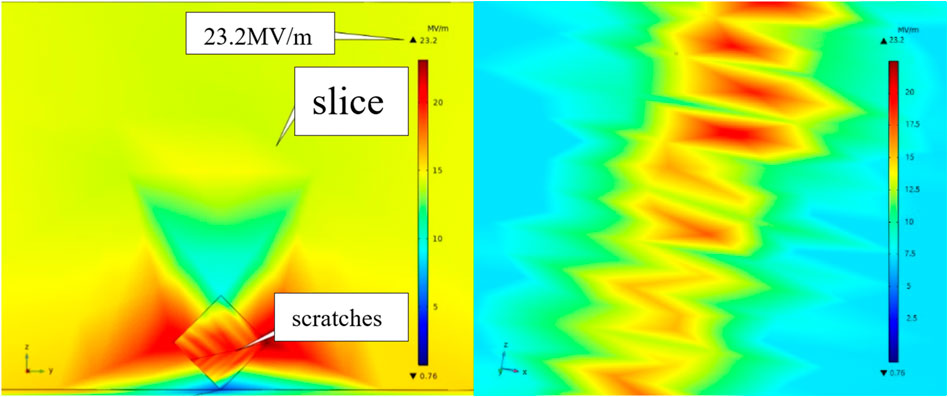
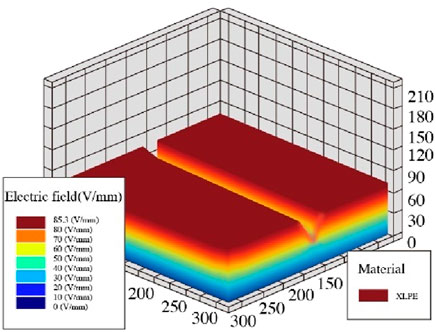
As shown in Figure 3, the maximum field strength at the scratch location on the XLPE slice model is 23.2 MV/m, while the electric field strength in the non-scratch areas of the same slice is only 14.7 MV/m. Figure 4 presents the 3D electric field distribution of the XLPE scratch model, showing significant electric field distortion at the scratch compared to the defect-free condition. Scratches not only damage the surface of the insulation, reducing the insulation thickness at the scratch, but also cause changes in the relative dielectric constant at the air gap and XLPE main insulation interface, leading to electric field distortion.
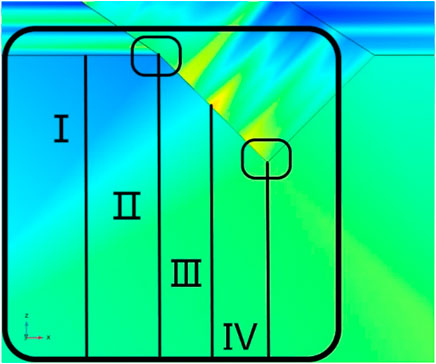
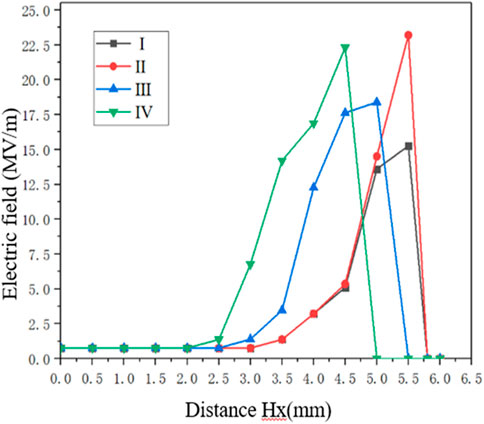
To study the changes in field strength around the scratch, the slice was sectioned perpendicularly to the scratch direction, as shown in Figure 5. Hx represents the distance from the bottom of the slice to the top, and electric fields along paths I, II, III, and IV were analyzed for variation patterns. Figure 6 shows the electric field intensity changes corresponding to the cross-sectional paths of the slice. When Hx = 0 mm, it represents the bottom end of the slice. Along path I, the field strength gradually increases between HⅠ = 3.0–5.8 mm, reaching a maximum of 15.6 MV/m at HⅠ = 5.8 mm. Along path II, the field strength uniformly rises between HⅡ = 3.0–4.5 mm, with significant changes from 4.5 to 5.8 mm. Figure 4 shows that path II bends at the scratch, causing severe field distortion, with the field strength peaking at 23.2 MV/m at HⅡ = 5.8 mm, about 1.6 times that of the non-defective area. Path III shows a similar trend to path I, with the field strength peaking at 18.39 MV/m at HⅢ = 5.0 mm. Path IV resembles path II, with significant field distortion between 3.0 and 4.5 mm, and the field strength peaking at 23.0 MV/m at HⅣ = 4.5 mm, as shown in Figure 5.
3.3 Surface moisture
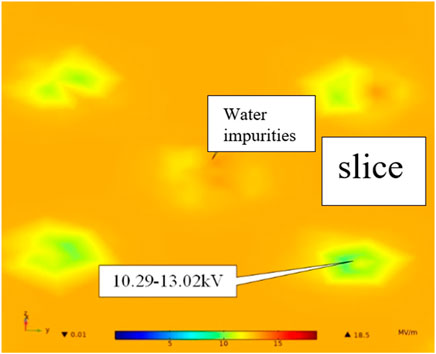
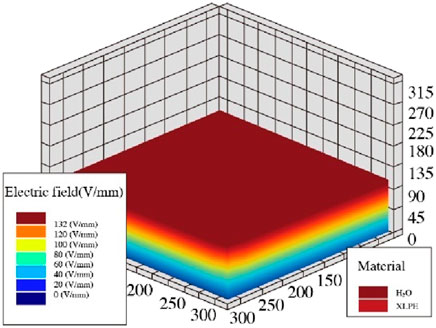
The XLPE surface moisture model shows that under pure water conditions, the electric field strength at the interface between the water film and the slice is 22.4 MV/m, which is consistent with normal conditions. As shown in Figure 7, in the presence of contaminated water, the field strength is 10 MV/m, and the non-moist areas have an electric field strength of 13 MV/m. The maximum potential difference between the contaminated in the contaminated water and the slice interface reaches about 2 kV, with the highest field strength at the contaminated-slice interface being 18.5 MV/m. Figure 8 shows the 3D electric field distribution of the XLPE moisture model, where contaminated water adheres to the upper surface of the moisture model without gaps. When the same voltage is applied, the thickness of the XLPE layer remains consistent, leading to uniform field distribution, but the field strength changes at the contaminated particle-XLPE interface.
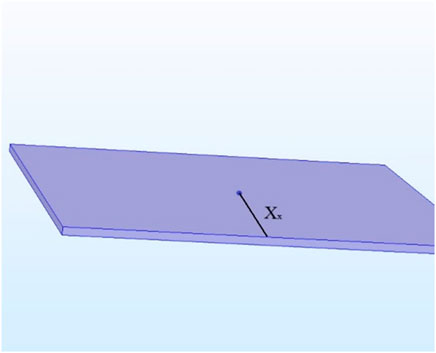
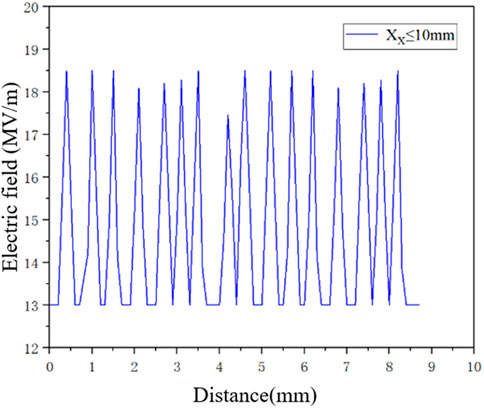
Figure 9 shows the relationship between the electric field strength and the distance from the center of the model surface to the side (Xx) within 10 mm, focusing on the interface between contaminateds in the contaminated water and the XLPE model. Figure 10 presents a line graph of electric field strength variations within 10 mm of Xx, showing significant fluctuations along the Xx direction due to the severe impact of contaminated particles in the contaminated water on field strength. When Xx ≤ 0.5 mm, the field strength varies between 3.2 and 5.5 MV/m, peaking at 18.5 MV/m, which is 1.22–1.4 times the normal value. This is because the larger the contaminated water area on the XLPE moisture model surface, the more conductive impurities in the water, increasing its conductivity and enhancing the nearby electric field. The water film is prone to electroosmosis under the electric field, inducing water tree growth (Xiufeng and Xianri, 2017; Shaw and Shaw, 2010; Yang et al., 2021a), significantly affecting the insulation performance of the material.
3.4 Surface contaminated particles
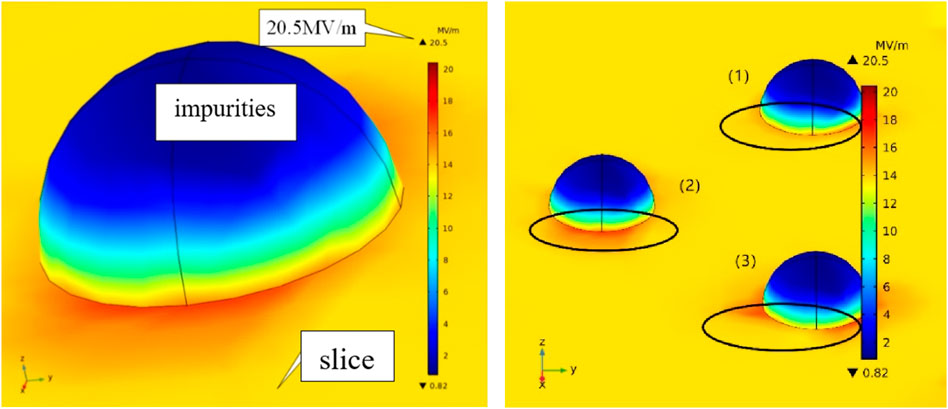
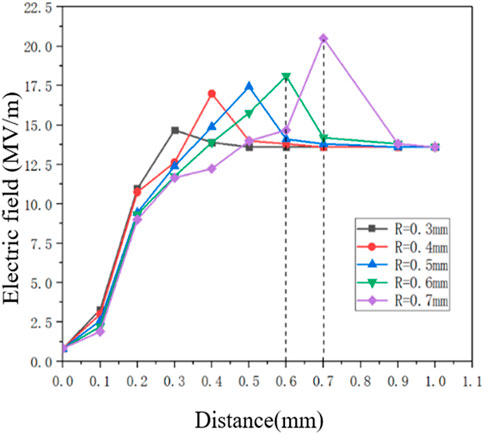
As shown in Figure 11, the maximum field strength at the contaminated particle-XLPE insulation interface is 20.5 MV/m, nearly 1.5 times the normal condition of 13.6 MV/m. Figure 12 shows the 3D electric field distribution of the XLPE contaminated model, with the metal conductive contaminateds affecting field strength changes.
Figure 13 shows a line graph of electric field strength variations within 1 mm of the center of different radius particles to the side (Lx) on the XLPE slice. The graph shows that the electric field strength at the XLPE interface gradually increases with the radius of the contaminated particles. When Lx = R, the field strength at the contaminated-model interface peaks. When R = 0.3 mm, the maximum field strength is 14.68 MV/m, and it increases regularly with larger contaminated radii, peaking at 18.1 MV/m when R = 0.6 mm. When R = 0.7 mm, the field strength distortion at the contaminated-model interface is the highest, with a field strength of 20.5 MV/m, 1.5 times that of the normal XLPE surface. Thus, a slight increase in contaminated radius leads to an increase in field strength, with larger particles causing greater field distortion at the interface.
4 Experimental methods and result analysis
4.1 Experimental setup
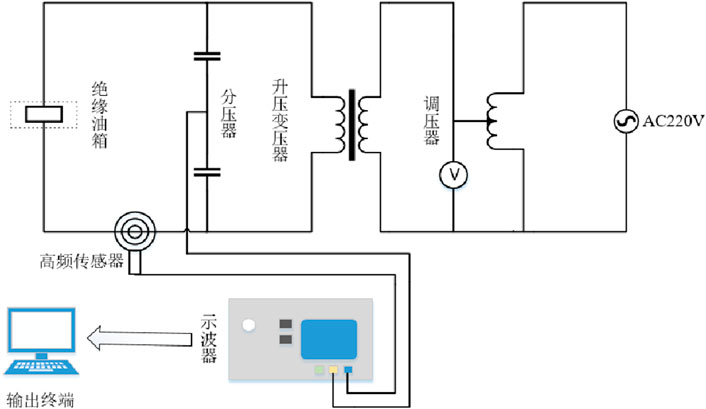
Power frequency voltage pressurization experiments were conducted according to the national standard GB/T 1048.1-2006, “Test Methods for Electrical Strength of Insulating Materials.” The breakdown voltage of samples with different defects under different voltage levels, as well as normal defect-free samples, was compared and analyzed to investigate the breakdown voltage under various defects. The schematic diagram and experimental platform are shown in Figure 14. The entire pressurization experimental platform consists of a voltage regulator, protective resistor, experimental electrode, transformer, divider, oscilloscope, and outputterminal.
4.2 Experimental methods
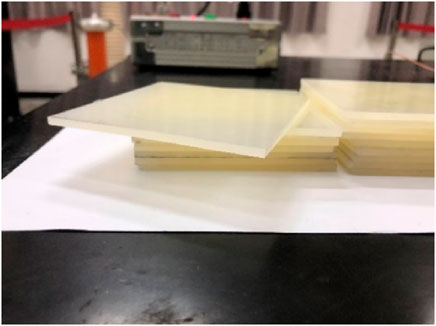
Several cross-linked polyethylene (XLPE) insulation slices were customized from a cable manufacturer, as shown in Figure 15. The XLPE slices were rinsed with anhydrous ethanol to remove surface dust and dirt, then air-dried under natural conditions. Subsequently, they were sequentially placed using sterile tweezers according to their group and order to avoid any interference from other conditions affecting the experimental results.
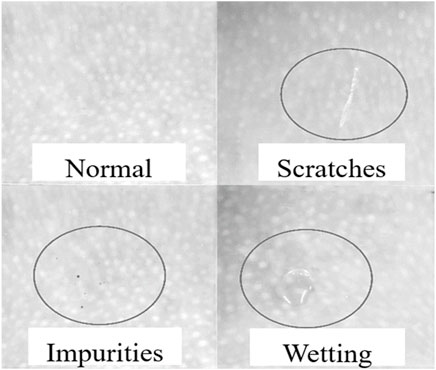
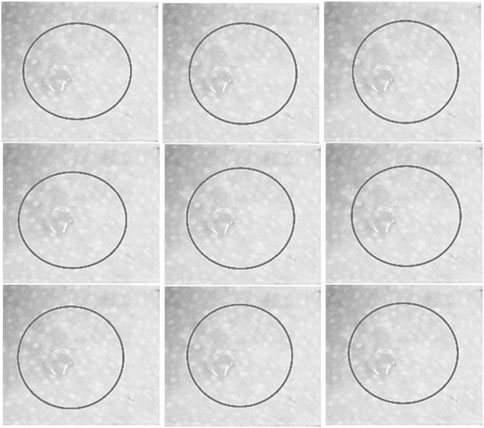
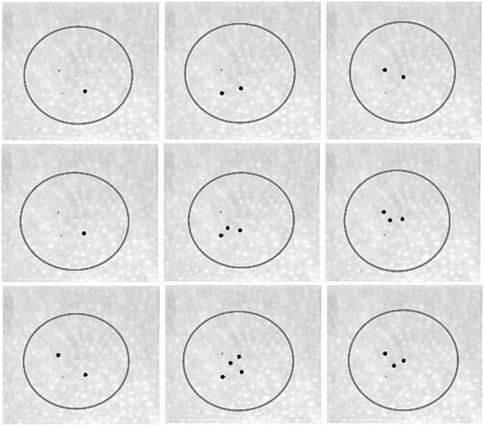
After drying, four types of sample groups were prepared: normal defect-free, scratched, moisture-exposed, and metal particle-contaminated slices, as shown in Figure 16.
Bostrom et al. (2003); Bartnikas and Eichhorn (1983); Hagen and Ildstad (1993); Marzinotto et al. (2006); Urbanczyk (2011); Yang et al. (2021b); Yang et al. (2024) indicate that the greater the dielectric constant of impurities and the sharper the shape of defects, the more severe the distortion of the electric field inside the insulation. Therefore, when preparing defect slices, the following points should be noted:
(1) When creating scratched defect samples, it is essential to strictly control the length, width, and height of the scratches, using a hydraulic cutter to ensure the reliability of variables in each group.
(2) Humid samples should be prepared in weather with low humidity, or reasonable dehumidification treatment should be conducted on the slices before sealing. Placing the slices in a high-humidity environment or in an environment with chemical corrosives may lead to unintended soaking and moisture absorption during the experiment.
(3) Contaminated slices need to be cleaned and placed in a vacuum chamber to ensure their surfaces are free of impurities. During the experiment, impurities should be added in a controlled manner to ensure that each addition is manually controllable.
For scratched slices, 5 groups of experiments are set up, with each group consisting of the same 10 slices. As shown in Figure 17. When conducting breakdown experiments with scratched slices for different experimental groups, the following points should be noted:
(1) Divide the five groups into a, b, c, d, e, each with ten slices of the same specification.
(2) Use a hydraulic cutter to control scratch variables in different groups. The scratch length and width are the same within each group: Group a with a scratch length of 4 mm and depth of 0.5 mm, Group b with a length of 3 mm and depth of 0.5 mm, Group c with a length of 4 mm and depth of 0.2 mm, Group d with a length of 4 mm and depth of 0.6 mm, and Group e with a length of 3 mm and depth of 0.6 mm.
(3) Seal the slices after creating the scratches.
(4) Maintain the same temperature and humidity during the experiment, sealing the groups after preparation to ensure no impurities.
For moisture slices, five experimental groups were also set up, with each group consisting of ten slices, as shown in Figure 18. The following points should be noted:
(1) Divide the 5 groups into a, b, c, d, e, each with 10 slices of the same specification.
(2) Use laboratory test tubes to drop equal amounts of tap water on the slices within each group, as shown in groups a, b, c, d, e. Drop approximately 2 mL of water on each slice and let it sit for about 20 min before experimentation.
For contaminated slices, also, five experimental groups were also set up, with each group consisting of ten slices, as shown in Figure 19. The following points should be noted:
(1) Divide the 5 groups into a, b, c, d, e, each with 10 slices of the same specification.
(2) Carefully select metal particles for each group under a microscope, with spherical particles of radii 1, 2, 3, 4, and 5 mm, respectively. Ensure a radius deviation of ±0.5 mm and maintain the same number of particles per slice.
4.3 Experimental results and analysis
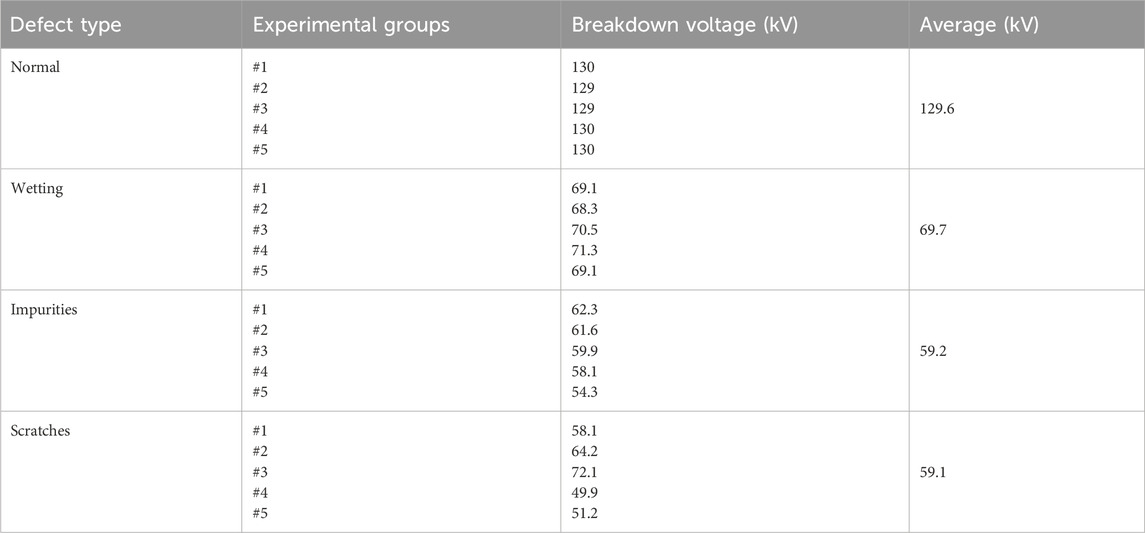
For each defect sample, five groups of as-similar-as-possible samples should be created, and the average breakdown voltage was recorded. The experimental data are shown in Table 2.
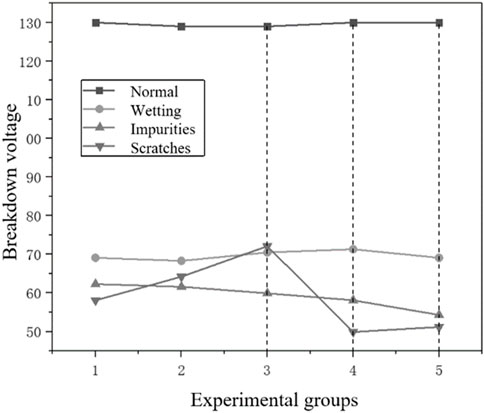
The average breakdown voltage results are shown in Figure 20. The average breakdown voltage of normal XLPE slices is 129.6 kV. For the scratched group slices, the average breakdown voltage varies significantly depending on the experimental setup. Groups 1 and 2, with the same scratch depth, showed higher breakdown voltage with shorter scratch lengths. Groups 1, 3, and 4, with the same scratch length and depths of 0.5, 0.2, and 0.6 mm, had average breakdown voltages of 58.1, 72.1, and 49.9 kV, respectively. The deeper the scratch, the lower the breakdown voltage, with the most significant intergroup variation and impact on breakdown voltage. For slices with contaminated water droplets, the average breakdown voltage is 69.7 kV, 0.53 times that of the normal slices, with stable breakdown voltage across the groups. For contaminated particle slices, the average breakdown voltage is 59.2 kV, 0.46 times that of normal slices. The average breakdown voltage difference among the five groups was 0.7, 1.7, 1.8, and 3.8 kV. The larger the contaminated particle radius, the more significant the impact on the breakdown voltage of the XLPE slices.
5 Conclusions
This paper establishes an XLPE insulation slice model for cable joints to study the changes in the electric field under three types of defects. The results suggest that scratches on the XLPE model surface cause the most significant changes in the electric field, with the field strength increasing noticeably closer to the scratch bends, peaking at 23.2 MV/m, about 1.6 times the normal value. For moisture defect models, the highest electric field strength appears at the contaminated-slice interface in the water at 18.5 MV/m. Regarding contaminated particles defects, as the particle radius increases, the electric field strength increases, reaching a maximum of 20.5 MV/m at R = 0.7 mm, approximately 1.5 times the normal value.
Experimental results demonstrate that deeper scratches make XLPE slices more prone to breakdown, with an average breakdown voltage of 59.1 kV. When the XLPE surface is moist, the average breakdown voltage is 69.7 kV. When contaminated particles are present, the larger the radius of the particles, the lower the breakdown voltage, making the XLPE more prone to breakdown, with an average breakdown voltage of 59.2 kV.
Combining simulation and experimental data, it is evident that scratches on the surface of XLPE insulation in cable joints have the most severe impact on insulation. Therefore, during the actual construction of cable joints, special attention should be given to avoiding scratches on the main insulation surface, as they can significantly alter the insulation performance and severely affect the operational safety of power cables.
Data availability statement
The original contributions presented in the study are included in the article/supplementary material, further inquiries can be directed to the corresponding author.
Author contributions
GH: Writing–original draft, Writing–review and editing, Conceptualization, Methodology, Project administration. WZ: Writing–review and editing, Conceptualization, Methodology. KS: Conceptualization, Methodology, Writing–original draft, Writing–review and editing. JQ: Formal Analysis, Writing–review and editing. JZ: Writing–review and editing. JH: Writing–review and editing. XZ: Writing–review and editing.
Funding
The author(s) declare that financial support was received for the research, authorship, and/or publication of this article. This paper is supported by Science Project Funding of the State Grid Corporation of China (Grant No. 5500-202255402A-2-0-ZN).
Acknowledgments
The authors would like to express gratitude to the editors and the reviewers for their constructive and helpful comments for substantial improvement of this paper.
Conflict of interest
Authors GH, WZ, KS, JZ, JH, JQ, and XZ were employed by State Grid Wuxi Power Supply Company.Ltd.
The authors declare that this study received funding from Science and Technology Program of the State Grid Corporation of China. The funder had the following involvement in the study: study design, data collection and analysis, and preparation of the manuscript.
Publisher’s note
All claims expressed in this article are solely those of the authors and do not necessarily represent those of their affiliated organizations, or those of the publisher, the editors and the reviewers. Any product that may be evaluated in this article, or claim that may be made by its manufacturer, is not guaranteed or endorsed by the publisher.
References
Bartnikas, R., and Eichhorn, R. M. (1983). Molecular structure and electrical behavior[M]. (Philadelphia, USA: American Society for Testing and Materials), 783.
Bostrom, J. O., Marsden, E., Hampton, R. N., and Nilsson, U. (2003). Electrical stress enhancement of contaminants in XLPE insulation used for power cables. IEEE Electr. Insul. Mag. 19 (4), 6–12. doi:10.1109/mei.2003.1226729
Cheng, Y., Yan, P., and Wang, J. (2007). The infuence of the dielectric properties of the semiconductive layer on the electric feld distribution in cables. Electr. Appl. (12), 47–49. doi:10.3969/j.issn.1672-9560.2007.12.014
Fang, C., Tang, S., and Pan, M. (2016). Simulation and analysis of typical defects in 10 kV cable joints. J. China Three Gorges Univ. Nat. Sci. 38 (02), 55–59. doi:10.13393/j.cnki.issn.1672-948X.2016.02.013
Hagen, S. T., and Ildstad, E. (1993). Reduction of AC-breakdown strength due to particle inclusions, in 3rd international conference on power cables and accessories 10 kV∼500 kV London, UK. 165–168.
Liu, X., Cui, T., and Lin, L. (2003). Application and technological progress of cross-linked polyethylene. Synthetic Resins Plastics 20 (5), 52–60. doi:10.3969/j.issn.1002-1396.2003.05.015
Liu, Y., Wang, L., Wang, L., Cao, X., Xu, X., and Ji, W. (2006). Necessity of reducing the insulation thickness of HV XLPE cables from the defect point of view. High. Volt. Eng. 32 (7), 29–32. doi:10.13336/j.1003-6520.hve.2006.07.011
Marzinotto, M., Mazzetti, C., Pompili, M., and Schiaffino, P. (2006) Impulsive strength of power cables with different XLPE compounds, in Proceedings of IEEE conference on electrical insulation and dielectric phenomena. Kansas City, USA: IEEE, 233–236.
Orton, H. (2015). Power cable Technology review. High. Volt. Eng. 41 (4), 1057–1067. doi:10.13336/j.1003-6520.hve.2015.04.001
Rui, L., Xiangzhen, M., Zhou, L., and Pengnan, T. (2018). Status quo and prospect of distribution network fault location. Electr. Power Eng. Technol. 37 (06), 20–27. doi:10.19464/j.cnki.cn32-1541/tm.2018.06.003
Shaw, M. T., and Shaw, S. H. (2010). Water treeing in solid dielectrics. IEEE Trans. onElectrical Insul. 19 (5), 419–452. doi:10.1109/tei.1984.298768
Urbanczyk, A. (2011). “State of the art XLPE compounds for power cables and recent developments 7th International Symposium on Advanced Topics,” in Electrical engineering (Bucharest, Romania: University Politehnica of Bucharest), 1–4.
Wang, C., Liu, Y., Gang, L., and Yao, Z. (2007). Finite element method applied to the analysis of stress cone defects in cable terminals. High. Volt. Technol. (5), 152–154. doi:10.13336/j.1003-6520.hve.2007.05.037
Wang, J., Qinghua, Z., Zhang, W., Liu, H., and Kong, S. (2014). Partial discharge characteristics of typical process defects in cold shrink intermediate joints of 10kV XLPE cables. Insul. Mater. (6), 61–64. doi:10.16790/j.cnki.1009-9239.im.2014.06.016
Wu, M., Bao, J., Wang, J., et al. (2010). Analysis of a breakdown failure of prefabricated 220kV cable joint. High. Volt. Appar. 46 (5), 95–97. doi:10.13296/j.1001-1609.hva.2010.05.004
Xiufeng, Li, and Xianri, C. X. (2017). Etc Design of a real-time observation system for water tree aging in cross-linked polyethylene insulation. Insul. Mater. (06), 73–77. doi:10.16790/j.cnki.1009-9239.im.2017.06.015
Yan, M., Luo, J., Yang, L., and Zheng, C. (2009). Power frequency breakdown characteristics of water resistant XLPE power cables. High. Volt. Technol. (10), 2395–2400. doi:10.13336/j.1003-6520.hve.2009.10.041
Yang, N., Dong, Z., Wu, L., Zhang, L., Shen, X., Chen, D., et al. (2021b). A comprehensive review of security-constrained unit commitment. J. Mod. Power Syst. Clean Energy 10 (3), 562–576. doi:10.35833/mpce.2021.000255
Yang, N., Xun, S., Liang, P., Ding, L., Yan, J., Xing, C., et al. (2024). Spatial-temporal optimal pricing for charging stations: a model-driven approach based on group price response behavior of EVs. IEEE Trans. Transp. Electrification, 1. doi:10.1109/tte.2024.3385814
Yang, N., Yang, C., Wu, L., Shen, X., Jia, J., Li, Z., et al. (2021a). Intelligent data-driven decision-making method for dynamic multisequence: an E-seq2seq-based SCUC expert system. IEEE Trans. Industrial Inf. 18 (5), 3126–3137. doi:10.1109/tii.2021.3107406
Yifeng, Z., Gang, L., Xie, Y., Jiasheng, H., and Ningxi, Z. (2020). Space charge behavior of retired high-voltage XLPE cables. Electr. Power Eng. Technol. 39 (3), 151–157.
Yuxin, L., Bo, L., Yawei, Z., Yufei, C., Xiaoming, Z., and Yuan, Y. (2018). A frequency-tuned resonant system for PD measurement and withstand test. Electr. Power Eng. Technol. 37 (06), 44–48. 74. doi:10.19464/j.cnki.cn32-1541/tm.2018.06.007
Zhang, J., Zhongqun, L., and Wang, W. (2014a). The influence of stress cone position on the distribution of electric field at high-voltage cable terminals under impulse voltage. High. Volt. Technol. (7), 51–56. doi:10.13296/j.1001-1609.hva.2014.07.009
Zhang, W., Li, H.-J., Liu, C., Yang, Y., Huang, Z., and Xue, R. (2014b). Parameter estimation technique for the semi-conducting layers in single-core XLPE cable. IEEE Trans. Dielectr. Electr. Insulation 21, 1916–1925. doi:10.1109/tdei.2014.004263
Keywords: breakdown voltage, cable, cross-linked polyethylene (XLPE), defects, electric field strength
Citation: He G, Zhang W, Sun K, Qi J, Zhao J, Han J and Zhu X (2024) The impact of XLPE surface defects on electric field and breakdown voltage. Front. Energy Res. 12:1476046. doi: 10.3389/fenrg.2024.1476046
Received: 05 August 2024; Accepted: 26 August 2024;
Published: 19 September 2024.
Edited by:
Zhengmao Li, Aalto University, FinlandReviewed by:
Nishant Kumar, Indian Institute of Technology Jodhpur, IndiaZhibin Qiu, Nanchang University, China
Fang Chunhua, China Three Gorges University, China
Copyright © 2024 He, Zhang, Sun, Qi, Zhao, Han and Zhu. This is an open-access article distributed under the terms of the Creative Commons Attribution License (CC BY). The use, distribution or reproduction in other forums is permitted, provided the original author(s) and the copyright owner(s) are credited and that the original publication in this journal is cited, in accordance with accepted academic practice. No use, distribution or reproduction is permitted which does not comply with these terms.
*Correspondence: Wei Zhang, MjMwNDM4MDgyMEBxcS5jb20=
 Guanghua He
 Wei Zhang
