 Mingqian Tian
 Yanni Yu1
94% of researchers rate our articles as excellent or good
Learn more about the work of our research integrity team to safeguard the quality of each article we publish.
Find out more
ORIGINAL RESEARCH article
Front. Energy Res. , 23 January 2025
Sec. Sustainable Energy Systems
Volume 12 - 2024 | https://doi.org/10.3389/fenrg.2024.1472980
Ocean thermal energy conversion is a new energy technology that utilizes the temperature difference conditions of seawater to generate electricity. This paper focuses on the closed cycle of ocean thermal energy conversion using ammonia as the working fluid. Based on pressure energy utilization devices such as pressure exchangers, hydraulic turbines, and ejectors, three methods are proposed to recover and utilize the pressure energy of the lean ammonia solution, in order to improve the thermal efficiency and systematic performance. By analyzing and comparing the performance of the cycle, it can be concluded that all three methods can achieve a utilization of pressure energy, and under the same conditions, the highest thermal efficiency of the ejector cycle is 5.71%.
According to the 2017 Greenhouse Gas Bulletin of the World Meteorological Organization, global carbon emissions reached their peak in nearly 800,000 years in 2016. How to reduce global carbon emissions and control climate issues such as global warming has become a common challenge faced by all humanity. And the world’s energy shortage is escalating. Improving energy structure and increasing the proportion of new energy in energy consumption is urgent (Zhang et al., 2019). Ocean thermal energy conversion refers to the thermal energy generated by the temperature difference between the surface seawater and the deep cold seawater (Zhai, 2021). Ocean thermal energy is the largest reserve of marine renewable energy, with a global total of approximately 40 billion kW (Dashu, 2019), and the total amount of usable ocean thermal energy is relatively large, about 1 × 10⁸ kW, only next only to wave power resources, and is one of the most promising marine energy (Liu et al., 2020; Faizal and Ahmed, 2011; Esteban and Leary, 2012).
The fundamental premise of the ocean thermal energy conversion (OTEC) technology is to heat up and evaporate a working liquid, then the created steam boosts the turbine to spin and generate electricity using surface warm ocean water (25°C–30°C). The thermodynamic cycle is completed after the fluid is condensed again to a liquid state by the temperature of a deep cold-water source (4°C–6°C). Nowadays, research on OTEC mainly focuses on aspects such as different OTEC cycles, efficient and compact heat exchangers, turbine expanders, working fluid types, economic analysis, and off-design performance (Yang et al., 2022).
The Rankine cycle is the simplest and most widely used thermodynamic cycle (Imran et al., 2014; Wang, 2016). The Rankine cycle of ocean thermal energy conversion uses pure substances as working medium (Deng et al., 2014), and its isothermal evaporation or condensation will cause significant irreversible losses, and the improvement of systematic performance is limited. The earliest marine thermoelectric power generation cycle is based on the Rankine cycle and is still used in marine thermoelectric power generation devices. In 1984, Kalina proposed a new power cycle-Kalina cycle (Kalina, 1984), which uses ammonia water mixture as working medium. The efficiency of Kalina cycle is 1.6–1.9 times higher than that of Rankine cycle. In 1994, Professor Uehara of Saga University in Japan proposed a new closed thermoelectric power generation cycle system-Uehara cycle (Uehara et al., 1998). The Uehara cycle includes a work cycle and a separation/absorption cycle, and its thermal efficiency is 1%–2% higher than that of Kalina cycle (Bin, 2020). In 2012, a new cycle system was proposed by the First Institute of Oceanography, State Oceanic Administration (now the First Institute of Oceanography, MNR) called the Guohai cycle. Up to now, the ocean crossing cycle has the highest thermal efficiency, about 5.1%, and the Rankine cycle has the lowest, only 3.1% (Liu et al., 2012).
The first Institute of Oceanography of the Ministry of natural resources of China has established a set of 15 kW indoor test platform (Chen and LiuLei, 2021; Chen et al., 2019), using the complete Rankine cycle results, and the circulating working fluid is ammonia. The cold source of the laboratory uses normal temperature water, and the heat source uses high-temperature gas to heat the seawater, but the simulated temperature of the surface seawater and deep seawater used in the experiment are higher than the actual sea state (Peng et al., 2018; Liu, 2014). Fan et al. (2024) Proposed the dynamic model of OTEC heat transfer and power generation based on Kalina cycle, and carried out the experimental verification of 30 kW Kalina cycle. Chen et al. (2024) added a secondary heat recovery device and built and analyzed a 10 kW OTEC experimental system. Hu et al. (2023) and others built an OTEC device based on ORC, and conducted experimental research on the performance of the device under design and off design conditions.
In the ocean thermoelectric power generation cycle, the commonly used nonazeotropic working medium is ammonia-water working fluid. However, the flow rate of the high-pressure lean ammonia solution after being subjected to the separator is large, and it has a large pressure difference from the low-pressure condenser. If the pressure energy contained in this pressure difference can be effectively utilized, it will be an efficient way of improving the system efficiency of a thermal cycle (Liu et al., 2022). In current research on temperature difference energy cycling, the ejector could achieve a utilization of pressure energy. German scholars G. Zezuner and M. Rankine began to study the ejector at the end of the 19th century (Han, 2012). In 2012, Li Xinguo of Tianjin University and others introduced an ejector and a two-stage evaporator, and designed a new cycle (Li et al., 2012). The cycle net output work is greater than the basic Rankine cycle, while the thermal efficiency is less than the Rankine cycle. In 2012, Yuan et al. (2013) of Ocean University of China introduced a liquid-gas ejector to reduce the outlet pressure of the turbine based on the Kalina cycle, used a reheater to improve the output power of the turbine, and the dual turbine made better use of the heat of ammonia. The theoretical cycle efficiency exceeded 5.3%. In 2015, Lee et al. (2015) and others proposed the idea of applying gas ejector to the thermal cycle of Marine energy, and proposed the gas-gas ejector Marine energy thermal cycle. The cyclic use of the ejector reduces the pressure at the turbine outlet and increases the output power of the screen (Lim et al., 2019). After calculation, when the initial mass flow rate separated by the separator is 0.5, the cyclic efficiency can reach 2.47%. In 2017, Miljkovic introduced an ejector (Miljkovic, 2017) in the basic Rankine cycle and designed a new cycle, which drives part of the working fluid from the condenser outlet into the ejector, and the pressure at the turbine outlet was reduced. The efficiency of this cycle is 3.057%.
At present, the research on pressure exchanger and hydraulic turbine has not been applied in the field of OTEC, but has been studied and verified in other research fields. Yuncang et al. (2000) used computational fluid dynamics (CFD) method to simulate the flow field of pressure exchanger under different inlet and outlet pipe radius R and different rotating speeds. Based on the experimental study of self driving rotary pressure exchanger, Wang (2011) designed and established the energy recovery device model of external driving rotary pressure exchanger (pd-rpe) by using external power to drive the rotor for the first time; It provides relevant test basis for the design and improvement of self driving rotary pressure exchanger. Huomujie (Fang and Ma, 2018) et al. Used the external drive rotary pressure exchanger as the research object, the numerical simulation method was used to simulate the turbulent dissipation rate of the model. Wangxinhua (Chang, 2006) briefly described the engineering application, turbine structure and energy recovery device form of energy recovery hydraulic turbine, and discussed the selection, optimization design, speed stability control, mechanical properties and strength of energy recovery hydraulic turbine. In order to study the transient flow characteristics of axial flow pump as hydraulic turbine in runaway process, Miao senchun (Mujie et al., 2021) used the user-defined function in fluent software to simulate the runaway process based on the flow control equation and RNG K - ε turbulence model, and analyzed in detail the variation of its external characteristic parameters, pressure fluctuation characteristics, and the influence of different flow conditions and impeller moment of inertia on the speed.
Enhancing the efficiency of OTEC is a crucial facet of harnessing ocean thermal energy. Although numerous scholars have made significant advances, particularly in heat energy utilization, the pressure energy inherent in high-pressure lean ammonia solutions remains a significant concern. Therefore, this paper centers on the recuperation of the pressure energy in high-pressure weak ammonia solution, advocating the use of pressure exchangers, hydraulic turbines, and ejectors to rebound and apply pressure energy in the cyclic process, which is to elevate the overall thermal efficiency and system performance of the OTEC cycle.
The pressure exchanger cycle is an operational method that aims to optimize the utilization of pressure energy from the lean ammonia solution within the cycling loop by adding a pressure exchanger. The principle is shown in Figure 1.
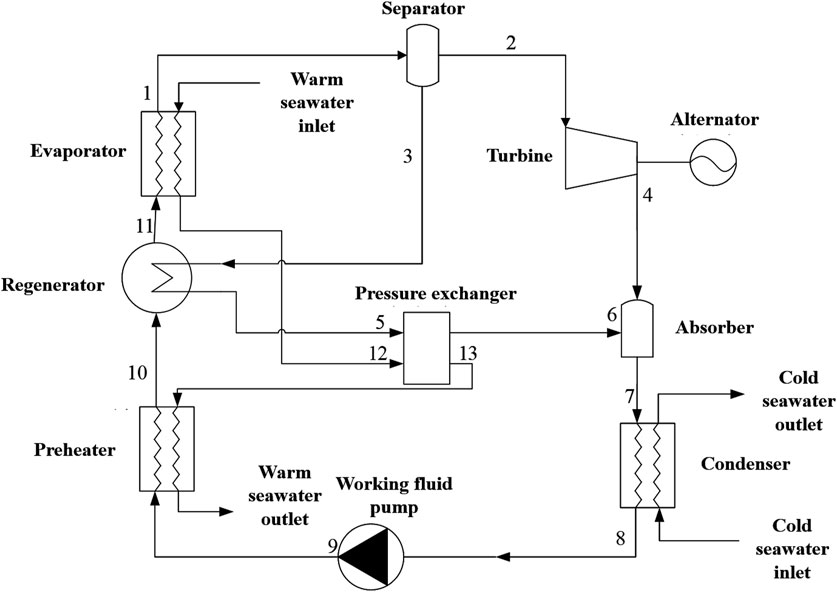
Figure 1. Pressure exchanger cycle system.
This cycle system mainly includes devices such as preheaters, regenerator, evaporator, separator, turbine, generator, absorber, condenser, working fluid pump, and pressure exchanger. Warm seawater from the ocean surface is heated in an evaporator and evaporates a certain concentration of ammonia solution-1, forming saturated ammonia vapor-2-and lean ammonia solution-3-with a certain mass concentration in the separator. Among them, ammonia vapor enters the turbine first, driving the impeller to rotate and do work, thereby driving the generator to work. Lean ammonia solution in the state of high-temperature and high-pressure passes through a regenerator first and its own heat is utilized to heat the basic working fluid-11-that enters the evaporator. After that, the pressure is transferred to warm seawater through a pressure exchanger. The exhaust gas-4-at the turbine outlet is mixed with the solution-6-from the pressure exchanger in the absorber to form ammonia solution-7. Ammonia solution-7-condenses in the condenser through cold seawater from deep ocean layers to become saturated ammonia solution-8. After the saturated ammonia solution is compressed in the pump, it passes through the preheater and regenerator in sequence to absorb the waste heat of warm seawater and the heat of lean ammonia solution, the next thermal cycle begins. In the pressure exchanger cycle system, the heat in the lean ammonia solution is utilized through a regenerator, and the heat absorption in the evaporator is reduced. A pressure exchanger is deployed to recover and utilize its pressure energy, the energy consumption of the warm sea water pump can be reduced, and the system efficiency can be improved.
Taking the pressure exchanger cycle as an example, before starting the cycle process, the values of some parameters must be given. The concentration of ammonia solution is
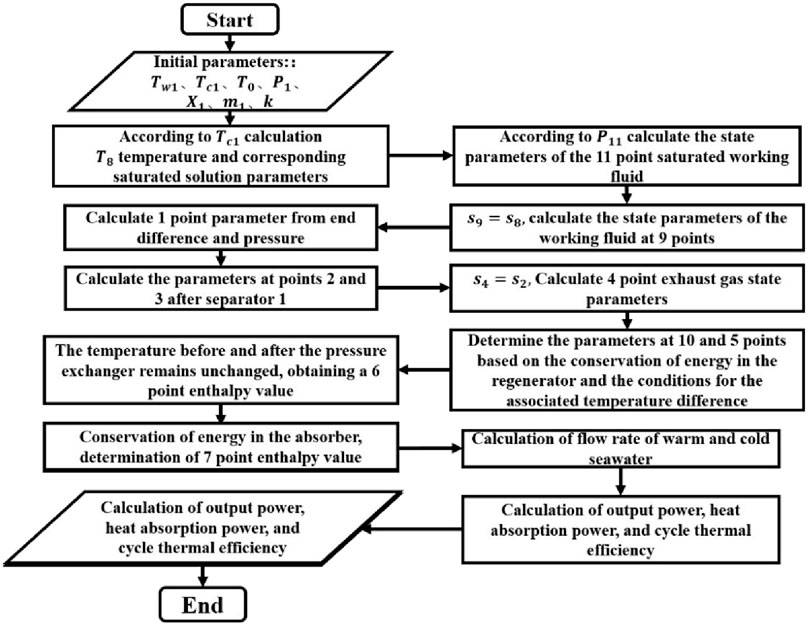
Figure 2. Flowchart of loop calculation.
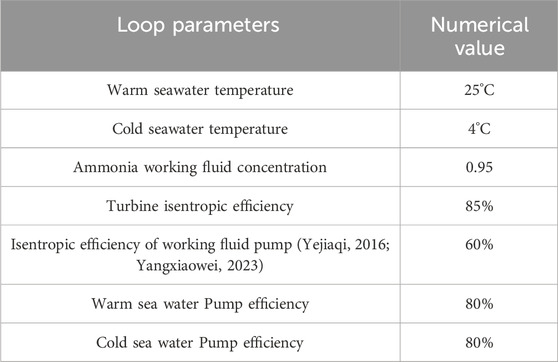
Table 1. Cycle initial parameters.
Thermodynamic parameters are the basic quantities used to characterize the state of matter. REFPROP (Lemmon et al., 2013) is a software developed by the National Institute of standards and Technology (NIST) of the United States, which is specially used to calculate the physical parameters of industrial fluids and their mixtures. The user can obtain the chart of the thermodynamic properties of the fluid through parameter settings, or access the corresponding thermodynamic parameters through program calls.
In order to perform thermodynamic calculations on the cycle process, it is necessary to analyze the various equipment of the cycle and establish a reasonable thermodynamic mathematical model. The state parameters of the working medium at each point of the cycle are calculated according to the Equation of the state of the ammonia solution.
The thermodynamic process of the evaporator involves the absorption of heat from warm seawater by a saturated ammonia solution-11, reaching state point 1, as shown in Figure 1. The ammonia solution at point 1 separates the gas and liquid phases in the separator, so the working fluid at point 1 should be in the gas-liquid two-phase zone. At this point, the pressure at point 1 should be greater than the bubble point pressure of the working fluid to ensure gas precipitation. According to research (Wang and Liu, 2022), for low-temperature heat exchangers, the temperature between the cold and hot fluids inside the heat exchanger has a subtle difference, which can reduce losses during the heat exchange process and improve the quality of heat exchange. Therefore, in theoretical calculations, the heat transfer end difference of the evaporator is taken as 2°C (Miaosenchun, 2024).
Neglecting the heat loss during the heat exchange process of the evaporator, according to the energy conservation equation, there is:
In Equation 1 where
At this point, the heat absorption capacity of the evaporator is:
In Equation 2 where
Separation is carried out by using different mass of mixed components or particle sizes of dispersed systems. During operation, the wet vapor in the evaporator is separated into gas and liquid phases in the separator to ensure that the separated dry saturated vapor enters the turbine and prevent liquid from entering the turbine and causing cavitation on the blades.
The ammonia solution at point 1 is separated by a separator, as shown in Figure 1, to separate saturated ammonia gas-2-and saturated lean ammonia solution-3. According to the equation of conservation of solution mass:
In Equation 3 where
Conservation of ammonia mass in the separator,
In Equation 4 where
Calculate the solution mass at points 2 and 3 in Figure 1. As shown in Equations 5, 6:
The thermodynamic process of the working medium in the turbine is an isentropic expansion process, including as shown in Equation 7:
where
Calculate the thermodynamic parameters such as temperature and enthalpy of the exhaust gas at the turbine outlet point based on pressure
In Equation 8 where
In the absorber, the exhaust steam at the turbine outlet is absorbed by the lean ammonia solution and then enters the condenser. Separation is carried out by using different mass of mixed components or particle sizes of dispersed systems. During operation, the wet vapor in the evaporator is separated into gas and liquid phases in the separator to ensure that the separated dry saturated vapor enters the turbine and prevent liquid from entering the turbine and causing cavitation on the blades. Assuming that the inlet and outlet pressure of the absorber remains constant, there is:
In Equation 9 where
During the mixing process, the mass of the solution is conserved, as shown in Figure 1:
In Equation 10 where
Ignoring energy loss, the enthalpy value at point 7 of Figure 1 can be calculated based on energy conservation:
In Equation 11 where
The ammonia working fluid is condensed into a saturated liquid at the outlet of the condenser. As shown in Figure 1, other thermodynamic parameters can be determined based on the working fluid temperature and concentration at outlet 8. The working fluid undergoes energy exchange in the condenser, and the required cold seawater flow rate is calculated based on the energy conservation equation. The energy conservation formula in the condenser is:
In Equation 12 where
The working fluid does not contain a gas phase at the inlet of the pump, which can avoid cavitation. Therefore, the working fluid in the circulating system is in the saturated liquid phase at the inlet of the pump, as shown in Figure 1. The thermodynamic process of working fluid in the pump is an adiabatic compression process, including:
In Equation 13 where
The power consumption of the pump is:
In Equation 14 where
However, because the working fluid solution is in the liquid phase, its compressibility is very small. In general geothermal mechanics calculation, the compression work of the pump can be approximated to 0. During the calculation process, the pump power has a small impact on the performance of the cycle.
Warm seawater is used to preheat refrigerant-9-compressed by the refrigerant pump, as shown in Figure 1. According to the conservation of energy, there is:
In Equation 15 where
At this point, the heat absorbed by the working fluid in the preheater is:
In Equation 16 where
A pressure exchanger is a device that achieves energy recovery through the transfer of pressure energy between two different pressure fluids (Chang et al., 2006; Liu, 2005). Circulating through a pressure exchanger, the pressure energy of the high-pressure lean ammonia solution is transmitted to the low-pressure warm sea water. In the cycle, it is assumed that the pressure exchanger operates without heat loss and does not undergo heat exchange with seawater.
In Equations 17–19 where
The heat exchange process between lean ammonia solution and basic ammonia solution occurs in the regenerator. Among them, the high-temperature lean ammonia solution-3-of the separator heats the low-temperature basic solution-10-of the preheater to a saturated state-11, as shown in Figure 1, where the working fluid at point 11 is in its bubble point state. Assuming no pressure loss in the regenerator. According to the conservation of energy, there is:
In Equation 20 where
There is a countercurrent situation between the two fluids and there is no phase transition process involved. Therefore, according to the calculation formula of logarithmic mean temperature difference:
In Equation 21 where
According to experience, it is assumed that the friction loss of the seawater pump is 4
In Equations 22, 23 where
To evaluate the energy output of a thermal cycle, the net output power of the cycle can be calculated from as shown in Equation 24:
The thermal efficiency of a cycle is a significant parameter for evaluating the cycle. Based on the previous analysis, we can obtain the circulating heat absorption Q. The thermal efficiency of the cycle is calculated according to the net output and heat absorption of the cycle as shown in Equation 25:
The system efficiency calculation of the cycle is obtained based on the net output
The hydraulic turbine cycle achieves recovery and utilization of pressure energy in lean ammonia solution through the work done by the hydraulic turbine. The hydraulic cycle system is shown in Figure 3.
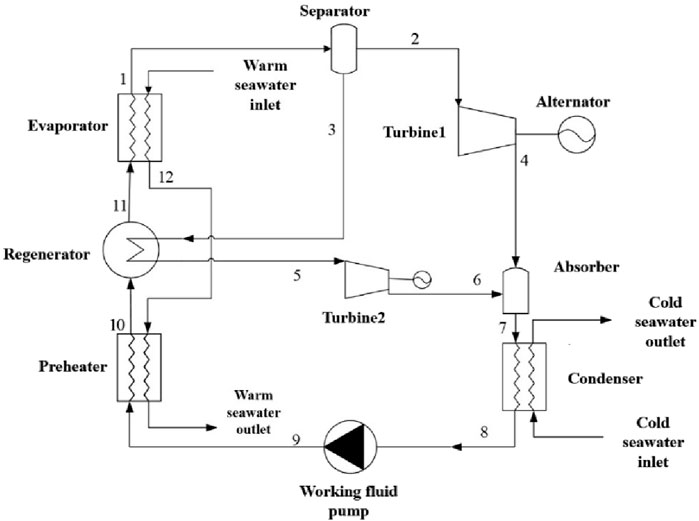
Figure 3. Hydraulic turbine cycle system.
In the hydraulic turbine cycle, the lean ammonia solution-3-in the separator first passes through a regenerator to heat the basic ammonia working fluid-11. After that, high-pressure lean ammonia solution-5-drives the impeller to rotate in the hydraulic turbine, thereby driving the generator to work. The poor ammonia solution-6-after work is mixed with the exhaust gas-4-from the turbine, and condensation occurs in the condenser. The remaining thermal processes of the hydraulic turbine cycle are the same as those of the pressure exchanger cycle. In the hydraulic turbine cycle, the recovery and utilization of pressure energy in lean ammonia solution is mainly achieved through the work done by the hydraulic turbine, thereby improving the output work of the cycle and improving the thermal efficiency of the cycle.
As an energy recovery device, hydraulic turbines can convert energy from fluid working fluids into mechanical energy (Yang et al., 2011). In the cycle, the hydraulic turbine converts the high-pressure potential energy of the lean ammonia solution into mechanical energy, and the main shaft of the hydraulic turbine drives the generator to generate electricity, thereby achieving the recovery and reuse of residual pressure energy in the lean ammonia working fluid, as shown in Figure 2. The calculation formula for the work done by a hydraulic turbine is:
In Equation 27 where
The calculation process of the hydraulic turbine cycle is basically the same as that of the pressure exchanger cycle. The difference lies in that, as shown in Figure 3, the lean ammonia solution pushes the impeller to do work
The difference between the ejector cycle and the abovementioned two cycle systems is that the ejector cycle system does not have an absorber. The ejector replaces the hydraulic turbine in the hydraulic turbine cycle and achieves the mixing of lean ammonia solution-5-and exhaust gas-2. In the ejector cycle, the lean ammonia solution-5-flowing out of the regenerator is the working fluid of the ejector, which mixes with the exhaust gas from the turbine in the ejector. The mixed working fluid-6-enters the condenser for condensation. The remaining thermodynamic processes of the ejector cycle are consistent with the abovementioned two cycles. The principle of the ejector cycle system is shown in Figure 4.
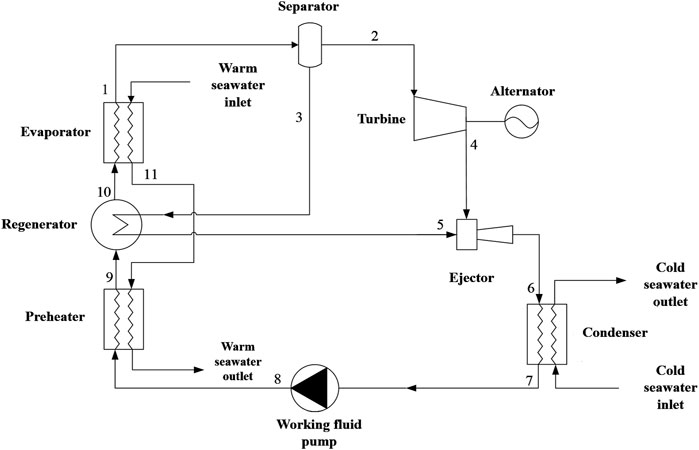
Figure 4. Ejector cycle system.
In the ejector cycle system, the ejector plays a crucial role in improving system performance. The working principle of the ejector shows that the high-pressure lean ammonia solution passing through the ejector can cause a decrease in the pressure of the exhaust gas at the inlet of the ejector, increase the working pressure difference of the turbine, and increase its output power.
The mass ejection coefficient
In Equation 28 in the formula,
Bashenov proposed through experiments that the relationship between the pressure of the liquid-gas ejector and the optimal ejection coefficient u be calculated using the following formula (Lu, 2004):
In Equation 29 in the formula,
The pressure drop of the ejector is a parameter that represents the characteristics of the ejector, and its calculation formula is shown in Equation 30:
During the operation of the ejector, energy dissipation is ignored, and its mixing process follows the principle of energy conservation, as shown in Equation 31, Figure 3:
In the calculation of the ejector cycle, there is a slight difference from the above process, as shown in Figure 4. Before determining the point 4 exhaust gas parameters, the mass ejection coefficient of the ejector should be determined based on the mass flow rate of the lean ammonia solution and ammonia gas. Then, the pressure of the inlet exhaust gas in the ejector should be determined based on the relationship between pressure and ejection coefficient. The exhaust gas pressure and entropy value are determined, and other thermodynamic parameters are obtained according to the parametric equation of the ammonia solution state. Finally, the enthalpy value at point 6 is determined based on energy conservation.
Based on the cycle process and thermodynamic analysis of each equipment in the previous section, this section conducts thermodynamic analysis of the cycle system. After calculation, the mass flow rate of the circulating working fluid in the system is 1 kg/s. The net output work of the cycle is the work done by the turbine minus the work done by the working fluid pump, excluding the work done by the seawater pump.
To simplify the calculation process, the following assumptions are made for each circulation system:
(1) Neglecting the heat loss of working fluids in evaporators, condensers, etc.;
(2) Ignore the friction loss of working fluid flowing in the evaporator, condenser, etc.;
(3) The outlet solutions of the regenerator and condenser are all saturated liquids.;
(4) The heat exchange terminal difference for the evaporator and condenser is 2°C.
Key parameters for different cycle operations include the mass concentration of ammonia in the solution, the inlet temperature of warm and cold seawater, and the working pressure of the cycle. In order to determine the operating conditions for cyclic operation, taking the South China Sea area as an example, based on the changes in surface seawater temperature, the range of warm seawater is selected to be 21°C–28°C. At the same time, the temperature range of cold seawater is selected to be 4°C–7°C. In the process of cycle calculation, if the ammonia mass concentration is too low, it will cause the temperature difference between the two ends of the regenerator to be too small when the temperature of the warm seawater is low, resulting in large area of the regenerator and difficulty in realizing the heat exchange process. At the same time, in order to facilitate comparative analysis of the circulation process within the selected temperature range of warm seawater, the range of ammonia mass concentration was selected from 0.90 to 0.97.
The three different cycles are designed to reasonably utilize the ammonia vapor and lean ammonia solution separated from the ammonia water working medium during the cycle process. In order to ensure that the solution from the outlet of the evaporator can separate saturated vapor and saturated solution, it is necessary to keep the solution in the gas-liquid two-phase zone. In other words, the pressure of the solution from the outlet of the evaporator should be lower than the bubble point pressure of the solution. Based on the state equation of ammonia aqueous solution, the bubble point pressure under different temperatures and ammonia mass concentration could be determined via corresponding thermodynamic parameter calculation software. The results are shown in Figure 5 that as the temperature of warm seawater and the mass concentration of ammonia working fluid increase, the bubble point pressure also goes the same. When the mass concentration of the working medium is 0.90 and the temperature of warm seawater is 21°C, the bubble point pressure of the solution is 747.59 kPa. Therefore, in order to set the same pressure condition in the comparison of cycles under different operating conditions, the working pressure is selected to be 700 kPa.

Figure 5. The relationship between bubble point pressure, warm seawater temperature, and working fluid concentration.
The parameters of each state point in the loop need to be determined based on the known parameters of the calculation process. The features of ammonia water working medium in the cycle were firstly obtained by referencing REFPROP 9.0 and finally determined by writing a calculation program on MATLAB. In the calculation, to make the comparisons of different cycles valid, basic parameters need to be set. In the research mentioned above, it can be concluded that the lower the temperature of the cold seawater, the higher the temperature of warm seawater, and the higher the mass fraction of working fluid, the greater the net output power of the cycle will be. Therefore, the corresponding basic parameters selected are shown in Table 2.
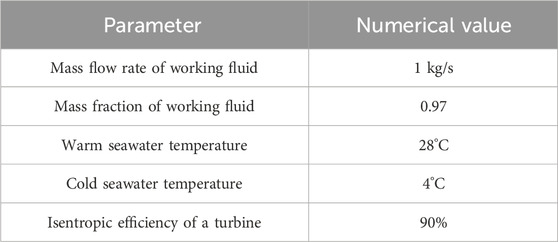
Table 2. Basic parameter settings for loops.
This section discusses the effects of seawater temperature changes on the net output power and thermal efficiency in three different cycles, with an ammonia concentration of 0.9 in the aqueous solution, as shown in Figure 6.

Figure 6. (A) Pressure exchanger cycle. (B) Hydraulic turbine cycle. (C) Ejector cycle. The effect of temperature changes on the net output power and thermal efficiency of different cycles.
In the three cycles, the net output power increases along with the seawater temperature, and the operation of the water turbine is the main factor influencing the net output power, which is related to the state and mass flow rate of gaseous ammonia at the inlet and liquid ammonia at the outlet. The rising of warm seawater temperature increases the enthalpy value of gaseous ammonia at the steam turbine inlet and, in the meantime, uplifts gaseous ammonia quality subjected to the separator and the net output power. Among the three cycles, in warm seawater at 21°C, the ejector cycle has the highest output power, while at other temperatures, their output power is roughly the same.
In the three cycles, the thermal efficiency of the pressure exchanger cycle and the hydraulic turbine cycle correspondingly increases with the temperature of the seawater; the lower the temperature of cold seawater, the higher the thermal efficiency. At a certain concentration of ammonia and the same temperature as cold seawater, the thermal efficiency correspondingly increases with the temperature of warm seawater. The reason is that when the temperature of the warm seawater increases, the usable temperature difference within the cycle also goes the same, leading to a higher amount of heat being absorbed by the evaporator. With a higher amount of ammonia vapor being separated by the separator, the enthalpy value of the ammonia vapor at the turbine inlet also rises, bringing a higher amount of work being produced by the turbine, ultimately resulting in an increase in thermal efficiency. Taking the pressure exchanger cycle as an example, when the mass concentration of ammonia is 0.9, the temperature of cold seawater is 4°C, and the temperature of warm seawater changes from 21°C to 24°C, the thermal efficiency increases from 2.99% to 3.22%, which increases rapidly. After that, the thermal efficiency increases slowly. In the cycle, the lower the temperature of cold seawater, the higher the corresponding thermal efficiency. Taking the temperature of warm seawater at 28°C as an example, when the temperature of cold seawater increases from 4°C to 7°C, the thermal efficiency decreases from 3.28% to 2.42%, a decrease of 26%. The thermal efficiency of the ejector cycle decreases with the increase of the temperature of the seawater, mainly because the increase in heat absorption power in the cycle is greater than the increase in the net output power of the cycle, resulting in a decrease in thermal efficiency while the net output of the cycle increases. Taking the temperature of cold seawater at 6°C as an example, when the temperature of warm seawater increases from 21°C to 28°C, the heat absorption power increases from 481.42 kW to 845.81 kW, an increase of 76%; The net output power increased from 14.16 kW to 24.05 kW, an increase of 70%, which is less than the increase in heat absorption, resulting in a decrease in cycle thermal efficiency.
In different situations, the lower the temperature of cold seawater, the higher the thermal efficiency. Therefore, in the subsequent analysis process, the temperature of the cold seawater was determined to be 4°C. Figure 7 shows the effect of working fluid concentration changes on the net output power and thermal efficiency when the cold seawater temperature is 4°C in the three cycles.

Figure 7. (A) Pressure exchanger cycle. (B) Hydraulic turbine cycle. (C) Ejector cycle. The effect of working fluid concentration changes on the net output power and thermal efficiency of different cycles.
Under the conditions of different seawater temperatures, the higher the ammonia mass concentration, the higher the net power output of the cycle. The main reason is that the ammonia becomes denser leading to an increase in the quantity and power of the ammonia gas in the cycle. In the comparison of the three cycles, the net power output of the pressure exchanger cycle is relatively low, and the output power of the hydraulic turbine cycle is lower when the working fluid concentration is low. As the working fluid becomes more concentrated, the output power increases, as well. When the concentration of the working medium is relatively low, the ejector cycle has the highest output power in the three cycles, but as the working medium becomes denser, the increasing rate in net output power slows down.
At different temperatures of warm seawater and a circulating pressure of 700 kPa, an optimal ammonia mass concentration corresponding to the maximum thermal efficiency of the cycle exists. The higher the temperature of warm seawater, the smaller the value of the optimal ammonia mass concentration, and the higher the thermal efficiency. When the temperature of cold seawater is 4°C and the temperature of warm seawater is 28°C, the thermal efficiency of the pressure exchanger cycle at 0.777 ammonia mass concentration is 4.28%. When the temperature of warm seawater is 21°C, the optimal ammonia mass concentration corresponding to the cycle is 0.908, and the thermal efficiency is 3.00%. In a hydraulic turbine cycle, when the temperature of the circulating seawater is 28°C, the optimal mass concentration of the working fluid is 0.775, corresponding to a maximum thermal efficiency of 4.37%; When the temperature of the seawater is 21°C, the optimal mass concentration of the working fluid is 0.904, corresponding to a maximum thermal efficiency of 3.03%. In the ejector cycle, the maximum thermal efficiency is 5.71% when the temperature of the seawater is 28°C, and the working fluid concentration is 0.761. The pressure drop of the ejector is 80 kPa. Due to the temperature difference conditions of the regenerator, the ammonia mass concentration cannot be further reduced when the temperature of the seawater is low. Therefore, within this range, the thermal efficiency decreases with the increase of ammonia mass concentration. Therefore, among the three cycles, the ejector cycle has the highest thermal efficiency.
Figure 8 shows the relationship between the circulating pressure changes and the output power of turbines in different cycles, where it can be seen that turbine output power in the three cycles shows a trend of initially increasing and subsequently decreasing, corresponding to the increase of pressure, and a maximum power value exists. However, the turbine output power of the ejector cycle is consistently higher than the other two cycles. The calculation process assumes that the mass flow rate of the solution is 1 kg/s. The flow rate of the lean ammonia solution through the hydraulic turbine device is relatively small, therefore it does less work, making its turbine output power slightly greater than that of the pressure exchanger cycle. In the ejector cycle, a significant pressure drop and turbine pressure difference increase were caused by the ejector, resulting in a turbine output power greater than that of the pressure exchanger cycle and the hydraulic turbine cycle.
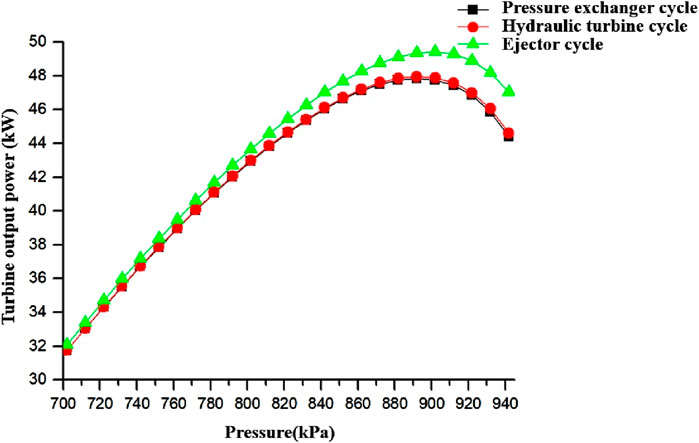
Figure 8. The effect of circulating pressure changes on the output power of different cycles.
The effect of circulating pressure changes on thermal efficiency is shown in Figure 9. For three different cycles, in each cycle, under the same pressure, the same amount of heat is absorbed. When the circulating pressure changes, the turbine output power of the pressure exchanger cycle and the hydraulic turbine cycle are similar, so their thermal efficiency curve changes show a similar trend of initially increasing and subsequently decreasing correspond to the increase of circulating pressure, and the thermal efficiency of the hydraulic turbine cycle is slightly higher than that of the pressure exchanger cycle. In the ejector cycle, the turbine output power is significantly higher than the other two cycles, so its thermal efficiency is always higher than that of the pressure exchanger cycle and the hydraulic turbine cycle.
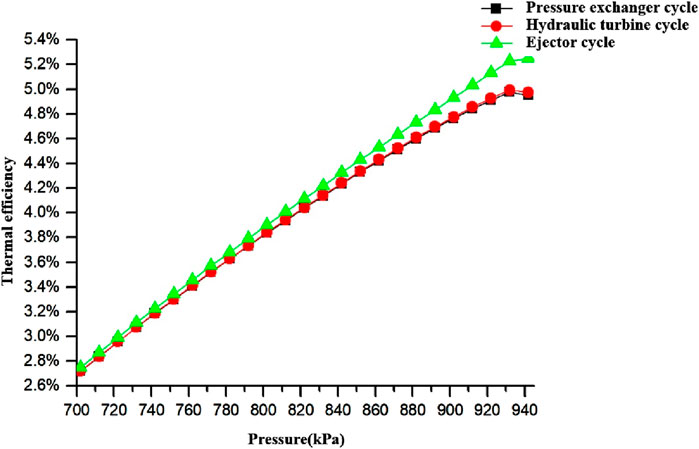
Figure 9. The effect of circulating pressure on the thermal efficiency of different cycles.
For ocean thermoelectric power generation devices, the seawater flow rate is much greater than the mass flow rate of the working fluid, and the transportation of seawater consumes a lot of energy. Hence, to thoroughly assess the system efficiency of the cycle, it is necessary to consider the pump power of both the cold and warm seawater.
Based on the previous analysis, the efficiency of the seawater pump is selected to be 80%. Given the frictional resistance during the transportation process of the cold seawater pump and the pressure loss of the warm and cold seawater pumps, the work done by the seawater pump can be determined from the calculation formula of pump work. The system efficiency comparison of each cycle is shown in Figure 10.
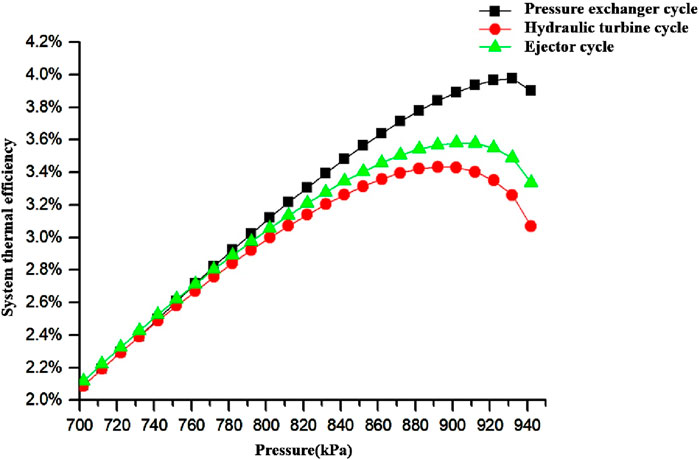
Figure 10. The effect of circulating pressure changes on the system efficiency of different cycles.
From Figure 10, the system efficiency of the ejector cycle is not the highest. Under the same pressure, the system efficiency of the pressure exchanger cycle is greater than that of the other two cycles. In the three cycles, the heat absorption power increases correspondingly with the circulating pressure, the required warm seawater flow rate increases, and the consumed power of the seawater pump also increases. In Figure 10, the turbine output power of each cycle exhibits a pattern of increase followed by a decrease in each cycle. Consequently, the system efficiency experiences an initial increment and subsequently a decrement. At the same time, the system efficiency takes into account the consumption of seawater pumps, so it changes more significantly than the thermal efficiency. The system efficiency of the pressure exchanger cycle is always higher than the other two cycles, with the main difference being the different flow rates of cold seawater required for the cycle. At the same time, the pressure exchanger reduces the power consumption of the warm seawater pump, increasing system efficiency. When the circulating pressure is low, the pressure difference before and after being subjected to the pressure exchanger can be utilized is not significant, so the system efficiency is not significantly different from the other two cycles. Under the conditions of the same seawater temperature and working fluid concentration, the maximum system efficiency of the pressure exchanger cycle, hydraulic turbine cycle, and ejector cycle are 3.97%, 3.43%, and 3.58% respectively.
To verify the high efficiency of the proposed cycle system, three new cycles were compared with the Rankine cycle, as shown in Table 3. It can be seen that the thermal efficiency of the three pressure energy utilization cycle systems is higher than that of Rankine cycle when the temperature of warm seawater is 28°C, the temperature of cold seawater is 4°C, and the cycle pressure is 700 kPa under the same working conditions. Through the use of pressure energy, the efficiency of the three cycles is improved compared with Rankine cycle, and the ejector cycle has the highest efficiency, which can reach 5.71%.

Table 3. Cycle comparison.
This article proposes three different ways to recover and utilize the pressure energy of lean ammonia solution in the closed cycle of ocean thermal energy conversion. A thermodynamic cycle model is established by analyzing the cycle process, and the variation laws of various cycle parameters under different operating conditions are analyzed. Therefore, based on the efficiency changes throughout the entire cycle system, the following conclusions have been drawn:
(1) For the pressure exchanger cycle system, under the given ammonia mass concentration, cold seawater temperature, and circulating pressure, when the temperature of warm seawater changes from 21°C to 28°C, the net output power of the cycle increases from 27.22 kW to 31.35 kW, and the thermal efficiency increases from 2.65% to 2.71%, the net output work and thermal efficiency are consistent, and all increase with the increase of warm seawater temperature.
(2) The hydraulic turbine cycle system resembles the pressure exchanger cycle system, and the influence of parameter changes on the cycles is similar. From the previous analysis, it can be concluded that when the ammonia mass concentration is constant, the temperature of warm seawater changes from 21°C to 28°C, the net output power of the cycle increases from 14.89 kW to 28.15 kW, and the thermal efficiency changes from 3.03% to 3.29%, both increase correspondingly with the temperature of the warm seawater. When the temperature of the warm seawater is constant, the cycle net output power shows a trend of initially increasing and subsequently decreasing, corresponding to the increase of ammonia mass concentration, and the thermal efficiency decreases with the rise of ammonia mass concentration. Under different conditions, an optimal pressure value exists that can maxmize the net output power and thermal efficiency respectively.
(3) For the ejector cycle, given the mass concentration of the working fluid, the temperature of the seawater increases from 21°C to 28°C, the net output power of the cycle increases from 14.16 kW to 24.05 kW, it increases correspondingly with the temperature of the seawater, while the thermal efficiency decreases accordingly. At different warm seawater temperatures, its thermal efficiency corresponds to a suitable mass concentration to obtain the maximum value, and the net output power of the cycle increases correspondingly with the mass concentration.
(4) Through performance analysis and comparison of the cycle, it can be concluded that all three methods can achieve the utilization of pressure energy, and under the same conditions, In the three cycles, the turbine output power and thermal efficiency of the ejector cycle are greater than those of the other two cycles, the highest thermal efficiency of the ejector cycle is 5.71%.
Due to time and other constraints, the experiment could not be carried out as scheduled, and many future works need to be further carried out: Conduct experimental research, measure the values of each key point, obtain the experimental data of the system cycle, and obtain the impact of changes in operating parameters on the experimental system. Compare the experimental data with theoretical calculations, compare the differences between the process under actual operating conditions and the cyclic model, and use them to modify and improve the mathematical model in theoretical analysis. Improve and record the test process in detail, formulate a set of corresponding test specifications and operation process, and provide the basis and reference for other subsequent tests. At the same time, the cost of equipment is also an important consideration in the process of building the test bed. The cost and construction cost of seawater pipeline are related to the depth of water intake, and are the key components of the construction of marine thermal energy. The impact of the depth of deep sea water intake will be fully considered in the later study to reduce the construction and later maintenance costs of seawater pipelines and further reduce the initial investment costs.
The datasets presented in this article are not readily available because the data also forms part of an ongoing study. Requests to access the datasets should be directed to bWlnbnFpYW50QDE2My5jb20=.
MT: Writing–original draft, Writing–review and editing. YY: Writing–original draft, Writing–review and editing. YH: Writing–original draft, Writing–review and editing. YC: Writing–review and editing. LZ: Project administration, Writing–review and editing. YL: Conceptualization, Methodology, Writing–original draft, Writing–review and editing.
The author(s) declare that financial support was received for the research, authorship, and/or publication of this article. This research was supported by the Fund of the Southern Marine Science and Engineering Guangdong Laboratory (Zhanjiang) Project (ZJW-2019-05).
The authors declare that the research was conducted in the absence of any commercial or financial relationships that could be construed as a potential conflict of interest.
All claims expressed in this article are solely those of the authors and do not necessarily represent those of their affiliated organizations, or those of the publisher, the editors and the reviewers. Any product that may be evaluated in this article, or claim that may be made by its manufacturer, is not guaranteed or endorsed by the publisher.
OTEC, Ocean thermal energy conversion; ORC, Organic rankine cycle; CFD, Computational fluid dynamics; s, Entropy; h, Enthalpy; m, Mss flowl; Q, Heat absorption; W, Power;
Bin, X. (2020). Performance study of karina cycle and upper primary cycle marine thermoelectric power generation systems. Beijing: China University of Petroleum.
Chang, Y. (2006). Experimental study on external driven rotary pressure exchanger of reverse osmosis seawater desalination system. Dalian University of technology.
Chang, Y., Ju, M., and Hui, M. (2006). Research progress on energy recovery technology and devices in reverse osmosis seawater desalination systems. Energy Eng. (3), 48–52. doi:10.3969/j.issn.1004-3950.2006.03.013
Chen, F., and LiuLei, P. J. (2021). Theoretical analysis and test on the performance of Rankine cycle marine thermoelectric power generation system. Sci. Technol. Her. 39 (6), 90–95. doi:10.3981/j.issn.1000-7857.2021.06.013
Chen, F., Liu, L., Peng, J., Ge, Y., Wu, H., and Liu, W. (2019). Theoretical and experimental research on the thermal performance of ocean thermal energy conversion system using the rankine cycle mode. Energy 183, 497–503. doi:10.1016/j.energy.2019.04.008
Chen, F., Liu, L., Zeng, H., Peng, J., Ge, Y., and Liu, W. (2024). Theoretical and experimental study on the secondary heat recovery cycle of the mixed working fluid in ocean thermal energy conversion. Renew. Energy 227, 120142. doi:10.1016/j.renene.2024.120142
Dashu, L. (2019). High efficiency heat exchange technology for the development and utilization of ocean temperature difference energy. Ind. Heat. 48 (03), 1–3. doi:10.3969/j.issn.1002-1639.2019.03.001
Deng, L., Huang, H., and He, Z. (2014). Research progress on organic Rankine cycle. New Energy Prog. 2 (03), 180–189. doi:10.3969/j.issn.2095-560X.2014.03.003
Esteban, M., and Leary, D. (2012). Current developments and future prospects of offshore wind and ocean energy. Appl. Energy 90 (1), 128–136. doi:10.1016/j.apenergy.2011.06.011
Faizal, M., and Ahmed, M. R. (2011). On the ocean heat budget and ocean thermal energy conversion. Int. J. Energy Res. 35 (13), 1119–1144. doi:10.1002/er.1885
Fan, C., Zhang, C., and Chen, Y. (2024). Dynamic operation characteristics of ocean thermal energy conversion using Kalina cycle. Renew. Energy 231, 120909. doi:10.1016/j.renene.2024.120909
Fang, Y., and Ma, G. (2018). Research on pressure energy conversion efficiency and internal flow characteristics of pressure exchanger based on CFD. water Resour. Dev. Manag. (01), 31–35. doi:10.16616/j.cnki.10-1326/tv.2018.01.10
Han, Y. (2012). Theoretical and experimental research on ammonia reheat injection absorption power cycle driven by seawater temperature difference. Ocean University of China.
Hu, Z., Fan, C., Gao, W., and Chen, Y. (2023). Experimental study of a miniature organic Rankine cycle unit using ocean thermal energy. Energy Convers. Manag. 293, 117494. doi:10.1016/j.enconman.2023.117494
Imran, M., Park, B. S., Kim, H. J., Lee, D. H., Usman, M., and Heo, M. (2014). Thermo-economic optimization of Regenerative Organic Rankine Cycle for waste heat recovery applications. Energy Convers. and Manag. 87, 107–118. doi:10.1016/j.enconman.2014.06.091
Kalina, A. I. (1984). Combined cycle system with novel bottoming cycle. Asme J Eng. Turbines and Power 106 (4), 737–742. doi:10.1115/1.3239632
Lee, H. S., Yoon, J. I., and Son, C. H. (2015). Efficiency enhancement of the ocean thermal energy conversion system with a vapor-vapor ejector. Adv. Mech. Engineering2015 7 (03), 1–10.
Lemmon, E. W., McLinden, M. O., and Huber, M. L. (2013). REFPROP: reference fluid thermodynamic and transport properties. Standard Database23: NIST.
Li, X., Zhao, C., and Hu, X. (2012). Thermodynamic analysis of organic Rankine cycle with ejector. Energy 42 (1), 342–349. doi:10.1016/j.energy.2012.03.047
Lim, S. T., Kim, H. J., and Lee, H. S. (2019). Dynamic simulation of performance change of MW-class OTEC according to seawater flow rate. J. Korean Soc. Power Syst. Eng. 23 (02), 48–56. doi:10.9726/kspse.2019.23.1.048
Liu, Q. (2005). Experimental study on the comprehensive utilization of fluid pressure energy technology. Dalian University of Technology.
Liu, W. (2014). Research and test of 15kw thermoelectric power generation device. Chin. Sci. Technol. Achiev. (10), 1. doi:10.3772/j.issn.1009-5659.2014.10.005
Liu, W., Chen, F., and Yunzheng, G. (2022). Review of efficiency research on ocean thermal energy systems. Coast. Eng. 41 (04), 441–450. doi:10.12362/j.issn.1002-3682.20220711001
Liu, W., Xu, X., Chen, F., Liu, Y., Li, S., Liu, L., et al. (2020). A review of research on the closed thermodynamic cycles of ocean thermal energy conversion. Renew. Sustain. Energy Rev. 119, 109581. doi:10.1016/j.rser.2019.109581
Liu, W. M., Chen, F. Y., Wang, Y. Q., Jiang, W. J., and Zhang, J. G. (2012). Progress of closed-cycle OTEC and study of a new cycle of OTEC. Adv. Mater. Res. 354–355, 275–278. doi:10.4028/www.scientific.net/amr.354-355.275
Miaosenchun, liguozhu (2024). Study on transient flow characteristics of axial flow pump as hydraulic turbine during runaway. Therm. power Eng. 39 (08), 22–29. doi:10.16146/j.cnki.rndlgc.2024.08.003
Miljkovic, M. (2017). Injection power cycle applied in OTEC power plants. Energy Procedia 143 (12), 823–828. doi:10.1016/j.egypro.2017.12.769
Mujie, H., Haiyan, B. I. E., and Lin, Z. (2021). Study on fluid energy loss of rotary pressure exchanger. J. Ocean Univ. China NATURAL Sci. Ed. 51 (03), 78–83. doi:10.16441/j.cnki.hdxb.20200087
Peng, J., Wu, H., Ge, Y., Chen, F., Liu, L., and Liu, W. (2018). The experimental study of rankine cycle in Ocean Thermal energy conversion. IOP Conf. Ser. Mater. Sci. Eng. 381 (1), 012126. doi:10.1088/1757-899X/381/1/012126
Uehara, H., Ikegami, Y., and Nishida, T. (1998). Performance analysis of OTEC system using a cycle with absorption and extraction processes. Nihon Kikai Gakkai Ronbunshu B Hen/transactions Jpn. Soc. Mech. Eng. Part B 64 (624), 2750–2755. doi:10.1299/kikaib.64.2750
Wang, Q. (2016). Performance study of biogas internal combustion engine and organic rankine combined cycle system. Lanzhou University of Technology.
Wang, X., and Liu, Q. (2022). Research progress of energy recovery hydraulic turbine Proceedings of 2022 Academic Forum on engineering technology application and construction management 2, 3. doi:10.26914/c.cnkihy.2022.052666
Wang, Y. (2011). Research on the original cycle system for ocean thermoelectric power generation [D]. Qingdao University of Technology.
Yang, J., Zhang, X., and Wang, X. (2011). Summary of research on energy recovery hydraulic turbines. Fluid Mach. 39 (6), 29–33.
Yang, X., Liu, Y., Chen, Y., and Zhang, L. (2022). Operation control and performance analysis of an Ocean Thermal energy conversion system based on the organic rankine cycle. Energies 15 (11), 3971. doi:10.3390/en15113971
Yangxiaowei (2023). Multi objective optimization of marine thermoelectric power generation system and Research on overall operating characteristics. Shandong University.
Yejiaqi (2016). Study on isentropic efficiency of working fluid pump in organic Rankine cycle system. Tianjin University.
Yuan, H., Mei, N., Li, Y., Yang, S., Hu, S., and Han, Y. (2013). Theoretical and experimental investigation on a liquid-gas ejector power cycle using ammonia-water. Sci. China Technol. Sci. 56 (9), 2289–2298. doi:10.1007/s11431-013-5292-4
Yuncang, Li, Liu, T., and Chen, X. (2000). Research on the optimal temperature difference of heat exchangers. New Energy 22 (4), 10–13.
Zhai, X. (2021). Research on Ocean thermoelectric power generation system and its heat exchanger and ejector. Shandong University.
Keywords: ocean thermal energy conversion, zeotropic working fluid, thermodynamic cycle, pressure energy, efficiency improvement
Citation: Tian M, Yu Y, Hou Y, Chen Y, Zhang L and Liu Y (2025) Optimization of ocean thermal energy conversion based on pressure energy recovery of ammonia water working medium. Front. Energy Res. 12:1472980. doi: 10.3389/fenrg.2024.1472980
Received: 30 July 2024; Accepted: 31 December 2024;
Published: 23 January 2025.
Edited by:
Lorenzo Ferrari, University of Pisa, ItalyReviewed by:
Davide Di Battista, University of L’Aquila, ItalyCopyright © 2025 Tian, Yu, Hou, Chen, Zhang and Liu. This is an open-access article distributed under the terms of the Creative Commons Attribution License (CC BY). The use, distribution or reproduction in other forums is permitted, provided the original author(s) and the copyright owner(s) are credited and that the original publication in this journal is cited, in accordance with accepted academic practice. No use, distribution or reproduction is permitted which does not comply with these terms.
*Correspondence: Yanjun Liu, bHlqMTExa3lAMTYzLmNvbQ==
Disclaimer: All claims expressed in this article are solely those of the authors and do not necessarily represent those of their affiliated organizations, or those of the publisher, the editors and the reviewers. Any product that may be evaluated in this article or claim that may be made by its manufacturer is not guaranteed or endorsed by the publisher.
Research integrity at Frontiers
Learn more about the work of our research integrity team to safeguard the quality of each article we publish.