- 1Economic and Technical Research Institute of State Grid Tibet Electric Power Co., Ltd., Tiebt, China
- 2State Grid Tibet Electric Power Co., Ltd., Tibet, China
- 3Nanjing NARI New Energy Technology Co., Ltd., Nanjing, China
Resilience assessment and enhancement in distribution networks primarily focus on the ability to support and recover critical loads after extreme events. With the increasing integration of new energy sources and power electronics, distribution networks have gained a degree of resilience. However, the impact of power quality issues on these networks has become more severe. In some cases, even networks assessed as highly resilient by users suffer equipment damage and substantial economic losses due to power quality issues. To address this issue, this paper builds upon conventional distribution network resilience assessment methods by supplementing and modifying indices in the dimensions of resistance and recovery to account for power quality issues. Furthermore, an optimized energy storage system (ESS) configuration model is proposed as a technical means to minimize the total operational cost of the distribution network while enhancing comprehensive resilience indices. The proposed nonlinear optimization model is solved using second-order cone relaxation techniques. Finally, the proposed strategy is simulated on the IEEE 33-node distribution network. The simulation results demonstrate that the proposed strategy effectively improves the comprehensive resilience indices of the distribution network and reduces the total operational cost.
1 Introduction
The distribution network resilience reflects the ability of the distribution system to re-sist, adapt to, and recover from various disturbances. Research on the resilience of distribution networks has garnered widespread attention against the backdrop of the low-carbon transition and the integration of renewable energy sources (Paul et al., 2024; Mishra et al., 2021; Sonal and Ghosh, 2021; Zhou et al., 2023). As the proportion of distributed photovoltaic (PV) generation systems in distribution networks continues to increase, the ability to support critical loads during extreme events has significantly improved. However, this increase has also introduced a series of power quality issues, deteriorating the steady-state power quality of the grid. Simultaneously, the proportion of power quality-sensitive loads in distribution networks has been increasing yearly. Various sensitive users are adversely affected by transient power quality disturbances, such as voltage sags (Chen et al., 2013), leading to issues such as process interruptions, substandard products, reduced production efficiency, and equipment damage, which result in significant economic losses. There is a substantial mismatch between the actual resilience perceived by sensitive users and the evaluation results from existing resilience assessment systems. Therefore, considering the impact of power quality in comprehensive distribution network resilience assessments is both objective and necessary. Currently, ESS are garnering extensive attention in research focused on enhancing the resilience of distribution networks according to their flexible regulation capabilities (Zhang et al., 2023; Nazemi et al., 2020; Mishra et al., 2022; Shi et al., 2022). Especially, Reference (Shi et al., 2022) proposes a mixed-integer program-based centralized and distributed BESS allocation, which considers the optimal locations and operation status of ESSs. Consequently, selecting effective and economical ESS optimization configurations to enhance the comprehensive resilience of distribution networks holds significant theoretical and practical importance.
Numerous studies have explored planning schemes to enhance the recovery resilience of distribution networks. Reference (Liu et al., 2022) proposed an ESS optimization configuration method based on prospect theory to improve the comprehensive utility of ESSs and grid resilience. Reference (Zhang et al., 2021) presented a two-stage strategy to enhance distribution network resilience by ensuring power supply through multisource coordination before and after disasters. References (Yuan et al., 2016) and (Tur, 2020) focused on optimizing ESS configurations with the objective functions of improving distribution network supply reliability and minimizing comprehensive operational costs to enhance both the resilience and economic efficiency of the distribution network.
In addition, the anti-interference ability of the user side of the distribution network for power quality events after large-scale distributed photovoltaic access has also received extensive attention. In Reference (Alshareef, 2023), the correction index of power supply reliability considering the sag equivalent time is given to measure the influence of the modern load on power quality. Reference (Li et al., 2023) investigated the impact of power quality in the joint optimization of wind and storage in distribution networks, revealing the relationship between the integration capacity of various renewable energy sources and power quality levels. References (Kadir et al., 2014) and (Zuo et al., 2015) selected the power quality indices most affected by distributed PV integration as evaluation factors and proposed correction schemes to improve power quality indices using data envelopment analysis and power quality health assessment methods, respectively. References (Lu et al., 2019) and (Venkatesan et al., 2024) addressed a series of power quality issues brought about by the integration of distributed renewable energy, enhancing the economic efficiency and power supply quality of the distribution network through optimized ESS configurations. These studies primarily focused on using ESSs to improve the distribution network’s support and recovery capabilities for critical loads or to enhance power quality indices. However, they did not fully reflect the improvement in comprehensive resilience indices of distribution networks when accounting for the impact of power quality. As a result, even with high conventional resilience evaluation results, power quality indices may still exceed certain limits, potentially harming user-side electrical equipment.
In summary, the existing resilience improvement studies for distribution networks are still mainly focused on conventional power quality indices; although an ESS can be used as an effective method to improve the power quality of distribution networks, if only a single power quality index is used as the objective function under multiple power quality indices, the planning results may cause other power quality problems in the operation of the system, and it is difficult to effectively improve the comprehensive toughness of the distribution network. To address the abovementioned deficiencies, this paper incorporates the impact of power quality issues into the dimensions of resistance and recovery. The main contributions are summarized as follows:
• Enhanced Power Quality Consideration: Incorporating power quality indicators into the conventional comprehensive resilience assessment index system more comprehensively reflects the comprehensive resilience level of the distribution network, and avoids the deterioration of power quality level in the distribution network when the resilience assessment level is high. Meanwhile, the multi-dimensional resilience index reduces the possibility of equipment damage and economic loss caused by power quality issues in distribution network under disturbance.
• Dual-Objective Optimization: The proposed model employs a dual-objective optimization strategy that simultaneously minimizes operational costs and maximizes resilience. Meanwhile, this paper applies a linear weighting method after fuzzifying the objective functions to integrate the two objectives, and transform the bi-objective optimization problem into a single-objective optimization problem. This approach addresses the high economic costs associated with ESS configurations, balancing resilience with operational efficiency.
• Adaptability to High PV Penetration: Under the condition of using the comprehensive resilience index of the distribution network as the judgment standard, the coupling mechanism between the distributed photovoltaic penetration rate and the energy storage configuration capacity of the distribution network is analyzed, and the matching between the optimal configuration capacity of the energy storage and the optimal installed capacity of the photovoltaic is realized.
2 Comprehensive resilience evaluation system for regional distribution networks
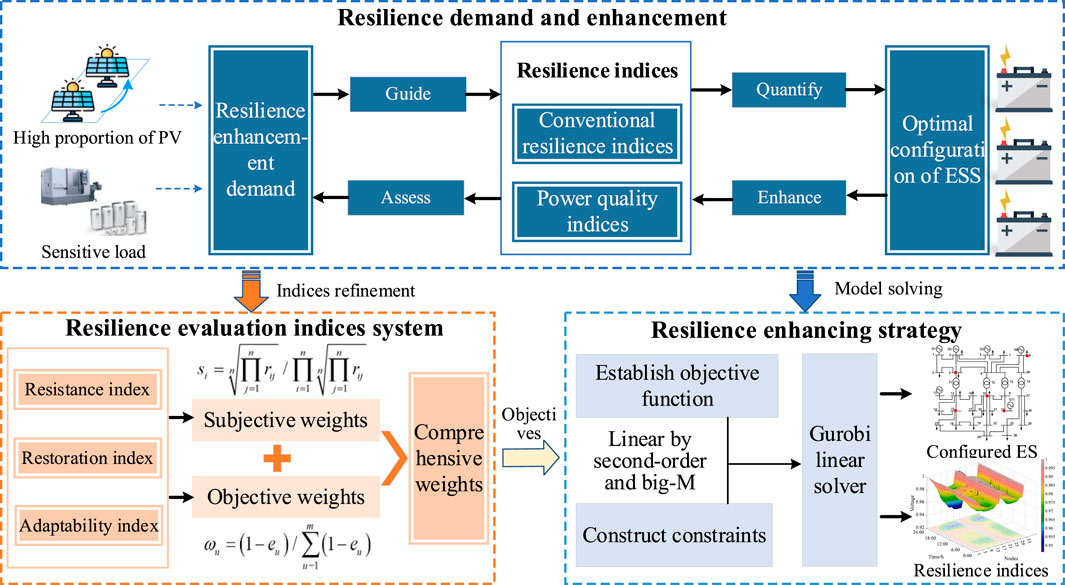
Considering the various disturbances that distribution networks need to withstand, this paper adopts three performance characteristics—resistance, recovery, and adaptability—as primary indices for comprehensive resilience (Paul et al., 2024). Since the focus of this study is on enhancing distribution network resilience through ESS configurations, directly relevant secondary indices are selected to multidimensionally characterize the comprehensive resilience of the distribution network, as shown in Figure 1.
The resilience demand and enhancement module primarily provide an overall description of the causes of resilience deficiencies in the distribution network, quantifies relevant indicators, and outlines improvement measures. This module also refines and integrates the proposed power quality indicators with traditional resilience indexes to establish a comprehensive resilience assessment index system. Furthermore, the comprehensive resilience index obtained is used as an objective function. By accounting for the boundary of multi-resource adjustment capabilities, a strategy and solution method for enhancing distribution network resilience are proposed. This approach yields the optimized configuration of energy storage and evaluates the resilience improvement of the distribution network.
2.1 Resistance index (F1)
Resistance typically refers to the ability of a distribution network to withstand disturbances that may cause safety and stability issues in electrical equipment and systems. However, with the high penetration of distributed PV systems, the intermittent and variable nature of PV generation can lead to significant fluctuations in voltage levels and power quality, rapid changes in solar irradiance result in unpredictable voltage deviations and fluctuations, making it damaging electrical equipment and threatening the safe operation of the system. Additionally, PV systems use power electronic converters that can introduce harmonic distortions into the network. This is particularly problematic when a high proportion of PV systems are connected to the grid, as cumulative harmonic effects can degrade power quality and affect sensitive equipment. Therefore, this paper builds upon the traditional definition by further considering the grid’s tolerance to total current harmonic distortion, voltage deviation, and voltage fluctuation. Consequently, a resistance index (F1) that accounts for power quality is constructed.
2.1.1 Bus voltage margin (F11)
The bus voltage margin refers to the buffer between the actual operating voltage of the bus and its upper voltage limit. This metric is used to assess the bus’s ability to remain within limits during grid disturbances and can be expressed as Equation 1.
where U is the operating voltage of the evaluated bus and Umax and Umin are the maximum and minimum voltage limits, respectively.
2.1.2 Comprehensive voltage qualification rate (F12)
The comprehensive voltage qualification rate refers to the proportion of time within an operational period during which the user side voltage remains within the acceptable range. This metric is used to measure the availability of power quality as experienced by the users and can be expressed as Equation 2.
where M is the number of users; tst,i is the number of hours that the voltage for user i remains within the acceptable range during an operational period; and T is the total assessment period.
2.1.3 Harmonic current margin (F13)
The total harmonic distortion (THD) of the current refers to the ratio of the root mean square (RMS) value of the harmonic content to the RMS value of the fundamental component in the current flowing through electrical loads. When the total harmonic current distortion in the distribution network exceeds acceptable limits, it can cause excessive heating in transformers and motors, leading to damage to electrical equipment (Zuo et al., 2015). Therefore, this paper considers the harmonic current margin of the distribution network following the integration of distributed PV and ESS, which can be expressed as follows:
where Ih is the hth harmonic current; I1 is the fundamental current; IPV is the fundamental current injected by the PV generation system; IESS is the fundamental current injected by the ESS; and 5% and 3% represent the limit and warning values, respectively (IEEE Recommended Practices and Requirements, 1992).
2.1.4 Voltage deviation margin (F14)
Voltage deviation refers to the relative difference between the actual operating voltage at a node and the system’s nominal voltage. When the voltage deviation exceeds acceptable limits, it can reduce the performance or even cause damage to electrical equipment, such as motors (Zuo et al., 2015). Therefore, this paper considers the voltage deviation margin of the distribution network, which can be expressed as follows:
where Ui is the actual operating voltage at node i; UN is the nominal system voltage; and 7% and 4.2% represent the limit and warning values, respectively (General Administration of Quality Supervision, 2008b).
2.1.5 Voltage fluctuation margin (F15)
Voltage fluctuation refers to the ratio of the difference between the maximum and minimum voltages at a node during an operational period to the system’s nominal volt-age. When the voltage fluctuation exceeds acceptable limits, it can cause malfunction or even damage to electronic instruments and equipment (Zuo et al., 2015). Therefore, this paper considers the voltage fluctuation margin of the distribution network, which is expressed as follows:
where ΔUi is the difference between the maximum and minimum voltages at node i during the operational period; 3% and 1.8% represent the limit and warning values, respectively (General Administration of Quality Supervision, 2008a).
2.2 Resilience index (F2)
Generally, resilience refers to the ability of a distribution network to quickly restore system performance after disruptions. Sudden changes in load demand, especially in networks with high PV penetration, can lead to voltage sags and swells. These fluctuations impact the reliability of power supplied to users and increase the likelihood of equipment malfunction or damage. Consequently, directly related indices are selected, and adjustments are made to account for the impact of voltage sags and short-term interruptions (referred to as voltage sags) in the assessment of system supply reliability.
2.2.1 Power supply reliability (F21)
Power supply reliability refers to the ability of a power system to provide a continuous electricity supply. The increasing prevalence of sensitive equipment has heightened the impact of voltage sags, which can disrupt the normal operation of user equipment and even cause damage, leading to significant losses and hazards for users. Therefore, this study modifies the power supply reliability to account for the impact of voltage sag events, which is expressed as follows:
where ttd represents the average number of outage hours for users in the region and ttd-sag is the equivalent average number of outage hours due to voltage sag events for users in the region.
2.2.2 Load loss rate (F22)
The load loss rate refers to the proportion of the interrupted load to the total load during extreme events. This metric is used to assess the ability of the distribution network to maintain a power supply to critical loads during such events and is expressed as Equation 7.
where Pzd represents all the interrupted loads in the system and Pload represents all the loads in the system.
2.3 Adaptability index (F3)
Generally, adaptability refers to a distribution network’s flexible resources and transmission capacity margins, which enable it to accommodate fluctuations in system operating conditions caused by disturbances.
2.3.1 Line average load rate (F31)
The line average load rate refers to the average ratio of the maximum load to the capacity of each line in the distribution network. This metric is used to assess the ability of the distribution network to handle future load uncertainties and fluctuations and can be expressed as Equation 8:
where Rtotal is the sum of the load rates of all lines in the network; Nb is the number of lines in the system.
2.3.2 Distributed generation penetration rate (F32)
The distributed generation penetration rate refers to the proportion of the total capacity of flexible resources connected to the system. This metric is used to assess the ability of the distribution network to regulate various flexible resources in response to disturbances and can be expressed as Equation 9.
where PW and PPV are the total capacities of the wind and photovoltaic systems connected to the grid, respectively, and PG is the total capacity of the thermal power generation units.
2.3.3 Load peak-to-valley difference rate (F33)
The load peak-to-valley difference rate refers to the ratio of the difference between the maximum and minimum loads to the maximum load within a specific time period in the power system. This metric is used to assess the power regulation capacity required by the distribution network to accommodate daily load variations, which can be expressed as Equation 10.
where PH is the peak load; PL is the valley load in the region on a typical day.
It should be noted that the design of the resilience assessment framework in this study, particularly in selecting indicators for resistance and recovery, fully considers the typical disturbances associated with high distributed PV penetration, such as voltage deviations and harmonic currents. These factors are especially prominent given the fluctuations in PV output, which significantly impact the power quality and stability of distribution networks. Consequently, the adjustments and enhancements made to resilience indicators in this context allow the model to more accurately reflect the resilience characteristics of systems under high PV penetration conditions.
2.4 Comprehensive resilience index (Fre)
2.4.1 Subjective weights analysis based on improved analytic hierarchy process
Considering the varying operating environments and service users of different types of distributed power sources, it is crucial to consider the perspectives of users from different regions when conducting comprehensive resilience assessments. Therefore, this article adopts the improved AHP. The specific implementation steps are as follows.
Step 1: Determine the hierarchical structure of the comprehensive resilience indicators based on suggestions from all stakeholders, and rank them according to their importance.
Step 2: Compare the importance of each indicator sequentially and determine the corresponding scale.
Step 3: Calculate the values of other elements based on the transitivity of the importance of each indicator and establish the following judgment matrix as Equation 11.
where A is the judgement matrix of indicator’s importance; n represents the number of indicators to be evaluated; rij is the indicator scale.
Step 4: Calculate the weight values of each indicator from matrix A as Equation 12:
where si represents the subjective weight value corresponding to the comprehensive toughness indicators.
2.4.2 Objective weight analysis determination based on entropy weight method
The specific steps of entropy weight method are as follows.
Step 1: Indices dimensionless. Since the indicators of resistance, resilience, and adaptability in this article are all positive indicators (i.e., the larger the indicator value, the better), the calculated formula is as Equation 13.
where zij is the jth evaluation indicator in the ith evaluation scenario after non-dimension; xij is the original evaluation indicators; xj,min and xj,max are the minimum and maximum values of original evaluation indicators.
Step 2: The entropy of the uth index in the vth evaluation scenario is defined as Equation 14.
where eu is the entropy of proposed indicator.
Step 3: Calculate the objective weight values of each indicator as Equation 15:
where ωm is the objective weight of proposed indicators.
2.4.3 The optimal weight of comprehensive subjective and objective weighting
Based on the abovementioned index system, the comprehensive resilience index measurement vector F is obtained, the comprehensive assessment result Fre is expressed as Equations 16, 17:
where n represents the number of indices to be evaluated.
3 ESS optimization configuration model for enhancing distribution network resilience
This article constructs a multi-objective optimization model for ESS optimal capacity allocation with the lowest total cost of the distribution network and the highest comprehensive resilience index considering power quality. The model is expressed as Equation 18:
where x is the optimization variable; U is the control variable; Ctotal(x, u) and Fre (x, u) represent the total cost and the comprehensive resilience of the distribution network, respectively; H(x, u) and G(x, u) are the equality and inequality constraints of the model, respectively.
Due to the differing dimensions of the optimal distribution network resilience objective and the total operating cost objective, a simple addition of the two is not feasible. Thus, this paper applies a linear weighting method after fuzzifying the objective functions to integrate the two objectives and transform the bi-objective optimization problem into a single-objective optimization problem. The specific steps are as follows.
Step 1: Perform optimization with the objective function of minimizing the total operating cost of the distribution network, yielding the minimum operating cost f1m, which serves as the lower bound for operating costs. Substitute f1m into the objective function f2 to obtain the resilience index of the distribution network f2m under these conditions, setting the lower bound for resilience.
Step 2: Perform optimization with the objective of maximizing distribution network resilience, obtaining the optimal resilience f2M, which serves as the lower bound for resilience. Substitute f2M into the objective function f1 to determine the corresponding total operating cost f2M, setting the upper bound for operating costs.
Step 3: Apply fuzzification to the objective functions, using the membership function defined as Equations 19, 20:
where μ(f1) and μ(f2) represent the membership functions of the economic objective and the operational resilience objective, respectively.
Further employing a linear weighting method to combine the two objective functions enables the transformation of the bi-objective optimization problem into a single-objective optimization problem for solution. The bi-objective optimization model is transformed as Equation 21:
where α and β represent the weight coefficients corresponding to the membership functions of each objective, with α + β = 1.
In addition, the block diagram of the ESS optimized configuration model proposed in this paper is shown in Figure 2. Based on the proposed comprehensive resilience index of distribution network, under multi-dimensional constraints, the optimal operation cost of distribution network and the optimal comprehensive resilience of the system are taken as the objective function, and the mixed integer optimization is used to solve the problem. The optimal configuration scheme and optimal operation strategy of ESS are obtained, which can enhance the resilience of distribution network and help the stable operation of the system.
3.1 Objectives
3.1.1 Lowest total cost
The total cost of the model mainly includes the investment conversion cost Cinvest, operation and maintenance cost Cmaint, and network loss cost Closs of the distribution network ES device within one operating cycle. This paper further considers the economic loss cost Csag caused by user voltage sag events. The objective function is as follows:
where Ωess is the set of all nodes configured with ESS; Ress is the discount rate of ESS; Yes is the service life of ESS; Cinvest is the investment cost per unit capacity; Eess,i is the ESS capacity configured for node i; Cmaint is the annual operating and maintenance cost per unit capacity; Ωb is the set of all branches in the distribution network; Closs is the unit network loss cost; Iij,t is the current of branch ij at time t; Rij is the resistance of branch ij; CSAG is the average economic loss value of a single voltage sag for the user, and K is the number of voltage sag events that occur within one operating cycle.
3.1.2 Strongest comprehensive resilience
Based on the conventional grid elasticity index evaluation system, this paper further considers the impact of distributed PV access on power quality indicators, and proposes a comprehensive resilience index that takes into account both traditional elasticity indicators and power quality. The objective function is to achieve the strongest comprehensive resilience of the distribution network within one operating cycle:
3.2 Constraints
3.2.1 Power balance constraint
The distribution system satisfies power balance as Equation 24
where PG,t, PWT,t, PPV,t, PES,t are the outputs of thermal power units, wind turbines, PV, and ESS in the distribution network at time t, respectively.
3.2.2 ESS operating constraint
The ESS operating satisfies Equations 25, 26:
where μi is a 0-1 variable, in which μi = 1 indicates that ESS is configured at node i, and μi = 0 indicates that ESS is not configured at node i; Pch i,max, Pdis i,max are the maximum values of ESS charging and discharging power at node i, respectively; Pi,t is the exchange power between ESS and distribution network at node i at time t; ei,t, ei,t+Δt are the capacities of ESS at node i at time t, t+Δt, respectively; SOCi,t, SOCi,0, SOCi,T are the state of charge of the ESS at node i at time t, 0, and T, respectively; SOCi,min, SOCi,max are the upper and lower limits of the state of charge of the ESS at node i, respectively; Eess,i is the capacity of ESS at node i.
3.2.3 Branch flow constraints
Node power constraints as Equations 27, 28:
Ohm’s law constraint (Equation 29):
Node voltage constraint as Equation 30:
where Vi,min and Vi,max are the minimum and maximum voltage amplitudes operating at node i.
Branch current constraint as Equation 31:
where Iij,t is the current flowing through branch ij; Iij,max is the maximum current allowed by branch ij.
3.2.4 Resilience indicator constraints
To ensure the safe operation of the distribution network, the comprehensive resilience index should meet the constraint conditions of not exceeding the limit as Equation 32:
where
3.3 Model linearization based on convex relaxation technique
The above ES optimization configuration model is a non-convex nonlinear programming problem that is difficult to solve. Therefore, this paper uses second-order cone relaxation technology to transform the model in advance, making it easy to solve using mature commercial optimization software Gurobi (Zhang et al., 2024).
3.3.1 Linearization of power flow constraints
Perform second-order cone relaxation transformation on the ES optimization configuration model with Xij = I2ij and Yj = V2j as Equations 33–36:
3.3.2 Linearization of objective function
The cost of network loss can be linearized as Equation 37:
3.3.3 Linearization of ES operation constraints
Nonlinear constraints containing 0-1 variables can be transformed using the Big-M method as Equation 38:
where M1 and M2 are relatively large constants; A1 and A2 are auxiliary variables.
4 Case study
4.1 Scene setting
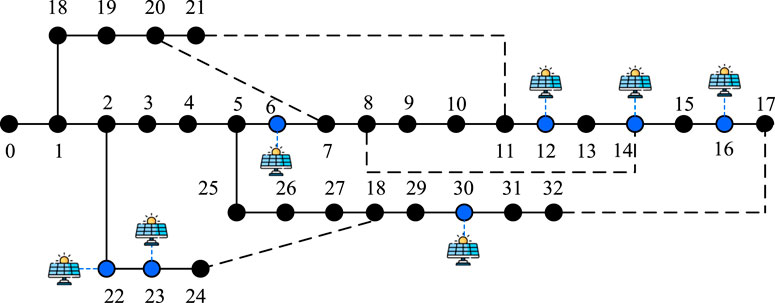
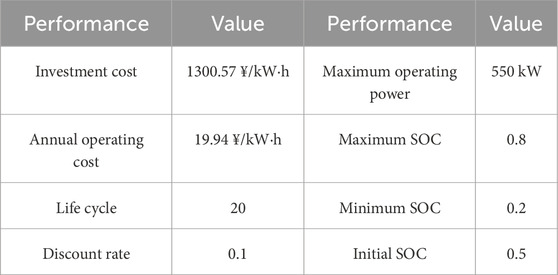
In this study, the IEEE 33-node distribution system with integrated distributed PVs is used for case analysis (Jiang et al., 2021), as shown in Figure 3. The system consists of 33 nodes, with distributed PV installation points at nodes 6, 12, 14, 16, 22, 23, and 30. The PV installation capacities are 150 kW, 350 kW, 300 kW, 100 kW, 200 kW, 300 kW, 100 kW, and 350 kW. The basic parameters of the ESS devices are shown in Table 1.
Due to the high cost of ESSs, the overall resilience and economy of the distribution network cannot be optimized simultaneously, and considering the power quality issues caused by the randomness and volatility of distributed photovoltaic output will affect the results of the ESS optimization configuration. Therefore, this article conducts simulation verification on the three cases that exist in actual situations.
Case 1. For the high-resilience distribution network in the demonstration area with distributed PV access, the optimization objective is to maximize the comprehensive resilience index, as defined in Equation 23.
Case 2. Considering the relatively high investment cost of ESSs, the optimization objectives in practical engineering applications are to minimize the total cost, as defined in Equation 22, and to maximize the comprehensive resilience index, as defined in Equation 23.
Case 3. Based on Scenario 2, consider the impact of power quality indices, specifically Equations 3–5 and the modified Equation 6, on the optimal configuration of the ESS.
4.2 Analysis of simulation results
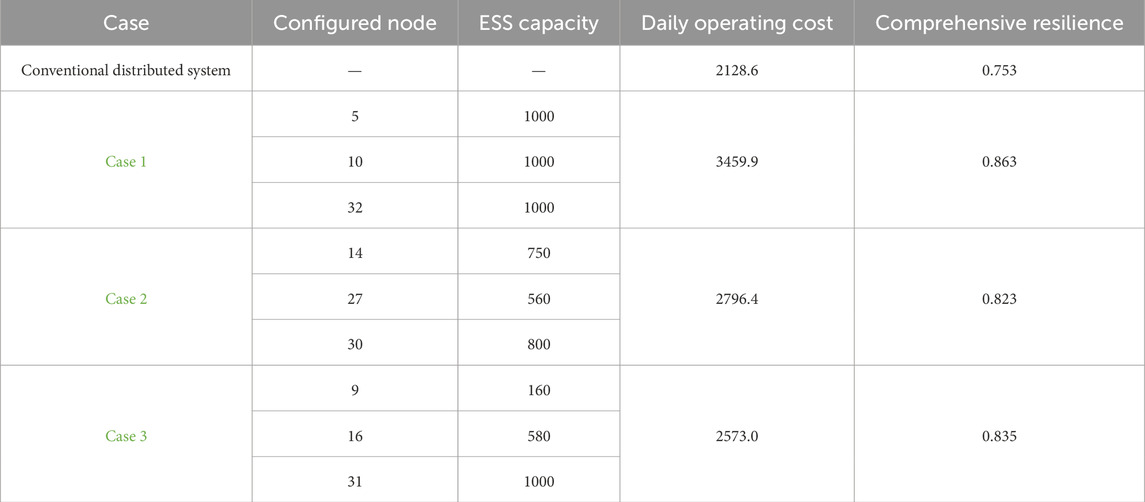
The results of the optimal configuration of the ESS are shown in Table 2. A conventional distribution network lacking an ESS has a weaker ability to address the power quality issues brought about by large-scale distributed PV integration. Additionally, it does not possess sufficient flexibility to handle significant disturbances under extreme events. Consequently, its evaluation results are inevitably lower in the comprehensive resilience assessment system presented in this paper:
Firstly, the configuration of the ESS can smooth the power fluctuations caused by distributed PVs and optimize the power flow to enhance the resistance of the distribution network. Second, it can support uninterrupted loads during significant disturbances and dynamically compensate for voltage amplitudes during voltage sags to improve the distribution network’s recovery. Finally, it can enrich the control methods of the distribution network to enhance adaptability. Therefore, its integration significantly increases the system’s comprehensive resilience index. However, the high investment and operational costs of ESS equipment reduce the economic efficiency of the distribution network. As a result, compared to the traditional distribution network, the comprehensive resilience index of Scenario one increases significantly from 0.753 to 0.863, while the total operating cost also increases. Case 2 considers the economic efficiency of the distribution network based on Scenario 1, and Case 3 further considers power quality issues based on Case 2. The comparison shows that under the comprehensive resilience assessment system proposed in this paper, considering power quality can enhance a distribution net-work’s comprehensive resilience without increasing daily investment and operating costs. This is because the optimization strategy in Case 2 may overlook power quality issues, leading to suboptimal configuration results.
To further analyze the impact of the proposed strategy on the distribution network, the operating scenarios are conducted as shown in Table 3. Specifically, scenario two increases the PV access compared to scenario 1, and the difference between scenario three and 4 with PV and ESS configured is whether to consider power quality. The voltage amplitude conditions at each node in the typical day under different operating scenarios and optimization strategies are shown in Figure 4. The power quality-related indices under different scenarios are presented in Figure 5.
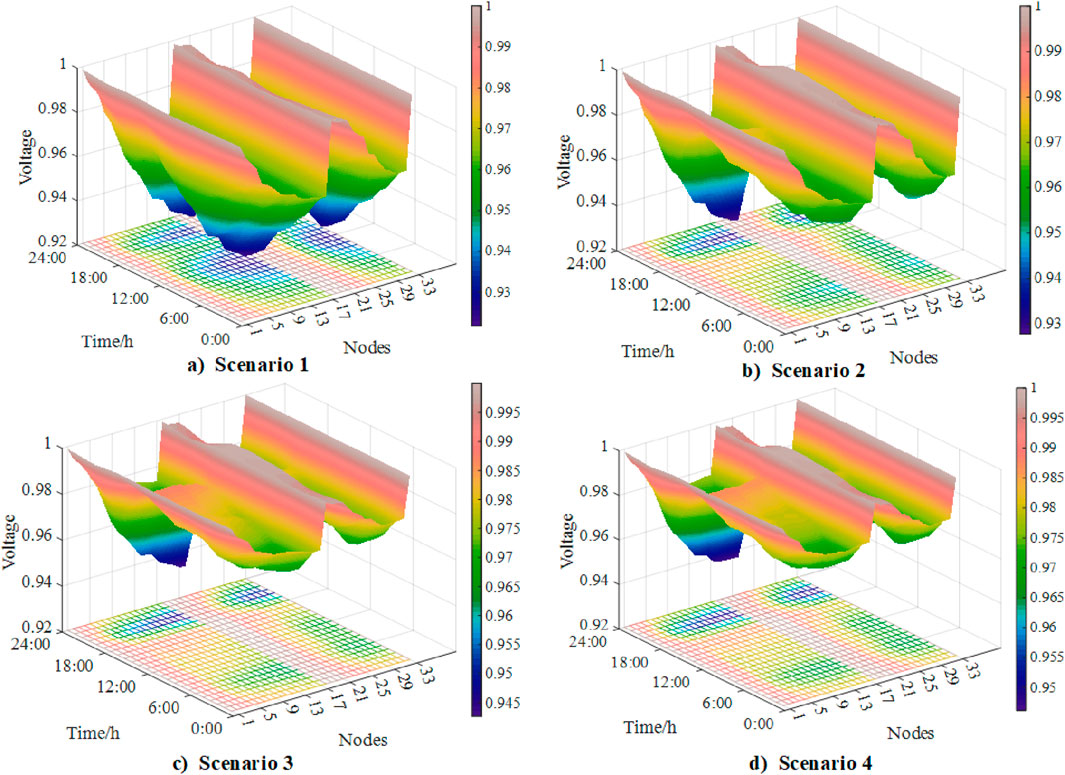
Figure 4. Voltage amplitude under different scenarios. (A) Voltage amplitude in Scenario 1. (B) Voltage amplitude in Scenario 2. (C) Voltage amplitude in Scenario 3. (D) Voltage amplitude in Scenario 4.
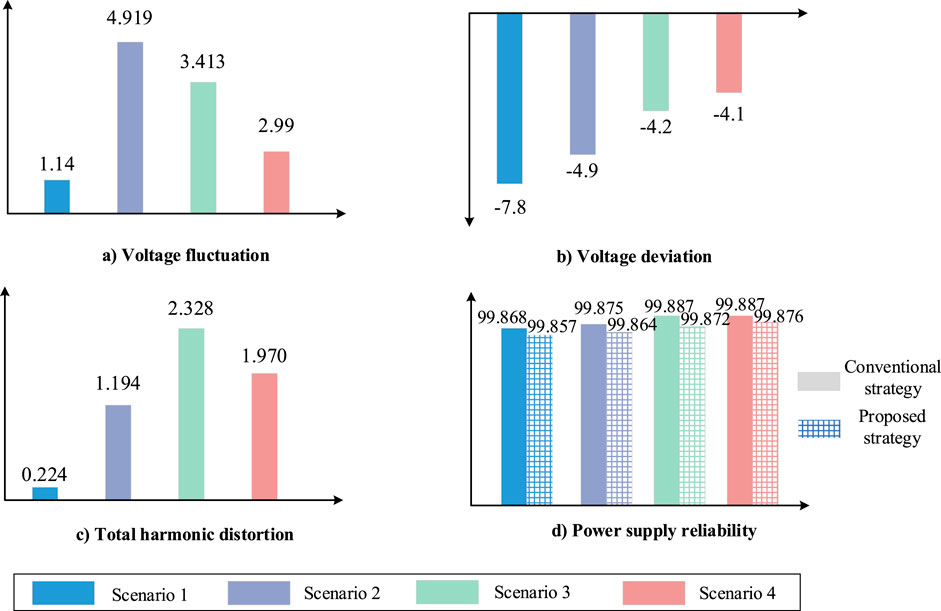
Figure 5. Power quality related indices in different scenarios. (A) Voltage fluctuation in Scenarios 1–4. (B) Voltage deviation in Scenarios 1–4. (C) Total harmonic distortion Scenarios 1–4. (D) Power supply reliability Scenarios 1–4.
Combining Figure 3 and Table 3, it can be seen that with the optimal ESS configuration strategy proposed in this paper, the power quality indices in the resistance dimension of the distribution network are improved compared to those of traditional resilience enhancement strategies. This is due to the optimization of power flow and the suppression of power fluctuations caused by the integration of distributed PVs. According to Equation 3, both PV systems and ESS integration reduce the fundamental current of the distribution network, leading to an increase in the THD to 2.328%. However, in the optimization configuration strategy proposed in this paper, the reduction in the ESS capacity decreases the injected power, thereby increasing the fundamental cur-rent of the distribution network and reducing the system’s THD to 1.970%. Furthermore, as shown in Equation 6, considering the impact of voltage sags on the resilience dimension of the distribution network, the power supply reliability index decreases. This more accurately reflects the power supply quality for systems with a high proportion of sensitive users.
4.3 Analysis of optimization results for different seasons
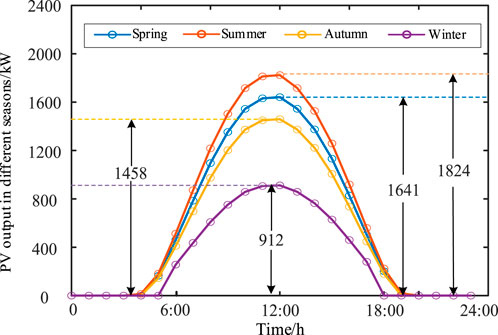
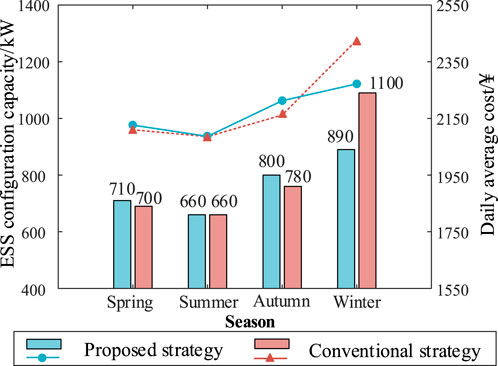
The typical daily generation coefficient curves of distributed PVs in different seasons are shown in Figure 6. The varying solar intensity across seasons leads to different out-puts from distributed PV, thereby affecting the comprehensive resilience of the distribution network. In this section, the comprehensive resilience index Fre is set to a fixed value of 0.75 as a constraint condition to optimize the model. This approach aims to study the capacity of the required ESS configuration to achieve the same resilience level in different seasons. The results are shown in Figure 7.
As shown in Figure 7, under the premise that the resilience index of the distribution network is 0.75, the required ESS configuration capacity is smallest in summer at 660 kW due to the high solar intensity and the large proportion of distributed PV output. In winter, the required capacity is the highest at 890 kW, as the solar intensity is weak, and the dis-tributed PV output is approximately 50% of that in summer. The PV outputs in spring and autumn are slightly lower than those in summer, with the required ESS capacities being 710 kW and 800 kW, respectively.
Considering power quality indices, the integration of distributed PV systems deteriorates power quality issues, resulting in a slight increase in daily average costs. However, in winter, the adverse impact on power quality is minimal due to the low PV output, thus requiring a smaller ESS configuration capacity. In conclusion, when optimizing the ESS configuration in a distribution network, the impact of PV output fluctuations caused by seasonal climate changes must also be considered.
4.4 Analysis of optimization results for different distributed PV penetration rates
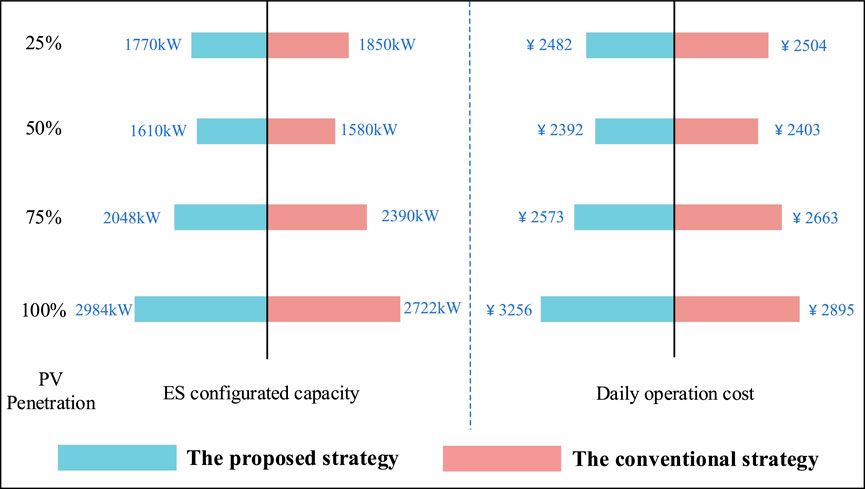
An increase in the proportion of distributed PV integration exacerbates power quality issues in the distribution network. Therefore, this section sets the distributed PV penetration rates at 25%, 50%, 75%, and 100%. The results of the ESS optimization are shown in Figure 6. As illustrated in the figure, with the increase in distributed PV penetration, the ESS configuration capacity and the daily average cost of the regional distribution network initially decrease and then increase. At low penetration rates, the integration of distributed PVs improves low-voltage issues in the distribution network, enhancing the comprehensive resilience index. However, at higher penetration rates, the integration of distributed PVs can lead to power quality issues, which negatively affect the comprehensive resilience index.
As shown in Figure 8, under the optimization configuration strategy proposed in this paper, when the penetration rate reaches 50%, the comprehensive resilience index of the distribution network is highest at 0.838, and the required daily average cost is lowest at Ұ2392. In this scenario, both the comprehensive resilience index and economic efficiency of the distribution network are superior to those in other situations. Therefore, from the perspective of enhancing the comprehensive resilience of the distribution network through the optimal ESS configuration, there is an optimal penetration rate for distributed PV integration. Compared with traditional optimization configuration strategies, when the PV penetration rate exceeds 50%, the required ESS configuration capacity is greater than that in scenarios without considering power quality. This is because higher PV penetration rates lead to power quality issues, necessitating a larger ESS capacity to improve the comprehensive resilience index.
5 Conclusion
In this paper, an ESS optimization configuration model aimed at minimizing the comprehensive resilience index and total operating cost of a distribution network is con-structed. The validity of the model is verified through a comparative analysis of three scenario examples. The following main conclusions are drawn.
(1) By incorporating the impact of power quality issues into the resilience assessment system of the distribution network, this paper provides a more comprehensive reflection of the network’s comprehensive resilience capability. This effectively avoids discrepancies between the resilience assessment results of the distribution network and the actual resilience perceived by the users.
(2) The ESS optimization configuration strategy proposed in this paper can improve the power quality level of the distribution network in both the resistance and recovery dimensions. This reduces the likelihood of equipment damage and economic losses caused by power quality issues during disturbances. Therefore, it is more reasonable to adopt this ESS optimization configuration strategy in regional distribution networks with large-scale distributed PV integration.
(3) When using the comprehensive resilience index of the optimized ESS configuration as the evaluation standard, there is an optimal penetration rate for distributed PV integration. Under these operating conditions, a relatively small ESS capacity can achieve a high comprehensive resilience index for the distribution network.
While the resilience assessment framework proposed in this study is broadly applicable to distribution networks with high PV penetration, additional event-specific indicators may be necessary for a more comprehensive assessment under extreme events, such as earthquakes or severe weather conditions. Future research could expand the model’s applicability to improve evaluation accuracy across a wider range of scenarios, thereby more effectively enhancing the resilience performance of distribution networks.
Data availability statement
The original contributions presented in the study are included in the article/supplementary material, further inquiries can be directed to the corresponding author.
Author contributions
ZL: Writing–review and editing, Methodology, Supervision, Conceptualization, Formal analysis, Project administration, Validation, Funding acquisition, Resources, Visualization. BW: Writing–review and editing, Data curation, Methodology, Supervision, Formal analysis, Project administration, Validation, Funding acquisition, Resources, Visualization. YnC: Conceptualization, Data curation, Formal Analysis, Investigation, Supervision, Validation, Visualization, Writing–original draft, Writing–review and editing. YzC: Conceptualization, Data curation, Supervision, Validation, Visualization, Writing–original draft. LJ: Formal Analysis, Investigation, Methodology, Supervision, Writing–original draft. QZ: Investigation, Methodology, Validation, Writing–original draft. NY: Data curation, Formal Analysis, Funding acquisition, Resources, Validation, Writing–original draft. QL: Conceptualization, Methodology, Validation, Visualization, Writing–review and editing. LZ: Investigation, Methodology, Validation, Visualization, Writing–review and editing. YL: Supervision, Visualization, Writing–review and editing.
Funding
The author(s) declare that financial support was received for the research, authorship, and/or publication of this article. This work was supported in part by the National Key Research and Development Program of China (No. 2021YFB1507205).
Acknowledgments
The authors wish to thank the project funding from the National Key Research and Development Program of China (No. 2021YFB1507205).
Conflict of interest
Authors ZL, YzC, LJ, and QZ were employed by Economic and Technical Research Institute of State Grid Tibet Electric Power Co., Ltd.
Authors BW, YnC, and NY were employed by State Grid Tibet Electric Power Co., Ltd.
Authors QL, LZ, and YL were employed by Nanjing NARI New Energy Technology Co., Ltd.
Publisher’s note
All claims expressed in this article are solely those of the authors and do not necessarily represent those of their affiliated organizations, or those of the publisher, the editors and the reviewers. Any product that may be evaluated in this article, or claim that may be made by its manufacturer, is not guaranteed or endorsed by the publisher.
References
Alshareef, S. M. (2023). Voltage sag assessment, detection, and classification in distribution systems embedded with fast charging stations. IEEE Access 11, 89864–89880. doi:10.1109/ACCESS.2023.3306831
Chen, W., Ai, X., Wu, T., and Liu, H. (2013). Influence of grid-connected photovoltaic system on power network. Electr. Power Autom. Equip. 33 (2), 26–39. doi:10.3969/j.issn.1006-6047.2013.02.005
General Administration of Quality Supervision (2008a). Inspection and quarantine of the people's Republic of China, and China national standardization administration. GBT 12326—2008 power quality - voltage fluctuation and flicker [S]. Beijing: China Standards Press.
General Administration of Quality Supervision (2008b). Inspection and quarantine of the people's Republic of China, and standardization administration of the people's Republic of China. GBT 12325—2008 power quality – deviation of supply voltage [S]. Beijing: China Standards Press.
IEEE recommended Practices and Requirements for harmonic control in electrical power systems. IEEE Std 1992, pp.1–112. doi:10.1109/IEEESTD.1993.114370
Jiang, T., Zhang, D. H., Li, X., Zhang, R. F., and Li, G. Q. (2021). Distributed optimal control of voltage in active distribution network with distributed photovoltaic. Electr. Power Autom. Equip. 41 (9), 102–125. doi:10.16081/j.epae.202108011
Kadir, A. F. A., Khatib, T., and Elmenreich, W. (2014). Integrating photovoltaic systems in power system: power quality impacts and optimal planning challenges. Int. J. Photoenergy 7, 321826. doi:10.1155/2014/321826
Li, Y. C., Jia, Y. B., Xie, D., Han, X. Q., Cao, J. R., and Geng, S. J. (2023). Optimal configuration of wind turbine and energy storage system in distribution network considering influence of power quality. Power Syst. Technol. 47 (6), 2391–2404. doi:10.13335/j.1000-3673.pst.2022.0252
Liu, W. X., Zhang, S. T., Gao, X. Q., and Wang, L. N. (2022). Optimal allocation of modular energy storage in distribution network considering comprehensive utility and subjective cognition. Power Syst. Technol. 46 (6), 2074–2083. doi:10.13335/j.1000-3673.pst.2021.1103
Lu, Y. D., Xie, X. Y., Liu, Z. B., Zhou, Z., Zheng, H., and Xie, L. (2019). Improvement of distribution network terminal voltage based on Energy Storage ESS power source. Power Syst. Clean Energy 35 (6), 28–33. doi:10.3969/j.issn.1674-3814.2019.06.005
Mishra, D. K., Ghadi, M. J., Azizivahed, A., Li, L., and Zhang, J. F. (2021). A review on resilience studies in active distribution systems. Renew. Sustain. Energy Rev. 135, 110201. doi:10.1016/j.rser.2020.110201
Mishra, D. K., Ghadi, M. J., Li, L., Zhang, J. F., and Hossain, M. J. (2022). Active distribution system resilience quantification and enhancement through multi-microgrid and mobile energy storage. Appl. Energy 311, 118665. doi:10.1016/j.apenergy.2022.118665
Nazemi, M., Moeini-Aghtaie, M., Fotuhi-Firuzabad, M., and Dehghanian, P. (2020). Energy storage planning for enhanced resilience of power distribution networks against earthquakes. IEEE Trans. Sustain. Energy 11 (2), 795–806. doi:10.1109/TSTE.2019.2907613
Paul, S., Poudyal, A., Poudel, S., Dubey, A., and Wang, Z. Y. (2024). Resilience assessment and planning in power distribution systems: past and future considerations. Renew. Sustain. Energy Rev. 189, 113991. doi:10.1016/j.rser.2023.113991
Shi, N. H., Cheng, R., Zhang, Q. Z., and Wang, Z. Y. (2022) “Analyzing impact of BESS allocation on hosting capacity in distribution networks,” in 2022 north American power symposium (NAPS). Salt Lake City, UT, USA, 1–6. doi:10.1109/NAPS56150.2022.10012229
Sonal, S. K., and Ghosh, D. (2021). Novel trends in resilience assessment of a distribution system using synchrophasor application: a literature review. Int. Trans. Electr. Energy Syst. 31 (8), e12934. doi:10.1002/2050-7038.12934
Tur, M. R. (2020). Reliability Assessment of distribution power system when considering energy storage configuration technique. IEEE Access 8, 77962–77971. doi:10.1109/ACCESS.2020.2990345
Venkatesan, R., Kumar, C., Balamurugan, C. R., and Tomonobu, S. (2024). Enhancing power quality in grid-connected hybrid renewable energy systems using UPQC and optimized O-FOPID. Front. Energy Res. 12. doi:10.3389/fenrg.2024.1425412
Yuan, W., Wang, J. H., Qiu, F., Chen, C., Kang, C. Q., and Zeng, B. (2016). Robust optimization-based resilient distribution network planning against natural disasters. IEEE Trans. Smart Grid 7 (6), 2817–2826. doi:10.1109/TSG.2015.2513048
Zhang, L., Huang, J. J., Tang, W., Hou, Y., Wang, Z., Xie, F., et al. (2023). Equilibrium allocation of ESSs in multiple UIESs-accessed distribution networks considering the resilience and economic benefits. IEEE Trans. Ind. Appl. 59 (5), 5230–5242. doi:10.1109/TIA.2023.3279062
Zhang, Q. Z., Wang, Z. Y., Ma, S. S., and Arif, A. (2021). Stochastic pre-event preparation for enhancing resilience of distribution systems. Renew. Sustain. Energy Rev. 152, 111636. doi:10.1016/j.rser.2021.111636
Zhang, W. J., Peng, Z. Y., Wang, Q. Q., Qi, W. C., and Yi, G. (2024). Optimal power flow method with consideration of uncertainty sources of renewable energy and demand response. Front. Energy Res. 12. doi:10.3389/fenrg.2024.1421277
Zhou, S. C., Li, Y. F., Jiang, C. W., Xiong, Z., Zhang, J. H., and Wang, L. L. (2023). Enhancing the resilience of the power system to accommodate the construction of the new power system: key technologies and challenges. Front. Energy Res. 16 (7), 3047. doi:10.3389/fenrg.2023.1256850
Keywords: energy storage system, power quality, optimal configuration, resilience of distribution networks, distributed photovoltaic
Citation: Liu Z, Wang B, Chen Y, Chen Y, Jiayang L, Zhang Q, Yuan N, Lu Q, Zhu L and Lin Y (2024) Optimal configuration strategy of energy storage for enhancing the comprehensive resilience and power quality of distribution networks. Front. Energy Res. 12:1472486. doi: 10.3389/fenrg.2024.1472486
Received: 29 July 2024; Accepted: 11 November 2024;
Published: 03 December 2024.
Edited by:
Shiqiang Zhao, Wenzhou University, ChinaReviewed by:
Qianzhi Zhang, Cornell University, United StatesXiaoxu Bo, Wenzhou Vocational College of Science and Technology, China
Copyright © 2024 Chen, Chen, Yuan, Jiayang, Zhang, Lu, Zhu and Lin. This is an open-access article distributed under the terms of the Creative Commons Attribution License (CC BY). The use, distribution or reproduction in other forums is permitted, provided the original author(s) and the copyright owner(s) are credited and that the original publication in this journal is cited, in accordance with accepted academic practice. No use, distribution or reproduction is permitted which does not comply with these terms.
*Correspondence: Yunyao Chen, eHp5dW55YW9jaGVuQDE2My5jb20=
 Zhihong Liu1
 Yunyao Chen