
95% of researchers rate our articles as excellent or good
Learn more about the work of our research integrity team to safeguard the quality of each article we publish.
Find out more
ORIGINAL RESEARCH article
Front. Energy Res. , 22 November 2024
Sec. Wind Energy
Volume 12 - 2024 | https://doi.org/10.3389/fenrg.2024.1470712
Coastal upwelling, marked by cool sea surface temperatures, modulates the wind stress and heat fluxes at the air-sea interface. However, the impact of upwelling on offshore wind power has been scarcely studied. This study uses satellite sea surface temperature data and a numerical model to examine how coastal upwelling shapes the diurnal evolution of the marine boundary layer, focusing on implications for offshore wind energy. The study region is the U.S. Mid Atlantic Bight, specifically the coast of New Jersey, known for its persistent summertime upwelling events. We run numerical experiments with upwelling, and upwelling artificially removed, to assess differences in the atmospheric response. For the wind event considered, results agree with theory where a stable, upwelling-cooled atmospheric boundary layer leads to reduced air-sea drag and turbulence intensity, higher wind speeds at hub height, and greater vertical shear relative to the scenario with upwelling removed. This response is likely caused by a sea breeze superimposed on onshore background winds. Experiments with parameterized turbines show that an 18-hour power generation at a lease area close to the shore was 6.5% higher with upwelling (4.86 GWh and 4.56 GWh, respectively). While upwelling can modulate offshore wind, the nature of the modulation is strongly dependent on the boundary layer regimes, background wind direction, and synoptic or mesoscale weather patterns.
Coastal upwelling has been observed in regions where offshore wind farms are either established or projected, for example, along the U.S. west and east coasts, the Baltic Sea, and the northern coast of South America (Sproson and Sahlée, 2014; Costoya et al., 2019; Rusu, 2020; Raghukumar et al., 2023). Upwelling can influence air-sea fluxes, impacting offshore wind and making it a key factor in renewable energy assessments. Despite this, there is a notable gap in fully understanding how upwelling-driven changes in ocean-atmosphere interactions affect the performance and efficiency of offshore wind turbines. This study explores the role of coastal upwelling in modulating air-sea fluxes and its broader implications for offshore wind energy. Upwelling events feature cold Sea Surface Temperatures (SSTs) with spatial scales that range from tens to hundreds of kilometers, lasting from days to weeks. By moving subsurface cold water to the upper ocean, these events can increase land-sea and air-sea temperature gradients at local and regional scales, modulating winds and fueling thermal circulations such as the sea breeze (Seroka et al., 2018). The layer of the atmosphere that responds to SSTs and air-sea fluxes is the Marine Boundary Layer (MBL), with a typical height range from 500 m to 3,000 m. MBL heights tend to be low under high atmospheric pressure systems and higher in the tropics but can also vary at regional scales (von Engeln and Teixeira, 2013).
Offshore wind farms, with planned turbine hub heights of 150–200 m, will typically lie within the MBL, highlighting the need to understand how surface fluxes, SSTs, and wind power are interconnected. The impact of upwelling on offshore wind, however, has been scarcely studied. Monin-Obukhov theory offers a framework to determine how the wind profile could respond to changing sea surface temperatures (Monin and Obukhov, 1954; Hsu, 1988; Garratt, 1994). Incorporating Prandtl’s mixing length, in which the size of turbulent eddies increases with distance from the surface, the theory proposes that the wind speed increases logarithmically with height. Surface heat and momentum fluxes shape this profile through a competition between thermal and mechanical turbulence, increasing the shear in a stable atmosphere (i.e., warm air over a cool ocean) and reducing it when unstable (i.e., cool air over a warm ocean). Within this framework, we can hypothesize that upwelling stabilizes the lower atmosphere by cooling surface air, which would decrease drag and result in higher wind speeds and greater vertical shear. Conversely, over warmer waters conducive to convection, we would anticipate an increase in drag and a decrease in vertical shear and low-level wind speeds. Vertical mixing under unstable conditions can also mix down momentum from geostrophic winds aloft, increasing wind speeds in the MBL. Applying this theory to coastal environments is complex due to the strong land-sea temperature gradients; however, we will investigate its conceptual validity in the context of upwelling.
Informed by theory, numerical models can represent the multiple physical processes that drive winds in coastal MBLs. These models employ surface and boundary layer schemes connected with boundary conditions that capture synoptic-scale processes, offering a fuller picture of spatial and temporal scales. In this study, we use an atmospheric model of the Mid-Atlantic Bight on the east coast of the United States. Based on a summertime upwelling event, we compare experimental scenarios with upwelling, and upwelling removed, to assess the response of the MBL. Our goals are to explore the role of upwelling on winds and air-sea turbulent fluxes and to discuss how upwelling can modulate offshore wind power. This paper is structured as follows: Section 2 presents the methods, (3) results, (4) discussion, and (5) conclusions.
The Mid Atlantic Bight (MAB) comprises a substantial portion of the U.S. east coast’s continental shelf, extending from Cape Hatteras to Cape Cod and delimited to the east by the 100-m isobath (Figure 1). Seafloor topography, river discharges, and storm events drive ocean circulation in the MAB, which also features seasonal variability in density stratification. In the summer months, the isolation of a bottom cold layer known as the “Cold Pool” from the relatively warm surface layer results in one of the world’s most strongly stratified ocean conditions, with a typical drop from 30°C to 8°C across a thermocline spanning only a few meters (Houghton et al., 1982; Schofield et al., 2008; Chen et al., 2018). The Bermuda-Azores high over the subtropical Atlantic propels persistent southwesterly winds along the New Jersey coast during the summer, causing offshore Ekman transport and the upwelling of the Cold Pool. The spatial extent of the upwelling is noticeable in satellite imagery and depends on the wind stress magnitude and duration, receding during wind relaxation events (Seroka et al., 2018; Murphy et al., 2021). The continental shelf of New Jersey has active and projected offshore wind lease areas within the influence of coastal upwelling (Figure 2A), making it suitable to assess how upwelling modulates the structure of the marine boundary layer and offshore wind power.
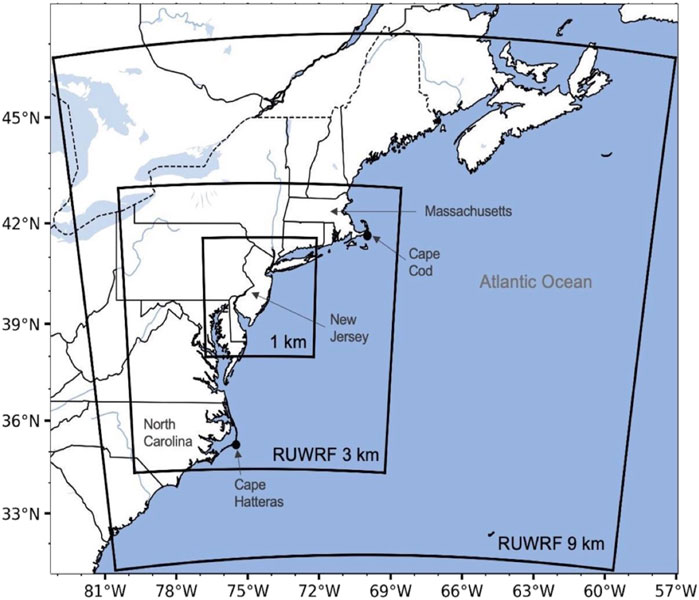
Figure 1. Broader Mid-Atlantic Bight and domains of the Rutgers University-Weather Research and Forecasting (RUWRF) atmospheric model. The model grids have 9, 3, and 1-km spatial resolutions.
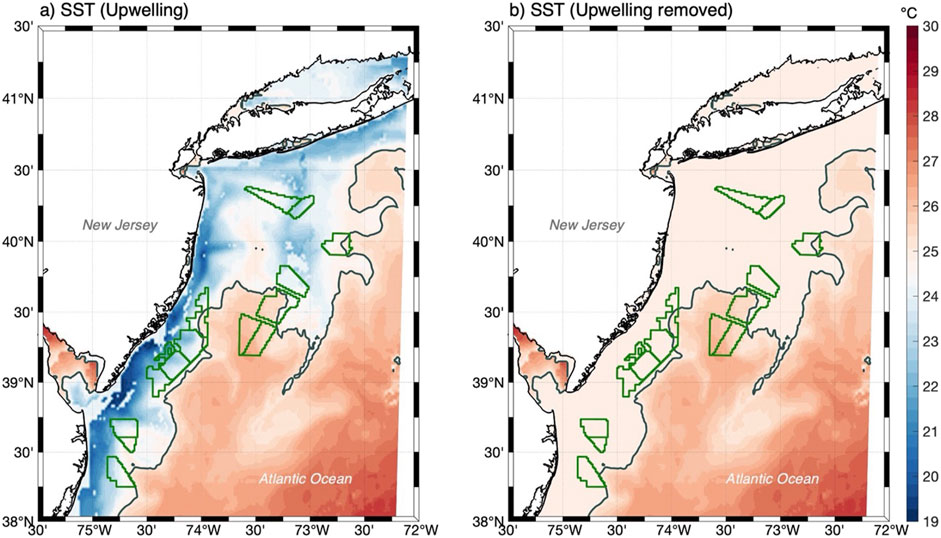
Figure 2. Sea surface temperature input for RUWRF based on cloud-filtered GOES-16 data for 14 August 2022; (A) upwelling and (B) upwelling removed scenarios. The 25°C isotherm contours the extent of the upwelling. The offshore wind lease areas are outlined in green.
The model used in this study is the Weather Research and Forecasting (WRF) model, version 4.1 (Skamarock et al., 2019), implemented for the MAB at Rutgers University, hereafter RUWRF (Figure 1). Designed to support offshore wind research and operations, the current version of RUWRF was run daily from 2019 to 2023 with a grid resolution of 9 km, including 3-km and 1-km nested grids centered on the New Jersey area. The 1-km grid, designed for research applications, allows parameterized wind turbines (Fitch et al., 2012). RUWRF obtained initial and lateral boundary conditions from the Global Forecast System (GFS) at 0.25 ° × 0.25 ° resolution, and initial conditions for Sea Surface Temperature (SST) from cloud-filtered geostationary (GOES-16) data (Schmit et al., 2017; Murphy et al., 2021). The model ran with a time step of 30 s. In the vertical coordinate, RUWRF features 48 vertical levels, 15 of which lie in the lowest 300 m. A comprehensive model evaluation and skill assessment was carried out by the U.S. National Renewable Energy Laboratory (Optis et al., 2020).
RUWRF computes surface fluxes of momentum, sensible, and latent heat following the Mellor, Yamada, Nakanishi, and Niino (MYNN 2.5) surface layer and planetary boundary layer schemes (Nakanishi and Niino, 2009). The wind stress (
where
and
For the sensible heat flux,
This study includes four model runs, all with a focus on the New Jersey area and based on the 1-km nested grid (Table 1). The goal of the first two runs is to determine the role of upwelling in the structure of the marine boundary layer. As a test case, we selected a strong upwelling event from 14 to 15 August 2022 when the coastal SST was as low as 18°C, compared to higher than 25°C offshore. The ‘Upwelling’ run uses the realistic GOES-16 SST input. The ‘Upwelling removed’ run artificially removes the upwelling, setting any SST under 25°C–25°C. Both runs start on 14 August 2022 00: 00 UTC for a 48-h forecast period, based on a single SST input. To exclude model spin-up, the analysis focuses on 15 August 2022, from 12 AM to 6 PM local time (UTC- 4:00). The initial SST input fields are shown in Figure 2 for each model scenario, including the location of offshore wind lease areas.
For these runs, we calculate the surface stability, expressed as the difference between the SST and the air temperature at 2 m, SST–T2. Conditions are stable when the ocean is cooler than the overlying air, limiting convection and reducing friction at the air-sea interface. The opposite is true in unstable conditions when the ocean is warmer than the air, enhancing convection and friction. We evaluate the impact of upwelling on the surface momentum transfer by considering the wind speed at 10 m, the drag coefficient, and the wind stress (Equation 1). We then show patterns in sensible and latent heat fluxes. Next, we focus on the hub height (160 m) and the rotor layer, considering a turbine diameter of 240 m (turbine diameter) the rotor layer extends from 40 m to 280 m above the surface. We then calculate the vertical wind shear as the velocity difference across this layer. The convention hereafter for wind direction is “onshore” (blowing toward the shore) and “offshore” (blowing toward the ocean). The MBL height, based on the MYNN scheme, is defined as the height where the Turbulent Kinetic Energy (TKE) falls below a critical value of 1.0 × 10⁻⁶ m2/s2 (Banks et al., 2015). The last variable we compute is the turbulence intensity (
where
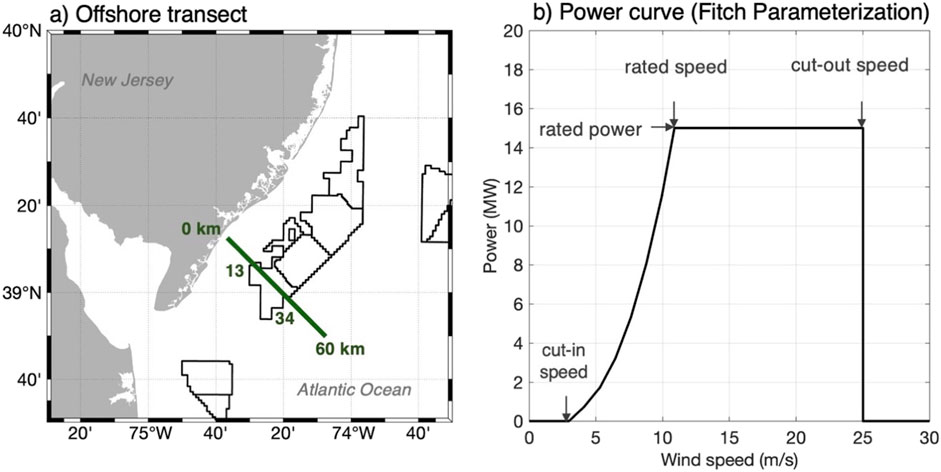
Figure 3. (A) A 60-km cross-shore transect, crossing a lease area between kilometers 13 and 34. (B) Power curve for a 15 MW wind turbine used by the Fitch parameterization.
The second set of runs is identical to the first in terms of forcing and spatial resolution, but they include parameterized wind turbines with a spacing of 2 km within the lease areas. In the Fitch et al. (2012) parametrization used here, a wind turbine acts as a sink of wind kinetic energy due to drag. Some of this energy is converted into usable electrical energy. The fraction of power extracted by the turbine that is not converted into electricity is converted into TKE. The rate of loss of mean wind kinetic energy to drag at a single turbine (Equation 5) can be expressed as (Fitch et al., 2012):
where
where
Cold, upwelling SSTs tend to stabilize the lower atmosphere near the shore, while unstable conditions are prevalent offshore where the ocean is warmer than the overlying air. Figures 4A, B show the stability from midnight to evening on 15 August 2022 along a 60-km offshore transect, and (Figures 4C, D) the constant in time SST across the transect. With upwelling, the SSTs are at their lowest near the shore, increasing from 20.5°C to 25°C across 40 km. Without upwelling, the SST is 25°C (as defined) for 40 km, and then increases by about 1°C offshore.
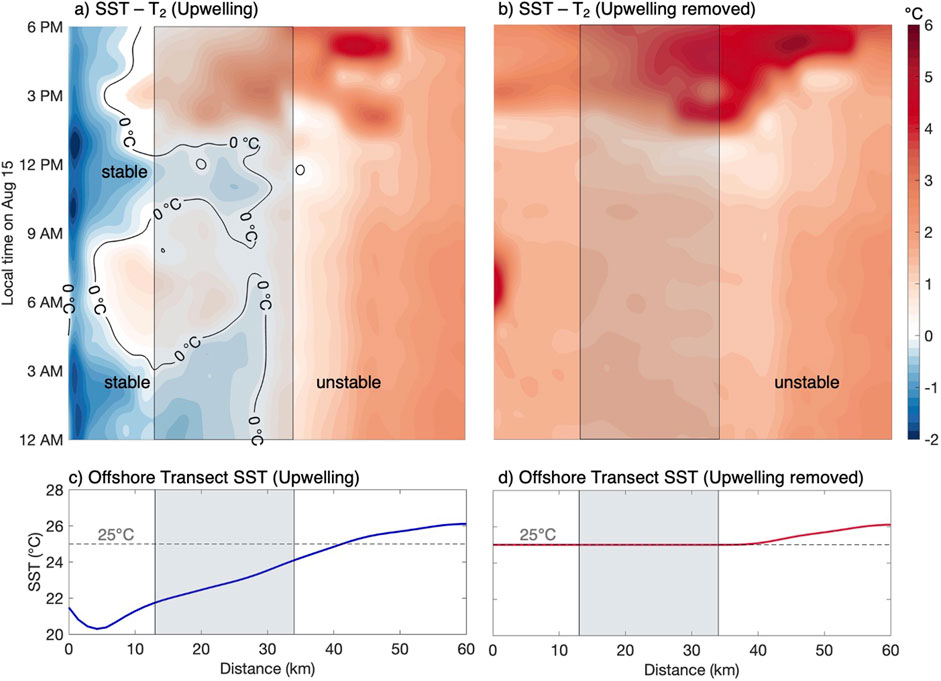
Figure 4. Time series of air-sea temperature difference in the (A) upwelling and (B) upwelling removed scenarios. T2 is the air temperature at 2 m above the surface. The transect crosses one of the lease areas (shaded region). Panels (C) and (D) show the constant in time SST along the transect for each scenario.
Upwelling introduces diurnal and spatial patterns in stability that are absent in the run with upwelling removed. In the upwelling case, the MBL is stable during most of the day near the shore (0–5 km), but the air becomes up to 1°C cooler than the ocean for a few hours in the morning and afternoon. Across the lease area, the SSTs become increasingly warmer, and conditions alternate from stable to unstable during the day and remain unstable between noon and evening. Without upwelling, conditions are consistently unstable along the transect and during the day, indicating that the ocean always remains warmer than the surface air. Unstable conditions strengthen in the afternoon in this case when the ocean can be up to 6°C warmer than the air.
Figures 5A–C, 6A–C show that upwelling tends to intensify the surface wind speed and the wind stress while reducing friction at the surface. In both scenarios, surface wind speeds are low in the mornings, typically under 4 m/s, and rise in the afternoon, exceeding 6 m/s. Upwelling, however, causes wind speeds to increase earlier in the day and enhances both the duration and intensity of peak winds. With upwelling, coastal wind speeds reach 4 m/s by approximately 7 AM and rise to 8–9 m/s by early afternoon, maintaining speeds above 6 m/s until the early evening. With upwelling removed, the wind near the coast only reaches 4 m/s around 10 AM, peaking during the early afternoon but not surpassing 8 m/s and declining below 4 m/s by late afternoon, particularly within the lease area.
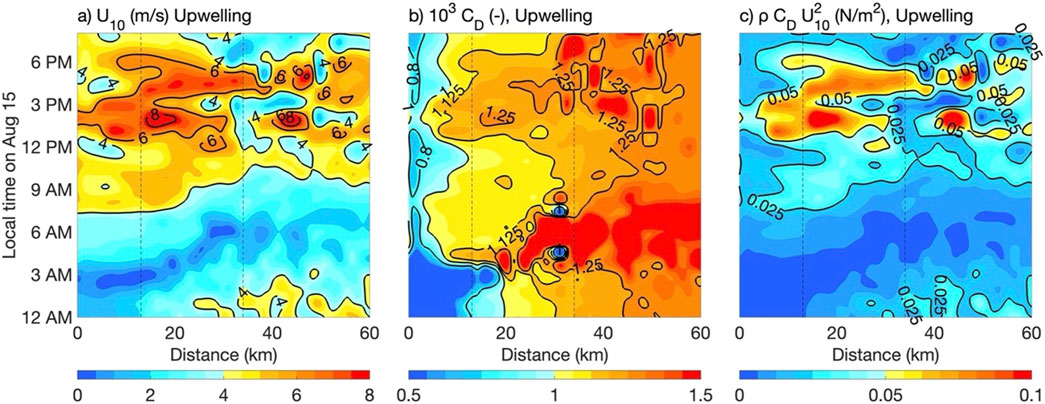
Figure 5. Surface wind speed (A), drag coefficient (B), and wind stress (C) for the upwelling scenario. Dashed vertical lines mark the boundaries of the offshore lease area.
In contrast to the surface wind, which has more variability over time than over distance offshore, the drag coefficient (hereafter ‘drag’) changes both during the day and across the upwelling, with consistently low values over cool coastal waters as shown in Figures 5B, 6B. With upwelling, the drag is around 0.8 - 1 × 10⁻³ up to 20 km offshore over the coldest SSTs. These values increase offshore by 60%, to over 1.4 × 10⁻³, as atmospheric conditions shift from stable to unstable. This cross-shore variability has a temporal component as well: from midnight to early morning, the drag is high (1.5 × 10⁻³), but the wind speeds are low. From morning to afternoon, the drag increases within the lease area by 30%, from 1 × 10⁻³ to 1.3 × 10⁻³, following the increase in wind speed. Without upwelling, the drag stays between 1.1 and 1.2 × 10⁻³, displaying minor change over space and time.
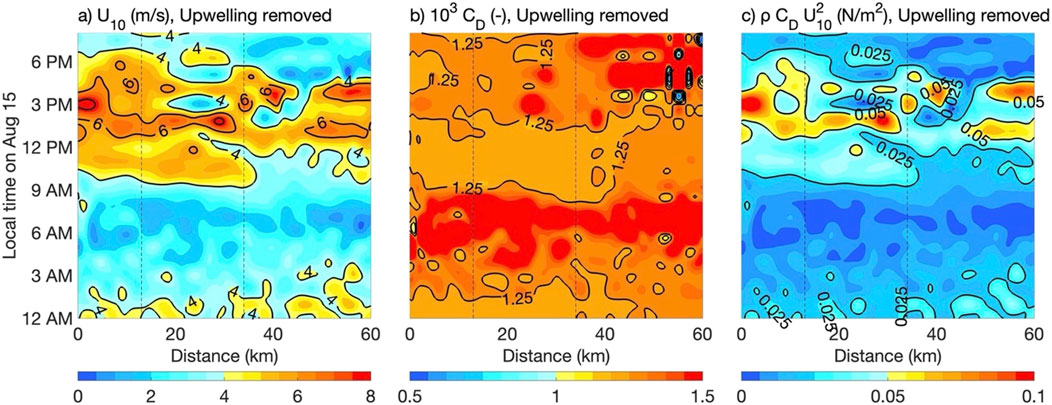
Figure 6. Surface wind speed (A), drag coefficient (B), and wind stress (C) for the Upwelling-removed scenario. Dashed vertical lines mark the boundaries of the offshore lease area.
Figures 5C, 6C illustrate that in both upwelling and no-upwelling scenarios, the surface wind speed, rather than the drag, drives the wind stress. In the upwelling scenario, early afternoon wind stress values range from 0.05 to 0.1 N/m2, mirroring surface wind speed patterns. In the no-upwelling scenario, the wind stress increases to 0.05 N/m2 around noon, but quickly decreases because the higher drag does not offset the lower wind speeds, resulting in a reduced momentum flux. For both scenarios, from midnight to early morning, the wind stress is consistently low due to low wind speeds. The difference in air-sea momentum flux between the scenarios becomes particularly noticeable in the early afternoon, as wind speeds begin to increase at noon, with differences less pronounced in the late night and early morning.
Regarding heat fluxes, Figure 7 shows that upwelling results in air cooling nearshore (sensible heat flux; Figures 7A, B) and maintains low evaporation rates (latent heat flux; Figures 7C, D), contrasting with the warming and higher evaporation rates seen without upwelling. The cold sea SSTs associated with upwelling lead to consistent air cooling throughout the day, as evidenced by sensible flux values reaching −10 W/m2 within the first 10 km from the shore. In the lease area, the sensible heat flux is slightly cooling from midnight to noon, with values ranging from −5 to 0 W/m2, then transitions to warming in the afternoon, exceeding 20 W/m2. Beyond the lease boundary, the cooling effect of the upwelling dissipates, and the sensible flux is consistent with air warming throughout the day.
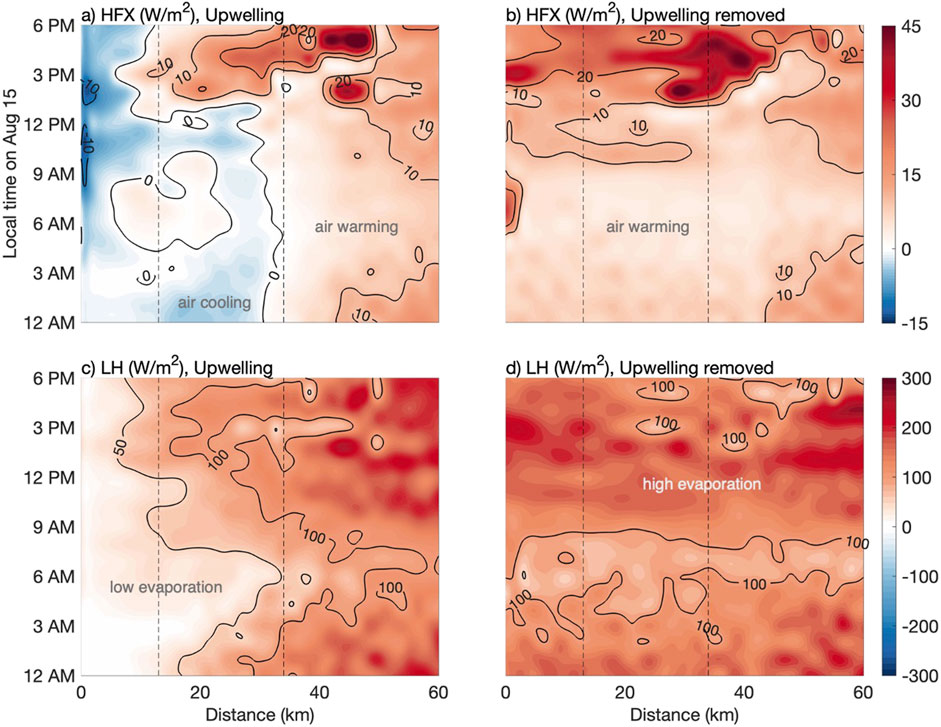
Figure 7. Time series of cross-shelf sensible heat flux (HFX) and latent heat flux (LH) for the (A,C) upwelling and (B, D) upwelling-removed scenarios.
Without upwelling, the sensible heat flux shows continuous air warming, without cross-shore variability, with mild warming from midnight to noon (0–10 W/m2) that intensifies to above 20 W/m2 in the afternoon. The latent heat flux with upwelling remains below 50 W/m2 near the cold nearshore waters, indicating low evaporation. Without upwelling, this flux more than doubles, indicating a marked increase in evaporation correlated to higher SSTs, with morning values of 80–100 W/m2 increasing to ∼200 W/m2 in the afternoon.
Figures 8A–D shows that hub-height wind speeds and vertical shear follow the same pattern of the surface wind speed, with a marked diurnal variability. This contrasts with the drag and stability pattern, which mirror the upwelling more closely. In the upwelling case, the wind speed at hub height exceeds the cut-in speed at 9 AM close to the shore and increases to 8–9 m/s in early afternoon (Figure 8A). In the no upwelling case (Figure 8C), the cut-in speed is reached at around 9 AM and then wind speeds peak in the afternoon but remain under 7 m/s. Offshore of the lease area, differences in hub height wind speed are negligible between modeled scenarios. These results show that the main difference between scenarios are the onset of cut-in speeds and the magnitude of the peak wind rather than the duration that a wind turbine would remain operable. Neither the rated speed nor the cut-out speed was reached in these scenarios.
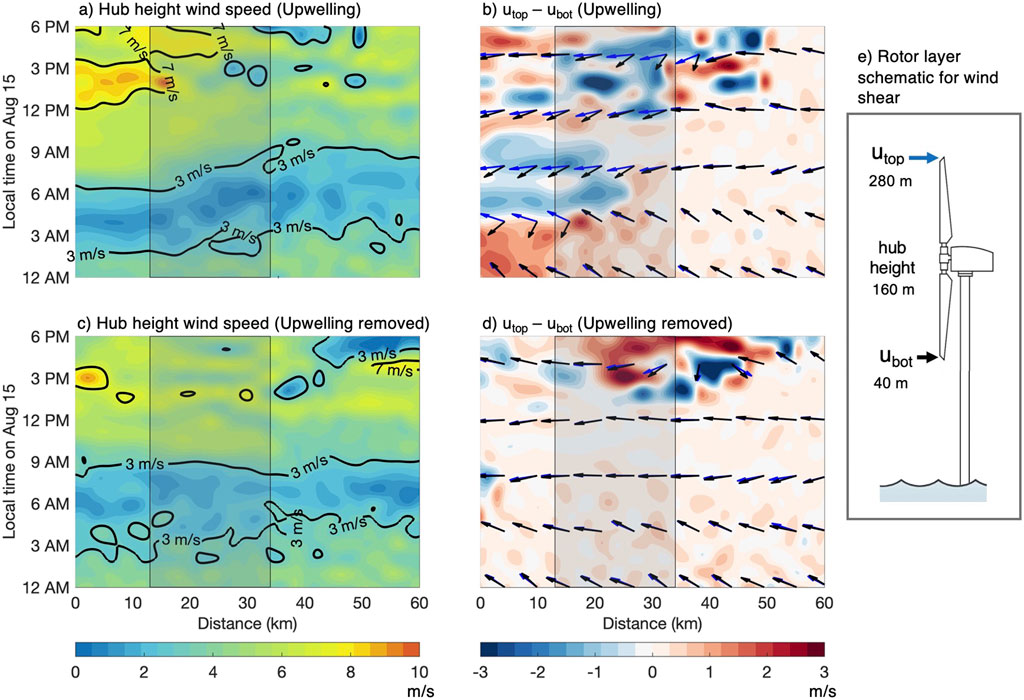
Figure 8. Time series of hub height wind speed (A, C) and wind shear in the rotor layer (B, D) for the upwelling and no-upwelling cases, respectively. Panel (E) shows a schematic of the turbine rotor layer. Positive (negative) shear values indicate wind speed increasing (decreasing) with height. Black and blue arrows denote wind direction at the top and bottom of the rotor layer, respectively.
Model results of wind shear in the rotor layer are shown in Figure 8 (panels b, d; schematic of the rotor layer in panel e). Here, ‘wind shear’ is the difference between the velocity magnitude at the top and the bottom of the rotor layer. Black (blue) arrows indicate the wind direction at the top (bottom) of the rotor layer. Positive (negative) values indicate that the wind speed increases (decreases) with height. For both runs, the wind direction is primarily onshore. The main difference between runs is that the vertical shear in both magnitude and direction is more prominent with upwelling. In the upwelling case, the wind speed magnitude increases with altitude across the rotor layer from midnight to 3 AM by about 1–2 m/s. The directional shear is also significant at about 80° at that time. However, the hub height wind speeds tend to be under the cut-in value. By early morning, the shear shifts from increasing to decreasing across the rotor layer, also by ∼1–2 m/s. The directional shear also decreases to under 30°, indicating an alignment of the wind at the top and bottom of the rotor layer. During the afternoon, the wind remains onshore but vertical shear alternates from increasing to decreasing by 1 m/s across the rotor layer. In the case with no upwelling, the directional wind shear is always negligible, consistent with expectations for a more unstable boundary layer. The shear in magnitude indicates a ∼1 m/s increase with height across the rotor layer, in contrast with the upwelling case where the wind speed can decrease with height.
Patterns in heat and momentum fluxes, along with vertical shear (Figures 5–8) set the stage for exploring turbulence intensity and MBL height, which the upwelling SSTs also modulate. Figure 9 shows the turbulence intensity at hub height for scenarios with (9a) and without upwelling (9b). In the upwelling scenario, low turbulence intensity values of less than 5% persist up to 20 km offshore throughout the day, consistent with a stable atmosphere where turbulence is suppressed. Beyond 20 km, turbulence intensity starts to increase. Despite low wind speeds in the early morning, turbulence intensity reaches 20%–30% but then decreases later in the day as the wind’s total energy becomes more concentrated in the mean wind speed rather than in the TKE.
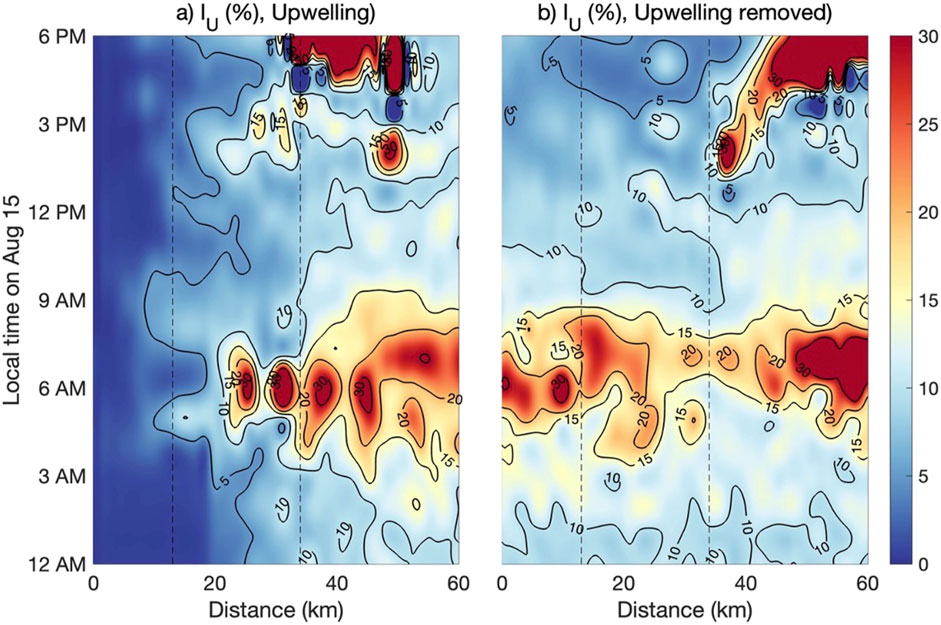
Figure 9. Time series of hub height Turbulence Intensity (IU) for the (A) upwelling and (B) upwelling removed scenarios.
In contrast, without upwelling, the pattern of turbulence intensity is primarily diurnal and shows less spatial dependence. Mornings experience high turbulence intensity, with up to 30% of the wind’s energy in TKE when wind speeds are low. Nearshore, the turbulence intensity is double that observed in the upwelling scenario, lying between 5% and 10%. This suggests that in the no upwelling case, the time of day exerts a more significant effect on turbulence intensity than location relative to the shore.
The low turbulence intensity nearshore and its increase offshore in the upwelling scenario lead to the distinct patterns in MBL height observed in Figure 10. In the upwelling scenario, the MBL height is influenced by the diurnal cycle and the proximity to the shore. Figure 10 shows that the MBL height stays up to 200 m within 15 km offshore, a characteristic of the stable atmospheric conditions over the cold SSTs. Within the lease area, the MBL starts at about 800 m from early morning to noon and then decreases to 200–400 m from noon to early evening.
With upwelling removed, the MBL height does not show significant offshore variability but follows a diurnal pattern. Throughout the night until noon, the MBL maintains a height of about 800–1,000 m, both nearshore and offshore. By early afternoon, this height increases to 1,200–1,300 m and then begins to decrease to approximately 400 m by 3 PM. These patterns are consistent with the diurnal evolution of an unstable boundary layer.
After discussing the MBL response to upwelling, next we show model results with parameterized turbines (Runs 3 and 4). Figure 11A, B) shows the total power generated by the turbines over the last 18 h of the run. The lease area is the closest to the New Jersey shore and lies within the upwelling region. During that period, the total generation was 4.86 GWh with upwelling, 6.5% higher than the no-upwelling scenario with 4.56 GWh. While this is the aggregate comparison, the patterns in power generation vary spatially, also as shown in Figure 11A, B). With upwelling, the turbines with higher power generation are on the eastern edge of the lease area, close to the 25°C SST isotherm. At these locations, the total power per turbine ranged from 17 to 25 MWh. This pattern contrasts with the southernmost region of the lease area where production per turbine was low at around 5 MWh. This gradient in power generation could be attributed to turbine wake effects, as the wind direction had an important onshore component in this case study. The turbines on the east edge of the lease area see the wind coming from offshore, while the ones on the west side see the velocity deficit behind these turbines. In the case with upwelling removed, the turbines with most power generation are also on the eastern side of the lease area, but the generation per turbine is around 17 to 20 MWh. Spatially, most of the turbines in the upwelling scenario generated 20%–40% more power than those in the no-upwelling case. However, this pattern is reversed in the south corner where removal of upwelling increased generation by over 60% (Figures 11C, D). These results highlight the key role of wind direction, turbine array configuration and upwelling on offshore wind power.
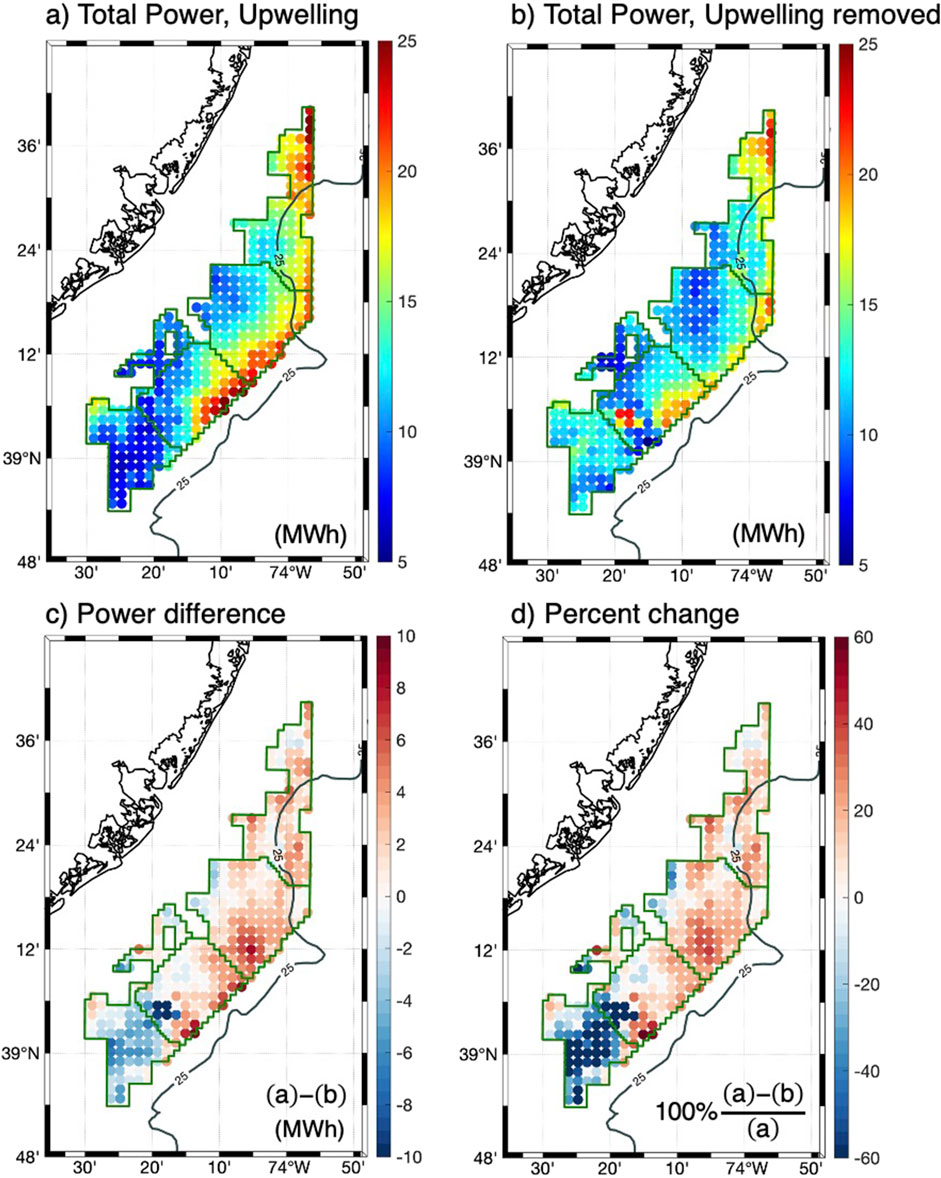
Figure 11. Total power generated over 18 h by the parameterized turbines in a lease area within the upwelling region for the (A) upwelling and (B) upwelling removed cases. Panel (C) shows the difference in power in MWh. Red indicates areas of greater generation when upwelling is considered. Panel (D) shows the percent change in power relative with the upwelling run as the reference.
Numerical experiments with and without upwelling show how cold SSTs influence the MBL response off the New Jersey coast. Variables such as the drag coefficient directly respond to the upwelling SST showing a clear offshore gradient, while the surface and hub-height wind speeds have a diurnal (and not spatial) variability modulated by the SST.
In both modeled scenarios a background wind blew onshore on August 15, as shown in Figures 8B, D. The role of the upwelling here is in the local intensification of this flow by a sea breeze circulation that, in the upwelling case, starts about 3 h earlier in the morning. As the upwelling SST remains cold and the land temperature increases with sunrise, a horizontal temperature gradient is established, likely accelerating the onshore wind, and peaking in early afternoon at over 8 m/s The earlier onset and intensification of the breeze with upwelling is consistent with a modeling study by Seroka et al. (2018), who found a ∼5 h earlier onset of the sea breeze in the MAB during upwelling conditions. Our study follows a different approach than Seroka et al., as we focus on air-sea fluxes and turbulence rather than the sea breeze. When upwelling is absent, the morning nearshore wind speeds increase more gradually, due to the weaker land-sea temperature gradient. As the day progresses, peak onshore wind speeds in the early afternoon do not increase as much as in the upwelling scenario, also consistent with increased surface drag.
Atmospheric stability decouples the marine boundary layer from upper atmospheric levels, indicated by low surface drag coefficients, especially within 5 km from the shore in the upwelling case. This result aligns with studies over the Great Lakes, where temperature differences significantly affect surface drag. Schwab (1978) reported that a 10 m/s wind speed would see a neutral drag coefficient of about 1.3 × 10⁻³ decrease by 30% to 0.9 × 10⁻³ if the water were 5°C cooler than the air. For a 7 m/s nearshore wind, our study finds drag coefficients of 0.8 × 10⁻³ with upwelling and about 1.2 × 10⁻³ without upwelling. Despite decreased drag from the decoupled boundary layer during upwelling, the wind stress still peaks in the afternoon, driven by wind speed more than drag, conforming to the bulk formula where wind stress relates linearly to the drag coefficient and to the squared wind speed.
Limited research exists on the MBL response to upwelling, particularly concerning offshore wind. Sproson and Sahlée (2014) modeled both with and without upwelling in the Baltic Sea, finding that upwelling caused air temperatures 2°C cooler and wind speeds to reduce by up to 0.25 m/s, resulting in a MBL height of only 100 m. These findings agree with ours in terms of MBL height under upwelling but differ in that we observe an increase in wind speed with upwelling because of the superimposed sea breeze. Other studies had a similar approach where the SST was modified in numerical experiments to study how coastal upwelling changes wind speeds, but not in the context of offshore wind. Ribeiro et al. (2011) found, in Cabo Frio, Brazil, that a cold SST of 18°C prescribed in the model intensified the onshore sea breeze, a response similar to our experiments.
While we see an intensification of the onshore wind speed with upwelling, this outcome cannot be generalized to all coastal upwelling events, as the MBL response varies depending on the broader synoptic and mesoscale setting. For example, we could consider a different scenario with offshore instead of onshore background winds. In this case, the cold upwelling SST could lead to an onshore sea breeze against the offshore wind. If the offshore wind is stronger than the sea breeze, then an outcome is warm air advection over the cold SST, which would tend to stabilize and decouple the MBL from upper layers and reduce surface drag. Here, we would see a transition between the unstable conditions over land to the stable conditions over the cold upwelling, which could develop an internal boundary layer and secondary circulations over the ocean (Seo et al., 2023).
Other plausible scenarios include along-coast winds, for example, the upwelling-favorable southwesterly winds off the New Jersey coast where the land is to the left of the wind. In that case, the land-sea temperature gradient is perpendicular to the southwesterly background wind, and the surface divergence due to friction leads to a “corkscrew” sea breeze, characterized by an elongated helicoidal circulation. If the wind were downwelling-favorable, with land on the right in the northern hemisphere, the surface convergence would weaken the upwelling-driven onshore wind, creating a “backdoor” sea breeze (Miller et al., 2003; Steele et al., 2015). Corkscrew sea breezes tend to carry more wind power than their backdoor counterparts (Lin et al., 2019).
A phenomenon not observed in our study but that could be intensified by upwelling is a Coastal Low-Level Jet, which is a localized maximum in wind speed observed in the transition between the land and marine boundary layers at coastal margins. These jets have been observed in the MAB (McCabe and Freedman, 2023) and their intensity is correlated with land-sea temperature gradients (Pullen et al., 2007; Colle and Novak, 2010).
In addition to the configuration of background winds relative to the land-sea temperature gradient and sea breezes, whether the momentum and turbulence in the MBL is driven by surface fluxes or cloud processes is also critical in the expected response to upwelling. In the cases studied here, the MBL is under mostly clear skies where the momentum structure and turbulence respond locally to surface fluxes (i.e., a “bottom-up” response). Another boundary layer scenario, especially in midlatitude regions under large-scale subsidence, is one where the MBL is capped by marine stratocumulus. These clouds can be found over the subtropical ocean and upwelling regions underneath a capping temperature inversion (Hiscox, 2022). They effectively shield the surface ocean from solar radiation. Instead, cooling at the top of the cloud deck creates negatively buoyant thermals that sink through the MBL, overshadowing the effect of surface fluxes. In such a scenario, upwelling facilitates the stable conditions that lead to these clouds, but the turbulence and wind speeds will be more influenced by cooling at the top of the MBL (i.e., a top-down response). An offshore wind farm in a stratocumulus-topped MBL stabilized by upwelling would be affected by top-down turbulence instead of air-sea fluxes. This highlights the need for further studies that evaluate the multiple responses the marine boundary layer and offshore wind could have during coastal upwelling events.
Model results indicate that coastal upwelling increases hub-height wind speeds and vertical shear while reducing turbulence intensity—three critical variables for offshore wind power generation. According to Wharton and Lundquist (2012), convective turbulence typically undermines power generation at wind speeds close to the rated speed. In our study, upwelling leads to low turbulence intensity (under 5%) near the shore during day and night. This condition could potentially limit power generation in the morning when wind speeds, though above the cut-in point, are below rated speed. However, during peak winds in the afternoon (7–8 m/s) accompanied by low turbulence, turbines may outperform power curve estimates. Without upwelling, turbulence intensity is moderate to high (15%–20%) during late night through early morning; but, wind speeds are below cut-in levels during that time. In the afternoon, as turbulence intensity decreases to moderate levels (5%–10%), the slightly weaker peak wind speeds would result in decreased overall power generation.
While high wind speeds and low turbulence intensity are favorable for power generation at speeds close to the rated speed, the role of vertical shear on power is not as straightforward. Wharton and Lundquist (2012) cite the work of Antoniou et al. (2009), who found that low wind shear was conducive to higher power generation. Contrasting these findings, Rareshide et al. (2009), also as discussed by Wharton and Lundquist, analyzed empirical data, and determined that power generation decreased with an increase in turbulence intensity, yet saw an uptick with greater wind shear. In our experiments, upwelling led to both low turbulence intensity and high vertical shear across the rotor layer, both in magnitude and direction. In the parameterized turbines used here, the specific effect of wind shear and background turbulence are not accounted for. More studies are needed to quantify and parameterize this interaction.
In our analysis of parameterized turbine runs, upwelling enhanced power generation, with turbines harnessing 4.86 GWh over 18 h. This is a 6.5% increase compared to the scenarios without upwelling (4.56 GWh). The most productive turbines, located at the eastern edge of the lease area, harnessed up to 17–25 MWh each, benefiting from the prevailing onshore winds. Turbines on the western side saw reduced output due to wake effects that lowered velocity and increased TKE, a mechanism discussed by Emeis (2018). With upwelling removed, turbines on the eastern edge saw their output decrease to between 17 and 20 MWh. Findings from this case study highlight one of the roles coastal upwelling could have on offshore wind power production. Table 2 presents a summary of the main findings, highlighting how coastal upwelling modulated air-sea fluxes, wind speeds, and turbulence in the MBL.
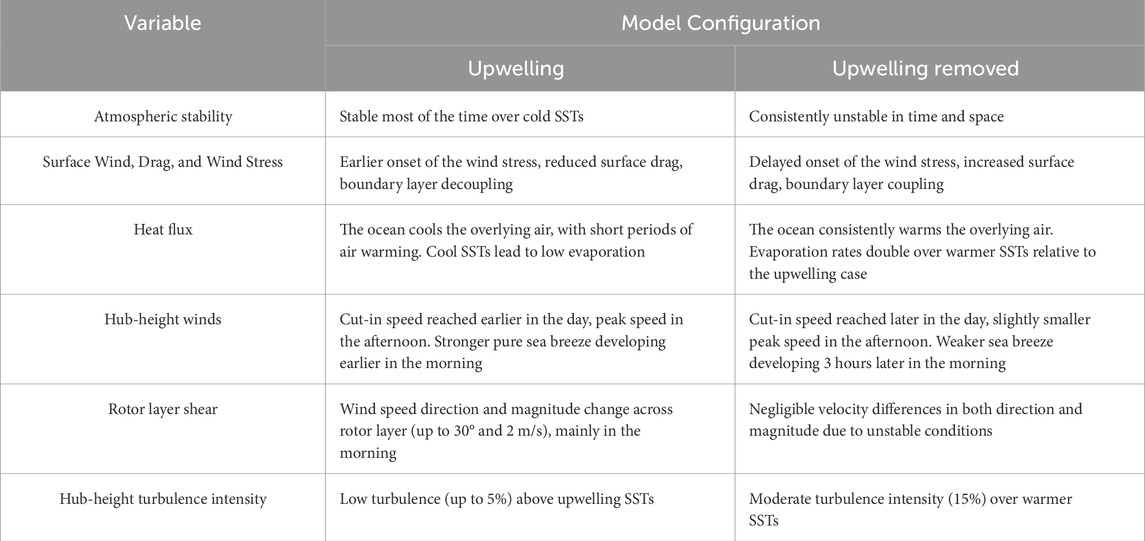
Table 2. Summary of findings for the MBL response to upwelling and implications for offshore wind power generation.
In this study, we conducted experiments with upwelling and upwelling removed to examine the effects on the MBL and power generation in the context of offshore wind. Below are our key findings for a study case based in New Jersey, U.S. Mid-Atlantic Bight:
• Coastal upwelling tends to stabilize the MBL and reduce drag: In the upwelling case, the lower atmosphere was mostly stable, with SSTs cooler than the overlying air, especially near the shore where ocean temperatures were 18°C–20°C. With upwelling removed, the lower atmosphere was unstable, with warm SSTs over slightly cooler overlying air. The spatiotemporal distribution of stability closely follows that of the surface drag coefficient, with low drag values over cold SSTs and higher over warmer offshore water, illustrating the impact of air-sea temperature differences on frictional coupling.
• Coastal upwelling modulates wind stresses and air-sea fluxes while reducing turbulence intensity: As expected, the sensible heat flux indicated air cooling over the upwelling, with warming in offshore waters and in the scenario with upwelling removed. The latent heat flux (evaporation) was low over the upwelling area, with values under 50 W/m2, while without upwelling the values were above 100 W/m2. In both scenarios, surface and hub-height wind speeds were low from midnight to morning and peaked in early afternoon. The key role of the coastal upwelling was to intensify a background onshore wind. As a result, peak surface wind speeds were 2–3 m/s higher in the upwelling scenario. Even though surface drag was lower in the upwelling run, the wind stresses were larger, as the momentum flux was driven by the surface wind speed. Vertical shear, with 2–3 m/s across the rotor layer, was observed in the upwelling scenario. In contrast, the shear was negligible when upwelling was removed. The turbulence intensity at hub height was low, about 5% in the upwelling case close to the shore, but moderate (>10%) when upwelling was removed.
• Upwelling SSTs can affect winds in the MBL and wind power generation: Coastal upwelling reduced MBL heights to approximately 200 m near the coast, whereas heights exceeded 800 m without upwelling. This suggests that, in the upwelling scenario, a portion of the rotor layer would extend beyond the MBL, isolating it from the influence of surface fluxes. Model runs with parameterized turbines indicated that total power generation over an 18-hour period was around 6.5% higher with upwelling (4.86 GWh compared to 4.56 GWh), likely due to the intensification of onshore winds by a superimposed sea breeze. Spatial gradients in cumulative power captured by the wind farm reveal that wind wakes can diminish power generation in downstream turbines for both scenarios.
The results of this study show one of the several ways coastal upwelling can influence the structure of the MBL and, consequently, of wind power. Other scenarios include the presence of corkscrew and backdoor sea breezes, offshore flows that may inhibit sea breeze development, coastal low-level jets, and cloud-topped MBL regimes. In the latter case, cloud cover would shield the sea surface from solar radiation, and turbulence would primarily arise from infrared cooling at the cloud tops, reducing the influence of air-sea fluxes. Further research is needed to better understand the interactions between the MBL structure and air-sea fluxes in different coastal configurations in terms of background winds and land-sea temperature gradients. The influence of mesoscale atmospheric dynamics and cloud cover on coastal wind resources also warrants investigation for its potential insights into climate science and renewable energy strategy.
The datasets presented in this study can be found in online repositories. The online repository is https://zenodo.org/records/110689502.
LP-R: Conceptualization, Formal Analysis, Investigation, Visualization, Writing–original draft, Writing–review and editing. TM: Funding acquisition, Investigation, Project administration, Supervision, Writing–original draft, Writing–review and editing. SG: Writing–review and editing.
The author(s) declare that financial support was received for the research, authorship, and/or publication of this article. This work was supported by the New Jersey Board of Public Utilities (NJBPU).
We thank Lori Garzio, Laura Nazzaro, and James Kim for assistance with the RUWRF model, as well as two reviewers for their constructive feedback. We also thank Mark Miller, Joseph Brodie, and Greg Seroka for insightful discussions on boundary layer meteorology.
The authors declare that the research was conducted in the absence of any commercial or financial relationships that could be construed as a potential conflict of interest.
All claims expressed in this article are solely those of the authors and do not necessarily represent those of their affiliated organizations, or those of the publisher, the editors and the reviewers. Any product that may be evaluated in this article, or claim that may be made by its manufacturer, is not guaranteed or endorsed by the publisher.
Antoniou, I., Pedersen, S. M., and Enevoldsen, P. B. (2009). Wind shear and uncertainties in power curve measurement and wind resources. Wind Eng. 33 (5), 449–468. doi:10.1260/030952409790291208
Banks, R. F., Tiana-Alsina, J., Rocadenbosch, F., and Baldasano, J. M. (2015). Performance evaluation of the boundary-layer height from lidar and the weather research and forecasting model at an urban coastal site in the north-east iberian peninsula. Boundary-Layer Meteorol. 157 (2), 265–292. doi:10.1007/s10546-015-0056-2
Chen, Z., Curchitser, E., Chant, R., and Kang, D. (2018). Seasonal variability of the cold pool over the Mid-Atlantic Bight continental shelf. J. Geophys. Res. Oceans 123 (11), 8203–8226. doi:10.1029/2018jc014148
Colle, B. A., and Novak, D. R. (2010). The New York Bight jet: climatology and dynamical evolution. Mon. Wea. Rev. 138, 2385–2404. doi:10.1175/2009mwr3231.1
Costoya, X., deCastro, M., Santos, F., Sousa, M. C., and Gómez-Gesteira, M. (2019). Projections of wind energy resources in the Caribbean for the 21st century. Energy, 178, 356–367. doi:10.1016/j.energy.2019.04.121
Edson, J. B., Jampana, V., Weller, R. A., Bigorre, S. P., Plueddemann, A. J., Fairall, C. W., et al. (2013). On the exchange of momentum over the open ocean. J. Phys. Oceanogr. 43 (8), 1589–1610. doi:10.1175/JPO-D-12-0173.1
Emeis, S. (2018). Wind energy meteorology: atmospheric physics for wind power generation. Germany: Springer.
Fitch, A. C., Olson, J. B., Lundquist, J. K., Dudhia, J., Gupta, A. K., Michalakes, J., et al. (2012). Local and mesoscale impacts of wind farms as parameterized in a mesoscale NWP model. Mon. Weather Rev., 140(9), 3017–3038. doi:10.1175/MWR-D-11-00352.1
Hiscox, A. L. (2022). Conceptual boundary layer meteorology: the air near here. Germany: Elsevier Science.
Houghton, R. W., Schlitz, R., Beardsley, R. C., Butman, B., and Chamberlin, J. L. (1982). The Middle Atlantic Bight cold pool: evolution of the temperature structure during summer 1979. J. Phys. Oceanogr. 12 (10), 1019–1029. doi:10.1175/1520-0485(1982)012<1019:tmabcp>2.0.co;2
Hsu, S. A. (1988). Coastal meteorology. China: Academic Press. Available at: http://www.loc.gov/catdir/toc/els031/88003288.html.
Lin, Y., Cao, D., Lin, N., Xue, W., Xu, S., Zhao, Y., et al. (2019). Characteristics and simulation biases of corkscrew sea breezes on the east coast of China. J. Geophys. Res. Atmos., 124(1), 18–34. doi:10.1029/2017JD028163
McCabe, E. J., and Freedman, J. M. (2023). Development of an objective methodology for identifying the sea-breeze circulation and associated low-level jet in the New York bight. Weather Forecast., 38(4), 571–589. doi:10.1175/WAF-D-22-0119.1
Miller, S., Keim, B., Talbot, R., and Mao, H. (2003). Sea breeze: structure, forecasting, and impacts. Rev. Geophys. 41 (3). doi:10.1029/2003rg000124
Monin, A. S., and Obukhov, A. M. (1954). Basic laws of turbulent mixing in the surface layer of the atmosphere. Contrib. Geophys. Inst. Acad. Sci. USSR 24, 163.
Murphy, S. C., Nazzaro, L. J., Simkins, J., Oliver, M. J., Kohut, J., Crowley, M., et al. (2021). Persistent upwelling in the Mid-Atlantic Bight detected using gap-filled, high-resolution satellite SST. Remote Sens. Environ. 262, 112487. doi:10.1016/j.rse.2021.112487
Nakanishi, M., and Niino, H. (2009). Development of an improved turbulence closure model for the atmospheric boundary layer. J. Meteorological Soc. Jpn. Ser. II 87 (5), 895–912. doi:10.2151/jmsj.87.895
Optis, M., Kumler, A., Scott, G., Debnath, M., and Moriarty, P. (2020). Validation of RU-WRF, the custom atmospheric mesoscale model of the Rutgers center for ocean observing leadership. Available at: https://www.nrel.gov/docs/fy20osti/75209.pdf.
Pullen, J., Holt, T., Blumberg, A. F., and Bornstein, R. D. (2007). Atmospheric response to local upwelling in the vicinity of New York–New Jersey harbor. J. Appl. Meteor. Climatol. 46, 1031–1052. doi:10.1175/jam2511.1
Raghukumar, K., Nelson, T., Jacox, M., Chartrand, C., Fiechter, J., Chang, G., et al. (2023). Projected cross-shore changes in upwelling induced by offshore wind farm development along the California coast. Commun. Earth and Environ. 4 (1), 116. doi:10.1038/s43247-023-00780-y
Rareshide, E., Tindal, A., Johnson, C., Graves, A., Simpson, E., Bleeg, J., et al. (2009). “Effects of complex wind regimes on turbine performance,” in Proceedings American Wind Energy Association WINDPOWER Conference (Chicago, IL), China, 31 December 1997.
Ribeiro, F. N. D., Soares, J., and Oliveira, A. P. d. (2011). The co-influence of the sea breeze and the coastal upwelling at Cabo Frio: a numerical investigation using coupled models. Braz. J. Oceanogr. 59, 131–144. doi:10.1590/s1679-87592011000200002
Rusu, E. (2020). An evaluation of the wind energy dynamics in the Baltic Sea, past and future projections. Renew. energy 160, 350–362. doi:10.1016/j.renene.2020.06.152
Schmit, T. J., Griffith, P., Gunshor, M. M., Daniels, J. M., Goodman, S. J., and Lebair, W. J. (2017). A closer look at the ABI on the GOES-R series. Bull. Am. Meteorological Soc. 98 (4), 681–698. doi:10.1175/bams-d-15-00230.1
Schofield, O., Chant, R., Cahill, B., Castelao, R., Gong, D., Kahl, A., et al. (2008). The decadal view of the mid-Atlantic bight from the COOLroom: is our coastal system changing? Oceanography 21 (4), 108–117. doi:10.5670/oceanog.2008.08
Schwab, D. J. (1978). Simulation and forecasting of lake erie storm surges. Mon. Weather Rev., 106(10), 1476–1487. doi:10.1175/1520-0493(1978)106<1476:SAFOLE>2.0.CO;2
Seo, H., O’Neill, L. W., Bourassa, M. A., Czaja, A., Drushka, K., Edson, J. B., et al. (2023). Ocean mesoscale and frontal-scale Ocean–atmosphere interactions and influence on large-scale climate: a review. J. Clim., 36(7), 1981–2013. doi:10.1175/JCLI-D-21-0982.1
Seroka, G., Fredj, E., Kohut, J., Dunk, R., Miles, T., and Glenn, S. (2018). Sea breeze sensitivity to coastal upwelling and synoptic flow using Lagrangian methods. J. Geophys. Res. Atmos., 123(17), 9443–9461. doi:10.1029/2018JD028940
Skamarock, W. C., Klemp, J. B., Dudhia, J., Gill, D. O., Liu, Z., Berner, J., et al. (2019). A description of the advanced research WRF version 4. NCAR Tech. note ncar/tn-556+ Str., 145.
Sproson, D., and Sahlée, E. (2014). Modelling the impact of Baltic Sea upwelling on the atmospheric boundary layer. Tellus A Dyn. Meteorology Oceanogr. 66 (1), 24041. doi:10.3402/tellusa.v66.24041
Steele, C. J., Dorling, S. R., von Glasow, R., and Bacon, J. (2015). Modelling sea-breeze climatologies and interactions on coasts in the southern North Sea: implications for offshore wind energy Q. J. R. Meteorological Soc., 141(690), 1821–1835. doi:10.1002/qj.2484
von Engeln, A., and Teixeira, J. (2013). A planetary boundary layer height climatology derived from ECMWF reanalysis data. J. Clim. 26 (17), 6575–6590. doi:10.1175/jcli-d-12-00385.1
Keywords: coastal upwelling, offshore wind energy, marine boundary layer, air-sea interaction, heat fluxes at the surface
Citation: Pareja-Roman LF, Miles T and Glenn S (2024) Coastal upwelling modulates winds and air-sea fluxes, impacting offshore wind energy. Front. Energy Res. 12:1470712. doi: 10.3389/fenrg.2024.1470712
Received: 26 July 2024; Accepted: 30 October 2024;
Published: 22 November 2024.
Edited by:
Agnimitra Biswas, National Institute of Technology, IndiaReviewed by:
Anal Ranjan Sengupta, JIS College of Engineering, IndiaCopyright © 2024 Pareja-Roman, Miles and Glenn. This is an open-access article distributed under the terms of the Creative Commons Attribution License (CC BY). The use, distribution or reproduction in other forums is permitted, provided the original author(s) and the copyright owner(s) are credited and that the original publication in this journal is cited, in accordance with accepted academic practice. No use, distribution or reproduction is permitted which does not comply with these terms.
*Correspondence: L. Fernando Pareja-Roman, cGFyZWphQG1hcmluZS5ydXRnZXJzLmVkdQ==
Disclaimer: All claims expressed in this article are solely those of the authors and do not necessarily represent those of their affiliated organizations, or those of the publisher, the editors and the reviewers. Any product that may be evaluated in this article or claim that may be made by its manufacturer is not guaranteed or endorsed by the publisher.
Research integrity at Frontiers

Learn more about the work of our research integrity team to safeguard the quality of each article we publish.