- State Grid Jincheng Electric Power Supply Company, Jincheng, China
Introduction: In response to the issues of complexity and low efficiency in line loss calculations for actual distribution networks, this paper proposes a fast power flow calculation method for distribution networks based on Neo4j graph models and a hierarchical forward-backward sweep parallel algorithm.
Methods: Firstly, Neo4j is used to describe the distribution network structure as a simple graph model composed of nodes and edges. Secondly, a hierarchical forward-backward sweep method is adopted to perform power flow calculations on the graph model network. Finally, during the computation of distribution network subgraphs, the method is combined with the Bulk Synchronous Parallel (BSP) computing model to quickly complete the line loss analysis.
Results and Discussion: Results from the IEEE 33-node test system demonstrate that the proposed method can calculate network losses quickly and accurately, with a computation time of only 0.175s, which is lower than the MySQL and Neo4j graph methods that do not consider hierarchical parallel computing.
1 Introduction
As distribution network monitoring systems become increasingly intelligent and the frequency of load data collection increases, more frequent line loss calculations can accurately capture the daily fluctuations in line losses, especially for distribution networks with high level of renewable penetrations (Ruan et al., 2024a; Wu et al., 2024a; Ruan et al., 2024b). However, this also places higher demands on calculation speed (Wang et al., 2019; Yang et al., 2022; Bennani et al., 2023). Rapid line loss calculations can help identify defective components in the system and rectify locations that violate line loss patterns. Therefore, researches on line loss calculation have practical significance for safe, stable and economic operation of distribution networks (Castaño et al., 2013; Kocar et al., 2016).
Currently, the main methods for calculating line losses in distribution networks at different voltage levels include the equivalent resistance method (Khazaee et al., 2017), artificial intelligence algorithms (Zhang, 2019; Ren et al., 2020; Guo et al., 2021; Liu et al., 2023; Ruan et al., 2024c), and the forward-backward sweep method (Meena et al., 2018; Yan et al., 2019; Huang et al., 2022). The equivalent resistance method has lower accuracy when calculating distribution network line losses. Artificial intelligence algorithms lack unified calculation rules, and their results often have a degree of randomness and blindness. The forward-backward sweep method has advantages such as good stability and fast calculation speed. However, when the structure of the distribution network changes, it requires re-transforming the network structure into a matrix and renumbering the network using path search algorithms, resulting in a significant workload. To address uncertainty factors, many scholars have proposed probabilistic power flow calculations (Kazemdehdashti et al., 2018; Zuluaga and Alvarez, 2018). Reference (Zuluaga and Alvarez, 2018) uses Monte Carlo simulation to analyze systems with distributed power sources, which requires large amounts of data and has relatively low computational efficiency.
Distributed computing approaches are gaining popularity in power system analysis (Wu et al., 2024b; Ruan et al., 2024d). These approaches can be divided into two categories: parallel computing (Ahmadi et al., 2021; Rodriguez et al., 2021) and graph computing (Hu et al., 2017; Ruan et al., 2023). Compared to GPU parallel methods, Neo4j-based graph parallel computing does not require complex memory management or expensive graphics processors (Pan and Jing, 2018; Zhou et al., 2021). To further improve calculation speed and accuracy, and enhance adaptability to changes in distribution network structure, this paper proposes a hierarchical parallel calculation method for distribution network line losses based on the Neo4j graph model. The method’s efficiency is verified by performing power flow calculations on the IEEE 33-node test system and comparing it with two serial calculation methods based on MySQL and Neo4j, demonstrating the speed of the Neo4j-based hierarchical parallel computing method in solving distribution network line loss problems.
2 Graph model construction based on Neo4j
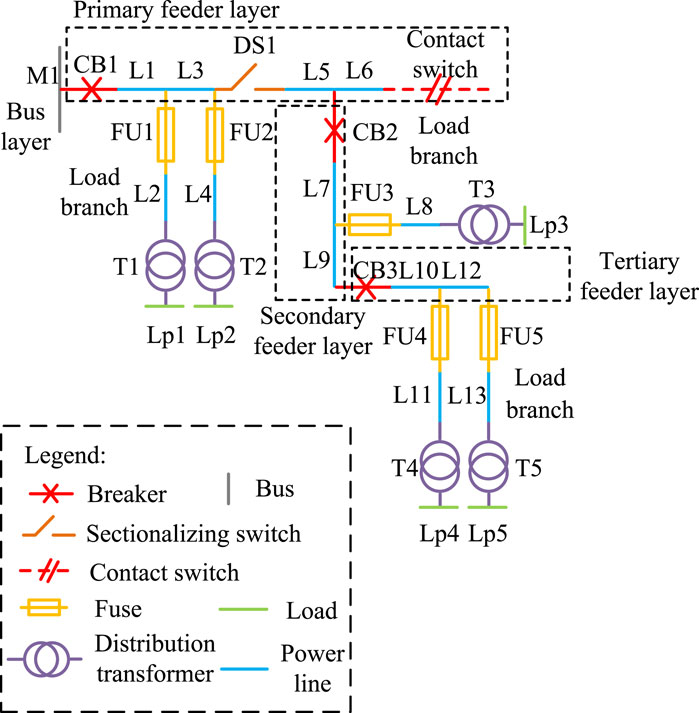
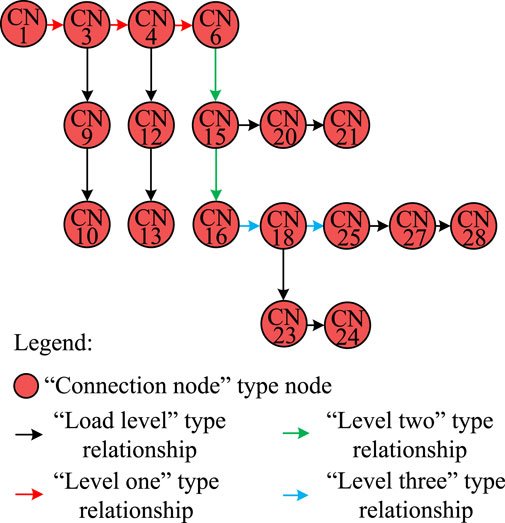
The distribution network can be sequentially divided into three layers based on its power supply paths and connection relationships: bus, feeder, and load branch (Nour et al., 2023). Figure 1 shows a schematic diagram of a multi-layer distribution network structure with a voltage level of 10 kV from a domestic source. Neo4j can describe the distribution network relationship model as a directed graph model in the form of G (V, E), where V and E represent the set of nodes and the set of edges, respectively, as shown in Figure 2.
In graph databases, the connections between entity objects are just as important as the entities themselves, and they are stored as part of the data. This storage mechanism allows graph databases to quickly respond to complex queries about relationships between large-scale network entities, as the relationships between entities are pre-stored in the database. At the same time, graph databases can intuitively visualize entities and the relationships between them, making them the best method for storing, querying, and analyzing highly interconnected data. Consequently, when the distribution network structure changes, the Neo4j graph model can be employed to swiftly characterize the varying levels of feeder layers corresponding to different network structures, as well as the interconnections between equipment in various load branches.
3 Hierarchical forward-backward sweep power flow calculation
3.1 Layering of distribution networks
In distribution networks, the feeder layers and load branch layers are divided by lines containing circuit breaker equipment and lines containing fuse equipment. Specifically, the relationship type between electrical nodes in the first-level feeder layer is “Level One,” the relationship type between electrical nodes in the second-level feeder layer is “Level Two.” The connection relationship type of electrical nodes in each load branch is “Load Level,” and they are correspondingly connected to the electrical nodes in various levels of feeder layers.
3.2 Equivalent loss model for load layer and feeder layer
Taking the load branch (CN25-CN27-CN28) in the load branch layer of the distribution network graph model shown in Figure 2 as an example for power flow analysis, referring to Figure 1, we can see that CN25-CN27 are connected through line L13, with line impedance parameters: ZL13 = RL13+jXL13; CN27-CN28 are connected through transformer T5, with transformer ratio, equivalent impedance parameters and fixed losses: k, ZT5 = RT5+jXT5, ST5; Load Lp5 is connected after CN28, with parameters: S28 = P5+jQ5. Based on this, an equivalent loss model for this layer’s branch is established, as shown in Figure 3A. The specific power flow analysis process is as follows.

Figure 3. Hierarchical equivalent loss model. (A) Equivalent loss model of the CN25-CN27-CN28 load branch. (B) Equivalent loss model of the CN16-CN18-CN25 tertiary feeder.
3.2.1 Forward sweep process
The forward sweep process is shown in Equations 1-4.
where
3.2.2 Backward sweep process
The backward sweep process is shown in Equations 5-9.
where
3.3 Hierarchical distribution network power flow calculation process
The flowchart of the hierarchical forward-backward sweep power flow algorithm based on the distribution network graph model is shown in Figure 4. The specific calculation steps are as follows:
Step 1: For each load branch structure in the distribution network, perform forward calculations based on the equivalent loss model of the load branch as shown in Figure 3A. Obtain the power values at the nodes connected to the start of each load branch, and transfer these power values to the corresponding nodes in the feeder layer connected to the load branches.
Step 2: Starting from the N-th level feeder layer, perform forward calculations based on the equivalent loss model of the feeder layer as shown in Figure 3B. Obtain the power value at the node connected to the start of this feeder layer, and transfer this value to the corresponding node in the (N-1)-th level feeder layer connected to this feeder layer. Continue this process until reaching the first-level feeder layer, thus completing the entire forward calculation.
Step 3: Begin the backward sweep calculation from the first-level feeder layer. After obtaining updated voltage values for each node, transfer these to the lower-level feeder layers or connected load branches. Continue this process until the backward calculation reaches the N-th level feeder layer and the load branches connected to the N-th level feeder layer.
Step 4: For all load branches with updated voltage values at their starting nodes, perform backward calculations using the equivalent loss model of the load branch. Based on the calculation results, check the convergence condition. If satisfied, stop the calculation; otherwise, return to Step 1 for another iteration.
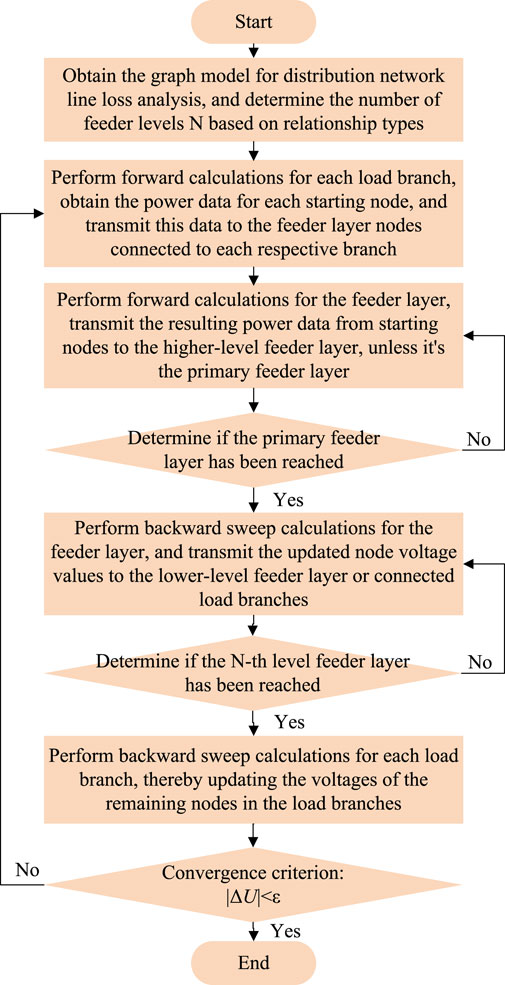
Figure 4. Hierarchical forward-backward sweep power flow calculation process based on distribution network graph model.
Finally, upon completing the iterations, the line losses for each load branch and each feeder layer can be obtained. Assuming there are n lines in the load branch layer and m lines in the feeder layer, their losses are expressed as Equation 10 and Equation 11, respectively:
where
4 Distribution network line loss calculation based on BSP
4.1 BSP computation model
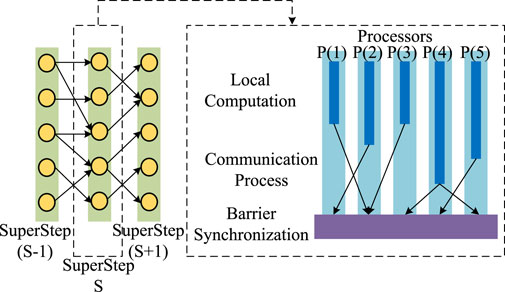
The BSP computation model is the core technology for parallel computation in graph databases. It implements an iterative process using multiple global SuperSteps, as shown in Figure 5. From Figure 5, we can see that a SuperStep in the BSP computation model mainly consists of 3 steps. The specific synchronous parallel steps are as follows:
Step 1: Local Computation. Multiple processors perform parallel computations of user-defined local functions. Each participating processor has assigned tasks, and these are mutually independent.
Step 2: Communication Process. Information exchange takes place between processors, transmitting calculation results to the corresponding processors.
Step 3: Barrier Synchronization. When a processor encounters a “barrier” (or fence), it needs to wait for all remaining processors to complete their respective computational tasks and finish information transfer, ending this SuperStep.
4.2 Parallelization of hierarchical forward-backward sweep power flow calculation
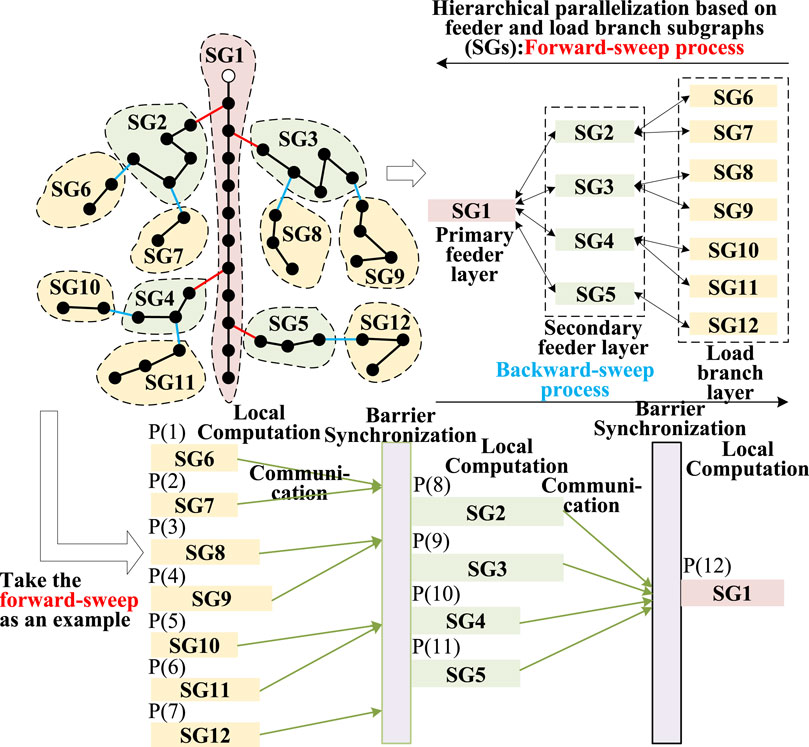
In the distribution network graph model G (V, E) for line loss analysis, if there exists Si (Vi, Ei), where Vi∈V and Ei∈E, then the graph Si is called a subgraph of graph G. Based on the division of load branch layers and feeder layers, combined with Neo4j’s path query statements, it is possible to query load branch subgraphs and feeder subgraphs. Using each subgraph as a unit, the layered forward-backward substitution power flow algorithm can be parallelized.
From Figure 6, we can see that, taking the forward process as an example, the hierarchical forward parallel calculation of the distribution network mainly includes 3 SuperSteps. The specific descriptions of SuperSteps 1–3 are as follows:
SuperStep 1: Seven load branch subgraphs (subgraphs 6–12) in the load branch layer complete parallel forward calculations, and transmit the calculation results to the secondary feeder subgraphs. When all communications are completed, SuperStep 1 ends and SuperStep 2 begins.
SuperStep 2: Four feeder subgraphs (subgraphs 2–5) in the secondary feeder layer perform parallel forward calculations, then transmit the updated power data to the primary feeder subgraph. When the scale of certain subgraphs is too small, the calculations for these small-scale subgraphs will be handled by the same processor, in order to improve overall computational efficiency. When all communications are completed, SuperStep 2 ends and SuperStep 3 begins.
SuperStep 3: One feeder subgraph (subgraph 1) in the primary feeder layer performs forward calculation, then updates the voltage of each node through backward calculation, and transmits it to the secondary feeder subgraphs, initiating the backward process.
5 Case study
To verify the effectiveness of the method proposed in this paper for calculating line losses, the IEEE 33-node distribution network system shown in Figure 7A is selected for analysis, considering the addition of corresponding load branches and fully accounting for transformer losses. For example, 32 load branches are added to the node system, increasing the number of nodes from 33 to 97. Node 0 in the system represents the balance node, with an initial voltage of 10.5 kV, a base power of 1 MVA, and a total load of 3715 kW + 2300 kVar. Furthermore, it is assumed that all transformers are model S13-M-400/10, with a capacity of 0.4 MVA, a voltage ratio of 10 kV/0.4 kV, an equivalent impedance of 1.325 + j10 Ω, and a no-load loss of 0.95 kW.
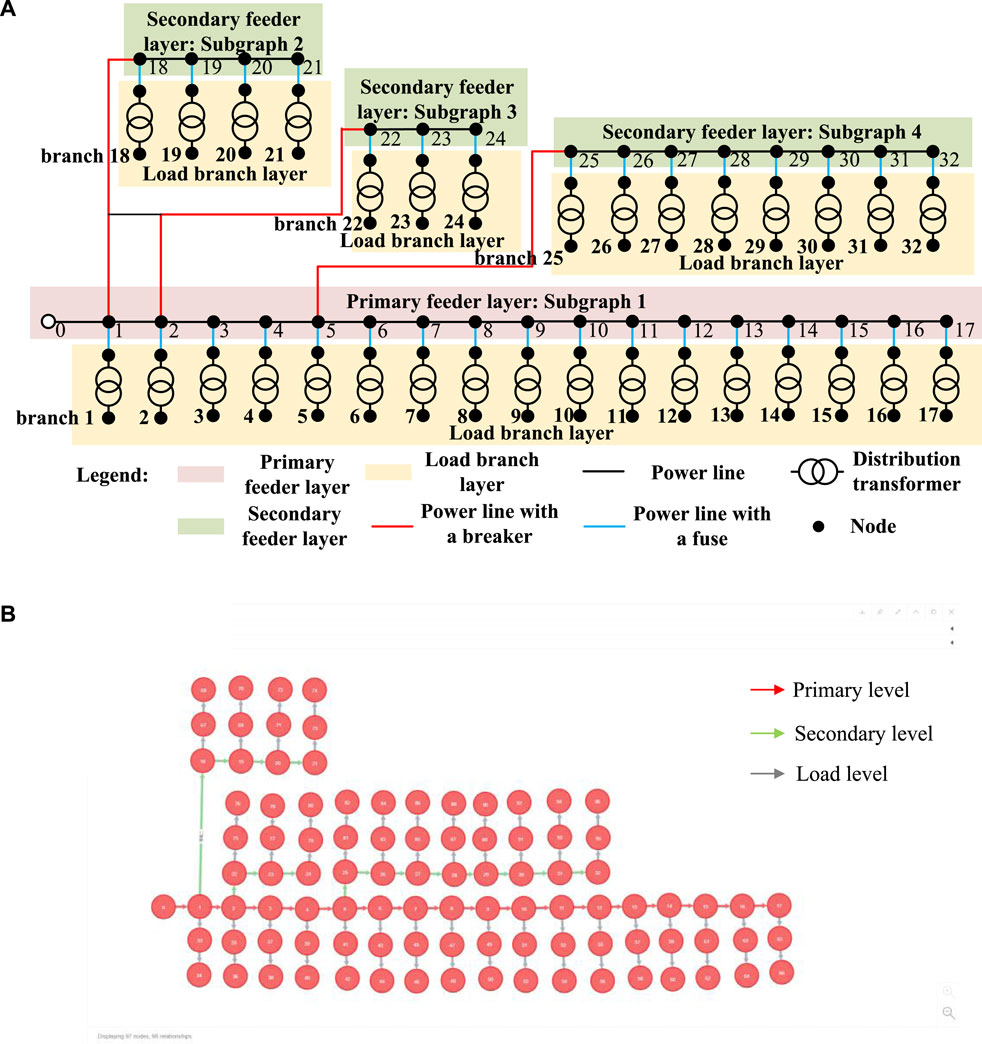
Figure 7. IEEE 33-node distribution network structure and its graph model. (A) Network structure. (B) Graph model for the line loss analysis.
According to hierarchical theory, the distribution network can be divided into feeder layers and load branch layers. The feeder layer is divided into two levels: the primary feeder layer (including subgraph 1) and the secondary feeder layer (including subgraphs 2–4). The load branch layer contains 32 load branch subgraphs (subgraphs 1–32), connected to their respective feeders, to be used for subsequent calculation tests.
The line loss analysis graph model corresponding to the IEEE 33-node distribution network system is shown in Figure 7B. The graph model consists of 97 nodes and 96 edges. The active and reactive power of each load is stored in the nodes, the impedance of each transformer and line is stored in the edges, and the node relationships at different layers are distinguished by the characteristics of the edges.
The line loss calculation results for subgraphs 1-4 of each feeder layer level and the 32 subgraphs of the load branch layer, obtained through the hierarchical forward-backward sweep parallel algorithm based on the graph model proposed in this paper, are shown in Table 1.
From Table 1, it can be seen that the total active and reactive power losses of the IEEE 33-node distribution network system are 320.58 kW and 244.11 kvar, respectively. Using a hierarchical approach, the active power losses and their proportions for each level of feeder layer subgraphs can be obtained. Among them, the active power loss of the primary feeder layer subgraph 1 is 209.86 kW, accounting for the highest proportion of 65.46%; while in the secondary feeder layer, compared with other subgraphs, subgraph 4 has an active power loss of 24.50 kW, accounting for the highest proportion of 7.64%. From this, the distribution network operator can identify the corresponding loss reduction areas in the distribution network and carry out targeted loss reduction modifications.
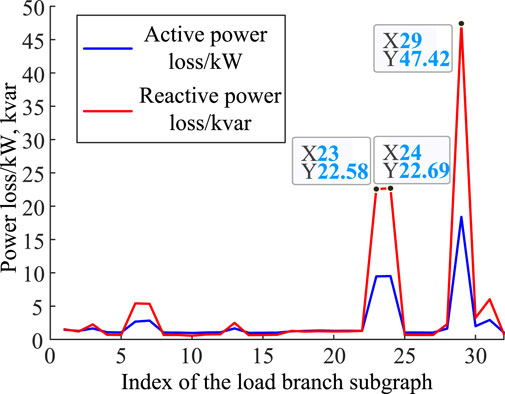
For the load branch layer, which contains 32 subgraphs, the active and reactive power loss values corresponding to each subgraph are shown in Figure 8. From Figure 8, analyzing the fluctuations of active and reactive power losses corresponding to the numbers of each load branch subgraph, it can be seen that load branch subgraphs 23, 24, and 29 have relatively large active and reactive power loss values. Therefore, measures can be taken to rectify the transformers and conductors on these numbered load branches in the load branch layer, thereby reducing the system’s line losses.
To verify the advantages of the proposed method in terms of computational efficiency, Table 2 compares the line loss calculation time consumption of the method in this paper (hierarchical parallel computation based on Neo4j) with two serial computation methods based on MySQL and Neo4j.
From Table 2, it can be seen that when storing the same distribution network structure data, the serial computation based on Neo4j consumes less time than MySQL using the same method. The method in this paper has the highest performance, with a calculation time consumption of only 0.175 s, enabling rapid completion of system line loss calculations.
6 Conclusion
This paper proposes a fast power flow calculation method for distribution networks based on the Neo4j graph model and a hierarchical forward-backward sweep parallel algorithm. It performs hierarchical forward-backward sweeps by feeder layer and load branch layer, calculating the line losses of each subgraph separately. The calculation is accurate and can clearly identify the subgraph areas that need loss reduction for the distribution network operator to take targeted measures. Under the same structure of the IEEE 33-node distribution network system with 32 additional load branches, through comparative studies of different calculation methods, it is concluded that the method proposed in this paper consumes the least computation time and has the highest analysis efficiency.
Data availability statement
The raw data supporting the conclusions of this article will be made available by the authors, without undue reservation.
Author contributions
XW: Conceptualization, Formal Analysis, Investigation, Methodology, Writing–original draft, Writing–review and editing. WC: Data curation, Methodology, Writing–original draft, Writing–review and editing. RT: Validation, Writing–review and editing, Visualization. YJ: Data curation, Formal Analysis, Writing–review and editing. JZ: Data curation, Methodology, Writing–review and editing.
Funding
The author(s) declare that financial support was received for the research, authorship, and/or publication of this article. This work was supported by the State Grid Shanxi Electric Power Company Science and Technology Project “Research on Distribution Network Transfer Supply Strategy Based on Artificial Intelligence Technology” (Grant No. 5205E0220001).
Conflict of interest
Authors XW, WC, RT, YJ, and JZ were employed by State Grid Jincheng Electric Power Supply Company.
The authors declare that this study received funding from State Grid Shanxi Electric Power Company. The funder had the following involvement in the study: data collection and analysis, and decision to publish.
Publisher’s note
All claims expressed in this article are solely those of the authors and do not necessarily represent those of their affiliated organizations, or those of the publisher, the editors and the reviewers. Any product that may be evaluated in this article, or claim that may be made by its manufacturer, is not guaranteed or endorsed by the publisher.
References
Ahmadi, A., Smith, M. C., Collins, E. R., Dargahi, V., and Jin, S. (2021). Fast Newton-Raphson power flow analysis based on sparse techniques and parallel processing. IEEE Trans. Power Syst. 37 (3), 1695–1705. doi:10.1109/tpwrs.2021.3116182
Bennani, H., Ahmed, C., and El Ouafi, A. (2023). A generic power flow formulation for flexible modeling and fast solving for large-scale unbalanced networks. Int. J. Electr. Power and Energy Syst. 148, 108956. doi:10.1016/j.ijepes.2023.108956
Castaño, A., Fernández-Navarro, F., and Hervás-Martínez, C. (2013). PCA-ELM: a robust and pruned extreme learning machine approach based on principal component analysis. Neural Process. Lett. 37, 377–392. doi:10.1007/s11063-012-9253-x
Guo, Li, Zhang, Y., Li, X., Wang, Z., Liu, Y., Bai, L., et al. (2021). Data-driven power flow calculation method: a lifting dimension linear regression approach. IEEE Trans. Power Syst. 37 (3), 1798–1808. doi:10.1109/tpwrs.2021.3112461
Hu, S., Zou, L., Yu, J. X., Wang, H., and Zhao, D. (2017). Answering natural language questions by subgraph matching over knowledge graphs. IEEE Trans. Knowl. Data Eng. 30 (5), 824–837. doi:10.1109/tkde.2017.2766634
Huang, Y., Sun, Q., Li, Y., Gao, W., and Gao, D. W. (2022). A multi-rate dynamic energy flow analysis method for integrated electricity-gas-heat system with different time-scale. IEEE Trans. Power Deliv. 38 (1), 231–243. doi:10.1109/tpwrd.2022.3186762
Kazemdehdashti, A., Mohammadi, M., and Ali, R. S. (2018). The generalized cross-entropy method in probabilistic optimal power flow. IEEE Trans. Power Syst. 33 (5), 5738–5748. doi:10.1109/tpwrs.2018.2816118
Khazaee, A., Safa, H. H., Ghasempour, M., and Delavari, H. (2017). Distribution loss reduction in residential and commercial pilots by using AMI system. CIRED-Open Access Proc. J. 1, 1711–1714. doi:10.1049/oap-cired.2017.0500
Kocar, I., Mahseredjian, J., Uosef, R., and Cetindag, B. (2016). Simulation of transients in very large scale distribution networks by combining input text files with graphical user interface. Electr. Power Syst. Res. 138, 146–154. doi:10.1016/j.epsr.2016.03.023
Liu, H., Wu, Y., Teng, J., and Xiao, D. (2023). Distribution network power flow calculation based on the BPNN optimized by GA-ADAM. J. Eng. 12 (2023), 12330. doi:10.1049/tje2.12330
Meena, N. K., Yang, J., and Singh, P. (2018). “Backward/forward method for three-phase power flow calculation in low voltage distribution networks with EV charging points,” in 2018 8th IEEE India international conference on power electronics (IICPE), Jaipur, India, 13-15 December 2018 (IEEE).
Nour, A. M. M., Helal, A. A., El-Saadawi, M. M., and Hatata, A. Y. (2023). Voltage imbalance mitigation in an active distribution network using decentralized current control. Prot. Control Mod. Power Syst. 8 (2), 20–17. doi:10.1186/s41601-023-00293-y
Pan, Z., and Jing, Z. (2018). “Modeling methods of big data for power grid based on graph database,” in 2018 international conference on power system technology (POWERCON), Guangzhou, China, 06-08 November 2018 (IEEE), 4340–4348.
Ren, Y., Zhang, L., Wang, H., and Li, M. (2020). “Calculation method of the line loss rate in transformer district based on neural network with optimized input variables,” in 2020 IEEE 3rd student conference on electrical machines and systems (SCEMS), Jinan, China, 04-06 December 2020 (IEEE).
Rodriguez, D., Gomez, D., Alvarez, D., and Rivera, S. (2021). A review of parallel heterogeneous computing algorithms in power systems. Algorithms 14 (10), 275. doi:10.3390/a14100275
Ruan, J., Fan, G., Zhu, Y., Liang, G., Zhao, J., Wen, F., et al. (2023). Super-resolution perception assisted spatiotemporal graph deep learning against false data injection attacks in smart grid. IEEE Trans. Smart Grid 14 (5), 4035–4046. doi:10.1109/tsg.2023.3241268
Ruan, J., Liang, G., Zhao, H., Liu, G., Sun, X., Qiu, J., et al. (2024a). Applying large language models to power systems: potential security threats. IEEE Trans. Smart Grid 15 (3), 3333–3336. doi:10.1109/tsg.2024.3373256
Ruan, J., Wang, Q., Chen, S., Lyu, H., Liang, G., Zhao, J., et al. (2024b). On vulnerability of renewable energy forecasting: adversarial learning attacks. IEEE Trans. Industrial Inf. 20 (3), 3650–3663. doi:10.1109/tii.2023.3313526
Ruan, J., Xu, Z., and Su, H. (2024c). Towards interdisciplinary integration of electrical engineering and earth science. Nat. Rev. Electr. Eng. 1 (5), 278–279. doi:10.1038/s44287-024-00042-9
Ruan, J., Zhu, Y., Cao, Y., Sun, X., Lei, S., Liang, G., et al. (2024d). Privacy-preserving Bi-level optimization of internet data centers for electricity-carbon collaborative demand response. IEEE Internet Things J. 11 (14), 24 948–1024 959. doi:10.1109/jiot.2024.3391762
Wang, Y., Xu, Q., and Zheng, J. (2019). A new on-line power flow calculation method with computation loads separation technique in DC power systems. J. Electr. Eng. and Technol. 14, 1553–1564. doi:10.1007/s42835-019-00198-7
Wu, S., Wang, Q., Chen, Q., Yu, C., and Tang, Y. (2024a). Cyber-physical integrated planning of distribution networks considering spatial-temporal flexible resources. Prot. Control Mod. Power Syst. 9 (3), 142–156. doi:10.23919/pcmp.2023.000316
Wu, X., Yang, W., Zhang, N., Zhou, C., Song, J., and Kang, C. (2024b). A distributed computing algorithm for electricity carbon emission flow and carbon emission intensity. Prot. Control Mod. Power Syst. 9 (2), 138–146. doi:10.23919/pcmp.2023.000379
Yan, W., Ding, C., Ren, Z., and Lee, W. J. (2019). A continuation power flow model of multi-area AC/DC interconnected bulk systems incorporating voltage source converter-based multi-terminal DC networks and its decoupling algorithm. Energies 12 (4), 733. doi:10.3390/en12040733
Yang, M., Tang, A., Yang, H., Peng, J., and Yang, Y. (2022). “Optimization calculation method of transmission line loss with multi-parameter correction,” in 2022 IEEE 6th information technology and mechatronics engineering conference (ITOEC), Chongqing, China, 04-06 March 2022 (IEEE).
Zhang, Y. (2019). Line loss prediction of 10 kV distribution network based on grey correlation analysis and improved neural network. Power Syst. Technol. 43 (4), 1404–1410. doi:10.13335/j.1000-3673.pst.2018.1193
Zhou, Y., Zhang, Y., Zhang, X., Lu, Y., Gao, H., and Jiang, W. (2021). “Research on reliability Evaluation system of distribution network based on Knowledge Graph,” in 2021 IEEE sustainable power and energy conference (iSPEC), Nanjing, China, 23-25 December 2021 (IEEE), 1808–1813.
Keywords: graph model, line loss calculation, hierarchical forward-backward sweep, bulk synchronous parallel computing model, distribution network
Citation: Wang X, Chen W, Tian R, Ji Y and Zhu J (2024) Fast power flow calculation for distribution networks based on graph models and hierarchical forward-backward sweep parallel algorithm. Front. Energy Res. 12:1465900. doi: 10.3389/fenrg.2024.1465900
Received: 17 July 2024; Accepted: 09 August 2024;
Published: 28 August 2024.
Edited by:
Yang Gao, Shanghai Jiao Tong University, ChinaReviewed by:
Zhiyi Chen, RMIT University, AustraliaJiaqi Ruan, Hong Kong Polytechnic University, Hong Kong SAR, China
Jian Zhao, Shanghai University of Electric Power, China
Copyright © 2024 Wang, Chen, Tian, Ji and Zhu. This is an open-access article distributed under the terms of the Creative Commons Attribution License (CC BY). The use, distribution or reproduction in other forums is permitted, provided the original author(s) and the copyright owner(s) are credited and that the original publication in this journal is cited, in accordance with accepted academic practice. No use, distribution or reproduction is permitted which does not comply with these terms.
*Correspondence: Xinrui Wang, MTU4MzU2ODk4MjJAMTYzLmNvbQ==
 Xinrui Wang
 Wengang Chen
 Yuze Ji