- Department of Earth Atmospheric and Planetary Sciences, Massachusetts Institute of Technology, Cambridge, MA, United States
Hydrogen (H2) is considered a promising fuel to contribute to net-zero carbon emission goals. While hydrogen itself is not a greenhouse gas, leakage of hydrogen fuels causes indirect warming due to hydrogen’s influence on methane, tropospheric ozone, and stratospheric water vapor, with the methane term dominating the impact. Some studies consider a simple four-equation box model to explore the climate consequences of leakage from hydrogen fuel use relative to methane, while others have employed much more detailed global photochemical models. Here we use a comprehensive photochemical box model including 66 reactions to show and quantify how the analogous four-equation system is missing a critical OH feedback, leading it to overestimate the time-integrated methane response to a pulse of hydrogen by over 100%. We estimate a hydrogen global warming potential (GWP) relative to carbon dioxide of
1 Introduction
Low-carbon hydrogen has been proposed as a fuel to aid decarbonization (IEA, 2023). Though hydrogen itself is not a greenhouse gas, it is often overlooked that any leakage results in oxidation that affects atmospheric chemistry and climate by influencing three greenhouse gases: methane, ozone, and stratospheric water vapor (Ehhalt et al., 2001; Derwent et al., 2001; Tromp et al., 2003; Schultz et al., 2003; Warwick et al., 2004). About half of hydrogen’s warming effect is due to its influence on methane (Paulot et al., 2021). Hydrogen perturbs methane because it reacts with and thereby reduces the concentration of OH, methane’s dominant sink. Reduction of OH by hydrogen therefore lengthens methane’s lifetime.
The extension of methane’s lifetime via impacts of added pulses of methane itself on OH was first shown in a pioneering paper by Prather (1994), using a simple three-equation system that represents CH4-CO-OH coupling. With this three-equation system, Prather showed for the first time that pulse additions of methane to the atmosphere would affect OH, in turn influencing the apparent lifetime of the pulse. This is because the altered OH also acts upon the methane in the bulk atmosphere, not just the pulse. This principle became fundamental to calculations of the methane global warming potential (Ehhalt et al., 2001). It was later recognized that CO would display similar behavior (Daniel and Solomon, 1998). While CO is not significantly active in the infrared, it indirectly exerts a warming influence through its effects on methane and ozone. The same is true for hydrogen—its greenhouse effect consists of its influence on other radiatively active gases.
With heightened recent interest in hydrogen use and the potential for leakage, this three-equation system has been extended to a four-equation system that represents CH4-H2-CO-OH coupling. This system has been used to represent the methane response to hydrogen leakage for possible future emissions scenarios (Bertagni et al., 2022) and is considered in some studies of hydrogen applications (e.g., Ansell, 2023; O’Rourke et al., 2023; Lakshmanan and Bhati, 2024). This simple model can be used for rapid atmospheric chemistry calculations, but its lack of full chemistry implies that it should be evaluated against a more comprehensive chemical mechanism to understand its limits. Here, we compare the four-equation system for hydrogen to a fairly detailed photochemical 66-reaction system. We show that the four-equation system does not fully capture key chemistry relevant to hydrogen’s impact on methane. We also compare our results to other detailed chemistry calculations in the literature. Next, we calculate global warming potentials for hydrogen, using both CO2 and CH4 as reference gases. We show that the use of methane as the reference gas usefully cancels out some factors that are common to both hydrogen and methane and simplifies the time dependence of the global warming potential. Finally, we calculate critical hydrogen emissions intensities above which the atmospheric methane burden and radiative forcing would increase despite replacing fossil fuels with hydrogen.
2 Methods
2.1 Simple three-equation and four-equation systems
Prather (1994) presented a simple three-equation system to demonstrate that methane perturbations always decay more slowly than methane’s lifetime in the bulk atmosphere. The classic three-equation system considers the following chemical reactions:
where
where
The time-dependent mass balance equations for each species are:
We include soil and stratospheric sinks as first-order loss terms
2.2 Photochemical box model
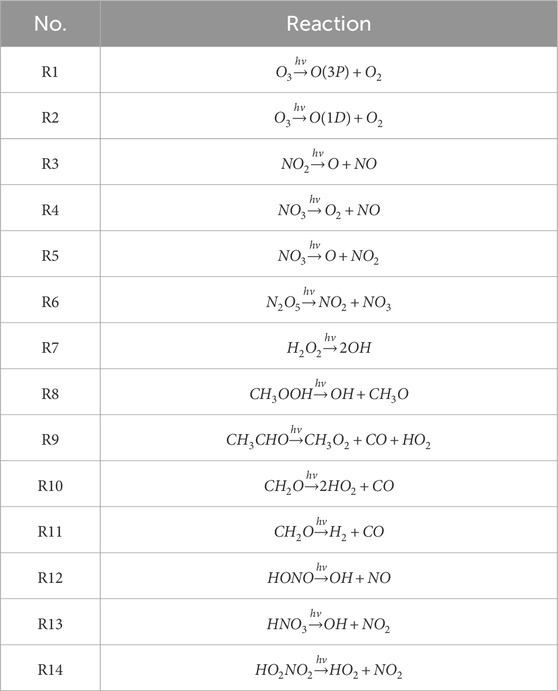
Our zero-dimensional photochemical box model uses a chemical mechanism adapted from Daniel and Solomon (1998). Photodissociation reactions are shown in Table 2. Photolysis rates are calculated using the Tropospheric Ultraviolet Visible radiative transfer model (TUV 5.4; Madronich, 1987; Madronich and Weller, 1990) using the two-stream pseudo-spherical option. We calculate the full annual cycle of photodissociation rates at an altitude of 3 km, at a latitude of 15°N, with cloud optical thickness of 9, and with a total ozone column of 250 DU. Our parameters reflect typical conditions in the tropics, the location where the bulk of CH4 oxidation occurs (Liang et al., 2017).
The chemical reactions considered are shown in Table 3. We calculate rates following Jet Propulsion Laboratory (JPL) 2019 recommendations (Burkholder et al., 2019) at a pressure of 800 mbar and a temperature of 272 K. This temperature was chosen as a suitable representative temperature for OH oxidation of methane following Spivakovsky et al. (2000).
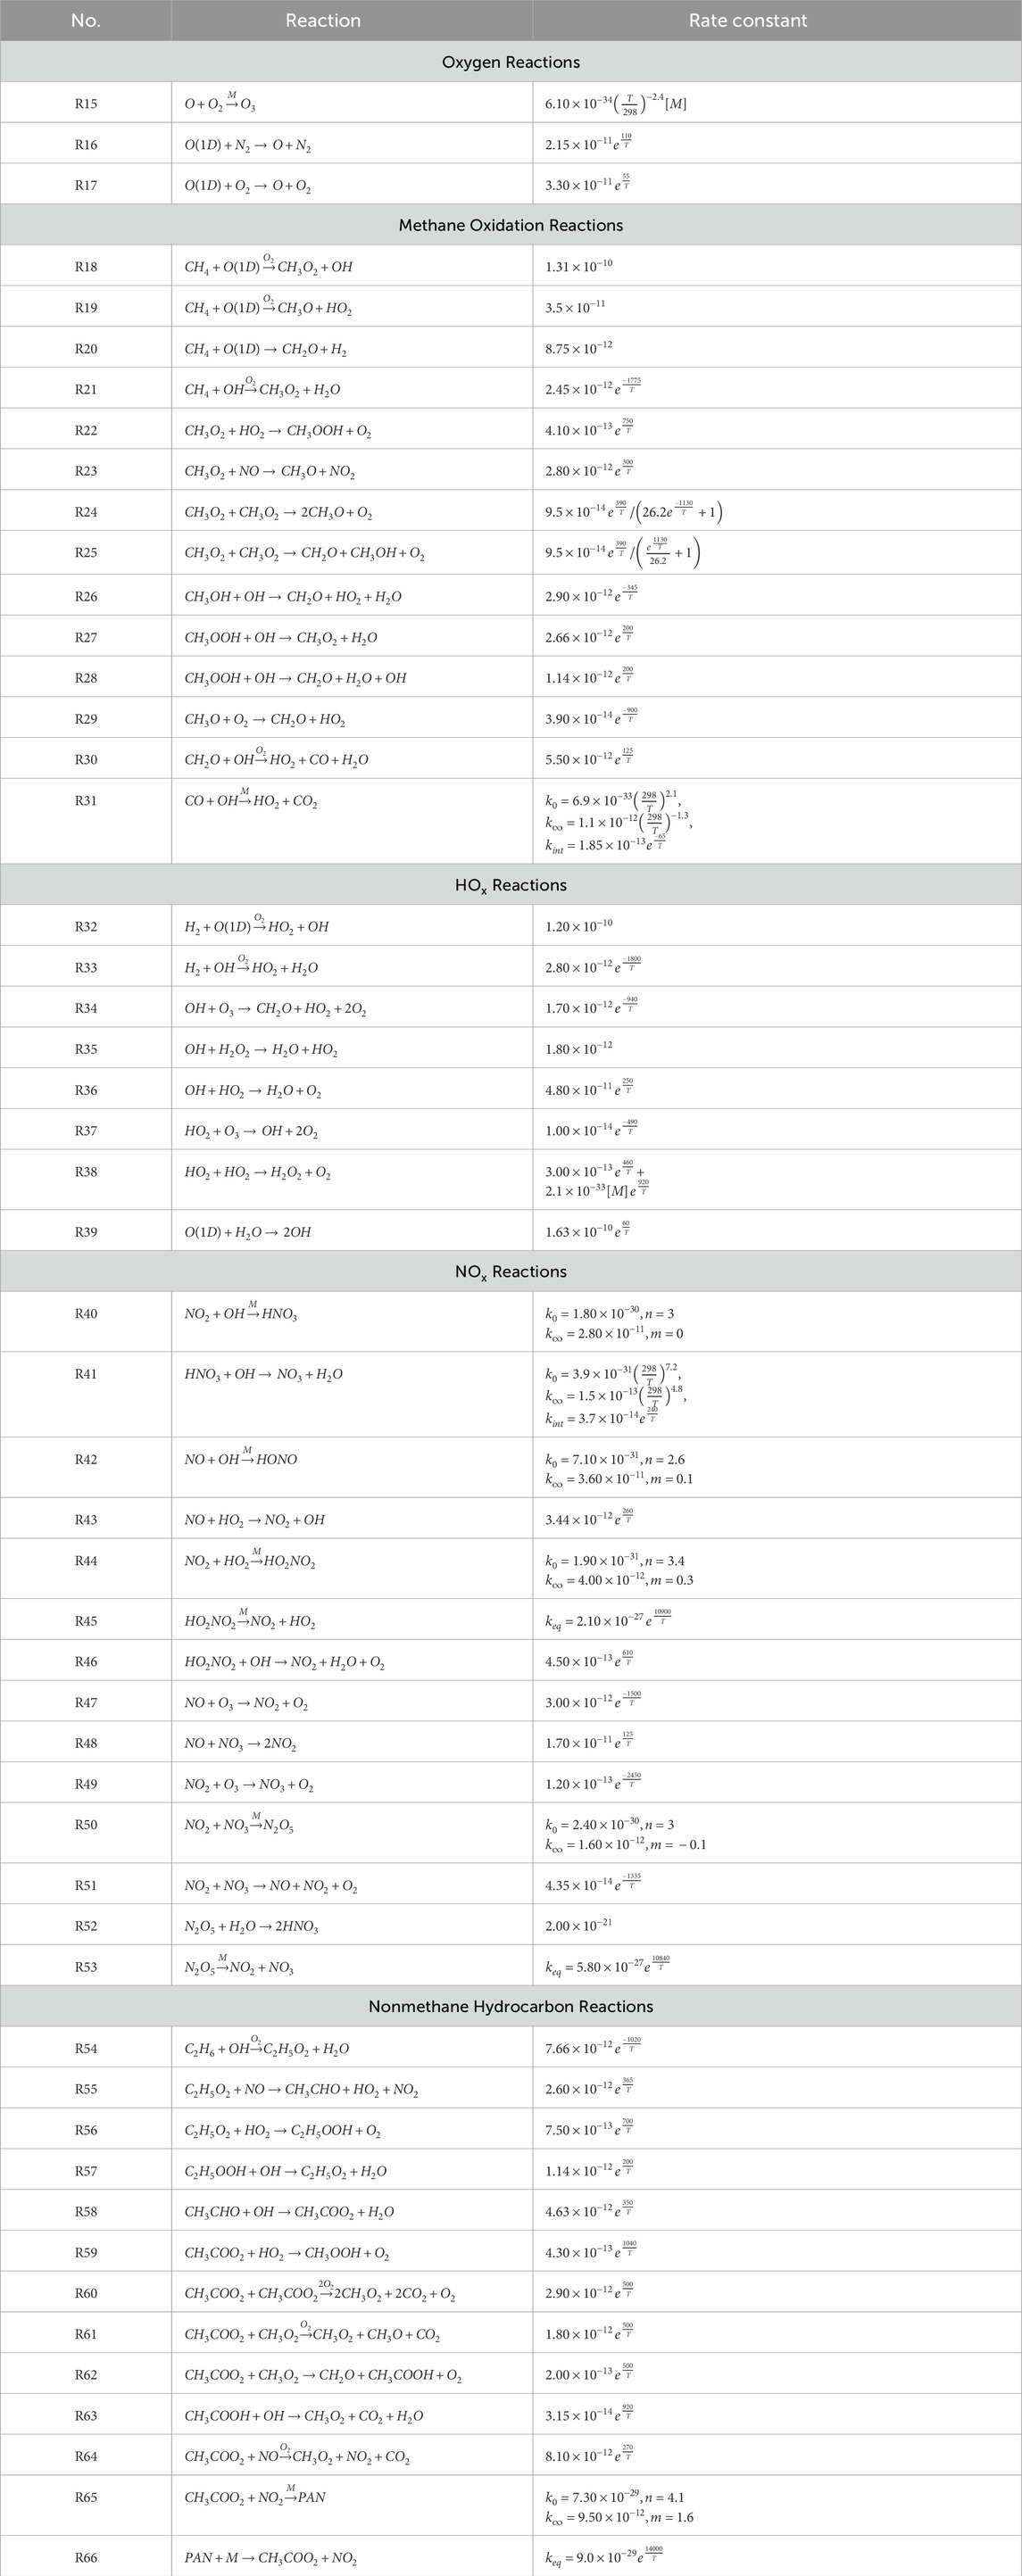
Table 3. Chemical Reactions. Rate constants and branching ratios follow JPL recommendations (Burkholder et al., 2019).
Nonmethane hydrocarbon chemistry is approximated by the chemistry of ethane (Table 3). Direct emission of ethane is set to yield a concentration (∼30 ppb) that leads to a fractional CO production by nonmethane hydrocarbons consistent with model estimates (Holloway et al., 2000). Direct emission of CH4, CO, NO, and H2 are set to values which lead to typical clean tropospheric concentrations (Table 4).
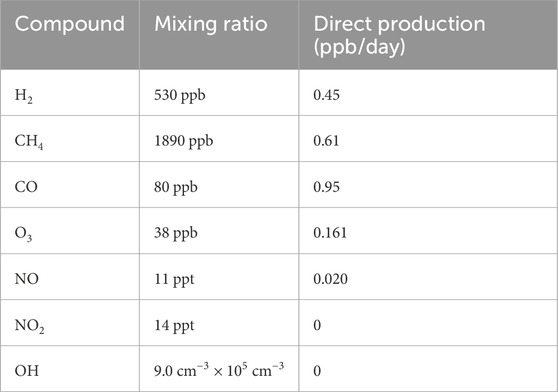
Table 4. Photochemical box model steady-state noontime mixing ratios of select compounds and their production rates.
The model setup produces an amount of OH that leads to a methane tropospheric photochemical lifetime of 9.7 years and a total methane lifetime of 8.5 years, in general agreement with Szopa et al. (2021). We use the same soil and stratospheric loss rates for CH4 and CO, and the same soil loss rate for H2 as in the four-equation system described in Section 2.1. Stratospheric loss of H2 is negligibly slow (Xiao et al., 2007) and is not included. Wet deposition is simulated by prescribing first-order loss rates of 0.25 days−1 for CH2O, C2H5OOH, CH3OOH, HNO3, H2O2, and HONO.
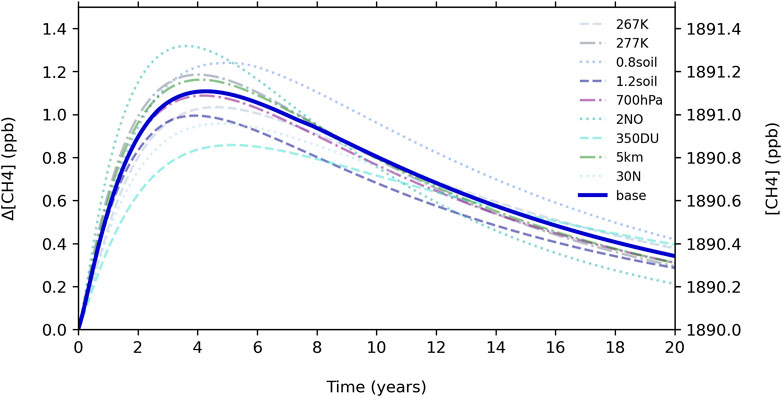
We solve the resulting set of differential equations representing photodissociation reactions, chemical reactions, direct emission, and wet and dry deposition using the Newton-Raphson method with fixed 20-min time steps (Brasseur and Solomon, 2005). We discuss sensitivity of our results to temperature, pressure, column ozone, latitude, altitude, NO emission, and strength of the H2 soil sink in the following section.
3 Results
3.1 Methane response difference
Figure 1 shows the difference in methane response between the four-equation system and our full chemical mechanism for a 53 ppb H2 pulse, about 10% of the typical steady-state H2 burden. The four-equation system methane perturbation peaks at about 1.9 ppb, and the fuller mechanism methane perturbation peaks at about 1.1 ppb. Using a tropospheric total mass of 4.22 Tg × 109 Tg to convert from mixing ratio to mass (Trenberth and Smith, 2005), the four-equation system peaks at 120 ppt CH4 per Tg H2, and our fuller mechanism peaks at 71 ppt CH4 per Tg H2. Other studies which performed transient H2 simulations using comprehensive chemistry schemes found peak methane perturbations of 80 ppt CH4 per Tg H2 (Derwent et al., 2020) and 27 ppt per Tg H2 (Field and Derwent, 2021). The transient behavior of methane due to a hydrogen pulse in our photochemical box model lies between these two previous results, while the four-equation system lies substantially higher.
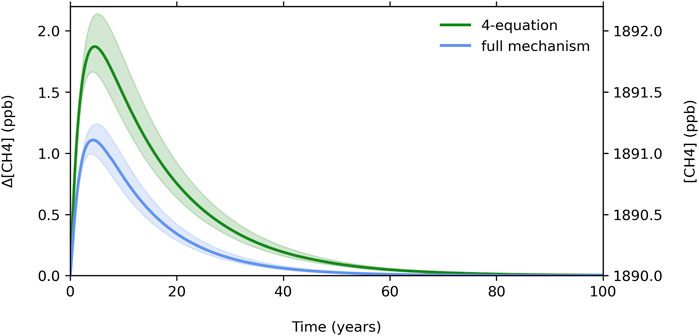
Figure 1. Methane response for the four-equation system and our full chemical mechanism. Shading represents the adopted uncertainty in the strength of the H2 soil sink (±20%) as an example but does not represent the full uncertainty, probed in more detail in Figure 2.
Relative to our fuller mechanism, the four-equation system overestimates the peak methane perturbation in response to the pulse by about 85%, and the time-integrated methane response by over 100% (123%). The four-equation system overestimates the CH4 perturbation because it uses a constant value for the source of OH, SOH, throughout the time integration (see four-equation system defined in Section 2.1). This misses key OH production feedbacks; in effect, CH4 oxidation over the time of integration affects OH production. For example, in the presence of sufficient NO (e.g., polluted Northern Hemisphere), CH3 radical oxidation produces more than one HO2:
The resulting HO2 radicals can cycle back to OH by reacting with NO or O3, or by self-reacting to form H2O2 which can then photodissociate to produce two OH radicals. To a lesser degree, additional ozone produced from the H2 and CH4 perturbations also contributes to increased OH production. These OH feedbacks have been documented extensively in previous work (Lu and Khalil, 1993; Daniel and Solomon, 1998; Taraborrelli et al., 2012; Voulgarakis et al., 2013; Holmes, 2018; Lelieveld et al., 2016).
Figure 2 shows the results of sensitivity tests of the following model parameters: temperature (±5 K), strength of the H2 soil sink (±20%), doubling NO direct emission, increasing total column O3 to 350 DU, decreasing pressure to 700 h Pa, and increasing the altitude (5 km) and latitude (30°N) at which photodissociation rates are calculated, broadly covering regions where nearly all OH oxidation of methane occurs, as discussed in Liang et al. (2017) and Spivakovsky et al. (2000).
As a check on OH in our model, we calculate the lifetime of methyl chloroform using the rate constant for loss against OH from JPL recommendations (Burkholder et al., 2019) and prescribing a lifetime against stratospheric loss of 40 years so that about 10% of methyl chloroform is lost in the stratosphere (Patra et al., 2021). The resulting lifetime of methyl chloroform in our model is 5.0 years, and the average OH concentration is 9.0 × 10⁵ radicals cm−3. From observations, global methyl chloroform lifetimes have been estimated to be 4.8 ± 0.3 years (Prinn et al., 1995), 4.5 ± 0.1 years (Krol et al., 1998), and
Another useful metric to consider is the methane feedback factor (Wild and Prather, 2000). Following the formulation from Fiore et al. (2009), the methane feedback factor f is defined as
with the sensitivity coefficient s defined as
where
3.2 Global warming potential of hydrogen compared to two different reference gases, CO2 and CH4
The global warming potential (GWP) of H2 is the time-integrated radiative forcing indirectly induced by a H2 pulse relative to the time-integrated radiative forcing due to a pulse of an equivalent mass of reference gas over a chosen time horizon H. The GWP of H2 relative to CO2 is defined as:
The absolute global warming potential (AGWP) of H2 is the sum of integrated effective radiative forcing (ERF) components due to methane, tropospheric ozone, and stratospheric water vapor.
We additionally calculate the GWP relative to CH4 as a reference gas:
We use the IPCC formulation for the AGWP of CO2:
where
In our model, we directly calculate the AGWP of the CH4 term from a 53 ppb pulse of H2 as:
where
To include the GWP components due to ozone and stratospheric water vapor induced by a hydrogen pulse, we use the formulation from Warwick et al. (2022) which parametrizes the ozone and stratospheric water vapor responses due to hydrogen from the UKESM1 model. This formulation is also described in detail and applied by Ocko and Hamburg (2022) in their assessment of the time dependence of hydrogen warming impacts for various emissions scenarios. Relative to CO2, this amounts to GWP contributions due to ozone and stratospheric water vapor of about 24% and 30% of the total 100-year GWP (with the rest being the methane term discussed above). The time-dependent GWP of H2 relative to CO2 is shown in Figure 3A.
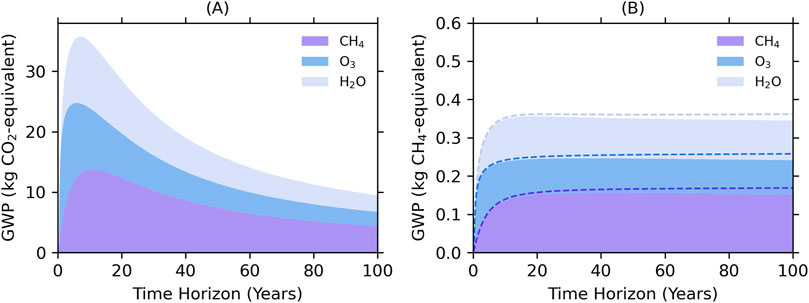
Figure 3. The global warming potential of H2 relative (A) to CO2 and (B) to CH4 from fossil sources (solid) and CH4 from non-fossil sources (dashed). The CH4 component accounts only for the radiative effect of CH4. The O3 and H2O components account for the indirect effects from both H2 and CH4.
To obtain the GWP of H2 relative to CH4, the AGWP of H2 is the same as in the CO2 calculation, and the AGWP of CH4 is calculated from a 38 ppb pulse of CH4, about 2% of the typical steady-state CH4 burden, using the same
Figure 3B shows the GWP of H2 relative to CO2 and CH4 from fossil and non-fossil sources. The advantages of considering H2 GWP relative to CH4 are that it cancels out the uncertainty due to potential CH4 lifetime errors as well as errors in its radiative properties, and plateaus after about 15 years. The direct comparison of H2 to fossil CH4 should be helpful when considering the tradeoffs of using hydrogen in place of methane for fuel.
Our estimate for the H2 GWP relative to CO2 is
The error in our GWP estimates includes the full range of uncertainty due to the sensitivity cases we presented in Figure 2 and uncertainty due to radiative properties of CH4, CO2, H2O, and O3 at the 90% confidence level (Forster et al., 2021). For GWPs relative to CH4, the range includes uncertainty due to atmospheric CO2 production and loss for fossil and non-fossil CH4 (Forster et al., 2021). The GWPs broken down by component are shown in Table 5.

Table 5. Global warming potentials at the 20- and 100-year time horizons and their uncertainty due to the sensitivity cases presented in Figure 2 and CO2 and CH4 radiative efficiencies. The CH4 component only includes direct radiative effects due to CH4. The O3 and H2O components include contributions from both H2 and CH4.
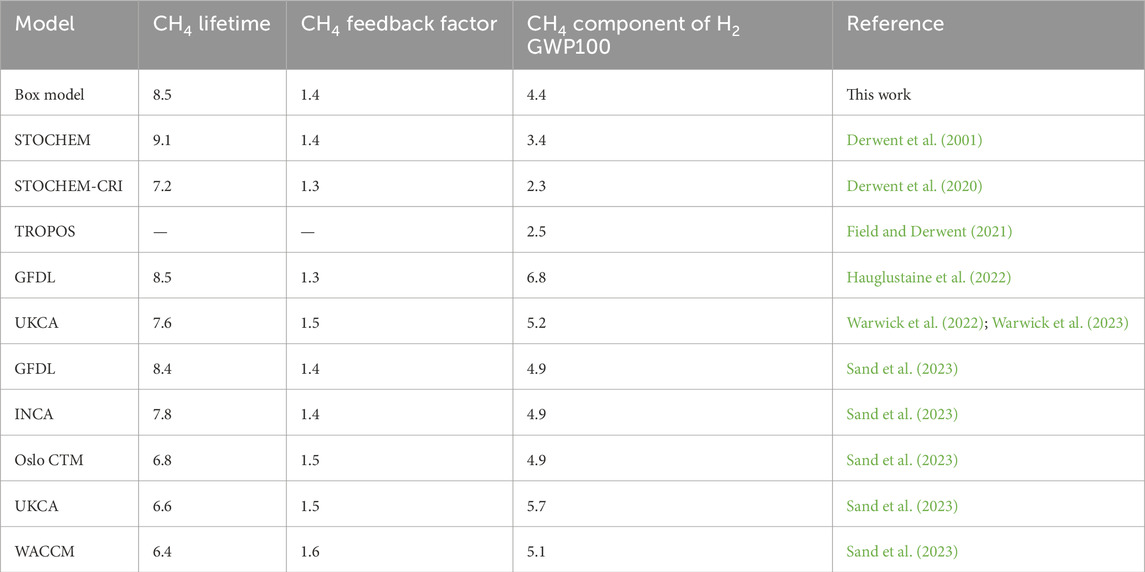
Estimates for the CH4 component of H2 GWP100 relative to CO2 in global models range from 2.3 to 6.8 (Table 6). Our estimate for the CH4 component of GWP100 relative to CO2 is 4.4, in good agreement with the literature range. Compared with global models, a potential limitation of our photochemical box model is its lack of spatial resolution. Hydrogen’s main loss is through a soil sink that is mostly active in the Northern Hemisphere and displays high latitudinal variance (Paulot et al., 2024). This paper does not address whether hydrogen’s globally averaged GWP is affected by the distribution of loss to soils. Despite these limits, the simple box model is useful to understand how variations in model parameters can affect the calculated hydrogen GWP.
Table 7 shows the CH4 component of H2 GWP100 as calculated from the sensitivity cases shown in Figure 2. Box model configurations with shorter methane lifetimes tend to have smaller methane components of GWP100, with the high and low hydrogen soil sink cases as exceptions. Across results from global models, higher methane feedback factors generally correspond with larger methane components of GWP100; our results for the methane component of the GWP lie on the low end among modelling groups shown in Table 6 (see also Supplementary Figure S1).
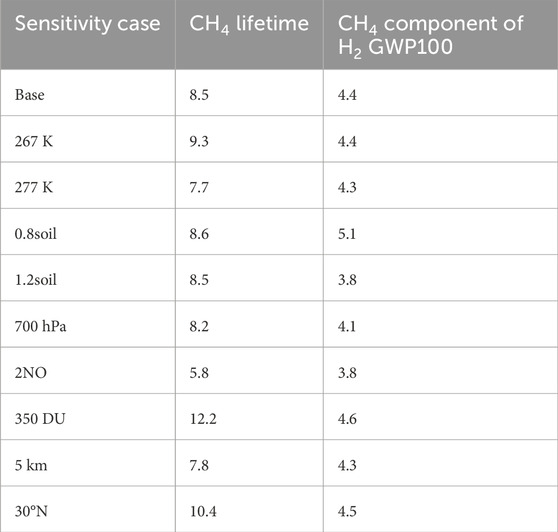
Table 7. Comparison of global warming potentials across sensitivity cases in the photochemical box model.
3.3 Critical hydrogen emission intensity for methane mitigation and climate benefits
Using the four-equation system to model different hydrogen fuel implementation scenarios, Bertagni et al. (2022) calculated critical hydrogen emission intensities: the hydrogen leakage rate thresholds above which the atmospheric methane burden would increase despite replacing fossil fuels with hydrogen. If hydrogen leakage rates exceed these critical hydrogen emission intensities, this means there is no CH4 mitigation from hydrogen fuel use.
Here, we carry out such estimates using the chemical response from our photochemical box model. We follow the same methodology described by Bertagni et al. (2022) to calculate the critical hydrogen emission intensities for 500 Tg per year of green and blue hydrogen production scenarios. The energy from this amount of hydrogen is about 15% of current global fossil fuel energy (Bertagni et al., 2022). In addition to calculating critical hydrogen emission intensities required for methane mitigation, as done by Bertagni et al. (2022), we also calculate critical hydrogen emission intensities for lowering radiative forcing. The first calculation weighs only the atmospheric methane response to the changed hydrogen and methane emissions across scenarios, while the second calculation weighs the GWP tradeoff. Calculating hydrogen leakage rate thresholds weighted by GWP provides a more complete picture of the climate impacts of hydrogen fuel implementation. Critical hydrogen emission intensities are lower when weighing by GWP rather than by change in methane burden because the GWP includes warming impacts from tropospheric ozone and stratospheric water vapor in addition to methane.
Figure 4 shows the critical hydrogen emission intensities for hydrogen scenarios for a range of methane leakage rates during hydrogen production (0% methane emission intensity is green hydrogen, while the rest are blue hydrogen scenarios). For methane mitigation, Bertagni et al. (2022) found critical hydrogen emissions intensities of 9% for green hydrogen, 7% for blue hydrogen with 0.2% methane leakage, 4.5% for blue hydrogen with 0.5% methane leakage, and close to 0% for blue hydrogen with 1% methane leakage. For the same scenarios, we calculate critical hydrogen emissions intensities of 13%, 11%, 7%, and 2%, respectively—i.e., critical hydrogen emissions intensities are larger by about 50% for the more comprehensive chemistry as compared to the four-equation system (see, e.g., the differences in methane response calculated in Figure 1). For these scenarios with respect to global warming potential rather than methane mitigation, the critical hydrogen emissions intensities are 8%, 7%, 5%, and 1%, respectively. The hydrogen emission intensities, weighing either by methane mitigation or global warming potential, cross zero at a methane leakage rate of about 1.2%; blue hydrogen with that leakage rate or greater would not diminish methane burden or global warming.
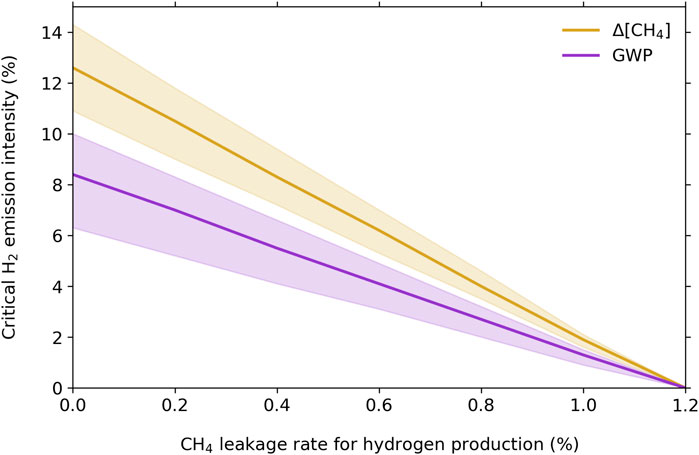
Figure 4. Critical hydrogen emissions intensities for green and blue hydrogen scenarios, weighted by methane mitigation (orange) and global warming potential (purple). A methane leakage rate of 0% corresponds to green hydrogen, while all non-zero methane leakage rates correspond to different blue hydrogen scenarios. Shading indicates the uncertainty from the range of sensitivity cases shown in Figure 2 and, for the GWP-weighted emissions intensities, the adopted radiative uncertainties from the GWP calculations as described in Section 3.2.
4 Discussion and conclusion
We have shown that the four-equation system is not suitable for projecting atmospheric composition responses to adjusting H2 and CH4 emissions because it cannot account for shifting chemical regimes that follow significant perturbations from its original steady-state values. In particular, chemical feedbacks in response to the hydrogen pulse amplify the production of OH which in turn affects methane. The methane effect dominates hydrogen’s global warming impact and is not captured in the four-equation system. A model with a more comprehensive chemical mechanism is therefore necessary to accurately quantify the full atmospheric responses to H2 and the resulting global warming impact.
We have also calculated global warming potentials for hydrogen from our photochemical box model relative to CO2 and CH4. To our knowledge, this is the first presentation of H2 GWP relative to CH4 as the reference gas. Reporting H2 GWP relative to CH4 is a convenient way reduce error in the GWP estimate. It also readily provides a simple non-time dependent fraction to weigh the potential climate impacts of hydrogen fuel as a replacement for methane (depending on assumed leakage rates of each). Further, we calculated critical hydrogen emissions intensities for green and blue hydrogen scenarios, considering emission thresholds for both methane mitigation as well as decreasing radiative forcing. We find that critical hydrogen emissions intensities above which the atmospheric methane burden would increase despite replacing fossil fuels with hydrogen are larger by about 50% for the more comprehensive chemistry used here as compared to the four-equation system. We also find that the hydrogen emission intensities (weighing either by methane mitigation or global warming potential), cross zero at a methane leakage rate of about 1.2%; exceeding that methane leakage rate in blue hydrogen production would mean replacing fossil fuels with hydrogen would increase the atmospheric methane burden and global warming.
Hydrogen’s non-negligible global warming potential means that hydrogen fuel infrastructure must minimize leakages to limit the warming consequences. The same is true for natural gas infrastructure and methane leakage—hydrogen is a similar but smaller climate threat, about 35% as potent on a per-mass basis compared to fossil methane by our GWP estimate.
The policy goal of net-zero carbon emissions by 2050 (European Commission, 2019; U.S. Dept. of State, 2021) imposes limitations on how much hydrogen leakage is tolerable. If used nearly leak-free, hydrogen is an excellent option; otherwise, hydrogen should only be a temporary step in the energy transition or must be used in tandem with carbon removal to counter its warming effects.
Data availability statement
The original contributions presented in the study are publicly available. This data can be found here: The code used for this study can be found at https://doi.org/10.5281/zenodo.12709781.
Author contributions
CC: Formal Analysis, Investigation, Methodology, Visualization, Writing–original draft, Writing–review and editing. SS: Conceptualization, Funding acquisition, Investigation, Methodology, Supervision, Writing–review and editing. KS: Funding acquisition, Software, Writing–review and editing.
Funding
The authors declare that financial support was received for the research, authorship, and/or publication of this article. The authors gratefully acknowledge funding from the MIT Energy Initiative (MITEI), grant 2565489.
Conflict of interest
The authors declare that the research was conducted in the absence of any commercial or financial relationships that could be construed as a potential conflict of interest.
Publisher’s note
All claims expressed in this article are solely those of the authors and do not necessarily represent those of their affiliated organizations, or those of the publisher, the editors and the reviewers. Any product that may be evaluated in this article, or claim that may be made by its manufacturer, is not guaranteed or endorsed by the publisher.
Supplementary material
The Supplementary Material for this article can be found online at: https://www.frontiersin.org/articles/10.3389/fenrg.2024.1463450/full#supplementary-material
References
Ansell, P. J. (2023). Review of sustainable energy carriers for aviation: benefits, challenges, and future viability. Prog. Aerosp. Sci. 141, 100919. doi:10.1016/j.paerosci.2023.100919
Bertagni, M. B., Pacala, S. W., Paulot, F., and Porporato, A. (2022). Risk of the hydrogen economy for atmospheric methane. Nat. Commun. 13 (1), 7706. doi:10.1038/s41467-022-35419-7
Brasseur, G., and Solomon, S. (2005). Aeronomy of the middle atmosphere: chemistry and physics of the stratosphere and mesosphere. 3rd edn. Springer, 269–271.
Burkholder, J. B., Sander, S. P., Abbatt, J., Barker, J. R., Cappa, C., Crounse, J. D., et al. (2019). Chemical kinetics and photochemical data for use in atmospheric studies, evaluation No. 19. JPL publication 19-5. Pasadena: Jet Propulsion Laboratory.
Daniel, J. S., and Solomon, S. (1998). On the climate forcing of carbon monoxide. J. Geophys. Res. Atmos. 103 (D11), 13249–13260. doi:10.1029/98jd00822
Derwent, R. G., Collins, W. J., Johnson, C. E., and Stevenson, D. S. (2001). Transient behaviour of tropospheric ozone precursors in a global 3-D CTM and their indirect greenhouse effects. Clim. Change 49, 463–487. doi:10.1023/a:1010648913655
Derwent, R. G., Stevenson, D. S., Utembe, S. R., Jenkin, M. E., Khan, A. H., and Shallcross, D. E. (2020). Global modelling studies of hydrogen and its isotopomers using STOCHEM-CRI: likely radiative forcing consequences of a future hydrogen economy. Int. J. Hydrogen Energy 45 (15), 9211–9221. doi:10.1016/j.ijhydene.2020.01.125
Ehhalt, D., Prather, M., Dentener, F., Derwent, R., Dlugokencky, E., Holland, E., et al. (2001). “Atmospheric chemistry and greenhouse gases,” in Climate change 2001: the scientific basis, Intergovernmental panel on climate change. Editors J. T. Houghton, Y. Ding, D. J. Griggs, M. Noguer, P. J. van der Linden, X. Daiet al. (Cambridge, United Kingdom and New York, NY, USA: Cambridge University Press).
European Commission (2019). The European green deal: annex to the communication from the commission to the European parliament, the European council, the council, the European economic and social committee and the committee of the regions. Brussels.
Field, R. A., and Derwent, R. G. (2021). Global warming consequences of replacing natural gas with hydrogen in the domestic energy sectors of future low-carbon economies in the United Kingdom and the United States of America. Int. J. Hydrogen Energy 46 (58), 30190–30203. doi:10.1016/j.ijhydene.2021.06.120
Fiore, A. M., Dentener, F. J., Wild, O., Cuvelier, C., Schultz, M. G., Hess, P., et al. (2009). Multimodel estimates of intercontinental source-receptor relationships for ozone pollution. J. Geophys. Res. Atmos. 114 (D4). doi:10.1029/2008jd010816
Forster, P., Storelvmo, T., Armour, K., Collins, W., Dufresne, J.-L., Frame, D., et al. (2021). “The earth’s energy budget, climate feedbacks, and climate sensitivity,” in Climate change 2021: the physical science basis. Contribution of working group I to the Sixth assessment Report of the intergovernmental panel on climate change. Editors V. Masson-Delmotte, P. Zhai, A. Pirani, S. L. Connors, C. Péan, S. Bergeret al. (Cambridge, United Kingdom and New York, NY, USA: Cambridge University Press), 923–1054.
Hauglustaine, D., Paulot, F., Collins, W., Derwent, R., Sand, M., and Boucher, O. (2022). Climate benefit of a future hydrogen economy. Commun. Earth and Environ. 3 (1), 295. doi:10.1038/s43247-022-00626-z
Holloway, T., Levy, H., and Kasibhatla, P. (2000). Global distribution of carbon monoxide. J. Geophys. Res. Atmos. 105 (D10), 12123–12147. doi:10.1029/1999jd901173
Holmes, C. D. (2018). Methane feedback on atmospheric chemistry: methods, models, and mechanisms. J. Adv. Model. Earth Syst. 10 (4), 1087–1099. doi:10.1002/2017ms001196
Holmes, C. D., Prather, M. J., Søvde, O. A., and Myhre, G. (2013). Future methane, hydroxyl, and their uncertainties: key climate and emission parameters for future predictions. Atmos. Chem. Phys. 13 (1), 285–302. doi:10.5194/acp-13-285-2013
Krol, M., van Leeuwen, P. J., and Lelieveld, J. (1998). Global OH trend inferred from methyl chloroform measurements. J. Geophys. Res. Atmos. 103 (D9), 10697–10711. doi:10.1029/98jd00459
Lakshmanan, S., and Bhati, M. (2024). Unravelling the atmospheric and climate implications of hydrogen leakage. Int. J. Hydrogen Energy 53, 807–815. doi:10.1016/j.ijhydene.2023.12.010
Lelieveld, J., Gromov, S., Pozzer, A., and Taraborrelli, D. (2016). Global tropospheric hydroxyl distribution, budget and reactivity. Atmos. Chem. Phys. 16 (19), 12477–12493. doi:10.5194/acp-16-12477-2016
Liang, Q., Chipperfield, M. P., Fleming, E. L., Abraham, N. L., Braesicke, P., Burkholder, J. B., et al. (2017). Deriving global OH abundance and atmospheric lifetimes for long-lived gases: a search for CH3CCl3 alternatives. J. Geophys. Res. Atmos. 122 (21), 11–914. doi:10.1002/2017jd026926
Lu, Y., and Khalil, M. A. K. (1993). Methane and carbon monoxide in OH chemistry: the effects of feedbacks and reservoirs generated by the reactive products. Chemosphere 26 (1-4), 641–655. doi:10.1016/0045-6535(93)90450-j
Madronich, S. (1987). Photodissociation in the atmosphere: 1. Actinic flux and the effects of ground reflections and clouds. J. Geophys. Res. Atmos. 92 (D8), 9740–9752. doi:10.1029/jd092id08p09740
Madronich, S., and Weller, G. (1990). Numerical integration errors in calculated tropospheric photodissociation rate coefficients. J. Atmos. Chem. 10, 289–300. doi:10.1007/bf00053864
Montzka, S. A., Spivakovsky, C. M., Butler, J. H., Elkins, J. W., Lock, L. T., and Mondeel, D. J. (2000). New observational constraints for atmospheric hydroxyl on global and hemispheric scales. Science 288 (5465), 500–503. doi:10.1126/science.288.5465.500
Myhre, G., Shindell, D., Bréon, F.-M., Collins, W., Fuglestvedt, J., Huang, J., et al. (2013). “Anthropogenic and natural radiative forcing,” in Climate change 2013: the physical science basis. Contribution of working group I to the fifth assessment Report of the intergovernmental panel on climate change. Editors T. F. Stocker, D. Qin, G.-K. Plattner, M. Tignor, S. K. Allen, J. Boschunget al. (Cambridge, United Kingdom and New York, NY, USA: Cambridge University Press).
Ocko, I. B., and Hamburg, S. P. (2022). Climate consequences of hydrogen emissions. Atmos. Chem. Phys. 22 (14), 9349–9368. doi:10.5194/acp-22-9349-2022
O’Rourke, P., Mignone, B. K., Kyle, P., Chapman, B. R., Fuhrman, J., Wolfram, P., et al. (2023). Supply and demand drivers of global hydrogen deployment in the transition toward a decarbonized energy system. Environ. Sci. and Technol. 57 (48), 19508–19518. doi:10.1021/acs.est.3c03751
Patra, P. K., Krol, M. C., Prinn, R. G., Takigawa, M., Mühle, J., Montzka, S. A., et al. (2021). Methyl chloroform continues to constrain the hydroxyl (OH) variability in the troposphere. J. Geophys. Res. Atmos. 126 (4), e2020JD033862. doi:10.1029/2020jd033862
Paulot, F., Paynter, D., Naik, V., Malyshev, S., Menzel, R., and Horowitz, L. W. (2021). Global modeling of hydrogen using GFDL-AM4. 1: sensitivity of soil removal and radiative forcing. Int. J. Hydrogen Energy 46 (24), 13446–13460. doi:10.1016/j.ijhydene.2021.01.088
Paulot, F., Pétron, G., Crotwell, A. M., and Bertagni, M. B. (2024). Reanalysis of NOAA H2 observations: implications for the H2 budget. Atmos. Chem. Phys. 24 (7), 4217–4229. doi:10.5194/acp-24-4217-2024
Prather, M. J. (1994). Lifetimes and eigenstates in atmospheric chemistry. Geophys. Res. Lett. 21 (9), 801–804. doi:10.1029/94gl00840
Prinn, R. G., Weiss, R. F., Miller, B. R., Huang, J., Alyea, F. N., Cunnold, D. M., et al. (1995). Atmospheric trends and lifetime of CH3CCl3 and global OH concentrations. Science 269 (5221), 187–192. doi:10.1126/science.269.5221.187
Sand, M., Skeie, R. B., Sandstad, M., Krishnan, S., Myhre, G., Bryant, H., et al. (2023). A multi-model assessment of the Global Warming Potential of hydrogen. Commun. Earth and Environ. 4 (1), 203. doi:10.1038/s43247-023-00857-8
Schultz, M. G., Diehl, T., Brasseur, G. P., and Zittel, W. (2003). Air pollution and climate-forcing impacts of a global hydrogen economy. Science 302 (5645), 624–627. doi:10.1126/science.1089527
Spivakovsky, C. M., Logan, J. A., Montzka, S. A., Balkanski, Y. J., Foreman-Fowler, M., Jones, D. B. A., et al. (2000). Three-dimensional climatological distribution of tropospheric OH: update and evaluation. J. Geophys. Res. Atmos. 105 (D7), 8931–8980. doi:10.1029/1999jd901006
Stevenson, D. S., Young, P. J., Naik, V., Lamarque, J. F., Shindell, D. T., Voulgarakis, A., et al. (2013). Tropospheric ozone changes, radiative forcing and attribution to emissions in the atmospheric chemistry and climate model intercomparison project (ACCMIP). Atmos. Chem. Phys. 13 (6), 3063–3085. doi:10.5194/acp-13-3063-2013
Szopa, S., Naik, V., Adhikary, B., Artaxo, P., Berntsen, T., Collins, W. D., et al. (2021). “Short-Lived climate forcers,” in Climate change 2021: the physical science basis. Contribution of working group I to the Sixth assessment Report of the intergovernmental panel on climate change. Editors V. Masson-Delmotte, P. Zhai, A. Pirani, S. L. Connors, C. Péan, S. Bergeret al. (Cambridge, United Kingdom and New York, NY, USA: Cambridge University Press), 817–922.
Taraborrelli, D., Lawrence, M. G., Crowley, J. N., Dillon, T. J., Gromov, S., Groß, C. B., et al. (2012). Hydroxyl radical buffered by isoprene oxidation over tropical forests. Nat. Geosci. 5 (3), 190–193. doi:10.1038/ngeo1405
Thornhill, G. D., Collins, W. J., Kramer, R. J., Olivié, D., Skeie, R. B., O'Connor, F. M., et al. (2021). Effective radiative forcing from emissions of reactive gases and aerosols–a multi-model comparison. Atmos. Chem. Phys. 21 (2), 853–874. doi:10.5194/acp-21-853-2021
Trenberth, K. E., and Smith, L. (2005). The mass of the atmosphere: a constraint on global analyses. J. Clim. 18 (6), 864–875. doi:10.1175/jcli-3299.1
Tromp, T. K., Shia, R. L., Allen, M., Eiler, J. M., and Yung, Y. L. (2003). Potential environmental impact of a hydrogen economy on the stratosphere. Science 300 (5626), 1740–1742. doi:10.1126/science.1085169
United States Department of State; United States Executive Office of the President (2021). The long-term strategy of the United States: pathways to net-zero greenhouse gas emissions by 2050. Washington, DC: United States Department of State; United States Executive Office of the President.
Voulgarakis, A., Naik, V., Lamarque, J. F., Shindell, D. T., Young, P. J., Prather, M. J., et al. (2013). Analysis of present day and future OH and methane lifetime in the ACCMIP simulations. Atmos. Chem. Phys. 13 (5), 2563–2587. doi:10.5194/acp-13-2563-2013
Warwick, N., Griffiths, P., Keeble, J., Archibald, A., Pyle, J., and Shine, K. (2022). Atmospheric implications of increased hydrogen use. Policy Pap.
Warwick, N. J., Archibald, A. T., Griffiths, P. T., Keeble, J., O'Connor, F. M., Pyle, J. A., et al. (2023). Atmospheric composition and climate impacts of a future hydrogen economy. Atmos. Chem. Phys. 23 (20), 13451–13467. doi:10.5194/acp-23-13451-2023
Warwick, N. J., Bekki, S., Nisbet, E. G., and Pyle, J. A. (2004). Impact of a hydrogen economy on the stratosphere and troposphere studied in a 2-D model. Geophys. Res. Lett. 31 (5). doi:10.1029/2003gl019224
Wild, O., and Prather, M. J. (2000). Excitation of the primary tropospheric chemical mode in a global three-dimensional model. J. Geophys. Res. Atmos. 105 (D20), 24647–24660. doi:10.1029/2000jd900399
Keywords: hydrogen, global warming potential, climate change, methane, atmospheric chemistry
Citation: Chen C, Solomon S and Stone K (2024) On the chemistry of the global warming potential of hydrogen. Front. Energy Res. 12:1463450. doi: 10.3389/fenrg.2024.1463450
Received: 11 July 2024; Accepted: 15 October 2024;
Published: 28 October 2024.
Edited by:
Fabien Paulot, Princeton University, United StatesReviewed by:
Nicola Warwick, University of Cambridge, United KingdomRichard Derwent, rdscientific, United Kingdom
Maria Sand
Copyright © 2024 Chen, Solomon and Stone. This is an open-access article distributed under the terms of the Creative Commons Attribution License (CC BY). The use, distribution or reproduction in other forums is permitted, provided the original author(s) and the copyright owner(s) are credited and that the original publication in this journal is cited, in accordance with accepted academic practice. No use, distribution or reproduction is permitted which does not comply with these terms.
*Correspondence: Candice Chen, Y2Z6Y0BtaXQuZWR1
 Candice Chen
 Susan Solomon
 Kane Stone
