- 1State Grid Jiangsu Electric Power Co., Ltd., Economic and Technological Research Institute, Nanjing, China
- 2State Grid Jiangsu Electric Power Co., Ltd., Nanjing, China
The advent of novel power systems has given rise to a multitude of safety and stability concerns associated with the integration of emerging energy sources and power electronic equipment. The active support of the grid-forming control strategy represents an effective solution to the voltage and frequency stability issues associated with the weak damping and low inertia inherent to high-ratio new energy systems. Firstly, a static voltage stability index based on critical impedance is proposed for assessment of the static stability margin of a new energy grid-connected system, based on the static voltage stability theory of a traditional single-unit single-load system. Secondly, an analysis is conducted of the control principle of the grid-forming control converter and its impedance characteristics. In conclusion, a method for enhancing the static voltage stability margin of grid-connected new energy stations through parameter control of grid-forming converters is presented. The simulation verification of the single-feed and multi-feed systems demonstrates the efficacy and accuracy of the methodology presented in this study.
1 Introduction
The advent of a significant proportion of new energy has resulted in a shift in the grid structure, whereby traditional synchronous generator sets are no longer the dominant force. Instead, the grid is now co-dominated by both synchronous generator sets and non-synchronous generator sets, with the latter represented by new energy. The high proportion of new energy in the system gives rise to a series of frequency and voltage stability issues, largely attributable to the low inertia and damping characteristics inherent to the technology (Zhang et al., 2021; Chu and Teng, 2023; Linbin et al., 2020a; Zhou et al., 2024). The grid-forming control strategy, which has been the subject of much study, provides superior voltage and frequency support for high-ratio new energy systems (Mingxuan et al., 2022; Mahmoud et al., 2022; Gao et al., 2024; Chaoran et al., 2021). The transient stability of grid-forming converters has been the subject of extensive analysis in most studies (Jingyang et al., 2024; Teng and Xiongfei, 2021; Bo and Xiongfei, 2022). However, there is a paucity of research examining the impact of grid-forming converters on the static voltage stability of the system. The term “static stability of power system voltage” is used to describe the long-term stability of voltage under a given operating condition for a given load and generation capacity (Yue et al., 2019; Ramirez and Murillo-Perez, 2006).
At present, some researchers are evaluating the static voltage stability of new energy power systems using the short circuit ratio (SCR) as a metric. However, most of these studies have identified a slight deficiency in their ability to accurately classify system stability based on the critical short circuit ratio (Li et al., 2021). Moreover, some studies employ the eigenvalue analysis and singular value decomposition methods for evaluation purposes. In Hao et al. (2021), the short-circuit ratio of a multi-feeder DC system is defined at the planning level, and the critical value of the metrics is determined through the sensitivity of the PV curves. However, no online analysis has been reported. In Jian et al. (2019), an online power/voltage stability metric is proposed for calculating the critical value of the metric by simplifying the multi-machine, multi-feed system into a single-machine system. Nevertheless, the method necessitates the acquisition of the Davening equivalent potentials of the nodes or the intra-generator potentials. In Linbin et al. (2020b), a generalised short-circuit ratio is proposed for the assessment of the static stability of the system based on a modal approach to decouple the multi-feed system; however, the calculation process is complex. A data-driven approach based on a moment-based spectral estimation method is proposed to facilitate an understanding of the voltage magnitude changes by synchronising the phasor measurement unit (PMU) data, with a view to taking appropriate measures to prevent system static voltage instability (Fan et al., 2021). A critical short-circuit ratio was proposed as a means of assessing the static voltage stability of power systems that integrate high-voltage direct current (HVDC) transmission (Lee and Andersson, 2016; Hao et al., 2020). In Adewuyi et al. (2019), a battery energy storage system (BESS) was employed for the optimal active and reactive power compensation of a continuously loaded power system, and a voltage stability assessment model was constructed that incorporates transmission line active and reactive current information. To address the increasingly prevalent problem of correlated uncertainty in power grids, a probabilistic modelling approach based on the inherent correlation of uncertain system parameters has been proposed as a means of achieving both static and dynamic voltage stability (Alzubaidi et al., 2024). The traditional continuous power flow (CPF) method is inadequate for accounting for the dynamic characteristics of renewable energy generation, resulting in significant errors in the estimation of renewable energy penetration into power systems. To address this limitation, an extended CPF method is proposed for This study considers the static voltage stability of a high-penetration new energy power system based on the extended Jacobi matrix (Tiezhu et al., 2024), considering the dynamic characteristics of the synchronous generator and the renewable energy generation in the AC constant-voltage control mode. To facilitate the analysis of the impact of the integration of inverter-based distributed generators in different control modes on static voltage stability, a system static voltage stability index is derived for the purpose of evaluating the load state of the distribution network from a complex current model (Yaran et al., 2021). To meet the requirements of voltage stability assessment and to address the issues of class imbalance and poor model generalisation in machine learning, an online assessment method for static voltage stability is proposed in reference (Zhujun et al., 2022). This method is based on the RUSBagging method, which addresses the issue of class imbalance to a certain extent and improves the assessment accuracy of a few class samples.
In conclusion, most studies on static voltage stability focus on the assessment of the static stability of new energy high-penetration systems. The calculation of related assessment methods is complex, and the accuracy of the results is difficult to guarantee. There is a paucity of studies examining the enhancement of static voltage stability in high-percentage new energy and high-percentage power electronic systems. Moreover, numerous scholars have investigated the transient stability characteristics and enhancement techniques of grid-forming converters, yet there is a paucity of in-depth research on static voltage stability. There is a research gap concerning the enhancement of static stability margins through the control of grid-forming parameters. The current methods for enhancing the static voltage stability margin, such as reinforcing the power grid infrastructure and implementing capacitance compensation, necessitate a significant investment in equipment addition or modification. Consequently, the deployment of these solutions in real-world scenarios is fraught with difficulties.
This paper examines the static stability limit power of single-unit single-load systems and single-unit single-feed systems from an impedance perspective, based on traditional static stability. It also determines the impedance magnitude corresponding to the static stability limit power of the new energy grid-connected system. Furthermore, it analyses the impedance characteristics of the grid-forming converter and demonstrates that altering relevant control parameters can modify the equivalent impedance, thereby magnifying limit output power and enhancing static voltage stability margin. Building upon this analysis, a novel method for enhancing static stability limits in new energy field stations based on grid-forming control is proposed. By adjusting control parameters, this approach effectively improves the static stability margin and enhances the grid-forming converter limit power at a low cost with practical applicability.
The contributions of this study are as follows:
(1) Different from the traditional static voltage stability theory, the static voltage stability margin index based on critical impedance proposed in this paper has clear physical meaning and simple calculation.
(2) Based on the control principle of the grid converter, the impedance characteristics of the converter are analysed using small signal perturbation method. It is found that the impedance can be modified by adjusting the sag coefficient of reactive voltage.
(3) A method of increasing static voltage stability margin based on grid-forming control is proposed, which is simple, low cost and easy to be applied in practice.
The rest of this paper is organised as follows: Part II proposes a critical impedance-based static voltage stability margin assessment index for new energy grid-connected systems based on the traditional static voltage stability theory; Part III analyses the control principle of grid-forming converter and its impedance characteristics based on the small-signal model; Part IV elaborates the static voltage stability margin enhancement method for new energy grid-connected systems based on the parameter control of converter; In part Ⅴ, the method proposed in this paper is verified; Finally, the conclusion is made and the future work is expected.
2 Static stability limit theory analysis
2.1 Single machine with single load system
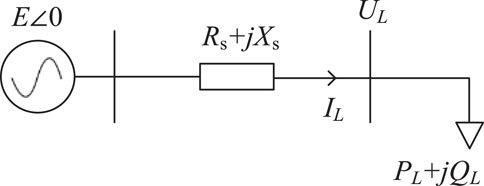
As shown in the figure is a single-machine, single-load system, E is the Davening-equivalent potential of the AC large system, Zs is the system-equivalent impedance, and PL + jQL is the load power. After the power system is subjected to small perturbations, no spontaneous oscillations or non-periodic out-of-steps occur, and it can automatically recover to the initial operating state, and the power system is statically stable. When this system reaches the static critical stability, the maximum load power is shown in Equation 1.
When the load absorbed power exceeds this limit, then the system will be destabilised. Therefore, the static stable transmission power limit of the system should be enhanced as much as possible to improve the static stability margin and reduce the risk of static instability of the system as much as possible.
In this paper, the theory related to static stability of high percentage new energy systems is studied from the impedance perspective analysis, and the equivalent impedance of the load when the single-unit, single-load system reaches the static stability limit will be analysed in the following.
For a specific system, its parameters are certain, and when the load equivalent impedance is changed, its absorbed power will be changed. Let the load impedance be expressed as
where, UL and IL denote the load voltage and load current. Equation 2 reflects the complex power absorbed by the load from the system, it is not only related to the load impedance magnitude, but also affected by the impedance phase.
The active power absorbed by the load can be expressed as in Equation 3.
Taking the partial derivatives for the magnitude and phase angle respectively, we have
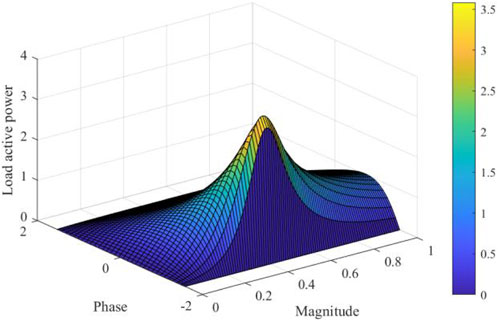
It can be shown in Equation 4 that the load power achieves its maximum value when and only when ZL = Zs and αL = −αs, i.e., when the load impedance is equal in magnitude and opposite in phase to the system. The corresponding limit power is
From Equation 5, reducing the system impedance and phase angle can improve the system limit output power.
SIMULINK is used to build a single machine and single load system as shown in Figure 1, the system potential E = 1, Rs + jXs = 0.4ej80°, the load complex impedance is ZLejα, and the three-dimensional diagram of the absorbed active power with impedance magnitude and phase is shown below, which shows that when the load impedance is equal to the system impedance and the phase is opposite, the absorbed active power reaches the maximum value.
2.2 Single-machine and single-feed system
The new energy single-machine single-feed system is shown in Figure 2, where Uw, Pw, Qw are the new energy station voltage, active output and reactive output, and the meaning of other symbols is the same as that in Figure 1.
Comparing Figures 3, 3, although the power transmission direction of the stand-alone single-load system is opposite to that of the new energy’s stand-alone single-feeder system, they have similar structures, and therefore, they have similar properties.
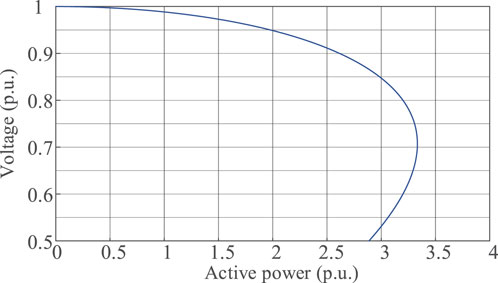
In the stand-alone single-load system, with the increase of the load power, a voltage dive will occur and lead to voltage instability, while in the stand-alone single-feeder system, a similar phenomenon will also occur. For example, the single machine single-feed system shown in Figure 3 is built in Simulink. Set
As can be seen in Figure 4, with the increase of the new energy output power, the voltage of the new energy field station gradually decreases to reach the maximum output power of the new energy, and then continue to increase the active power, the voltage of the new energy field station will plummet, and there is a voltage destabilisation, which is similar to that of the stand-alone, single-fed-in system.
Further, considering the new energy single-feeder system, whether there is a similar single-feeder system, that is, the new energy unit equivalent impedance and the AC system amplitude is equal to the system is in a critical stable state, and can be based on the magnitude of the new energy unit equivalent impedance to determine the voltage stability of the system.
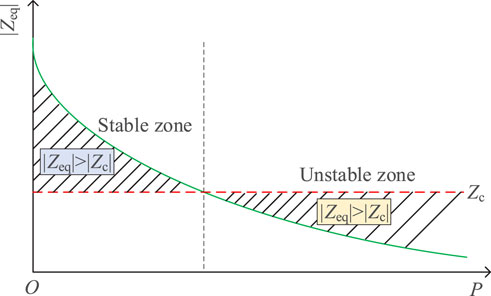
After the above analysis, the new energy grid-connected system has a similar conclusion with the load, when its equivalent impedance is equal to the system impedance, the new energy output power reaches the limit. When the equivalent impedance is greater than the system impedance, the power is less than the limit and the system is stable. When the equivalent impedance is smaller than the system impedance, the output power is greater than the stability limit, and the system is unstable. In this paper, the system impedance is called the critical impedance, based on which the static voltage stability margin of the new energy station is defined.
where Z∆ is the static voltage stability margin expressed as an impedance vector, Zw is the equivalent impedance of the new energy field station, and Zcr is the system impedance or critical impedance.
Based on this index, static voltage stability determination criteria can be described as Equation 7.
Figure 5 gives the curve of the impedance determination index defined in this paper versus the static voltage stability of the system.
3 Impedance characteristics of new energy via grid-forming converter for grid-connection
3.1 Grid-forming converter topology and control
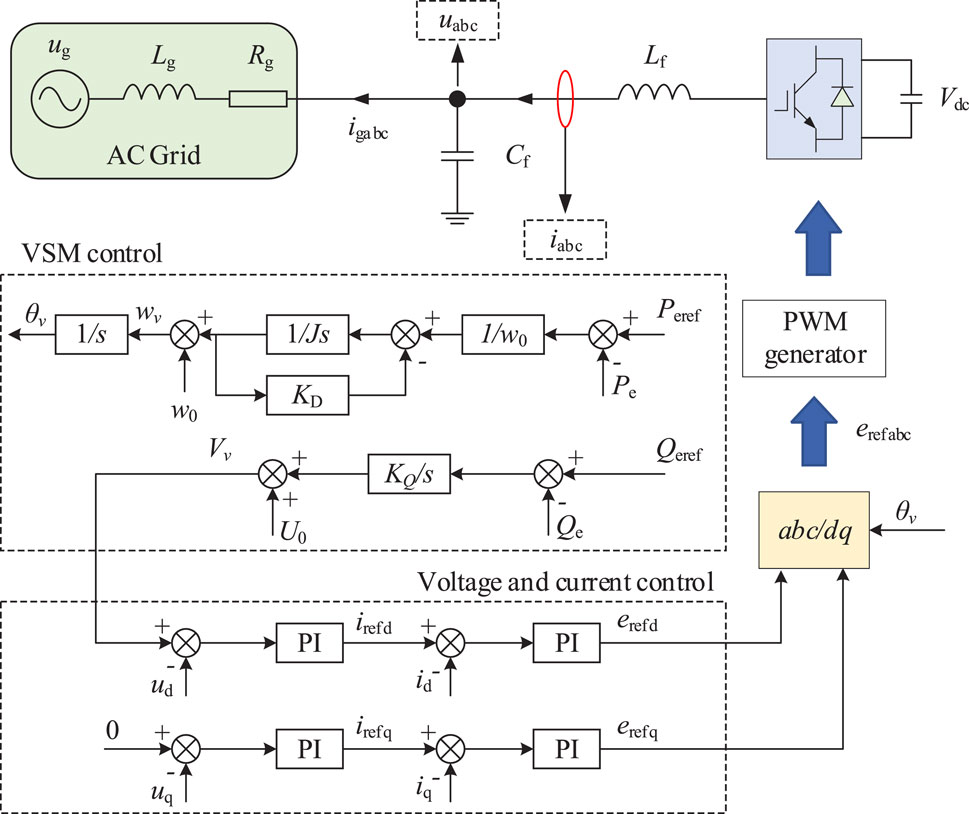
Figure 6 shows a typical grid-forming converter topology and control method. Where: Vd is the DC side voltage of the converter, which can be identified as a constant value; ea, eb and ec are the internal potentials of the converter; ia, ib and ic are the output currents of the VSG; iga, igb and igc are the grid-connecting currents of the converter; va, vb and vc are the output terminals of the converter; and Lf, Cf and Rf are the filtering inductances, filtering capacitances and damping resistances of the converter, respectively; Lg and Rg are the equivalent line inductance and resistance of the grid, respectively; vga, vgb and vgc are the equivalent AC system voltages.
The active control strategy of the grid-forming converter draws on the inertia and primary frequency regulation characteristics of the synchronous generator; the reactive control strategy simulates the primary voltage regulation characteristics of the synchronous generator. For the voltage-controlled converter, the following expressions are available:
where: J is the virtual rotational inertia; ωv and ωN are the output angular frequency of the converter and the rated angular frequency of the grid, respectively; Ts and Te are the given torque and the electromagnetic torque, respectively; Dp and Dq are the active damping coefficient and the reactive damping coefficient, respectively; Ps and Qs are the active and reactive power given, respectively; Pe and Qe are the instantaneous output active and reactive powers, respectively are the instantaneous output active power and reactive power; θ is the phase of the inverter’s internal potential; KQ is the reactive inertia coefficient; VN and V are the rated voltage RMS and output voltage RMS, respectively; and Ev is the rms value of the inverter’s internal potential.
The output active power Pe and reactive power Qe of the converter can be calculated according to the instantaneous power theory, which is given by Equation 9.
where: iα, iβ are the output current of the converter in the αβ coordinate system; vα, vβ are the output voltage of the converter in the αβ coordinate system.
The modulating waveform of VSG is jointly determined by the outputs of active and reactive controllers with the Equation 10.
3.2 Impedance characteristics of grid-forming converter control system
The converter is controlled in a stationary coordinate system and therefore cannot be modelled in a synchronous rotating coordinate system for small signal linearisation. In this study, the harmonic linearisation method is used to derive the positive sequence output impedance model of the converter. The fp frequency positive sequence voltage perturbation is injected at the point of common coupling (PCC), and according to the 2-fold mirror frequency coupling effect, the main circuit can be decomposed into fp frequency and fp -2f1 frequency equivalent circuits, and its small-signal model is
where the expressions for the components of the filter capacitor voltage va[f], output current ia[f], and inductor current iLa[f] at different frequencies are shown in Equations 13–15.
where:
The positive sequence voltage perturbation passes through the power control loop causing a phase angle perturbation quantity Δφ such that φ = φ1 + Δφ, where φ1 = ω1t is the fundamental voltage phase angle.
va[f], ia[f] and iLa[f] are park transformed to obtain the voltage-current expression in the dq coordinate system as shown in Equations 16–21.
where:
After neglecting the high frequency components, the frequency domain expressions for active and reactive power of the converter are obtained by Equations 22, 23 using the convolution theorem in the frequency domain:
According to the mathematical model of the power control loop in Equation 8, ignoring the small signal quantity of the quadratic term, we obtain the frequency domain expressions shown in Equations 24, 25 for φ and Ev
where:
The voltage-current control dual-loop voltage loop reference is generated by the power control loop, where
where
To eliminate the
where Dp2(s) can be described as Equation 28.
Bringing Equation 27 into Equation 26 and combining Equations 11, 12, the positive sequence impedance of the converter is obtained by solving as shown in Equation 29.
By analyzing the impact of each control parameter in the impedance expression on the amplitude and phase of the converter impedance, it is evident that only the reactive voltage sag coefficient exerts significant influence. Therefore, this study selects the reactive voltage sag coefficient as the variable for regulating converter impedance. The influence of other relevant parameters on grid-forming converter impedance characteristics is minimal and can be disregarded. It should be noted that when compared with (Cespedes and Jian, 2014), under identical parameter conditions, the equivalent impedance of a grid-forming converter is lower than that of a grid-following converter, thereby reducing its static voltage stability margin to some extent after connection to the system. Consequently, urgent research into methods for improving static voltage stability in grid-forming converter grid-connection scenarios at this stage is warranted.
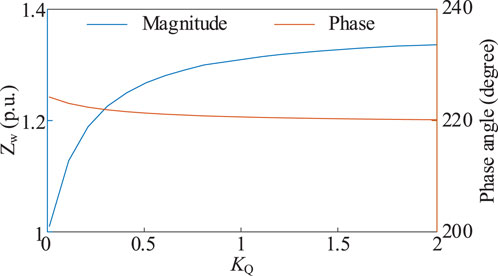
To verify the correctness of the conclusions of this paper based on the impedance characteristics of the converter, a simulation model of a single machine single-feed system as shown in Figure 3 is constructed. It is proved that the reactive voltage sag coefficient has a large influence on the magnitude and phase of the impedance. The Figure 7 shows the influence of the reactive voltage sag coefficient on the impedance magnitude and phase of the field station.
It can be seen from Figure 7 that the reactive voltage sag coefficient has little effect on the phase of the power station impedance and a larger effect on the amplitude. Therefore, the influence of the control parameter on the impedance phase is no longer considered in this paper. The following section further proposes the static voltage stability limit enhancement strategy based on the matching of impedance parameters by changing the control parameter to affect the impedance replication of the converter.
4 Static stability margin improvement method based on converter parameter control
When the power transmitted by the new energy unit to the system increases, its equivalent impedance will gradually decrease, and the corresponding static stability voltage margin will be reduced. Based on the theoretical basis that the converter control parameters can affect its impedance characteristics, this paper proposes the method of static stability margin improvement as follows: Under the current working condition, the impedance at the current output power of the same power is improved by changing the control parameters. When the output power of the new energy is increased to the next level, the corresponding impedance is increased compared with that before the parameter change. Then, according to Equation 6, the static voltage stability margin of the new energy is increased (∆Z2>∆Z1), and the limit output power is increased. Figure 8 shows the power impedance schematic curve when the static voltage stability margin is increased by the proposed method.
The vertical axis of the graph is the equivalent impedance magnitude of the converter, and the horizontal axis is the output power, the impedance magnitude decreases with the increase of power. Zcr is the equivalent impedance when the power output reaches the critical limit. In the initial working condition, the impedance power curve and the critical impedance curve to determine the limit power for Pmax, by changing control parameters to make its initial impedance from Zw0 increased to Zw0’, the curve and the critical impedance curve to determine the limit power for Pmax’, obviously Pmax > Pmax’.
The objective of this paper is to enhance the static voltage stability margin of a new energy grid-connected system. This is achieved by controlling the parameters to increase the amplitude of the converter impedance at the output of the same power, thereby expanding its margin with the critical impedance and attaining a higher static stability margin.
5 Simulation verification
To validate the static stability assessment index and enhancement strategy proposed in this paper, this section analyses the static voltage stability margin and enhancement effect of the system before and after applying the strategy in this paper based on the new energy single-feed system and multi-feed system, in which the new energy station takes the wind farm as an example and adopts the grid-forming control strategy.
5.1 Single-feed new energy system
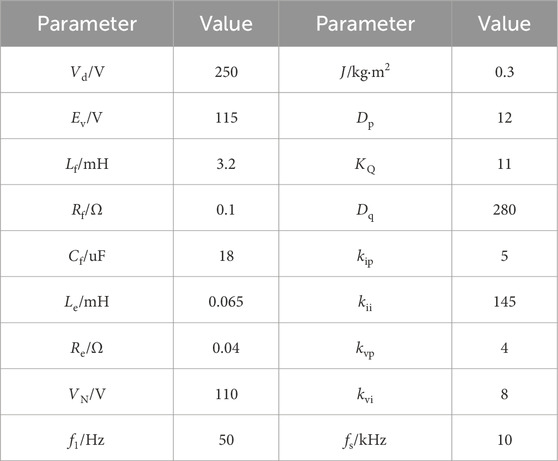
Firstly, the applicability of the strategy proposed in this paper is analysed in a simple single-fed system as shown in Figure 9, and the main parameters of the grid-forming converter are shown in Table 1. The AC system impedance is 2j, and the system voltage is 1. All the simulations in this paper are carried out under the reference value of 100MVA, and the voltage level is set to 110V.
In the Table 1, Vd denotes the inverter DC voltage, Lf, Rf and Cf denote the filter inductance, resistance and capacitance on the AC side, respectively. Le and Re denote the line inductance and resistance. fs is the switching frequency of the inverter. kip and kii denote current inner loop proportional integral coefficients. kvp and kvi denote voltage outer loop proportional integral coefficient. The meaning of the remaining variables has been described in the previous content.
In the system based on the initial parameters listed in Table 2, the outgoing power of the new energy field station is continuously increased by increasing the impedance amplitude and the corresponding impedance amplitude is recorded until the system becomes unstable and the static stabilization limit power is recorded. The equivalent impedance and limit power of the new energy field station at the original converter control parameters and after changing the parameters are given in Table 3. According to the results, the equivalent steady-state impedance of the new energy field station can be improved to a certain extent by changing the reactive voltage sag factor, i.e., the static voltage stability margin is improved. Although the improvement of the steady state margin at steady state is small, the improvement for the ultimate power is still considerable.
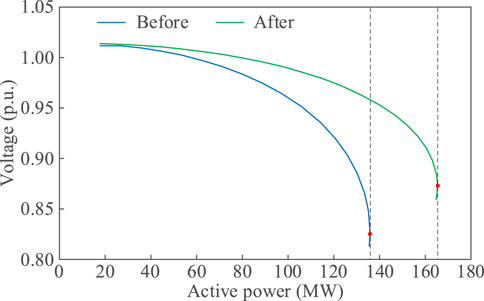
Figure 10A gives the curve of the PCC voltage with the output power of the new energy field station during the whole process under the original control parameters, and the power decreases rapidly after reaching the maximum value, indicating that the phenomenon of static voltage destabilisation occurs. At this time, the corresponding voltage is the critical stabilisation voltage, and the output impedance of the new energy field station is 2.04 (equivalent to the high-voltage side of the system, the same below), which is equal to the size of the AC system impedance, which verifies the static voltage stabilisation method of critical stabilisation impedance proposed in this paper.
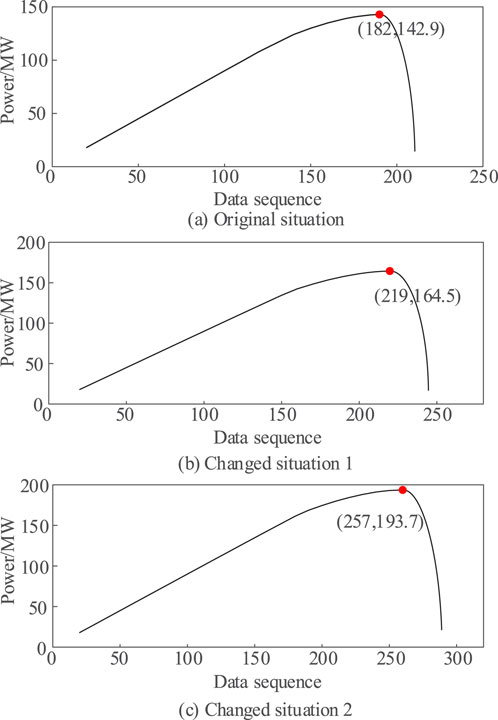
Figure 10. Sequence diagram of wind turbine power for different control parameters. (A) Original situation. (B) Changed situation 1 (C) Changed situation 2.
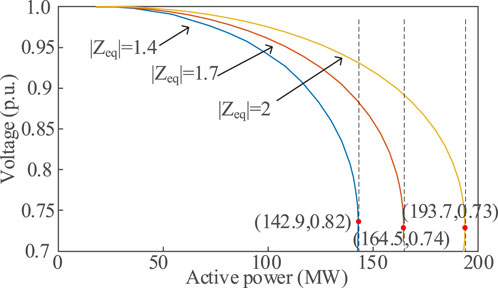
Now, the control parameters of the grid-forming converter are adjusted to verify whether the control strategy proposed in this paper can improve the new energy static voltage stability margin. The reactive voltage sag coefficients are changed to 15 and 22, at which time the voltage and impedance in the process of delivering power increase are recorded, which are given in Figures 10B, C, respectively. The power-voltage curves under three different parameter conditions are given in Figure 11. According to the results, the limiting output power of the new energy field station is increased after changing the control parameters, and the impedance amplitude of the field station is larger at the same power, and the static voltage stability margin characterised by impedance is higher. The converter impedances of the three curves at the critical point are 2.01 p.u. and 1.98 p.u., which are close to the critical impedance of 2 p.u., respectively.
5.2 Multi-feed new energy system
Before validating the effectiveness of the methodology of this paper in multi-feed-in systems, the changes in the limit power and the total power limit of the section are briefly analysed for each field station after applying the proposed strategy.
If the static stability margin of the current field station 2 is low, its static stability limit needs to be improved. When the control parameters are changed so that X2 is increased, for the new energy field station 1, the equivalent system impedance is calculated by Equation 30.
The static stability margin of the new energy field station 1 is obtained by Equation 31.
The increase of the grid-connected impedance of station 2 will lead to the increase of the equivalent impedance Xeq, which will lead to the decrease of the static stability margin of station 1, thus increasing the risk of static voltage instability of the system.
Therefore, it is set in this paper that in a multi-site grid-connected system, the site with smaller static voltage stability margin should be adjusted with priority; Secondly, after adjusting the parameters, it should be verified whether the margin of each site meets the requirements.
It is noted from Equation 32 that although increasing the impedance of a new energy station individually reduces the static voltage stability margins of other grid-connected stations to a certain extent, the overall static stability margins are improved from the point of view of the whole aggregation station, which can withstand a higher power delivery limit.
The application of the method proposed in this paper in the multi-field station grid-connected system is now described. The new energy multi-feed-in system shown in Figure 12 is constructed, the converters are all network-controlled, and the initial control parameters of each station are the same (the same as the single-machine single-feed-in system). The power reference value of the new energy multi-feeder system is 100MVA, the voltage level is 350V, the impedance of the system is 1j, and the relevant parameters of each station under the initial working condition are shown in the following table.
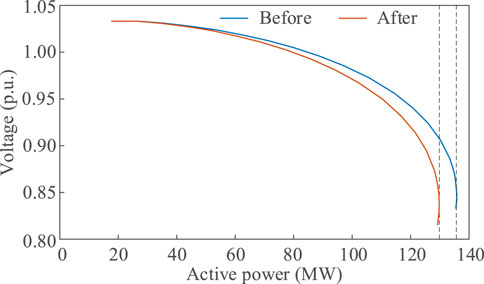
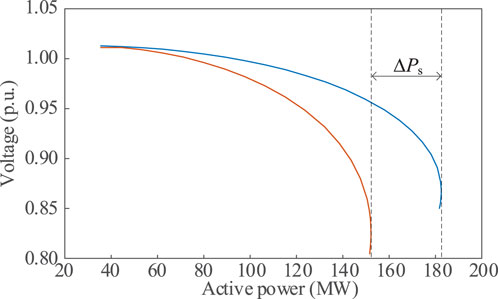
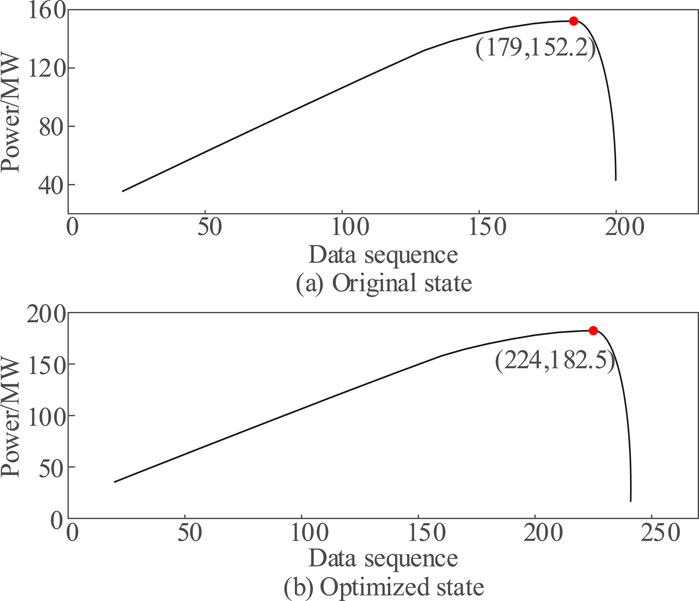
The power-voltage curves of the two stations and the pooling bus are shown in Figures 13–15, respectively, when the control parameters are changed so that the equivalent impedance of Station 1 is increased. After changing the parameters, the static stability margin of the new energy station 1 increases due to the increase of its own impedance, while the margin of the station 2 decreases slightly, but the limit power sent from the pooling bus increases compared with the previous one. The power curves of the pooling bus before and after the parameter change are shown in Figure 16.
As can be seen from Figures 13–15, changing the control parameters of a station can appropriately increase the static stability limit margin of that station, but it will cause the static voltage stability margin of other stations to slightly decrease. Overall, the static phone stability margin of the whole grid-connected system is improved greatly, which also proves the feasibility of the method proposed in this paper. The power sequence before and after in Figure 16 shows that the static stability margin of the system is improved after the converter control parameters are changed.
6 Conclusion
This study employs an analytical approach to investigate the impedance characteristics of the grid-forming converter, with a view to identifying the control parameters that exert the most significant influence on its impedance amplitude. Based on these findings, a static voltage stabilization enhancement method is put forward, which is predicated upon the impedance characteristics of the grid-forming converter connected to the grid. The following conclusions are obtained:
(1) The critical impedance-based static voltage stability limit evaluation index proposed in this paper can effectively realize the evaluation of the static voltage stability margin of new energy field stations connected to the grid, with clear physical meaning and simple calculation.
(2) The adoption of the virtual synchronous machine control strategy by the grid-forming converter allows for the manipulation of the reactive voltage sag coefficient, which in turn affects the magnitude and phase of its impedance. Consequently, the static voltage stability margin of the system can be enhanced by modifying this parameter.
(3) The static voltage stability margin enhancement strategy based on the impedance characteristics of grid-forming converters is applicable not only to simple single-fed new energy systems, but also to multi-site-fed systems. The strategy has a broad range of applications, straightforward implementation steps, and a minimal calculation volume. No additional equipment is necessary, and the financial outlay is minimal, facilitating practical implementation.
(4) The present study examines the static stability of grid-forming converters that are controlled by a virtual synchronous generator. Subsequently, the grid-forming converters under other control strategies, including droop control and virtual oscillator, will be subjected to further analysis.
Data availability statement
The original contributions presented in the study are included in the article/supplementary material, further inquiries can be directed to the corresponding author.
Author contributions
SW: Writing–original draft, Writing–review and editing, Conceptualization. LG: Writing–original draft. GY: Writing–original draft. WQ: Writing–review and editing, Project administration. CH: Writing–review and editing, Supervision. HX: Writing–review and editing, Software. ZW: Writing–review and editing, Project administration.
Funding
The author(s) declare that financial support was received for the research, authorship, and/or publication of this article. This study received funding from State Grid Jiangsu Electric Power Co., LTD. Science and Technology Project, SGJSJY00GHJS2310177.
Conflict of interest
Authors SW, LG, GY, WQ, CH, HX, and ZW were employed by State Grid Jiangsu Electric Power Co., Ltd.
The authors declare that this study received funding from State Grid Jiangsu Electric Power Co., LTD. Economic and technological research institute. The funder had the following involvement in the study: data collection, analysis and decision to publish.
Publisher’s note
All claims expressed in this article are solely those of the authors and do not necessarily represent those of their affiliated organizations, or those of the publisher, the editors and the reviewers. Any product that may be evaluated in this article, or claim that may be made by its manufacturer, is not guaranteed or endorsed by the publisher.
References
Adewuyi, O. B., Shigenobu, R., Ooya, K., Senjyu, T., and Howlader, A. M. (2019). Static voltage stability improvement with battery energy storage considering optimal control of active and reactive power injection. Electr. Power Syst. Res. 172, 303–312. doi:10.1016/j.epsr.2019.04.004
Alzubaidi, M., Hasan, K. N., and Meegahapola, L. (2024). Probabilistic steady-state and short-term voltage stability assessment considering correlated system uncertainties. Electr. Power Syst. Res. 228, 110008. doi:10.1016/j.epsr.2023.110008
Bo, F., and Xiongfei, W. (2022). Equivalent circuit model of grid-forming converters with circular current limiter for transient stability analysis. IEEE Trans. Power Syst. 37 (4), 3141–3144. doi:10.1109/tpwrs.2022.3173160
Cespedes, M., and Jian, S. (2014). Impedance modeling and analysis of grid-connected voltage-source converters. IEEE Trans. Power Electron. 29 (3), 1254–1261. doi:10.1109/tpel.2013.2262473
Chaoran, Y., Linbin, H., Huanhai, X., and Ju, P. (2021). Placing grid-forming converters to enhance small signal stability of PLL-integrated power systems. IEEE Trans. Power Syst. 36 (4), 3563–3573. doi:10.1109/tpwrs.2020.3042741
Chu, Z., and Teng, F. (2023). Voltage stability constrained unit commitment in power systems with high penetration of inverter-based generators. IEEE Trans. Power Syst. 38 (2), 1572–1582. doi:10.1109/tpwrs.2022.3179563
Fan, Y., Ling, Z., Wei, M., Mi, T., Yang, H., and Qiu, R. C. (2021). Real-time static voltage stability assessment in large-scale power systems based on spectrum estimation of phasor measurement unit data. Int. J. Electr. Power and Energy Syst. 124, 106196. doi:10.1016/j.ijepes.2020.106196
Gao, X., Zhou, D., Anvari-Moghaddam, A., and Blaabjerg, F. (2024). Stability analysis of grid-following and grid-forming converters based on state-space modelling. IEEE Trans. Industry Appl. 60 (3), 4910–4920. doi:10.1109/tia.2024.3353158
Hao, X., Yi, Z., Xianzhong, D., and Li, Y. (2021). Evaluating strength of hybrid multi-infeed hvdc systems for planning studies using hybrid multi-infeed interactive effective short-circuit ratio. IEEE Trans. Power Deliv. 36 (4), 2129–2144. doi:10.1109/tpwrd.2020.3020957
Hao, X., Yinhong, L., and Xin, S. (2020). Strength evaluation of multi-infeed LCC-HVDC systems based on the virtual impedance concept. IEEE Trans. Power Syst. 35 (4), 2863–2875. doi:10.1109/tpwrs.2019.2960298
Jian, X., Tiankai, L., Siyang, L., Sun, Y., Ke, D., Li, X., et al. (2019). An on-line power/voltage stability index for multi-infeed hvdc systems. J. Mod. Power Syst. Clean Energy 7 (5), 1094–1104. doi:10.1007/s40565-019-0507-8
Jingyang, F., Wenjia, S., Lantao, X., and Goetz, S. M. (2024). Analysis and improvement of transient voltage stability for grid-forming converters. IEEE Trans. Industrial Electron. 71 (7), 7230–7240. doi:10.1109/tie.2023.3299023
Lee, D. H. A., and Andersson, G. (2016). An equivalent single-infeed model of multi-infeed hvdc systems for voltage and power stability analysis. IEEE Trans. Power Deliv. 31 (1), 303–312. doi:10.1109/tpwrd.2015.2441738
Li, D., Sun, M., and Fu, Y. (2021). A general steady-state voltage stability analysis for hybrid multi-infeed HVDC systems. IEEE Trans. Power Deliv. 36 (3), 1302–1312. doi:10.1109/tpwrd.2020.3006027
Linbin, H., Huanhai, X., Zhiyi, L., Ju, P., Yuan, H., Lan, Z., et al. (2020a). Grid-synchronization stability analysis and loop shaping for PLL-based power converters with different reactive power control. IEEE Trans. Smart Grid 11 (1), 501–516. doi:10.1109/tsg.2019.2924295
Linbin, H., Huanhai, X., Zhiyi, L., Ju, P., Yuan, H., and Wang, G. (2020b). Identification of generalized short-circuit ratio for on-line stability monitoring of wind farms. IEEE Trans. Power Syst. 35 (4), 3282–3285. doi:10.1109/tpwrs.2020.2975413
Mahmoud, K., Astero, P., Peltoniemi, P., and Lehtonen, M. (2022). Promising grid-forming VSC control schemes toward sustainable power systems: comprehensive review and perspectives. IEEE Access 10, 130024–130039. doi:10.1109/access.2022.3228742
Mingxuan, L., Yue, W., Weihao, H., Sirui, S., Peng, Y., Zhenyuan, Z., et al. (2022). Unified modeling and analysis of dynamic power coupling for grid-forming converters. IEEE Trans. Power Electron. 37 (2), 2321–2337. doi:10.1109/TPEL.2021.3107329
Ramirez, J. M., and Murillo-Perez, J. L. (2006). Steady-state voltage stability with statcom. IEEE Trans. Power Syst. 21, 1453–1454. doi:10.1109/tpwrs.2006.879244
Teng, L., and Xiongfei, W. (2021). Transient stability of single-loop voltage-magnitude controlled grid-forming converters. IEEE Trans. Power Electron. 36 (6), 6158–6162. doi:10.1109/tpel.2020.3034288
Tiezhu, W., Shanshan, W., Shicong, M., Guo, J., and Zhou, X. (2024). An extended continuation power flow method for static voltage stability assessment of renewable power generation-penetrated power systems. IEEE Trans. Circuits Syst. II Express Briefs 71 (2), 892–896. doi:10.1109/tcsii.2022.3209335
Yaran, L., Long, F., Ke, M., and Dong, Z. Y. (2021). Assessment and enhancement of static voltage stability with inverter-based generators. IEEE Trans. Power Syst. 36 (3), 2737–2740. doi:10.1109/tpwrs.2021.3062224
Yue, S., Hill, D. J., and Tao, L. (2019). Static voltage stability analysis of distribution systems based on network-load admittance ratio. IEEE Trans. Power Syst. 34 (3), 2270–2280. doi:10.1109/tpwrs.2018.2886636
Zhang, C., Dou, X., Zhang, Z., Lou, G., Yang, F., and Li, G. (2021). Inertia-enhanced distributed voltage and frequency control of low-inertia microgrids. IEEE Trans. Power Syst. 36 (5), 4270–4280. doi:10.1109/tpwrs.2021.3057078
Zhou, W., Mohammed, N., and Bahrani, B. (2024). Voltage and current dynamics cancellation of weak-grid-tied grid-following inverters for maximum transferable power improvement. IEEE Trans. Energy Convers. 39 (3), 2053–2067. doi:10.1109/tec.2024.3376659
Keywords: new power systems, high penetration of new energy, grid-forming control, converter impedance characteristics, static voltage stability
Citation: Wentao S, Guojing L, Yi G, Quanquan W, Hui C, Xingning H and Wenjia Z (2024) Research on static voltage stability enhancement for new energy station based on grid-forming control strategy. Front. Energy Res. 12:1463229. doi: 10.3389/fenrg.2024.1463229
Received: 11 July 2024; Accepted: 16 October 2024;
Published: 08 November 2024.
Edited by:
Wenping Zhang, Tianjin University, ChinaReviewed by:
Haibo Li, Tsinghua University, ChinaSheng Li, Nanjing Institute of Technology (NJIT), China
Renxin Yang, Shanghai Jiao Tong University, China
Copyright © 2024 Wentao, Guojing, Yi, Quanquan, Hui, Xingning and Wenjia. This is an open-access article distributed under the terms of the Creative Commons Attribution License (CC BY). The use, distribution or reproduction in other forums is permitted, provided the original author(s) and the copyright owner(s) are credited and that the original publication in this journal is cited, in accordance with accepted academic practice. No use, distribution or reproduction is permitted which does not comply with these terms.
*Correspondence: Sun Wentao, MTMyOTExMTlAYmp0dS5lZHUuY24=
 Sun Wentao1*
 Liu Guojing