 Zhigang Ren1
 Jing Cai
94% of researchers rate our articles as excellent or good
Learn more about the work of our research integrity team to safeguard the quality of each article we publish.
Find out more
ORIGINAL RESEARCH article
Front. Energy Res., 03 September 2024
Sec. Smart Grids
Volume 12 - 2024 | https://doi.org/10.3389/fenrg.2024.1462991
This article is part of the Research TopicEnhancing Resilience in Smart Grids: Cyber-Physical Systems Security, Simulations, and Adaptive Defense StrategiesView all 19 articles
During the installation of a cable oil terminal, it is easy to leave scratches on the main insulation owing to uneven forces when removing the semi-conductive layer. Scratch defects cause field intensity distortion, which leads to partial discharge and insulation failure. This study attempts to establish a simulation model of a 220 kV cable terminal to determine the effect of the length, depth, and position of the scratch on the maximum field strength at the defect. The simulation and experiment demonstrate that the maximum field strength at the defect increases with greater length and decreases as the depth increases. Therefore, a prediction method for the terminal defect field strength based on a multivariate nonlinear regression model was proposed in this study. When the defect is located at 20 mm from the root of the stress cone, the maximum field strength is 14.5 MV/m when the length and depth are 2 mm and 1 mm, respectively. The maximum field strength at the defect was predicted based on the length, depth, and position of the scratch defect to evaluate the severity of the defect.
Currently, the number of high-voltage cables is increasing, as is the failure rate. More than 70% of all cable accidents are caused by defects in cable accessories (ANDREI et al., 2014; Bai et al., 2020a; Kumar et al., 2016), and cable terminals are relatively weak part (Yang et al., 2024; Bai et al., 2020b; Chang et al., 2013). The cable terminal must be constructed at the construction site and the structure is complex (Bai et al., 2020b; Chang et al., 2013; EL-BAGES and ABD-ALLAH, 2016; Kumar et al., 2023a; Fang et al., 2019). Both the surrounding environment and the manufacturing process affect its insulation performance (ILLIAS et al., 2012; Kumar, 2023; Li et al., 2018). During terminal installation, the main insulation may be scratched, leaving an air gap when the non-semi-conductive layer is removed. Severe field distortion caused by the air gap causes partial discharge, which eventually leads to insulation failure. For example, a 220 kV cable terminal exploded during operation (Yasha et al., 2018), a disintegration examination revealed a scratch air gap at the interface between the stress cone and the main insulation, and a discharge channel on the inner wall (Liu et al., 2015; Lu et al., 2014). The scratch defect leads to the insufficient insulation thickness of the terminal, and the concentration of the field intensity causes continuous partial discharge which leads to insulation breakdown (Sun et al., 2019). Therefore, analyzing the factors that affect the maximum field strength of scratch defects, and evaluating the impact of scratch defects of different lengths, depths and positions on insulation will effectively ensure the stable operation of the terminal and reduce the failure rate.
For the study of terminals with scratch defects, a finite element simulation calculation method was used to simulate and analyze the electric field when the intermediate joint of the 110 kV cable was damaged and the insulating layer was damaged (Kumar et al., 2020). Analyzed the electric field distribution while there were bubbles in the stress cone using ANSYS analyzed the distribution of the terminal field intensity by changing the size of the air gap and then optimized the design of the insulation structure (TIAN et al., 2003). Finite element software was used to analyze the influence of silica-free grease and non-uniform silicone grease coatings on the interfacial electric field when there was an air gap in the cable joint (Satapathy and Kumar, 2019; Wu et al., 2011; Kumar et al., 2013). Studied the discharge development characteristics and breakdown process of a terminal air gap at different temperatures (Wang et al., 2021). Electric field simulation and aging experiments were used in to study the discharge characteristics of air gap defects. The defect development was divided into five stages according to the variation law of the partial discharge signal, and the characteristic quantity of the partial discharge was extracted (Yang et al., 2019). Used a finite element simulation to calculate the axial and radial field strength characteristics of an air gap along a cable. The characteristics of defect discharge are described by an electric heating aging test (Zhao et al., 2008), and the discharge mechanism of the air gap development is summarized. Analyzed the swelling effect of silicone grease on insulating materials, and explored the variation rule of the local initial discharge voltage at the interface with the air gap before and after silicone swelling.
Previous studies on terminals with scratch defects have primarily focused on the distribution characteristics of the defect field intensity and the development mechanism of partial discharge. Factors affecting the field intensity distribution at the defect, such as the length and location of the defect, are usually considered independently (Kumar et al., 2023b; Yang et al., 2021), and the analysis is relatively simple. The maximum field intensity at the defect was affected by the length, depth, and location of the defect. These factors interact with each other; thus, determining the interaction between the three factors can improve the accuracy of the calculation (Sukanya Satapathy and Kumar, 2020). In this study, COMSOL Multiphysics software was used to simulate and analyze the oil terminal of a high-voltage cable with air-gap defects and determine the effect of the length, depth, and position of the scratch on the maximum field strength at the defect. On this basis, a prediction method for the terminal defect field intensity based on a multivariate nonlinear regression model was proposed to evaluate the severity of defects. The method provides a fast and effective prediction of the maximum value of field strength at the defect, the and evaluate the severity of defects, providing a new way of thinking for fault analysis. In this paper, we first establish a 220 kV cable terminal simulation model, then analyze the influence of the length, depth and location of scratches on the maximum field strength at the defects, and finally establish a multivariate nonlinear regression model to predicte of defect field strength.
220 kV cable with a cross-sectional area of 1200 mm2 was chosen for modeling, as shown in Figure 1. The cable body mainly includes the conductor, main insulation, insulation shielding layer, and other structures. The relevant structural parameters are listed in Table 1.
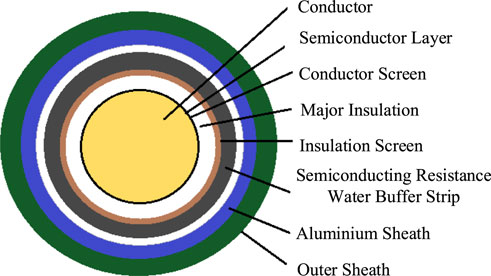
Figure 1. Cable body structure.
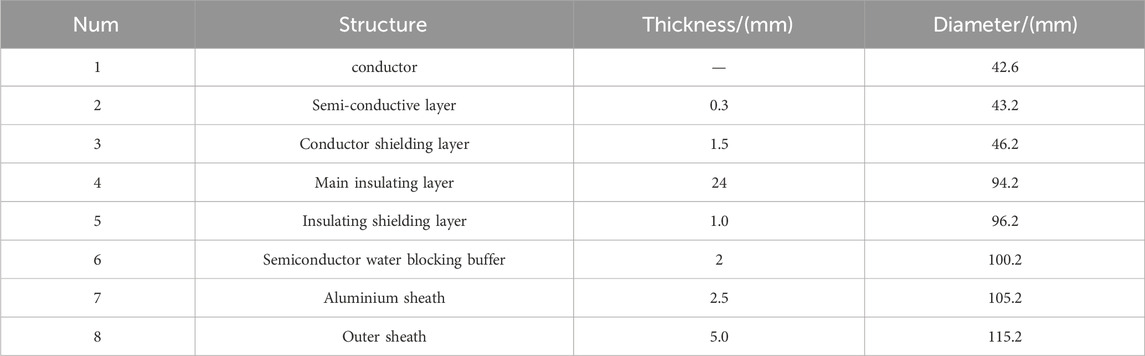
Table 1. Cable body structure parameters.
Figure 2 shows the specific structure of the 220 kV cable terminal. Stress cones are used for uniform electric fields, and their roots are connected with a semi-conductive belt. Above the semi-conductive belt is a copper shielding net connected to the flange. The other end of the copper mesh was connected to the flange and outer sheath to ensure that the ground was located at a potential of 0. The lead liner was connected to the aluminum sheathing, and the outermost heat-shrinkable tube protected the terminal from the external environment.
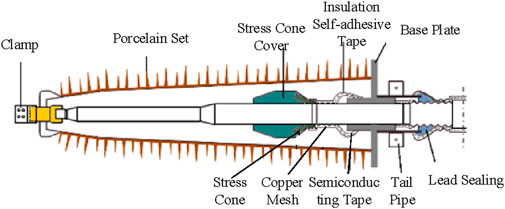
Figure 2. Cable oil terminal structure.
The electrical conduction law of each part of the cable terminal obeys Maxwell’s equations, the basic equation of which is Equation 1:
Where H is the magnetic field intensity, D is the electric displacement vector, E is the electric field intensity, B is the magnetic induction intensity and ρ is charge density.
The distortion of the electric field inside the cable terminal causes a temperature change, which in turn changes the performance of the insulation material and affects the electric field distribution. Therefore, the electrothermal coupling field was used for the calculations in this study. The internal heat sources of the cable terminal include the Joule heat generated by the outdated current in the wire core, Joule heat generated by the eddy current loss in the aluminum sheath, and heat generated by the dielectric loss of the insulating materials, which can be calculated as Equation 2–Equation 4
Pc is the Joule heat generation rate of the conductor, I is the current flowing through the conductor, R is the resistance of the conductor, Ps is the metal induced Joule thermal generation rate, λ1 is the metal loss factor. ω is the angular frequency, U is the voltage, tgδ is the dielectric loss factor of the insulation material, ε is the dielectric constant of the insulation material, Ei is the electric field intensity of unit i. Si is the area of the unit plane i.
According to practical application experience, the core voltage of the cable was set to 127 kV, and the aluminum sheath was set as the ground potential. The current was set to 700A, the temperature field useds solid heat transfer, the heat transfer coefficient was set to 10, the ambient temperature was set to 20°C, and the electromagnetic heat multi-physical field interface was selected.
In this study, COMSOL Multiphysics software was used to simulate the HV cable oil terminal with air-gap defects of different lengths, widths, and positions to analyze the distribution characteristics of the field intensity under different insulation defects.
According to the actual size of the terminal, the simulation model is established in a 1:1 ratio which shows in Figure 3. The parameters for each material are listed in Table 2. A two-dimensional axisymmetric model was established along the cable terminal axis. To simplify the terminal structure, parts that had little influence on the electric field and temperature distribution were combined. Therefore, the insulated self-adhesive strip of the copper mesh was combined with a heat-shrinkable tube during modeling.
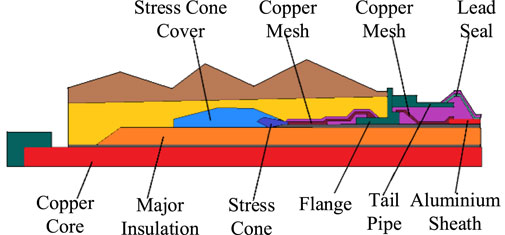
Figure 3. Cable terminal normal operation model.
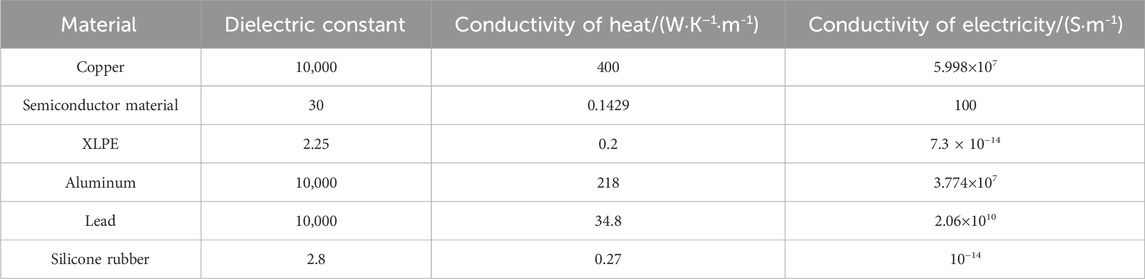
Table 2. Simulation parameters of each material.
The length, depth and position parameters of scratch defects are shown in Table 3, and the length, height and position parameters of impurity defects are shown in Figure 4. In Figure 4, the starting position of the right end of the heat shrink tube was set to 0 mm. A rectangular analog scratch defect was added to the main insulation surface. The relative dielectric constant of the air gap was 1, and the conductivity was set to 0S/m. The length, depth and position of the scratch defects are shown in Figure 4.
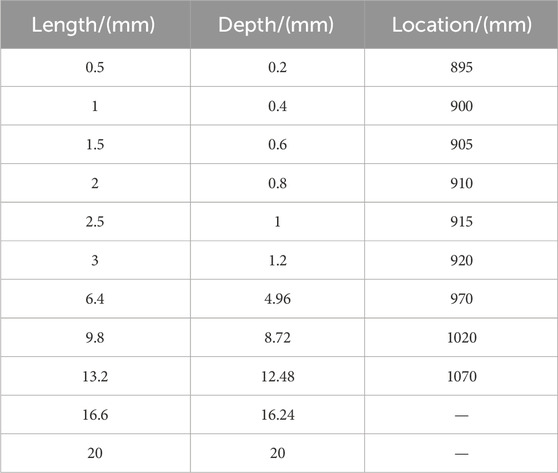
Table 3. Geometric parameters of scratch defects.
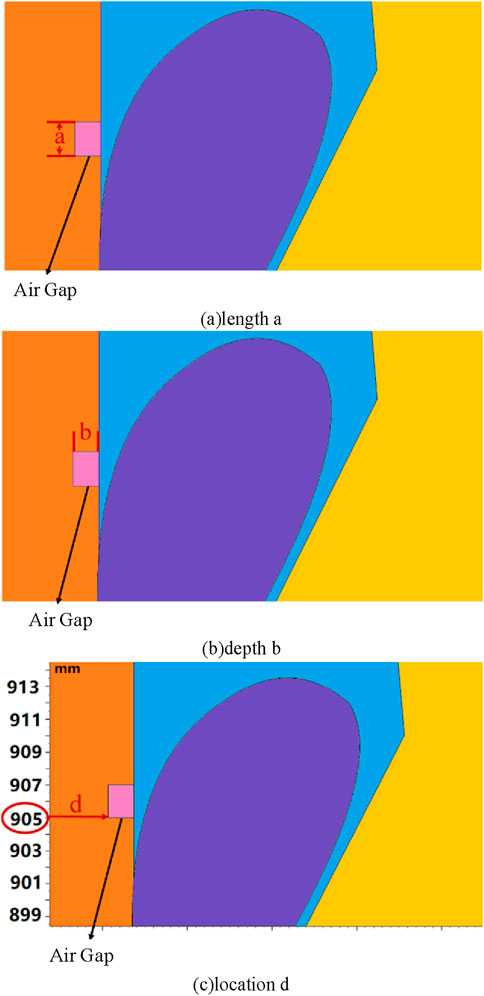
Figure 4. Length, depth, position of scratch defect.
When meshing the model, local mesh refinement was carried out in places where the field intensity changed or the bending radius was large, such as the junction of each layer of the model, stress cone, and vicinity of the defect. Therefore, the calculation accuracy was effectively improved. In Figure 5, the marked part simulates the defect part, and its grid division is more refined than that of the other parts.
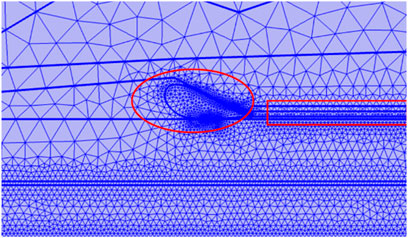
Figure 5. Grid subdivision diagram.
Figure 6 shows the electric field distribution during operation. The maximum field intensity appeared at the interface between the inner semi-conductive layer and the main insulation. Due to the dielectric constant difference between the main insulation and the stress cone, the field intensity distortion occurs at the root of the stress cone, and the value is 5.47 MV/m.
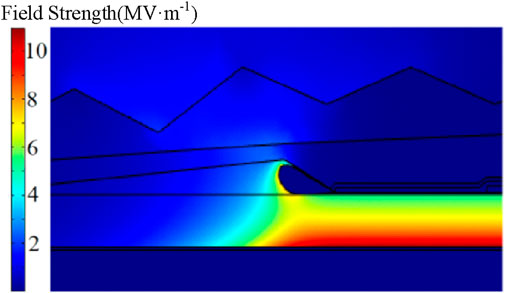
Figure 6. Electric field distribution of cable oil terminal during normal operation.
Figure 7 shows the electric-field distribution with the main insulation scratch defect. The internal field strength of the scratch defects was distorted, but the surrounding insulation field strength was relatively small. As shown in Figure 8, the maximum field intensity at the defect is 1.45 × 10⁷ V/m, which is 2.57 times than that without the defect and larger than the breakdown electric field of air which is 3× 10⁶ V/m. At this time, partial discharge can easily occur if the defect is scratched. Continuous discharge at the defect will lead to carbonation and ablation of the surrounding insulation, thereby accelerating insulation deterioration and further reducing the terminal insulation strength.
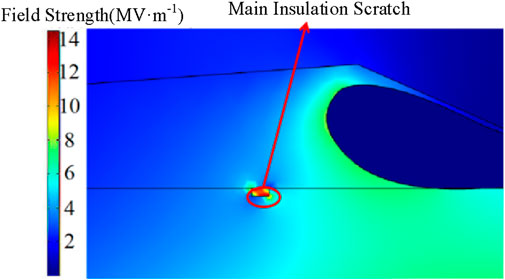
Figure 7. Primary insulation scratch electric field distribution cloud.
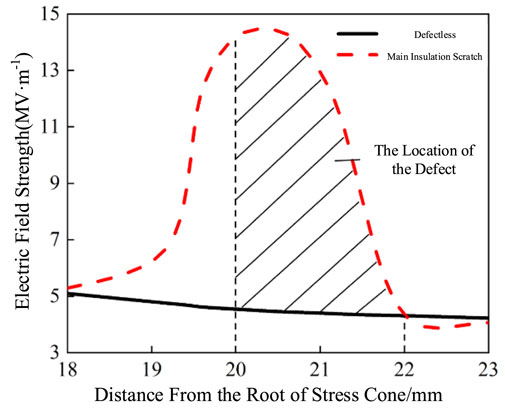
Figure 8. Electric field distribution curve of cable oil terminal when the main insulation is scratched.
The distribution of the maximum field intensity at the scratch defects of different lengths is shown in Figure 9. The positions 895 mm, 905 mm, and 913 mm indicate the cut-off point of the semi-conductive layer, the root of the stress cone, and the location below the end of the stress cone, respectively. The field intensity borne by the scratched defect is much greater than that borne by the medium. When the length of the scratched defect increases, the space charge density and charge quantity carried by the scratched surface increase, as does the maximum field strength at the scratched location. When the scratch defect is located at the positions of 895 mm and 905 mm, the maximum increase rate of the scratch defect field strength in the range of 0.5–1.5 mm is faster, which is 1.86 times that in the range of 1.5–3 mm. When the scratch defect was located at a position of 915 mm, the growth rate of the maximum field strength at the scratch gradually decreased as the scratch length increased owing to the effect of the uniform electric field of the stress cone. For example, when the depth is 0.2 mm, with an increase in the length, the maximum growth rate of the field intensity decreases from four to 2.5, which decreases by 37.5%. When the length of the scratch defect is greater than 0.5 mm, the maximum field strength is greater than the air breakdown field strength, which easily causes partial discharge inside the scratch defect.
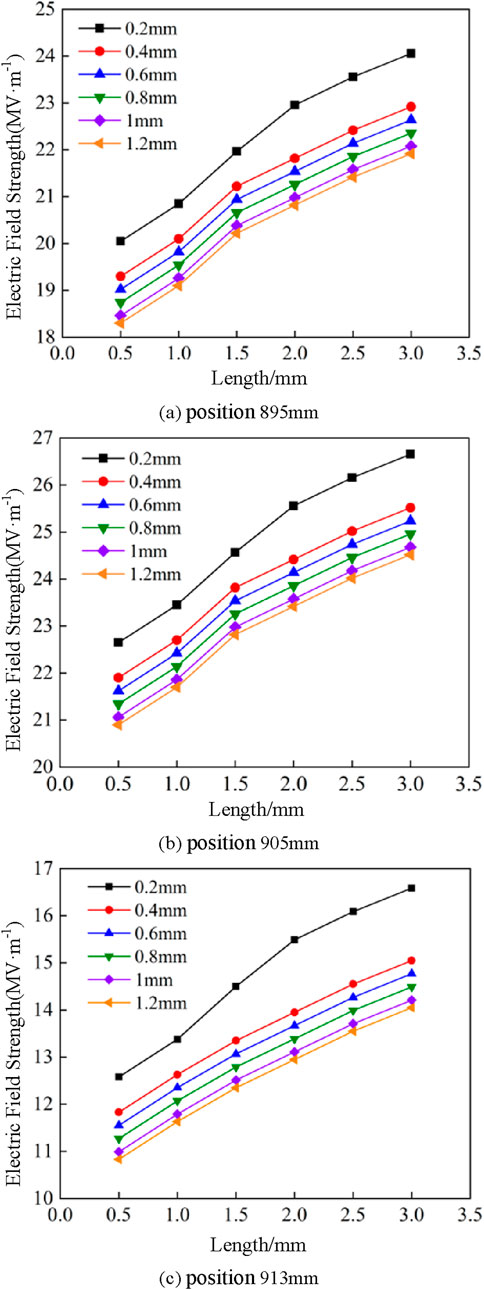
Figure 9. Maximum field strength in the air gap at different lengths.
The distribution of the maximum field intensity when the scratch defect was at different positions is shown in Figure 10. When the scratch defect was within 895–905 mm, the maximum value of the field intensity increased gradually with the position close to the root of the stress cone. When the scratch defect is located at 905 mm, because it is the root of the stress cone and the electric field is the most concentrated position, the introduction of the scratch defect leads to a large difference in the dielectric constant and severe electric field distortion, and the field strength increases significantly and reaches a maximum of approximately 4–5 times the field strength without defects. When the scratch defect was within 905–920 mm, as the position was far away from the root of the stress cone, the electric potential increased slowly, the electric field gradually evacuated, and the maximum value of the scratch defect field decreased rapidly.
Figure 10. Maximum field strength in air gap at different positions.
The distribution of the maximum field strength of scratch defects at different depths is shown in Figure 11. The maximum field strength at the scratch defect decreases with an increase in depth, as does the attenuation rate of the maximum field strength. For example, for the scratch defect with a length of 2.5 mm and a position of 900 mm, the maximum attenuation rate of the field strength is 3.74 at the depth of 0.2–0.4 mm, the attenuation rate decreases gradually at the depth of 0.4–1 mm, and the attenuation rate decreases to 0.8 when the depth is 1–1.2 mm, reducing by 80%. With an increase in the scratch defect depth, the air area increased, the field intensity distribution in the scratch defect became uniform, and the maximum value of the field intensity distortion decreased gradually. In contrast, the smaller the scratch defect depth, the more concentrated the field intensity, and the more obvious the field intensity distortion. Therefore, a scratch defect with a small depth is more likely to cause partial discharge, and it is necessary to avoid the appearance of shallow scratch defects during the actual production process.

Figure 11. Maximum field strength at air gap at different depths.
In Section 2, it is proven that the maximum field intensity at the defect interacts with the length, depth, and location of the defect. In this section, a multivariate nonlinear regression model is established to predict the maximum field strength based on the scratch defect size. With length, width, and position as independent variables x1, x2 and x3, and the maximum field strength as the dependent variable y. Equation 5 is a ternary cubic regression model, in which θ is an undetermined coefficient.
In the independent variables of the regression model, there was a large difference between the corresponding data for position, length, and depth. This easily causes the regression coefficient to be interpreted directly or misinterpreted, so that the correct calculation result of the field intensity cannot be obtained. Therefore, the data are normalized and fixed in the interval [0,1] before conducting the regression analysis. The conversion function is shown in Equation 6. Normalization will only compress the size of the data and will not change the distribution shape of the data, so the regression model obtained after normalization can be guaranteed to be consistent with the model obtained from the original data.
Where
The least square method was used for fitting to obtain Table 4, results of variance analysis and The regression coefficients of multivariate nonlinear regression equations shows in Table 5. According to Table 4, the maximum field strength under the influence of scratch size, F = 1309.25847 is much larger than F0.05(19,1069) = 1.596 and F0.01(19,1069) = 1.922, and R2 = 0.958, indicating that the simulation effect of the model is better.
Table 4. Variance analysis of regression models.

Table 5. Regression coefficient information of regression model.
Using t and P to test the significance of the regression factor, Table 5 shows the regression coefficient θ1-θ20 of p values <0.05, and |t | was greater than t (0.025, 1069) = 1.962; therefore, all the factors corresponding to the regression coefficient have great significance for the dependent variable y. The regression equation is shown in Equation 7: A regression equation can be used to predict the maximum field intensity. The maximum field strength obtained by Equation 7 is the value calculated after normalization, and the actual value calculated by the field strength can be obtained by reverse normalization. The conversion function is given by Equation 8.
In addition, scratch defects with different lengths, depths, and positions were selected. The simulation and regression models were used to calculate the maximum field strength at the defect, and the error rate was calculated to verify the accuracy of the optimized regression model. The calculation results are listed in Table 6. The above errors are all less than 5%, that is, there is no overfitting or underfitting in (7). Therefore, the regression model can accurately predict the maximum field strength at defects.
Table 6. Error rate of regression model
When the maximum field strength at the defect is greater than the air breakdown field strength of 3 × 10⁶ V/m, the defect is considered serious. If a terminal fault occurs at this time, it may be caused by a scratch defect in the main insulation. When the maximum field intensity at the defect was smaller than that of the air breakdown field, the probability of partial discharge was low, and the severity of the defect was considered to be minor. If a terminal fault occurs at this time, the possibility of a scratch defect is considered small.
In this paper, the electric-thermal coupling field simulation of the cable oil terminal with the scratch defect of the main insulation is carried out, and a prediction method of maximum field strength at defect based on multivariate nonlinear regression model is proposed. The influence of scratch defects of different lengths, depths and positions on the electric field of the terminal is analyzed, and it can be known when the terminal has a scratch defect of the main insulation, The internal field strength of scratch defects is distorted, but the surrounding insulation field strength is relatively small. When the length and depth of the defect 20 mm away from the root of the stress cone are 2 mm and 1 mm respectively, the maximum field strength at the defect is 1.45 × 10⁷V/m, which is far beyond the breakdown field strength of the air and is easy to cause partial discharge. At the same time, the maximum field strength at the defect will increase with the increase of length and decrease with the increase of depth. The maximum field strength at the defect gradually increases with the defect near the root of the stress cone. When the defect is located at the root of the stress cone, the field strength reaches the maximum, 4-5 times that of the defect free, and gradually decreases with the defect away from the stress cone. Therefore, it can be seen that the maximum field intensity at the defect is interacted with length, depth and location of the defect. A ternary cubic regression model was established to predict the maximum field strength according to scratch defect size. With length, width and position as independent variables, and the maximum field strength as dependent variable. With this method, the errors are all less than 5%. Thus, the proposed method can predict the maximum field intensity at the defect quickly and effectively, and evaluate the severity of the defect, which provides a new way of thinking for fault analysis.
The original contributions presented in the study are included in the article/supplementary material, further inquiries can be directed to the corresponding author.
ZR: Writing–original draft, Writing–review and editing, Methodology, Project administration. WG: Writing–review and editing, Data curation, Formal Analysis. HJ: Writing–original draft, Writing–review and editing, Data curation, Methodology. JG: Writing–review and editing, Formal Analysis. JC: Writing–review and editing, Validation, Visualization. YM: Writing–review and editing, Supervision, Validation. BL: Writing–review and editing, Methodology.
The author(s) declare that financial support was received for the research, authorship, and/or publication of this article. This paper is supported by Science and Technology Program of the State Grid Corporation of China (Grant No. 520223230016).
The authors would like to express gratitude to the editors and the reviewers for their constructive and helpful comments for substantial improvement of this paper.
The authors declare that the research was conducted in the absence of any commercial or financial relationships that could be construed as a potential conflict of interest.
The authors declare that this study received funding from Science and Technology Program of the State Grid Corporation of China. The funder had the following involvement in the study: study design, data collection and analysis, and preparation of the manuscript.
All claims expressed in this article are solely those of the authors and do not necessarily represent those of their affiliated organizations, or those of the publisher, the editors and the reviewers. Any product that may be evaluated in this article, or claim that may be made by its manufacturer, is not guaranteed or endorsed by the publisher.
Andrei, L., Irina, V., and Florin, C. (2014). “Electric field distribution in power cable insulation affected by various defects,” in Bucharest, Romania: IEEE international symposium on fundamentals of electrical engineering, 1–5.
Bai, L., Zhou, L., Cao, W., Che, Y., Xing, L., and Li, L. (2020a). Development characteristics of air gap discharge in EPR cable termination at-40 °C. High. Volt. Technol. 46 (10), 3605–3614. doi:10.13336/j.1003-6520.hve.20190363
Bai, L., Zhou, L., Xing, L., Li, L., Xiang, E., et al. (2020b). Influence of low temperature on discharge characteristics of ethylene-propylene rubber cable terminal interface in alpine environment. J. Electr. Technol. 35 (03), 646–658. doi:10.19595/j.cnki.1000-6753.tces.181955
Chang, W., Li, C., Su, Q., and Ge, Z. (2013). Study on the development process of partial discharge in spike defects of cable joints. China J. Electr. Eng. 33 (07), 192–201. doi:10.13334/j.0258-8013.pcsee.2013.07.026
EL-Bages, M., and Abd-Allah, M. (2016). Electric field distribution within underground power cables in presence of micro cracks. Int. J. Sci. Res. Publ. 6 (3).
Fang, C., Liu, H., Ren, Z., Guo, W., Li, J., Zhang, S., et al. (2019). Effect of silicone grease on interfacial electric field between crosslinked polyethylene insulation and silicone rubber. High. Volt. Electr. Appar. 55 (04), 65–71. doi:10.13296/j.1001-1609.hva.2019.04.010
Illias, H. A., Lee, Z. H., Bakar, A. H. A., Mokhlis, H., and Ariffin, A. M. (2012). “Distribution of electric field in medium voltage cable joint geometry [C],” in IEEE international conference on condition monitoring and diagnosis. Bali, Indonesia, 1051–1054.
Kumar, N. (2023). EV charging adapter to operate with isolated pillar top solar panels in remote locations. IEEE Trans. Energy Convers. 39, 29–36. doi:10.1109/tec.2023.3298817
Kumar, N., Mulo, T., and Verma, V. P. (2013). “Application of computer and modern automation system for protection and optimum use of High voltage power transformer,” in 2013 international conference on computer communication and informatics. IEEE, 1–5.
Kumar, N., Panigrahi, B. K., and Singh, B. (2016). A solution to the ramp rate and prohibited operating zone constrained unit commitment by GHS-JGT evolutionary algorithm. Int. J. Electr. Power and Energy Syst. 81, 193–203. doi:10.1016/j.ijepes.2016.02.024
Kumar, N., Saxena, V., Singh, B., and Panigrahi, B. K. (2020). Intuitive control technique for grid connected partially shaded solar PV-based distributed generating system. IET Renew. Power Gener. 14 (4), 600–607. doi:10.1049/iet-rpg.2018.6034
Kumar, N., Saxena, V., Singh, B., and Panigrahi, B. K. (2023b). Power quality improved grid-interfaced PV assisted onboard EV charging infrastructure for smart households consumers. IEEE Trans. Consumer Electron. 69, 1091–1100. doi:10.1109/tce.2023.3296480
Kumar, N., Singh, H. K., and Niwareeba, R. (2023a). Adaptive control technique for portable solar powered EV charging adapter to operate in remote location. IEEE Open J. Circuits Syst. 4, 115–125. doi:10.1109/ojcas.2023.3247573
Li, C., Wu, G., Li, C., Zhou, Y., Hou, S., and Han, B. (2018). Influence of defects in XLPE insulation HVDC cable terminals on electric field distribution. J. Electr. Mach. Control 22 (12), 62–67. doi:10.15938/j.emc.2018.12.008
Liu, R., Li, J., Tian, W., and Fan, Y. (2015). Partial discharge measurement and analysis of typical defects in XLPE power cable. High. Volt. Electr. Appar., 44–50. doi:10.13296/j.1001-1609.hva.2015.02.007
Lu, K. K., Fang, J., Huang, X. H., Fang, X. Y., Shen, Z., Song, W., et al. (2014). On prefabricated stress cone for HTS cable termination. IEEE Transactions on Applied Superconductivity 25 (6), 1–6. doi:10.1109/TASC.2015.2477376
Satapathy, S. S., and Kumar, N. (2019). “Modulated perturb and observe maximum power point tracking algorithm for solar PV energy conversion system[C],” in 2019 3rd international conference on recent developments in control, automation and power engineering (RDCAPE). IEEE, 345–350.
Sukanya Satapathy, S., and Kumar, N. (2020). Framework of maximum power point tracking for solar PV panel using WSPS technique. IET Renew. Power Gener. 14 (10), 1668–1676. doi:10.1049/iet-rpg.2019.1132
Sun, Y., Wang, S., Wang, Z., Jiao, L., Liu, H., Wang, W., et al. (2019). Analysis of 220kV outdoor cable terminal explosion accident. Jilin Electr. Power 47 (05), 47–49. doi:10.16109/j.cnki.jldl.2019.05.016
Tian, Y., Lewin, P. L., Davies, A. E., Sufton, S., and Swingler, S. (2003). Partial discharge detection in cables using VHF capacitive couplers. IEEE Trans. Dielectr. Electr. Insulation 10 (02), 343–353. doi:10.1109/tdei.2003.1194121
Wang, Z., Zhou, K., Zhu, G., Li, Z., Fu, Y., and Wang, Z. (2021). Effect of swelling of silicone grease on partial discharge of Tanabata defects at XLPE-SiR composite interface and its mechanism. High. Volt. Technol. 47 (12), 4245–4254. doi:10.13336/j.1003-6520.hve.20201606
Wu, W., Wang, F., Huang, Z., and Wang, Y. (2011). Simulation analysis of electric field-temperature field of 110kV high voltage power cable intermediate joint. Sensors Microsystems 30 (08), 15–21. doi:10.13873/j.1000-97872011.08.011
Yang, H. S., Liu, L., Sun, K., and Li, J. (2019). Impacts of different defects on electrical field distribution in cable joint. J. Eng. 16 (03), 3184–3187. doi:10.1049/joe.2018.8569
Yang, N., Yang, C., Wu, L., Shen, X., Jia, J., Li, Z., et al. (2021). Intelligent data-driven decision-making method for dynamic multisequence: an E-Seq2Seq-based SCUC expert system. IEEE Trans. Industrial Inf. 18 (5), 3126–3137. doi:10.1109/TII.2021.3107406
Yang, N., Xun, S., Liang, P., Ding, L., Yan, J., Xing, C., et al. (2024). Spatial-temporal optimal pricing for charging stations: a model-driven approach based on group price response behavior of EVs. IEEE Trans. Transp. Electrification, 1. doi:10.1109/tte.2024.3385814
Yasha, L., Dai, Y., Xu, H., Zhipeng, L., and Chengjiang, W. (2018). Influence of impurity on electric field and space charge distribution in XLPE cable. J. Electr. Technol. (18), 4365–4371. doi:10.19595/j.cnki.1000-6753.tces.171029
Keywords: cable oil terminal, field strength prediction, multivariate nonlinear regression, scratch defect of main insulation, the electric field
Citation: Ren Z, Guo W, Ji H, Geng J, Cai J, Men Y and Liu B (2024) Field strength prediction of 220 kV cable oil terminal defects based on multivariate nonlinear regression model. Front. Energy Res. 12:1462991. doi: 10.3389/fenrg.2024.1462991
Received: 11 July 2024; Accepted: 14 August 2024;
Published: 03 September 2024.
Edited by:
Zhengmao Li, Aalto University, FinlandReviewed by:
Yitong Shang, Hong Kong University of Science and Technology, Hong Kong SAR, ChinaCopyright © 2024 Ren, Guo, Ji, Geng, Cai, Men and Liu. This is an open-access article distributed under the terms of the Creative Commons Attribution License (CC BY). The use, distribution or reproduction in other forums is permitted, provided the original author(s) and the copyright owner(s) are credited and that the original publication in this journal is cited, in accordance with accepted academic practice. No use, distribution or reproduction is permitted which does not comply with these terms.
*Correspondence: Jing Cai, MTc5ODU1OTcxMUBxcS5jb20=
Disclaimer: All claims expressed in this article are solely those of the authors and do not necessarily represent those of their affiliated organizations, or those of the publisher, the editors and the reviewers. Any product that may be evaluated in this article or claim that may be made by its manufacturer is not guaranteed or endorsed by the publisher.
Research integrity at Frontiers
Learn more about the work of our research integrity team to safeguard the quality of each article we publish.