 Zhuyi Peng1
 Kanghui Gu
94% of researchers rate our articles as excellent or good
Learn more about the work of our research integrity team to safeguard the quality of each article we publish.
Find out more
ORIGINAL RESEARCH article
Front. Energy Res., 13 September 2024
Sec. Smart Grids
Volume 12 - 2024 | https://doi.org/10.3389/fenrg.2024.1460894
This article is part of the Research TopicOptimal Scheduling of Demand Response Resources In Energy Markets For High Trading Revenue and Low Carbon EmissionsView all 34 articles
With the increasing penetration of distributed energy in the distribution network, it is urgent to study how to ensure the stable and reliable operation of the power grid under fault conditions. To solve this problem, this study proposes a method for partitioning distribution network islands and reconstructing faults considering the Conditional Value at Risk (CVaR). This method aims to enhance the resilience of the distribution network and the recovery capability of critical loads. Initially, a partitioning model for distribution network islands based on depth-first and breadth-first search algorithms was constructed. Building upon this partitioning, a fault reconstruction method for distribution networks that considers CVaR was developed. This method utilizes CVaR theory to transform costs and quantifies the risk that the uncertainty of distributed energy resources poses to distribution network reconstruction strategies. Finally, the effectiveness of the proposed method is demonstrated using an improved IEEE 33-node system, generating typical fault scenarios.
The application of electricity has created more possibilities for humanity, but the traditional energy sources consumed by electricity are mostly non-renewable. The indiscriminate exploitation of nature by people has disrupted the natural balance (Stott et al., 2016). The complexity of the power system structure and the continuous increase in the penetration rate of new energy also bring new challenges to the stability of the power system (Song et al., 2012; Zheng et al., 2023; Ghavam et al., 2021). Extreme weather events, such as typhoons and ice and snow disasters, pose significant risks to the power system (Shukla et al., 2022). Therefore, enhancing the disaster resistance capability of the power system and improving the resilience of the distribution network is crucial for ensuring the stability of power supply and the healthy economic development of the country.
As a traditional control method, distribution network reconfiguration is a strategy that optimizes the performance of the distribution network by adjusting the network topology (i.e., changing the status of section switches and tie switches on the lines) (Monteiro et al., 2020; Ahmadi et al., 2021; Mahabadi et al., 2015; Matayoshi et al., 2020). Reference (Barnwal et al., 2022) proposes a method to improve the voltage stability of radial distribution networks and reduce power loss by optimizing the configuration of distributed power sources and network reconfiguration for voltage control. Reference (Zhong et al., 2020), based on an improved multi-objective Bayesian learning evolutionary algorithm, proposes a solution for the reconfiguration problem of distribution networks with high penetration of wind power, balancing between absorption rate and voltage stability. Reference (Wang et al., 2020) utilizes a Markov decision process model and proposes a state-based sequential network reconfiguration strategy aimed at minimizing curtailment and load shedding of renewable distributed generation under operational constraints. Reference (Paterakis et al., 2015) sets a common reliability index according to the number of users, with the goal of minimizing active power loss, and determines the optimal radial reconfiguration scheme.
DGs can provide electricity to local loads and operate in island mode when the upper-level power grid experiences a fault, significantly enhancing the reliability of the power supply in the distribution system. Reference (Shukla et al., 2018) discusses intentional islanding for distributed generation and voltage control by optimizing the adjustment of capacitor banks and voltage regulators. Reference (Ma et al., 2022) propose a communication-based detection method based on topology graph path query that can achieve improved results by useing existing communication technology and intelligent electronic devices (IEDs) in distribution networks to construct a distributed islanding information system. To improve the operation economy in the grid-connected mode and enhance the energy supply reliability in the islanded mode, reference (Cao et al., 2024) probose a multi-objective stochastic optimization approach for planning the multi-energy microgrid considering unscheduled islanded operation. Reference (Zhu et al., 2018) builds a risk assessment model for island operation of DG that includes wind power and photovoltaics, as well as load forecasting, and proposes a dynamic island partitioning strategy. Reference (Jingxiang et al., 2017), considering the energy risk of microgrids, proposes a multi-objective island partitioning model. Reference (Faria et al., 2021), considering the constraints of distributed power source output adjustment and reactive power compensation by capacitor banks, constructs a model for island partitioning in active distribution networks and uses a depth-first search algorithm for island partitioning. Considering the intermittent energy sources such as photovoltaics and wind power that may be included in the distribution network, these islanding strategies may be difficult to ensure power balance during islanding operations in practical implementation.
DGs, typically located near users, can form power islands to continuously supply power to non-fault power outage areas during the period from fault occurrence to fault recovery. By analyzing the location of the fault and using the operation of switches, non-fault power outage areas can be restored to power supply, which is the fault recovery reconfiguration of the distribution network (Hamida et al., 2018; Wang et al., 2019). With the large-scale integration of DGs, the traditional single power source has become multiple power sources, making the optimization problem of the distribution network more complex, and how to solve the problem of fault recovery reconfiguration of the distribution network has increasingly become a research goal (Fan et al., 1996; Ghasemi et al., 2019; Zhang and Lu, 2013). However, the optimization strategy for power supply restoration is a problem involving multiple objectives and multiple constraints, and a perfect solution has not yet been provided in mathematics (Chen et al., 2014). Reference (Razavi et al., 2021) proposes a comprehensive method for improving the daily performance of active distribution networks containing renewable resources and responsive loads through distribution network reconfiguration, and determines the impact of renewable resources performance based on the Markov model. Reference (Li et al., 2018)develops the PV and PQ models of distributed power sources, and transforms the fault recovery problem in actual disasters into a mixed integer second-order conic programming problem, with the goal of minimizing the power outage load and the number of switch operations to optimize the power restoration plan. Reference (Xu et al., 2016) focuses on the impact of DG output instability on islanding strategy, considering the constraints of transient voltage, frequency deviation, and microgrid stability during the distribution network recovery process. Reference (Gao et al., 2016) studies the use of DG as auxiliary resources in conjunction with the main grid, and determines the optimal recovery strategy through the collaborative action of the two.
The aforementioned studies have primarily focused on incorporating uncertainty into predictive output models for distribution network fault recovery, with less consideration given to the risks that the uncertainty of distributed power sources poses on various strategies within the context of distribution network islanding and network reconfiguration. Therefore, this paper conducts research around the strategies for islanding division and fault reconstruction in distribution networks. It first proposes the objective function and constraints for island division, performs island division using a depth-first search algorithm, establishes an island division model, and derives the corresponding results. Building upon this foundation, the paper introduces the uncertainty of distributed power sources, generates classic fault scenarios using a fault scenario generation method, and quantifies the risks that the uncertainty of distributed power sources may pose to distribution network fault reconstruction strategies based on CVaR. Additionally, it proposes maintenance strategies for the distribution network to enhance its resilience. Finally, the effectiveness of the methods proposed in this paper is validated using the IEEE 33-bus system.
The core objective of distribution network island partitioning is to quickly segregate parts of the grid into independently operating small regions, known as “islands,” in the event of certain permanent faults. These islands are capable of being self-sufficient and continue to provide power to critical loads.
As illustrated in Figure 1, under extreme disasters, faults occur in the distribution network lines, and the power paths represented by the red solid lines F1 and F2 become unavailable. At this time, if the distributed energy resources within the distribution network are mobilized to temporarily substitute for the supply from higher-level nodes to the nodes without power, short-term power restoration can be achieved. As shown in the figure, nodes seven and eight can form an island, where the distributed energy resources within the island can supply power to nodes seven and 8, with the island outlined by the red dashed line. Additionally, the DG at node 4 can form a new island with other connected nodes, thus restoring power supply in the distribution network.
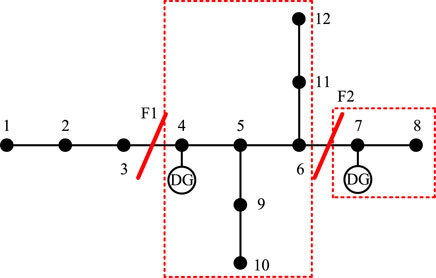
Figure 1. Island node graph.
Island partitioning refers to the process of dividing an entire topological graph into multiple subgraphs based on specific rules and constraints, which involves methods of graph traversal. Depth-First Search (DFS) and Breadth-First Search (BFS), which are depicted in Figure 2, are two fundamental graph search algorithms widely used in the field of data structures and algorithms, particularly in solving pathfinding and graph traversal problems.
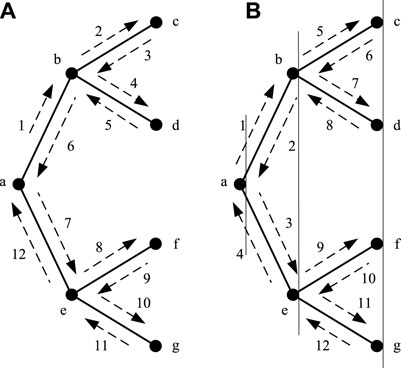
Figure 2. Visual comparisons of original models. (A) DFS (B) BFS.
DFS is an algorithm used for traversing or searching a tree or graph. It starts at a selected node and explores as deeply as possible along each branch before backtracking to the previous junction to explore unvisited branches. As shown in Figure 2A, assuming the search starts from node a, the search path is a-b-c-b-d-b-a-e-f-e-g-e-a. At the same time, there is another search path, a-e-g-e-f-e-a-b-b-d-b-a. BFS is another algorithm for traversing or searching trees and graphs. It begins at the root node and explores all adjacent nodes at the present depth prior to moving on to nodes at the next depth level, repeatedly applying this process to each visited node, expanding outward layer by layer. As shown in Figure 2B, starting from node a, follow the path a-b-a-e-a, and then sequentially access the adjacent nodes of nodes b and c, such as b-c-b-d-b and e-f-e-g-e.
DGs have transformed the way power is supplied in distribution networks, enhancing energy utilization efficiency. In the event of a fault, DGs can either fully restore power through black start capabilities or partially restore power in an islanded mode with loads. The recovery strategy prioritizes critical loads, using Breadth-First Search to partition islands, and employs Depth-First Search to adjust the partitioning if necessary. Under permanent faults, DGs define the supply range based on predicted output, aiming to minimize the impact of power outages. However, it is important to consider the output capacity limitations of DGs and establish partitioning criteria:
Critical Load Priority Criterion: In distribution network planning, loads are often categorized into primary, secondary, and tertiary based on their nature. To ensure the overall balance of the distribution network and prevent secondary incidents, some lower-priority loads may be sacrificed to prioritize higher-priority loads.
Minimum Network Loss Criterion: An island partitioning method is chosen to minimize internal power loss within each island, which helps maintain the efficiency and cost-effectiveness of the power system.
Switch Operation Criterion: Changes in the switch status within the distribution network incur losses and generate harmonic fluctuations. Therefore, minimizing the number of switch operations is essential.
When faults occur in the distribution network, it is necessary to minimize the loss of power to loads as much as possible. For the part of the distribution network outside of the islands, fault recovery is achieved by controlling the state of switches, a process known as restorative network reconfiguration. The main goal of island partitioning is to restore power to more critical loads while ensuring the economic efficiency of the distribution network. Additionally, reducing network losses to enhance economic efficiency is considered. The objective function can be expressed as follows:
Where,
Each island must satisfy radial constraints to ensure that no new islands or mesh networks are formed within each island. The radial structure of the distribution network can be represented by the principles of a tree diagram as follows:
In the formula,
Additionally, it is necessary to satisfy constraints such as power flow equations, line current carrying capacity, and the number of switch operations.
Where,
Island partitioning must also consider power balance constraints. During the island construction process, it is essential to prioritize ensuring the balance between the available generation capacity of DGs and the demand of the island loads. The output capacity of the DGs should at least meet the demand of the loads within the island. If the maximum output of the DGs cannot satisfy all the load demands of the island, it may lead to issues such as voltage drops and frequency instability, threatening system stability. Therefore, achieving power balance is crucial:
Where,
The island division flowchart is depicted in Figure 3.
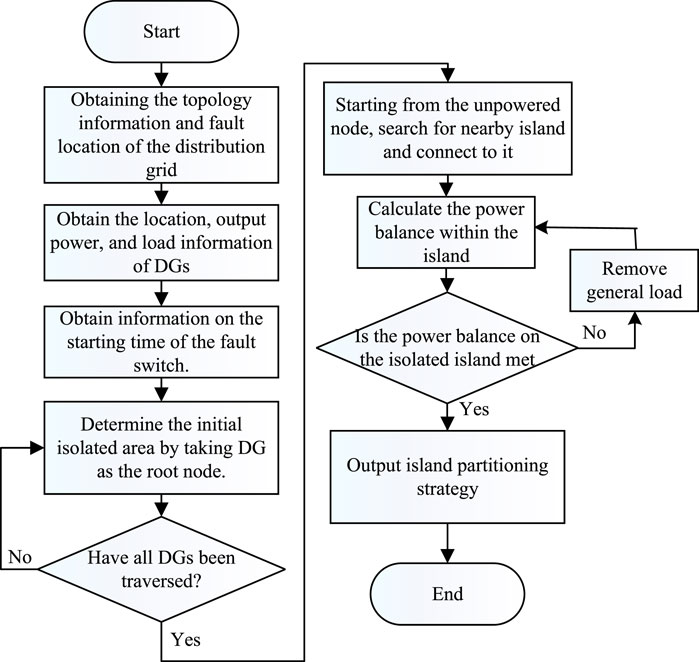
Figure 3. Island division flowchart.
Based on the island division, this paper addresses the uncertainty of distributed power sources using the probabilistic scenario method. It utilizes the Latin Hypercube Sampling (LHS) method to generate scenarios and employs the K-means algorithm to reduce the number of scenarios to typical fault scenarios. On this basis, the uncertainty of distributed power sources is handled, and the cost function includes operational costs, reconfiguration costs, and network loss costs.
Where,
Where,
During the reconstruction process, the number of switch operations should be minimized to reduce wear and tear. The equivalent loss cost of the switch lifespan is incorporated into the cost function as follows:
Where,
The total cost function can be expressed as Equation 15:
Portfolio theory suggests that by diversifying across various securities, the overall return of the portfolio manifests as the weighted average of the returns of individual securities, while the risk is significantly lower than investing in a single security alone. This indicates that a portfolio can effectively reduce risk.
In the field of renewable energy, such as wind and solar power, there is significant randomness and intermittency, akin to the risks of investing in individual securities in investment theory. This means that relying on a single type of DG for power supply can often lead to frequent interruptions. Similarly, to combining multiple securities in a portfolio, we can combine different types of distributed energy sources and apply portfolio theory to effectively reduce the overall risk of the system.
By incorporating the CVaR model into the aforementioned reconstruction model, we can quantify the risk brought about by the uncertainty of distributed energy resources. For node
Where,
Finally, the fault reconstruction function of CVaR can be expressed as Equation 19:
Where,
Section 1.2 has already described the model constraints including the power flow equations, line current carrying capacity constraints, radial constraints, and power balance constraints. Building upon this, we consider adding repair strategy constraints to enhance the resilience of the distribution network:
During the recovery process from extreme disasters, various levels of the power grid need to urgently dispatch repair crews to sequentially inspect and repair the faulty lines. The completion of repairs on these lines allows isolated sections to reconnect with the main grid, thereby improving the stability of the distribution network. However, the number of repair crews is limited; they cannot repair all faulted lines simultaneously. Therefore, it is necessary to develop a repair strategy for the crews. This section introduces the set of faulted lines Lf, the set of repair crews
Where,
The refactoring strategy flowchart is depicted in Figure 4.
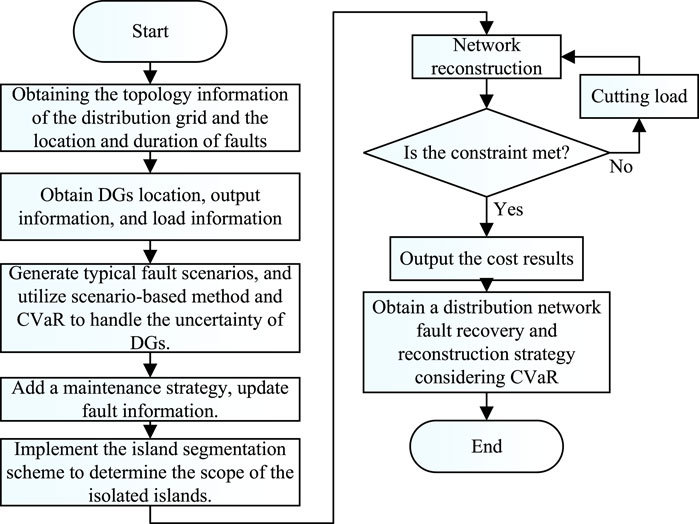
Figure 4. Refactoring strategy flowchart.
This paper utilizes the modified IEEE 33-bus distribution system as a case study for analysis. This system has a base voltage of 12.66 kV and includes 32 normally closed switches, 5 tie switches, totaling 37 branches. The maximum load at each node and the branch impedances are detailed in Supplementary Appendix Table 2. In this chapter, PV and WT, two types of distributed energy resources, are added to the modified IEEE 33-node system. PV systems are installed at nodes 7, 13, and 27, while wind power systems are installed at nodes 10, 16, 17, 30, and 33. Gas turbines are installed at nodes 11, 21, and 33. Specific parameters can be found in Supplementary Appendix Table 3. Simulations are performed using MATLAB.
This paper uses a standard dataset of PV and wind power outputs from a region in Northwest China for testing. Without considering equipment faults, random sampling based on the predicted active power output of distributed energy resources at each node is conducted. This generates 2,400 equally probable distributed power output scenarios. These scenarios are then reduced to create a typical set of fault scenarios, including 10 output scenarios each for three PV and five wind power locations. The multi-scenario output of each distributed energy resource is shown in Figure 5.
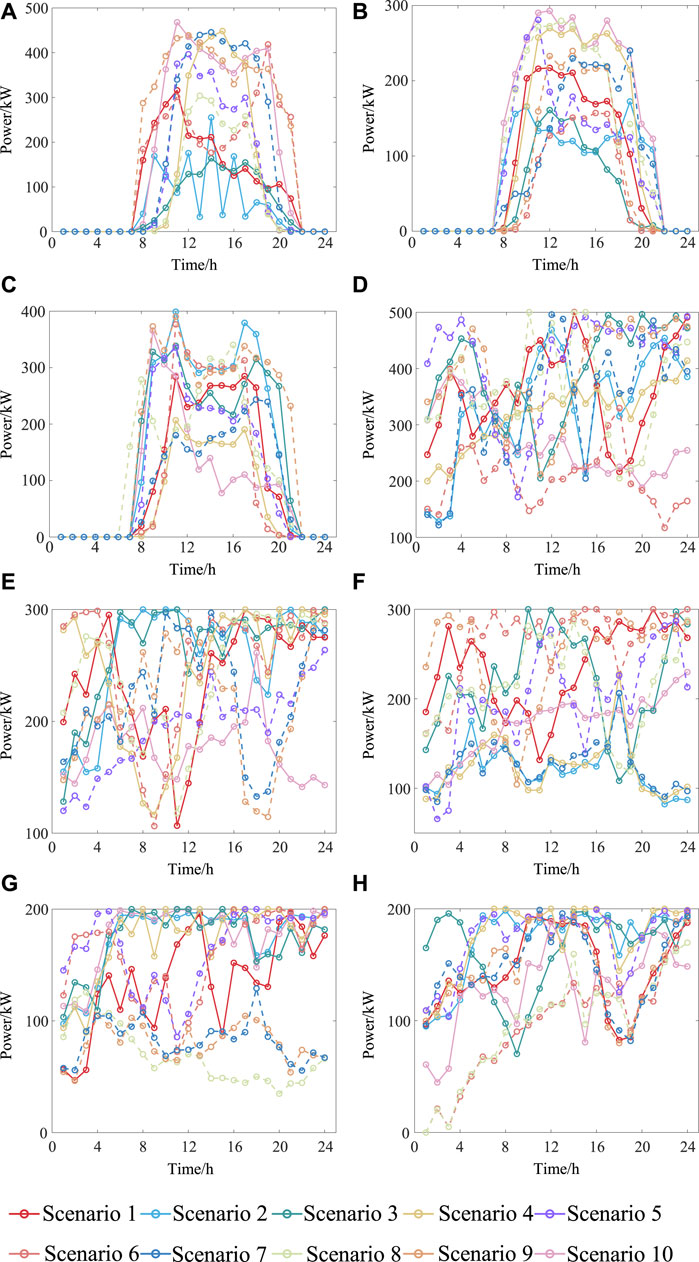
Figure 5. Multi scenario distributed power output. (A) Multi scenario output of PV1 (B) Multi scenario output of PV2 (C) Multi scenario output of PV3 (D) Multi scenario output of WT1 (E) Multi scenario output of WT2 (F) Multi scenario output of WT3 (G) Multi scenario output of WT4 (H) Multi scenario output of WT5.
To closely approximate the actual conditions of real distribution networks, each node is equipped with loads of different proportions and levels. In this configuration, yellow represents level one load, red represents level two load, and blue represents level three load. The corresponding weight coefficients for these three categories of load are 100:10:1, respectively. As shown in Figure 6, the upper part of the diagram displays the distribution of each type of load within each node, with the x-axis representing the node number and the y-axis representing the power size. The lower part of the diagram shows the load demand of each category over 24 h, with the x-axis representing time and the y-axis representing power.
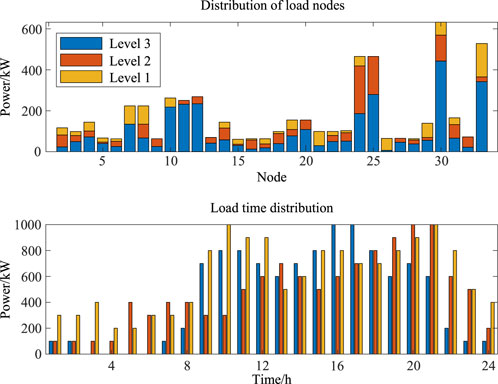
Figure 6. Load distribution at all levels.
Assume that the system branches 6–7, 12–13, 2–19, 21–22, 24–25, and 32–33 suffer permanent faults, with the fault duration from 8:00 to 12:00, divided into four time periods. Each node is then partitioned into islands, and the distribution network undergoes fault reconstruction. In the initial stage of the fault, distributed energy resources within each island supply power to various types of loads within that island. Simultaneously, the repair crews begin their work, with each crew needing 1 h to repair a fault, and let L = 0.5.
Under the various constraints mentioned above, the distribution network is partitioned into islands and the fault reconstruction solution is sought. The results are shown in Figure 7. From the figure, we can see that during the fault recovery process of the distribution network, as the repair crews complete their work, more switches become available for use, facilitating better results in network reconstruction. For example, in the second time period, line switch 12–13 is repaired by the crew, allowing two adjacent islands to merge, enlarging the island size and facilitating subsequent synchronization with the main grid. In the third time period, line switch 2–19 is repaired by the crew, allowing some nodes within the island to directly connect with the main grid and leave the island. The main grid can directly supply power to nodes 7, 8, 19, 20, and 21, relying on the main grid to improve the overall load recovery rate. Similarly, in the fourth time period, nodes 16, 17, 18, and 33 are no longer in island operation, and the main grid can directly supply power to them.
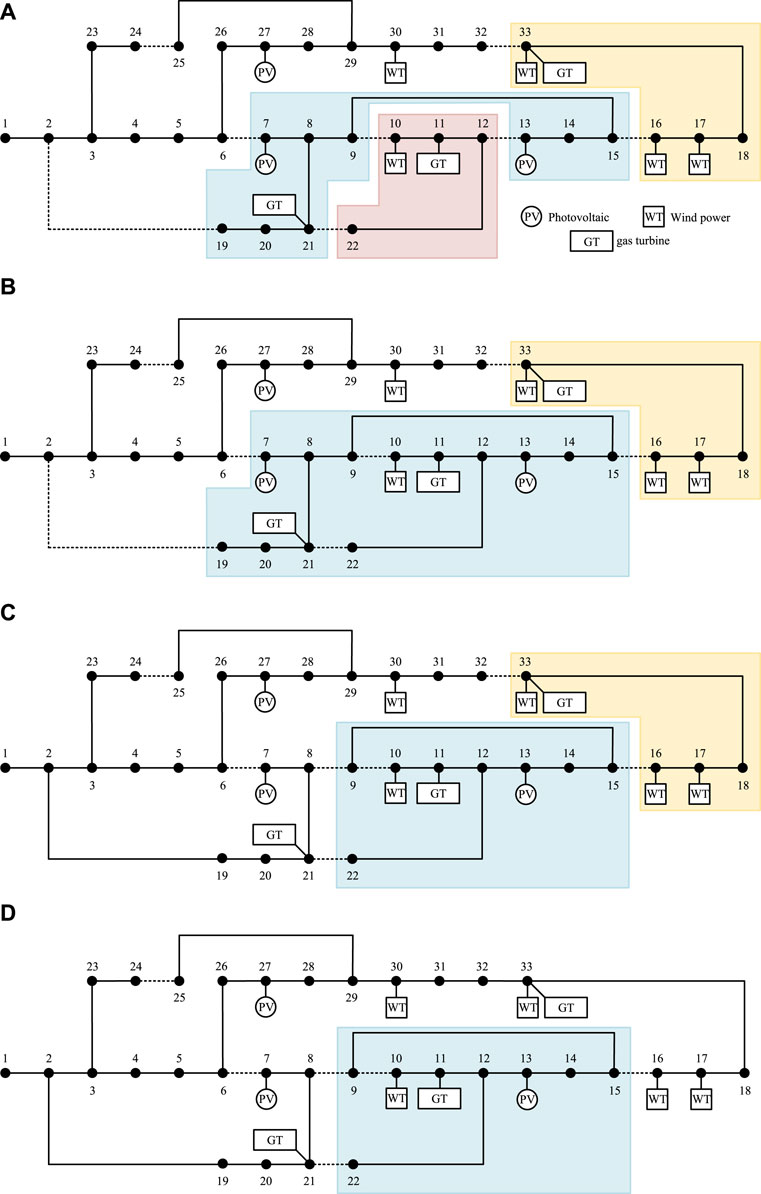
Figure 7. Island division and fault reconstruction results in different time periods. (A) Island division and fault reconstruction results in time period 1. (B) Island division and fault reconstruction results in time period 2. (C) Island division and fault reconstruction results in time period 3. (D) Island division and fault reconstruction results in time period 4.
The switch status, island conditions, and level one load recovery rates are shown in Table 1.
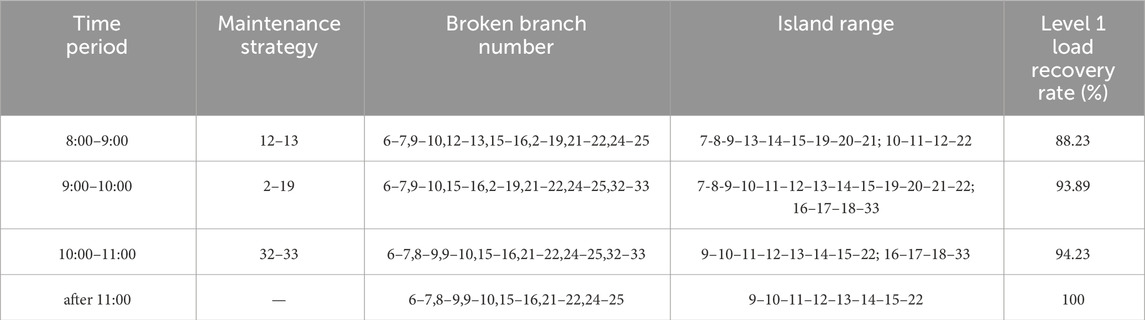
Table 1. Result of fault reconstruction.
Figure 8 shows the node load recovery rate for each fault period, with the x-axis representing the node number and the y-axis representing the percentage recovery rate. Yellow represents level one load, red represents level two load, and blue represents level three load. It can be observed that the load at most nodes is gradually being restored, indicating that the distribution network is progressively stabilizing. The load within each island also changes over time. In practice, the demand for each level of load continues to increase. Correspondingly, the output from wind and photovoltaic power also increases during the fault period. As shown in the Figure 9. Overall, the load recovery rate is gradually rising.
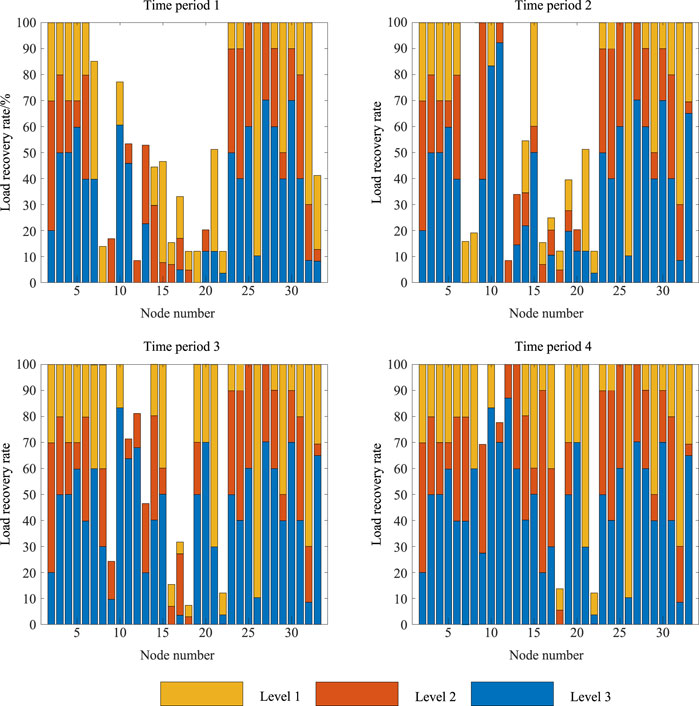
Figure 8. Island division flowchart.
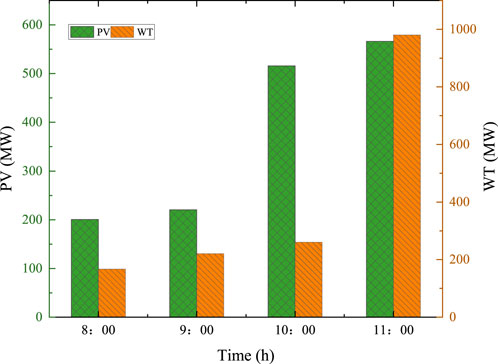
Figure 9. Output of renewable energy units.
The selection of the risk preference coefficient in the CVaR theoretical model significantly impacts the total reconstruction cost and the CVaR value of the distribution network. The relationship between total cost and CVaR value can be characterized by the efficient Frontier curve shown in Figure 10. It can be observed that as the risk preference coefficient decreases, the attitude towards uncertainty risk in the reconstruction strategy shifts from conservative to aggressive. Consequently, the total reconstruction cost gradually decreases, while the CVaR value gradually increases. This curve quantifies the total fault cost and the risk faced by decision-makers, allowing them to choose the risk preference coefficient and formulate fault reconstruction strategies under different expectations.
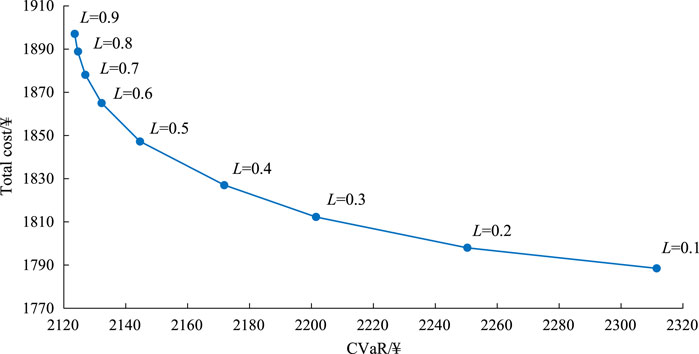
Figure 10. Island division flowchart.
If the decision-maker is relatively conservative, the output of distributed energy resources is adjusted to a lower level, avoiding most situations where the load demand cannot be met due to insufficient output from distributed energy resources. This adjustment reduces the costs associated with equipment regulation and switch operations, but it results in higher costs for curtailed wind and solar power, leading to higher total costs and lower system risk. On the other hand, if the decision-maker becomes aggressive, expecting higher levels of output from distributed energy resources, the output will be set to a higher level, reducing the costs of curtailed wind and solar power. However, if the output from distributed energy resources is insufficient, it will cause the fault reconstruction strategy to fail, increasing the lost load cost. At the same time, more costs will have to be incurred for regulation and switch operations to adjust the strategy to cope with the insufficient output from distributed energy resources, thereby increasing the system risk.
This article proposes a method for partitioning distribution network islands and reconstructing faults considering the CVaR. Through case analysis, the following conclusions are drawn:
1. This article takes the improved IEEE-33 node system as an example to verify the effectiveness of the islanding strategy and its model. The results indicate that when faced with faults in the distribution network, the strategic use of distributed power sources within the network and the reconstruction of islanding can effectively restore important loads and improve the stability and safety of the distribution network.
2. With the implementation of island partitioning and fault reconstruction strategies, the number of disconnected branches continues to decrease, and the range and number of islands are also constantly shrinking and decreasing. In the face of extreme disasters, the fault area is constantly shrinking, and the node load is effectively restored.
3. As the risk preference coefficient L decreases, the attitude of the reconstruction strategy towards uncertain risks shifts from conservative to aggressive, the total cost of reconstruction gradually decreases, and the CVaR value gradually increases.
The original contributions presented in the study are included in the article/Supplementary Material, further inquiries can be directed to the corresponding author.
ZP: Formal Analysis, Investigation, Methodology, Software, Writing–original draft. WZ: Investigation, Resources, Writing–review and editing. WX: Investigation, Methodology, Project administration, Writing–review and editing. HC: Software, Validation, Writing–review and editing. FZ: Data curation, Formal Analysis, Writing–review and editing. XH: Investigation, Resources, Writing–review and editing. KG: Conceptualization, Funding acquisition, Supervision, Writing–review and editing.
The author(s) declare that financial support was received for the research, authorship, and/or publication of this article. This work was supported by Technology Project of State Grid Jiangsu Electric Power Co., Ltd. Economic and Technical Research Institute, China, grant number J2023149.
The authors sincerely acknowledge the contribution of all individuals, reviewers, and editors for their contribution toward the production of this manuscript.
Authors ZP, WZ, HC, FZ, and XH were employed by State Grid Jiangsu Electric Power Co., Ltd. Authors WX and KG were employed by China Energy Engineering Group Jiangsu Electric Power Design Institute Co., Ltd.
The authors declare that this study received funding from Technology Project of State Grid Jiangsu Electric Power Co., Ltd. The funder had the following involvement in the study: the design, collection, analysis and interpretation of data.
All claims expressed in this article are solely those of the authors and do not necessarily represent those of their affiliated organizations, or those of the publisher, the editors and the reviewers. Any product that may be evaluated in this article, or claim that may be made by its manufacturer, is not guaranteed or endorsed by the publisher.
The Supplementary Material for this article can be found online at: https://www.frontiersin.org/articles/10.3389/fenrg.2024.1460894/full#supplementary-material
Ahmadi, M., Adewuyi, O. B., Danish, M. S. S., Mandal, P., Yona, A., and Senjyu, T. (2021). Optimum coordination of centralized and distributed renewable power generation incorporating battery storage system into the electric distribution network. Int. J. Electr. Power and Energy Syst. 125, 106458. doi:10.1016/j.ijepes.2020.106458
Barnwal, A. K., Yadav, L. K., and Verma, M. K. (2022). A multi-objective approach for voltage stability enhancement and loss reduction under pqv and p buses through reconfiguration and distributed generation allocation. IEEE Access 10, 16609–16623. doi:10.1109/access.2022.3146333
Cao, Y., Mu, Y., Jia, H., Yu, X., Hou, K., and Wang, H. (2024). A multi-objective stochastic optimization approach for planning a multi-energy microgrid considering unscheduled islanded operation. IEEE Trans. Sustain. Energy 15, 1300–1314. doi:10.1109/tste.2023.3341898
Chen, K., Wu, W., Zhang, B., and Sun, H. (2014). Robust restoration decision-making model for distribution networks based on information gap decision theory. IEEE Trans. Smart Grid 6, 587–597. doi:10.1109/tsg.2014.2363100
Fan, J.-Y., Zhang, L., and McDonald, J. D. (1996). Distribution network reconfiguration: single loop optimization. IEEE Trans. Power Syst. 11, 1643–1647. doi:10.1109/59.535709
Faria, W. R., Carvalho, E. O., Dantas, L. B., Maciel, C. D., Alberto, L. F., London Jr, J. B., et al. (2021). Service restoration in modern distribution systems addressing grid-connected and islanded operations. Electr. Power Syst. Res. 196, 107238. doi:10.1016/j.epsr.2021.107238
Gao, H., Chen, Y., Xu, Y., and Liu, C.-C. (2016). Resilience-oriented critical load restoration using microgrids in distribution systems. IEEE Trans. Smart Grid 7, 2837–2848. doi:10.1109/tsg.2016.2550625
Ghasemi, S., Khodabakhshian, A., and Hooshmand, R.-a. (2019). New multi-stage restoration method for distribution networks with dgs. IET Generation, Transm. and Distribution 13, 55–63. doi:10.1049/iet-gtd.2018.5624
Ghavam, S., Vahdati, M., Wilson, I., and Styring, P. (2021). Sustainable ammonia production processes. Front. Energy Res. 9, 34. doi:10.3389/fenrg.2021.580808
Hamida, I. B., Salah, S. B., Msahli, F., and Mimouni, M. F. (2018). Optimal network reconfiguration and renewable dg integration considering time sequence variation in load and dgs. Renew. energy 121, 66–80. doi:10.1016/j.renene.2017.12.106
Jingxiang, Z., Huanna, N., and Xiaoxue, Z. (2017). Island partition of distribution network with microgrid based on the energy at risk. IET Generation, Transm. and Distribution 11, 830–837. doi:10.1049/iet-gtd.2016.0271
Li, Y., Xiao, J., Chen, C., Tan, Y., and Cao, Y. (2018). Service restoration model with mixed-integer second-order cone programming for distribution network with distributed generations. IEEE Trans. Smart Grid 10, 4138–4150. doi:10.1109/tsg.2018.2850358
Ma, J., Zheng, H., Zhao, J., Chen, X., Zhai, J., and Zhang, C. (2022). An islanding detection and prevention method based on path query of distribution network topology graph. IEEE Trans. Sustain. Energy 13, 81–90. doi:10.1109/tste.2021.3104463
Mahabadi, A., Khonsari, A., Khodabandeloo, B., Noori, H., and Majidi, A. (2015). Critical path-aware voltage island partitioning and floorplanning for hard real-time embedded systems. Integration 48, 21–35. doi:10.1016/j.vlsi.2014.05.002
Matayoshi, H., Kinjo, M., Rangarajan, S. S., Ramanathan, G. G., Hemeida, A. M., and Senjyu, T. (2020). Islanding operation scheme for dc microgrid utilizing pseudo droop control of photovoltaic system. Energy Sustain. Dev. 55, 95–104. doi:10.1016/j.esd.2020.01.004
Monteiro, R. V. A., Bonaldo, J. P., da Silva, R. F., and Bretas, A. S. (2020). Electric distribution network reconfiguration optimized for pv distributed generation and energy storage. Electr. Power Syst. Res. 184, 106319. doi:10.1016/j.epsr.2020.106319
Paterakis, N. G., Mazza, A., Santos, S. F., Erdinç, O., Chicco, G., Bakirtzis, A. G., et al. (2015). Multi-objective reconfiguration of radial distribution systems using reliability indices. IEEE Trans. Power Syst. 31, 1048–1062. doi:10.1109/tpwrs.2015.2425801
Razavi, S.-M., Momeni, H.-R., Haghifam, M.-R., and Bolouki, S. (2021). Multi-objective optimization of distribution networks via daily reconfiguration. IEEE Trans. Power Deliv. 37, 775–785. doi:10.1109/tpwrd.2021.3070796
Shukla, A., Austgen, B., Kutanoglu, E., and Hasenbein, J. (2022). “Budget allocation in optimizing power grid resilience to extreme weather: hardening, preparation, or recovery?,” in IIE annual conference. Proceedings (Institute of industrial and systems engineers (IISE)), 1–6.
Shukla, J., Das, B., and Pant, V. (2018). Stability constrained optimal distribution system reconfiguration considering uncertainties in correlated loads and distributed generations. Int. J. Electr. Power and Energy Syst. 99, 121–133. doi:10.1016/j.ijepes.2018.01.010
Song, I.-K., Jung, W.-W., Kim, J.-Y., Yun, S.-Y., Choi, J.-H., and Ahn, S.-J. (2012). Operation schemes of smart distribution networks with distributed energy resources for loss reduction and service restoration. IEEE Trans. Smart Grid 4, 367–374. doi:10.1109/tsg.2012.2233770
Stott, P. A., Christidis, N., Otto, F. E., Sun, Y., Vanderlinden, J.-P., van Oldenborgh, G. J., et al. (2016). Attribution of extreme weather and climate-related events. Wiley Interdiscip. Rev. Clim. Change 7, 23–41. doi:10.1002/wcc.380
Wang, C., Lei, S., Ju, P., Chen, C., Peng, C., and Hou, Y. (2020). Mdp-based distribution network reconfiguration with renewable distributed generation: approximate dynamic programming approach. IEEE Trans. Smart Grid 11, 3620–3631. doi:10.1109/tsg.2019.2963696
Wang, F., Xiao, X., Sun, Q., Chen, C., Bin, F., Chen, S., et al. (2019). Service restoration for distribution network with dgs based on stochastic response surface method. Int. J. Electr. Power and Energy Syst. 107, 557–568. doi:10.1016/j.ijepes.2018.12.015
Xu, Y., Liu, C.-C., Schneider, K. P., Tuffner, F. K., and Ton, D. T. (2016). Microgrids for service restoration to critical load in a resilient distribution system. IEEE Trans. Smart Grid 9, 426–437. doi:10.1109/tsg.2016.2591531
Zhang, M. G., and Lu, Y. Y. (2013). Distribution network restoration reconfiguration based on an pso-aco hybrid approach. Appl. Mech. Mater. 313, 1327–1330. doi:10.4028/www.scientific.net/amm.313-314.1327
Zheng, Q., Zheng, J., Mei, F., Gao, A., Zhang, X., and Xie, Y. (2023). Tcn-gat multivariate load forecasting model based on shap value selection strategy in integrated energy system. Front. Energy Res. 11, 1208502. doi:10.3389/fenrg.2023.1208502
Zhong, T., Zhang, H.-T., Li, Y., Liu, L., and Lu, R. (2020). Bayesian learning-based multi-objective distribution power network reconfiguration. IEEE Trans. Smart Grid 12, 1–1184. doi:10.1109/tsg.2020.3027290
Keywords: distribution network fault reconstruction, island division, load recovery, conditional risk at value, depth and breadth first search method, renewable energy
Citation: Peng Z, Zhang W, Xu W, Cai H, Zhao F, Han X and Gu K (2024) Conditional value at risk-based island partitioning and fault restoration reconfiguration of active distribution networks. Front. Energy Res. 12:1460894. doi: 10.3389/fenrg.2024.1460894
Received: 07 July 2024; Accepted: 02 August 2024;
Published: 13 September 2024.
Edited by:
Yang Gao, Shanghai Jiao Tong University, ChinaReviewed by:
Junyi Zhai, China University of Petroleum, ChinaCopyright © 2024 Peng, Zhang, Xu, Cai, Zhao, Han and Gu. This is an open-access article distributed under the terms of the Creative Commons Attribution License (CC BY). The use, distribution or reproduction in other forums is permitted, provided the original author(s) and the copyright owner(s) are credited and that the original publication in this journal is cited, in accordance with accepted academic practice. No use, distribution or reproduction is permitted which does not comply with these terms.
*Correspondence: Kanghui Gu, Z3VrYW5naHVpQHNpbmEuY29t
Disclaimer: All claims expressed in this article are solely those of the authors and do not necessarily represent those of their affiliated organizations, or those of the publisher, the editors and the reviewers. Any product that may be evaluated in this article or claim that may be made by its manufacturer is not guaranteed or endorsed by the publisher.
Research integrity at Frontiers
Learn more about the work of our research integrity team to safeguard the quality of each article we publish.