- 1Institute of Chemical Engineering and Environmental Technology, Graz University of Technology, Graz, Austria
- 2VERBUND Thermal Power GmbH & Co KG, Fernitz-Mellach, Austria
The assessment of PEM water electrolyzer (PEMWE) degradation is essential for understanding their long-term durability and performance under real-world conditions. This research focuses on the fluoride emission rate (FER) as a crucial parameter during PEMWE operation. Two different FER analysis methods were evaluated, considering their feasibility and ease of integration into a PEMWE system. Various stressors were examined to gain insights into membrane degradation and explore potential mitigation strategies. The utilization of a photometric detection method allowed for the quantification of FER in each test. Results highlight a noteworthy correlation between applied stressors and FER, with variations depending on specific test conditions. An accelerated stress test conducted for 100 hours revealed a high FER at the anode of 0.83 μg h−1 cm−2 during the initial phase. Correspondingly, energy dispersive X-ray (EDX) mapping showed a reduction in Nafion™ content on the catalyst-coated membrane (CCM) surfaces, likely impacting proton conductivity and performance. Electrochemical results further support these findings, indicating performance changes corresponding to the observed membrane degradation.
1 Introduction
Polymer electrolyte membrane water electrolysis (PEMWE) is a crucial technique in the quest for green hydrogen production. By integrating PEMWE with renewable energy sources (RES) such as wind, water or solar power, hydrogen can be produced without CO2 emissions (Mohammadi and Mehrpooya, 2018). One of the critical challenges in PEMWE is the degradation of the membrane and other cell components, which can lead to the emission of fluoride ions (Gubler et al., 2019; Kuhnert et al., 2023a). Fluoride emission is primarily caused by the chemical and mechanical degradation of the PEM, which is exacerbated by the harsh operational conditions, such as high voltage, acidic environment, and oxygen evolution at the anode. These factors contribute to membrane thinning, loss of mechanical integrity, and chemical decomposition (Kuhnert et al., 2023b). Understanding the mechanisms behind these degradation processes is crucial for developing effective mitigation strategies, such as optimizing operating conditions, improving material durability, and introducing protective coatings to reduce fluoride release and extend the lifetime of the electrolyzer. A scheme of a PEMWE cell with its primary components is presented in Figure 1.
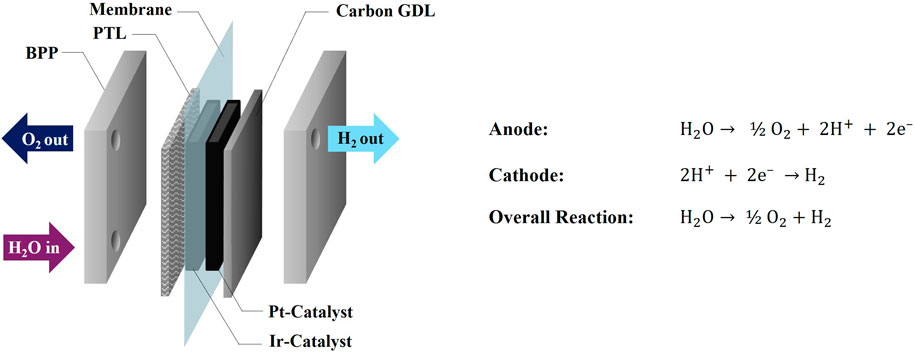
Figure 1. Scheme of a PEMWE cell and anode- and cathode reactions (Kuhnert et al., 2023b).
While Pt is coated at the cathode side of the PEM, Ir is required at the anode due to the harsh environment of the OER. Consequently, more stable diffusion media are also necessary at the anode compartment. These porous transport layer (PTL) materials consist of platinated Ti-fiber or sintered material (Stiber et al., 2021). At the cathode side, carbon-based gas diffusion layers (GDL) can be employed. The state-of-the-art materials used as PEM currently consist of PFSA-based polymers with a PTFE backbone and sulfonic acid end-groups that provide protonic conductivity. The membrane thickness is typically around 100 µm with a trend to thinner materials (Luo et al., 2021). Thinner materials, while offering advantages like lower resistance, may exhibit increased gas crossover.
While significant literature exists on perfluorosulfonic acid and aromatic hydrocarbon ionomers in proton exchange fuel cells (PEFCs) (García-Salaberri, 2022; García-Salaberri, 2023), understanding of these materials in PEMWE remains limited and requires further exploration. The degradation of the proton-conducting PEM significantly affects system performance over time. This degradation is often accelerated during current cycling and exposure to open circuit voltage during operation. One of the primary degradation mechanisms is the chemical attack on the PFSA-membrane by free radicals such as HO• and HOO•, produced through reactions like the homolysis of hydrogen peroxide (H2O2) and the Fenton reaction. Additionally, contaminants such as metal ions, organic matter, and particulates present in the feedwater exacerbate the membrane’s chemical and mechanical degradation. The result is membrane thinning, structural failure, and the release of harmful by-products, including fluoride ions (F−), which are indicative of membrane deterioration.
Fluoride emission is increasingly recognized as a reliable indicator of the health of PEMWE membranes, with the fluoride emission rate (FER) providing real-time data on membrane degradation. Monitoring FER offers the potential for continuous system diagnostics, helping to predict and mitigate component failure. Existing diagnostic tools, such as fluoride-selective electrodes (FSE), ion chromatography (IC), photometric methods (PM), and high-performance liquid chromatography (HPLC), have been employed to measure FER in PEM systems, each with varying degrees of sensitivity, ease of use, and practicality (Kuhnert et al., 2023a; Kuhnert et al., 2023b; Heidinger et al., 2023; Bodner et al., 2017; Fouda-Onana et al., 2016; Marocco et al., 2021; Frensch et al., 2019; Inaba et al., 2006; Kinumoto et al., 2006; Kuhnert et al., 2023c).
Despite advances in diagnostic tools, significant knowledge gaps remain in comparing the effectiveness of FER measurement techniques under various operational conditions. This study aims to address these gaps by providing a comparative analysis of two suitable methods–the photometric detection method (PM) developed by our group and HPLC-IC. By focusing on key performance factors such as detection limits, measurement speed, and the impact of contaminants, the study offers new insights into which technique is better suited for real-time monitoring of membrane health in PEMWE systems, thereby contributing to the optimization of diagnostic practices and system durability.
2 Materials and methods
Two analytical methods were evaluated for their suitability in PEMWE-FER analysis: (i) PM and (ii) HPLC-IC. Various factors such as measurement time, limit of detection (LOD), ease of operation, cost, and sample volume were compared between the two methods. Subsequently, the superior method was employed in a practical study, where a PEMWE cell underwent an accelerated stress test (AST) profile, and the effluent water was collected at regular intervals over a period of 100 h. Supplementary analysis techniques were utilized to corroborate the FER findings and establish links to specific degradation mechanisms. A 5 cm2 single cell (Baltic) with serpentine Ti-flow fields was used in the study. This setup involved applying a compression force of 2 bar on the cell. Platinised Ti-fibre felts (Bekaert) were used on both sides of the 3-layer CCM (Quintech). Ultrapure (UP) H2O with a resistivity of >18 MΩ*cm was supplied to the cell at a flowrate of 5 mL min−1 cm−2 using a micro-gear pump (Faulhaber). For electrochemical characterisation, an Im6e4x potentiostat with a 40 A booster (both Zahner) was utilised. The H2 flowrate was measured with a flowmeter (Bronkhorst). A detailed description of the cell hardware and components is provided in Table 1.
Activation involved hydration at a flow rate of 5 mL min−1 cm−2 for 6 h, followed by a 12-h soak. The cell was then conditioned with two 0.5-h current-controlled holds at 0.2 and 1.0 A cm−2, and a 1-h voltage-controlled hold at 1.7 V. In-situ electrochemical characterisation was conducted at the BoT and every 24 h until the EoT within the AST. This involved recording polarisation curves ranging from 0.001 to 3.0 A cm−2 with a dwell time of 30 s per hold step. Additionally, EIS measurements were recorded at 0.5, 1.0, and 2.0 A cm−2 from 100 kHz to 0.1 Hz with an amplitude between 5% and 10% of the applied current. Constant current (CC) hold steps were performed for 8 hours at 1.0 and 2.0 A cm−2 and the voltage evolution was measured. Ex-situ characterisation comprised scanning electron microscopy (SEM) (Philips FEI XL 20) and EDX (remX GmbH) analysis for both fresh and post-mortem MEA components and measurement of the FER periodically during the measurement period.
2.1 Photometric method
The in-house developed photometric detection method relies on the visualization of the F− concentration with a UV-Vis spectrometer (eFLUORiX, AiDEXA GmbH), specially built around the optical transmission spectrograph of fluoride (Heidinger et al., 2023). This enables a lower detection limit of 0.008 mg L−1 and a short measurement period of approximately 60 s per sample. The PM relies on quenching a Zr(IV)-SPADNS2 complex, which needs to be added to the samples. Utilizing a calibration curve, the fluoride ion content can be deduced, and is typically displayed in μg h–1 cm–2. The calibration series for the photometric detection of the FER consisted of the following concentrations: 0 mg L⁻1, 0.02 mg L⁻1, 0.05 mg L⁻1, 0.2 mg L⁻1, and 0.5 mg L⁻1. For this, 100 µL of standard were added to 900 µL of the samples. Each standard was measured 60 times with almost no standard deviation. The area-specific FER was calculated based on the amount of fluoride released for the active CCM area according to Equation 1. In Figure 2 the calibration graph and spectral curves used for the PM evaluation of the FER are displayed (Kuhnert et al., 2023a; Heidinger et al., 2023).
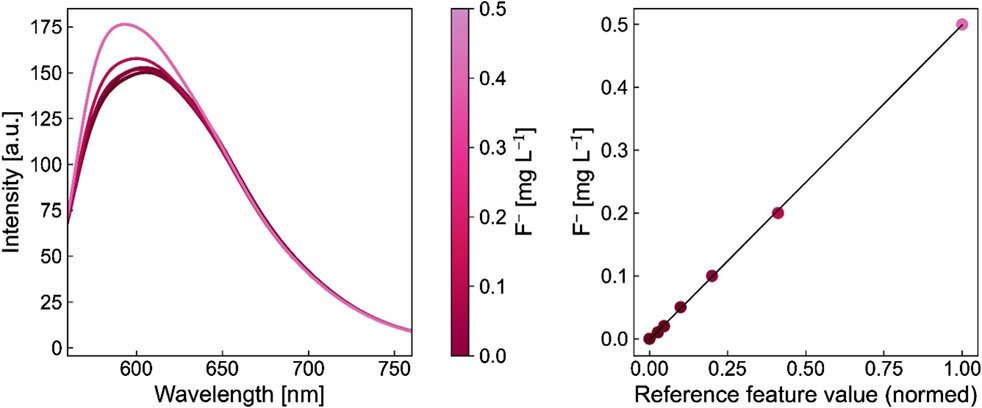
Figure 2. Spectral curves of the individual standards and calibration curve with colour matched dots for the fluoride concentration.
To calculate the FER in μgFh‒1cm‒2, the following parameters are required: fluoride concentration in the water sample cF (mg L⁻1), molar mass of fluoride MF (g mol⁻1), volume of the exhaust water Vwater (L), active cell area Acell (cm2), and sampling time nsampling (h).
2.2 HPLC-IC
High-pressure ionic chromatography (HPLC-IC) with conductivity detection has been used as one possible analytical method to determine the fluoride content coming from Nafion membrane degradation (Inaba et al., 2006; Kinumoto et al., 2006). The principle of it is visualized in Figure 3. HPLC-IC was conducted with a Dionex IonPac AG11-HC guard column (2 × 50 mm) and a Dionex IonPac AG11-HC analytical column (2 × 250 mm) in a DIONEX Integrion HPIC by ThermoFischer with a conductivity detector. A Dionex AERS 300 eluent suppressor (2 mm) has been employed to improve results. The eluent was 1 mM of potassium hydroxide, created by the eluent generator, with an increase to 2 mM after 5 min. The eluent generator used ultrapure water (0.055 μS cm−1, <2 ppb TOC) for dilution, which was also used for dilution and blank reference samples. The columns and the detector chamber were held at 30°C during measurement. The compartment was at 20°C. 1 mL of the sample was injected per measurement, and the run time per sample was 30 min. The pressure during measurement was max. 1950 psi. The fluoride retention time was determined to be 4.33 ± 0.09 min.
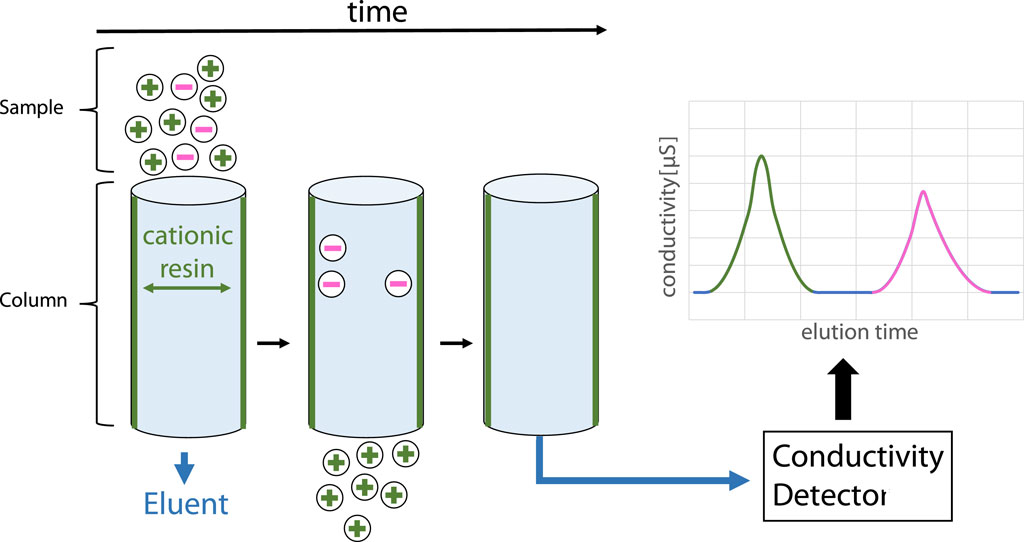
Figure 3. HPLC-IC principle for separating cations from anions and following detection via conductivity detector.
Formic acid was used as an internal standard at a concentration of 0.1 mg L−1 in the samples and had a retention time of 5.54 ± 0.06 min. The calibration was conducted with standard fluoride solutions of 0.01, 0.02, 0.05, 0.1, 0.2, 0.5, 1, 2, and 5 ppm, prepared from a stock solution of 1,000 ppm supplied by Carl Roth GmbH. Each sample was first filtered through a 0.45 µm polyethersulfone syringe filter. All samples and calibration solutions were stored in triple-rinsed polypropylene bottles. The system was flushed in between samples by a 30-min procedure, consisting of 10 min 100 mM KOH, 5 min gradient, and 15 min 1 mM KOH.
3 Comparison of photometric detection and HPLC-IC
Table 2 provides a comparison of various factors between the two technologies. While the LOD is comparable between the two methods, the photometric method offers distinct advantages in terms of cost, ease of operation and required sample volume.
The comparison of the two methods was specifically conducted to measure the FER in the effluent water of PEMWE cells. According to the literature, the expected concentration of fluoride ions in the samples ranges from approximately 0.01–2.0 μg h−1 cm−2 (Kuhnert et al., 2023a; Marocco et al., 2021; Kuhnert et al., 2023c; Babic et al., 2020; Kuhnert et al., 2024), based on the experimental parameters and sampling points. For Nafion™-based membranes, several researchers have observed an initial spike in the FER during the first few hours of measurement, likely due to changes in the hydration state of the membrane at the beginning of the measurement process. Higher temperatures result in increased FER, and the duration of the measurement is also a critical factor. While HPLC-IC is a well-established and long-known method, our group has recently developed an in-house photometric detection method tailored to measure fluoride ions in PEM technology. A comparison of the two calibration graphs from the PM method and HPLC-IC is provided in Figure 4.
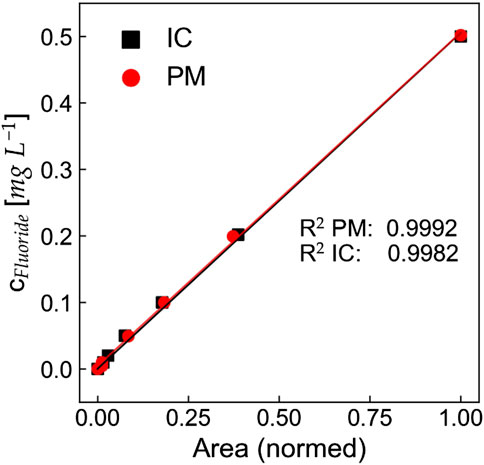
Figure 4. Calibration comparison between ion chromatography (IC) and photometric method (PM) for fluoride in water. The area from both methods has been normed to enable a direct comparison and the concentration range from IC has been limited to a maximum concentration of 0.5 mg L−1.
Since the accuracy and limit of detection made both methods a valid option, the other factors were deciding for our further measurements. Our photometric method allows for smaller sample quantities while also shortening the measurement time. Photometric detection methods are often lauded for their cost-effectiveness and simplicity compared to HPLC techniques. Photometric methods generally require less expensive instrumentation and fewer consumables, which can significantly reduce operational costs. Specifically, studies have indicated that photometric methods can be less costly due to their straightforward procedures and reduced need for extensive sample preparation (Khudzaifah and Basukiwardojo, 2022). These factors, combined with the ease of use for the photometric method and the background noise of the IC samples, resulted in us choosing PM for all further measurements.
4 Results and discussion
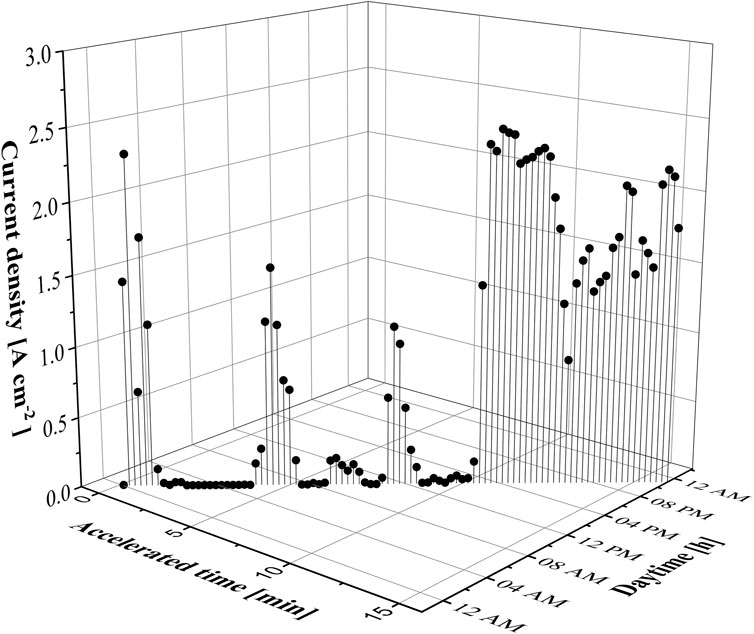
To assess the feasibility of measuring FER via PM in real-life, a renewable energy accelerated stress test (RE-AST) was designed to measure degradation in a PEMWE single cell. The RE-AST was derived from raw data from a 21 MW wind farm with 7 × E101 and 3 MW power per unit based in Austria. The detailed characteristics of the data are provided by VERBUND. The profile was accelerated to a 15-min AST profile (see Figure 5) and utilised to examine the impact of directly coupling wind electric power to a PEMWE electrolyser without employing any compensation strategy.
The 15-min interval in Figure 5 was selected to simulate the rapid cycling conditions that PEMWE systems might experience when integrated with renewable energy sources, such as wind power. This interval was derived from real-world data provided by a 21 MW wind farm, which reflects typical fluctuations in power output. The choice of a 15-min interval balances the need to replicate intermittent power conditions while maintaining practical test durations. Shorter intervals could exacerbate degradation by introducing more frequent stress cycles, whereas longer intervals might not adequately capture the rapid changes inherent in renewable energy sources. Thus, the 15-min interval was deemed appropriate for representing realistic operational scenarios.
The wind-AST profile displayed in Figure 5 was tested for 100 h of operation within a PEMWE test setup featuring a 5 cm2 single cell (Baltic). For a detailed description of the test setup refer to Table 1. Figure 6A shows the polarisation curves recorded periodically during the wind-AST experiment with the highlighted high-current density region between 2.0 and 3.0 A cm−2. The voltage decay over time is displayed in Figure 6B. The Nyquist plots recorded at 1.0 A cm−2 are displayed in Figure 6C and those at 3.0 A cm−2 are shown in Figure 6D. The polarisation curves depicted in Figure 6A exhibit a distinctive pattern, with a linear segment spanning roughly from 0.2 to 2.5 A cm−2. Beyond this point, a gradual rise is visible, suggesting the onset of mass transport (MT) phenomena at elevated current densities.
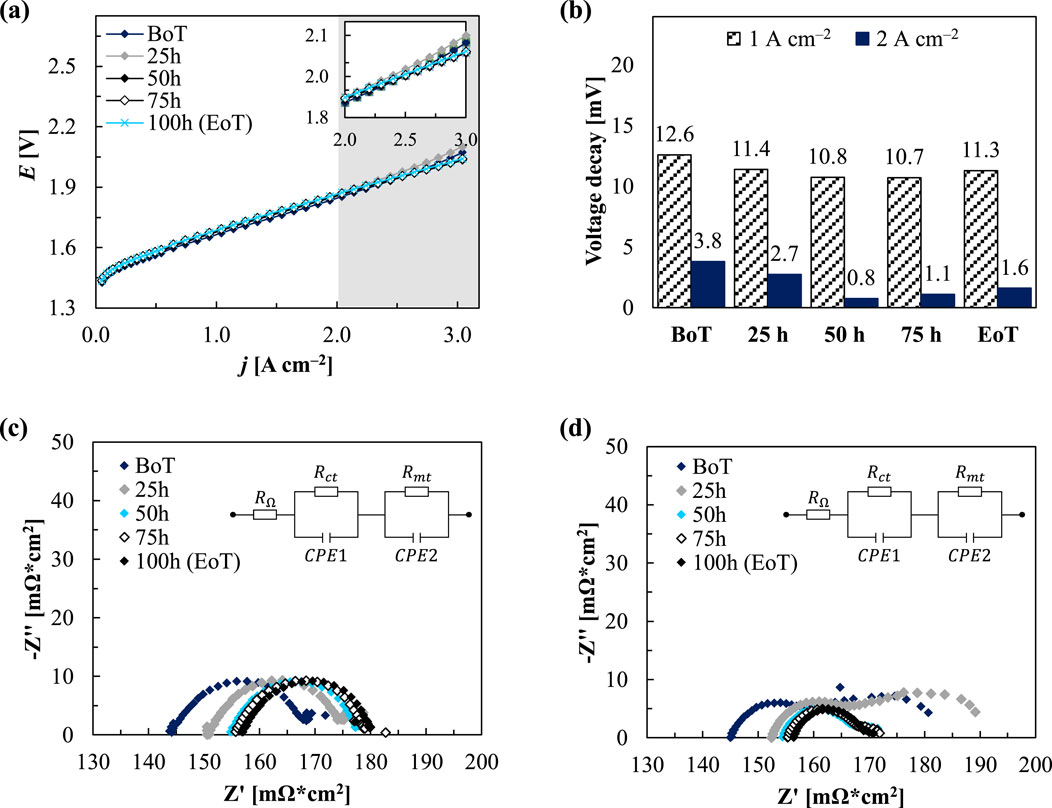
Figure 6. Polarisation curve (A) and voltage decay (B) at several measurement points during the wind-AST and Nyquist plots recorded at 1.0 A cm−2 (C) and at 2.0 A cm−2 (D) at several measurement points during the AST.
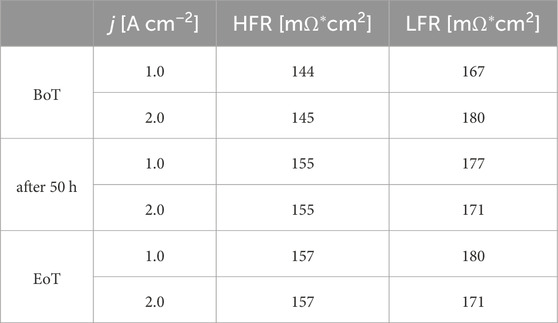
At the BoT, the voltage of 1.85 V at 2 A cm−2 aligns with values reported in literature. Upon reaching the EoT a minor rise of approximately 19 mV (performance decrease by ∼1%) is evident, resulting in a voltage of 1.87 V. Intriguingly, an initial decline in voltage occurs within the initial 25 h, succeeded by a subsequent 9 mV increase between 25 and 50 h, before resuming a downward trend through the 100-h testing period. This fluctuating trend becomes more pronounced at higher current densities, notably at 3 A cm−2. At the BoT, the voltage stands at 2.07 V, later stabilising at 2.1 V for the initial 25 h, before declining to 2.04 V by EoT (decrease by ∼1.5%). Figure 6B further supports the observed trend in voltage over time. At BoT, before starting the AST, the voltage decay after the 8 h CC hold phase at 2.0 A cm−2 is at 12.6 mV and accounts for roughly a third of the voltage decay witnessed at 1.0 A cm−2 (3.8 mV). Remarkably, as the system reaches its peak performance past 50 h of testing, this discrepancy increases significantly, representing only around 10% (10.8 mV at 1.0 A cm−2 vs. 0.8 mV at 2 A cm−2). The observed trend in the voltage over the 100 h test period could potentially be attributed to improved electrolyte conductivity or enhanced catalyst activity after the initial 50 h of testing. The increased performance at elevated current densities could be due to better MT properties facilitating more efficient ion movement or reduced overpotential due to improved catalyst utilisation. Additionally, changes in temperature or local conditions within the cell might improve reaction kinetics, leading to the observed performance increase. The Nyquist plots presented in Figures 6C, D were analysed using the Zahner analysis software. The high frequency resistance (HFR) and low frequency resistance (LFR) at different current densities and at the BoT and EoT are presented in Table 3.
The HFR values at 2.0 A cm−2 show an increase of 13 mΩ during the test period, rising from 145 to 157 mΩ. As the HFR is related to the membrane resistance, the observed rise signifies a decline in proton conductivity. Conversely, the LFR decreases from 180 mΩ to 171 mΩ over the same period, indicating an overall reduction in resistance and optimised reaction kinetics. At the lower current density, the LFR also experiences a slight increase of 13 mΩ, from 167 to 180 mΩ. Compared to Figure 6C, MT losses are more pronounced at the higher current density. Observing Figure 6D, the Nyquist plots recorded at 2.0 A cm−2, are displaying in two full semicircles. The first semicircle corresponds to charge transfer (CT) resistance, while the second reflects MT resistance in the assumed EEC model. Notably, the Nyquist plot represented in grey after 25 h stands out, displaying the highest second semicircle and an LFR of 190 mΩ. Subsequently, in the following hours, this semicircle diminishes, indicating a tendency toward potential stabilisation or attenuation of the enhanced bubble formation.
In Figure 7 results related to the membrane state of health (SOH) are presented. Figure 7A displays the area specific FER over the AST-period with higher values reported at the cathode after the initial stage. Herein, the peak values, recorded after 25 h of testing, show rates of 0.69 ± 0.03 μg h−1 cm−2 at the cathode and 0.83 ± 0.02 μg h−1 cm−2 at the anode. Following that, the FER remains higher for the cathode compartment, although it diminishes to 0.27 ± 0.03, in contrast to the anode’s 0.03 ± 0.01 μg h−1 cm−2 after the test period. The low standard deviation values (±0.01–0.03 μg h−1 cm−2) indicate high precision and reliability in the photometric measurements during the AST period, supporting the consistency of the reported trends at both the cathode and anode. In the literature, the standard deviation for the HPLC method is reported to be higher, around 0.5 μg h−1 cm−2, indicating greater variability in FER measurements (Heidinger et al., 2023). Prior research has consistently reported elevated cathodic values, which are presumed to stem from the osmotic drag between the anode- and cathode compartments (Marocco et al., 2021; Kuhnert et al., 2024). These higher values within the initial 50-h timeframe correlate with the findings from the electrochemical measurements. The initial spike in the FER at the beginning of the test can be attributed to manufacturing residues and the presence of more readily accessible degradation sites within the Nafion™ structure (Heidinger et al., 2023). These factors can lead to an elevated degradation rate early in the test.
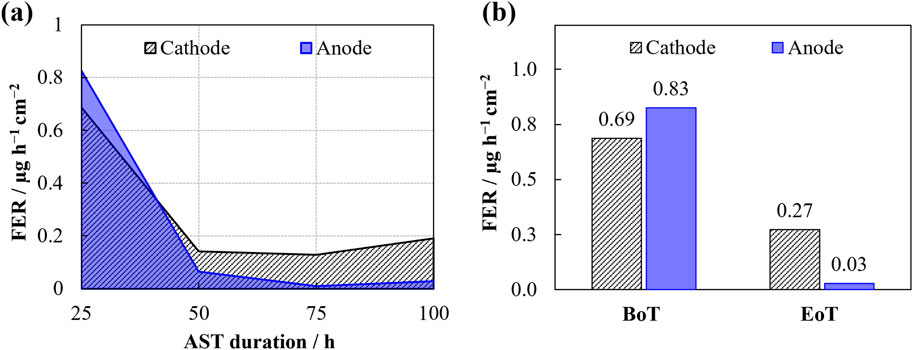
Figure 7. Evolution of the area specific fluoride emission rate (FER) during the AST (A) and cumulative F− concentrations at the begin of testing (BoT) and the end of testing (EoT) (B).
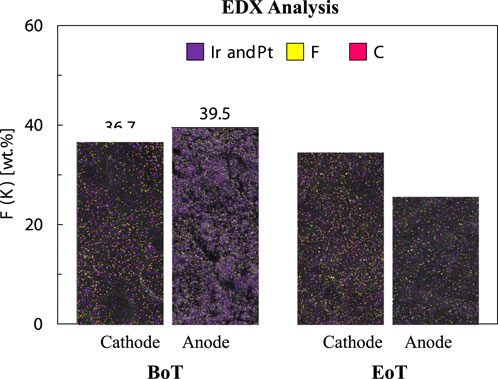
In Figure 8, EDX surface maps, together with the fluorine content in wt.% of pre- and post-mortem CCM samples are shown. The EDX maps highlight F in yellow, C in pink, and purple denotes the respective catalysts (Ir and Pt). F represents Nafion™ within the catalyst suspension and from the CCM visible through the CL. A noticeable trend reveals a decrease in the fluorine content on the CCM surfaces before- and after testing, particularly prominent at the anode side. Herein a 35% reduction from 39.5 to 25.7 wt.% is reported whereas the reduction at the cathode side is comparatively smaller, around 6%, decreasing from 36.7 to 34.6 wt.%.
Additionally, Figure 9 presents insights into the fresh anode- and cathode CL surface in Figures 9A, B, alongside post-mortem samples in Figures 9C, D, revealing an overall change in surface structure, notably evident at the anode CL, where indentations on both anode and cathode from the PTLs become visible. The cathode CL exhibits local delamination, notably highlighted in black, observable at a 500x magnification in Figure 9D.

Figure 9. SEM surface images in 100x magnification and 500x magnification (outlined in black) for a fresh Ir-anode (A) and Pt/C (cathode) (B) and post-mortem Ir-anode (C) and Pt/C cathode (D).
A thorough analysis of PEMWE catalyst degradation, comparing commercial catalysts under intermittent and stead-state operation, was carried out by Zaccarine et al. (2022). The findings linked small-scale changes in the catalyst layers, detected via SEM/EDX measurements, to macroscopic changes after testing. Greater changes were observed after an extended 2 V hold period compared to intermittent i/V cycling, indicating that the severity of degradation is influenced by the testing conditions. Similar degradation mechanisms were detected under both conditions, suggesting that CL surface degradation, including structural changes like delamination, would likely be experienced during intermittent PEMWE operation (Zaccarine et al., 2022).
5 Conclusion
In this study, two methods for measuring FER in PEMWE were compared across various parameters. Photometric detection emerged as the superior method based on factors such as measurement time, ease of operation, cost-effectiveness, and required sample volume. To validate this method under real-life conditions, it was applied to investigate and correlate cell performance using a 100-h AST profile derived from real data sourced from a wind farm in Austria. The dynamic profile replicated real-life conditions to examine the performance of PEMWE-RES direct coupling. The observed fluorine loss, particularly pronounced at the anode, appeared to correspond to heightened FER during the initial testing phase. Additionally, EDX mapping illustrated reduced Nafion™ content on the CCM surfaces, potentially influencing conductivity and performance. Electrochemical results further supported these observations, indicating changes in performance metrics coinciding with identified membrane alterations. A notable performance trend, showing a shift towards MT phenomena dominance after 50 h followed by stabilization or reduction in intensified bubble formation towards the EoT, was evident. These findings underscore the correlation between membrane performance, structural integrity, and observed resistances within the cell. They highlight the FER’s significance as a sensitive indicator of PEM electrolyzer degradation, offering crucial insights into stress-induced processes. Monitoring the FER can effectively serve as an early warning system, enabling assessment of the health and longevity of PEM water electrolyzers across diverse operational conditions.
Data availability statement
The original contributions presented in the study are included in the article/supplementary material, further inquiries can be directed to the corresponding author.
Author contributions
EK: Conceptualization, Data curation, Formal Analysis, Investigation, Methodology, Software, Validation, Visualization, Writing–original draft, Writing–review and editing. MH: Formal Analysis, Writing–original draft. AB: Writing–review and editing, Methodology. ÖK: Writing–review and editing. EB: Writing–review and editing, Conceptualization, Validation. VH: Writing–review and editing, Funding acquisition, Project administration, Supervision, Resources. MB: Conceptualization, Funding acquisition, Project administration, Supervision, Visualization, Writing–review and editing.
Funding
The author(s) declare that financial support was received for the research, authorship, and/or publication of this article. The authors gratefully acknowledge funding from the Austrian Research Promotion Agency (FFG) in the project HyGen (COMET Project HyTechonomy, FFG grant number 882510). HyTechonomy is a COMET Project within the COMET–Competence Centers for Excellent Technologies Program and funded by BMK, BMDW, the SFG, the provinces of Styria and Upper Austria. The COMET Programme is managed by FFG. Financial support from the TU Graz Open Access Publishing Fund is highly appreciated.
Conflict of interest
Author EB was employed by VERBUND Thermal Power GmbH & Co KG.
The remaining authors declare that the research was conducted in the absence of any commercial or financial relationships that could be construed as a potential conflict of interest.
Publisher’s note
All claims expressed in this article are solely those of the authors and do not necessarily represent those of their affiliated organizations, or those of the publisher, the editors and the reviewers. Any product that may be evaluated in this article, or claim that may be made by its manufacturer, is not guaranteed or endorsed by the publisher.
References
Babic, U., Tarik, M., Schmidt, T. J., and Gubler, L. (2020). Understanding the effects of material properties and operating conditions on component aging in polymer electrolyte water electrolyzers. J. Power Sources 451, 227778. doi:10.1016/j.jpowsour.2020.227778
Bodner, M., Marius, B., Schenk, A., and Hacker, V. (2017). Determining the total fluorine emission rate in polymer electrolyte fuel cell effluent water. ECS Trans. 80, 559–563. doi:10.1149/08008.0559ecst
Fouda-Onana, F., Chandesris, M., Médeau, V., Chelghoum, S., Thoby, D., and Guillet, N. (2016). Investigation on the degradation of MEAs for PEM water electrolysers part I: effects of testing conditions on MEA performances and membrane properties. Int. J. Hydrogen Energy 41, 16627–16636. doi:10.1016/j.ijhydene.2016.07.125
Frensch, S. H., Serre, G., Fouda-Onana, F., Jensen, H. C., Christensen, M. L., Araya, S. S., et al. (2019). Impact of iron and hydrogen peroxide on membrane degradation for polymer electrolyte membrane water electrolysis: computational and experimental investigation on fluoride emission. J. Power Sources 420, 54–62. doi:10.1016/j.jpowsour.2019.02.076
García-Salaberri, P. A. (2022). 1D two-phase, non-isothermal modeling of a proton exchange membrane water electrolyzer: an optimization perspective. J. Power Sources 521, 230915. doi:10.1016/j.jpowsour.2021.230915
García-Salaberri, P. A. (2023). Proton exchange membranes for polymer electrolyte fuel cells: an analysis of perfluorosulfonic acid and aromatic hydrocarbon ionomers. Sustain. Mater. Technol. 38, e00727. doi:10.1016/j.susmat.2023.e00727
Gubler, L., Dockheer, S. M., and Koppenol, W. H. (2019). Radicals in fuel cell membranes: mechanisms of formation and ionomer attack. ECS Trans. 41, 1431–1439. doi:10.1149/1.3635674
Heidinger, M., Kuhnert, E., Mayer, K., Sandu, D., Hacker, V., and Bodner, M. (2023). Photometric method to determine membrane degradation in polymer electrolyte fuel cells. Energies 16, 1957. doi:10.3390/en16041957
Inaba, M., Kinumoto, T., Kiriake, M., Umebayashi, R., Tasaka, A., and Ogumi, Z. (2006). Gas crossover and membrane degradation in polymer electrolyte fuel cells. Electrochimica Acta 51, 5746–5753. doi:10.1016/j.electacta.2006.03.008
Khudzaifah, N. A., and Basukiwardojo, M. M. S. (2022). Determination of the optimum concentration of the coupling agent in chloramphenicol analysis. World J. Adv. Res. Rev. 15, 525–533. doi:10.30574/wjarr.2022.15.1.0719
Kinumoto, T., Inaba, M., Nakayama, Y., Ogata, K., Umebayashi, R., Tasaka, A., et al. (2006). Durability of perfluorinated ionomer membrane against hydrogen peroxide. J. Power Sources 158, 1222–1228. doi:10.1016/j.jpowsour.2005.10.043
Kuhnert, E., Hacker, V., and Bodner, M. (2023b). A review of accelerated stress tests for enhancing MEA durability in PEM water electrolysis cells. Int. J. Energy Res. 2023, 1–23. doi:10.1155/2023/3183108
Kuhnert, E., Heidinger, M., Sandu, D., Hacker, V., and Bodner, M. (2023a). Analysis of PEM water electrolyzer failure due to induced hydrogen crossover in catalyst-coated PFSA membranes. Membranes 13, 348. doi:10.3390/membranes13030348
Kuhnert, E., Kiziltan, O., Hacker, V., and Bodner, M. (2023c). Investigation of the impact of chloride contamination on degradation in PEM water electrolyzer cells. ECS Trans. 112, 485–494. doi:10.1149/11204.0485ecst
Kuhnert, E., Mayer, K., Heidinger, M., Rienessel, C., Hacker, V., and Bodner, M. (2024). Impact of intermittent operation on photovoltaic-PEM electrolyzer systems: a degradation study based on accelerated stress testing. Int. J. Hydrogen Energy 55, 683–695. doi:10.1016/j.ijhydene.2023.11.249
Luo, X., Lau, G., Tesfaye, M., Arthurs, C. R., Cordova, I., Wang, C., et al. (2021). Thickness dependence of proton-exchange-membrane properties. J. Electrochem. Soc. 168, 104517. doi:10.1149/1945-7111/ac2973
Marocco, P., Sundseth, K., Aarhaug, T., Lanzini, A., Santarelli, M., Barnett, A. O., et al. (2021). Online measurements of fluoride ions in proton exchange membrane water electrolysis through ion chromatography. J. Power Sources 483, 229179. doi:10.1016/j.jpowsour.2020.229179
Mohammadi, A., and Mehrpooya, M. (2018). A comprehensive review on coupling different types of electrolyzer to renewable energy sources. Energy 158, 632–655. doi:10.1016/j.energy.2018.06.073
Stiber, S., Balzer, H., Wierhake, A., Wirkert, F. J., Roth, J., Rost, U., et al. (2021). Porous transport layers for proton exchange membrane electrolysis under extreme conditions of current density, temperature, and pressure. Adv. Energy Mater. 11, 2100630. doi:10.1002/aenm.202100630
Keywords: PEM water electrolysis, hydrogen production, green hydrogen, fluoride emission rate, degradation analysis
Citation: Kuhnert E, Heidinger M, Bernroitner A, Kiziltan Ö, Berger E, Hacker V and Bodner M (2024) Fluoride emission rate analysis in proton exchange membrane water electrolyzer cells. Front. Energy Res. 12:1457310. doi: 10.3389/fenrg.2024.1457310
Received: 30 June 2024; Accepted: 06 November 2024;
Published: 25 November 2024.
Edited by:
Anthony Kucernak, Imperial College London, United KingdomReviewed by:
Pablo A. García-Salaberri, Universidad Carlos III de Madrid, SpainBharat Shrimant, Dioxide Materials, United States
Copyright © 2024 Kuhnert, Heidinger, Bernroitner, Kiziltan, Berger, Hacker and Bodner. This is an open-access article distributed under the terms of the Creative Commons Attribution License (CC BY). The use, distribution or reproduction in other forums is permitted, provided the original author(s) and the copyright owner(s) are credited and that the original publication in this journal is cited, in accordance with accepted academic practice. No use, distribution or reproduction is permitted which does not comply with these terms.
*Correspondence: Eveline Kuhnert, ZXZlbGluZS5rdWhuZXJ0QHR1Z3Jhei5hdA==
 Eveline Kuhnert
 Mathias Heidinger1
 Anna Bernroitner
 Özge Kiziltan
 Viktor Hacker

