- 1Department of Mechanical Engineering, University of Ibadan, Ibadan, Nigeria
- 2Department of Mechanical Engineering, University of Alaska Fairbanks, Fairbanks, AK, United States
Energy efficiency strategies in industrial breweries examine the inefficiency of thermal systems from a thermodynamic perspective. However, understanding the costs of inefficiencies in systems, including non-thermodynamic costs, requires exergoeconomics. This study examined wort production in a standard Tier-1 brewery from the tripod of energy, exergy, and exergoeconomics analyses to assess the performance of brewing sections and to pinpoint components that contributed the most to exergy destruction and product cost rate. The energy analyses for the production system showed that the total specific energy for processing 10.05 tons of brew grains to 346.98 hL high-gravity wort was (86 ± 1) MJ/hL at an operational energy efficiency of 30.35%. The exergetic analyses showed that the cumulative exergetic destruction was 3.2737 MW, with the brewhouse section contributing 89.25% of the system’s inefficiencies. Also, the analyses showed that the wort kettle (42.7911%), mash tun (10.8086%), preheater (10.0683%), whirlpool (8.3522%), and adjunct kettle (6.2705%) are the top five components with the highest rates of cumulative exergy destruction. The exergoeconomic analyses revealed that the cost rate of processing chilled wort was estimated to be 0.0681 USD/s per overall exergetic efficiency of 6.61%. The five most significant components are the wort kettle (53.70%), whirlpool (16.42%), mash filter (10.44%), mash tun (6.875%), and adjunct kettle (3.31%) based on the relative total cost increases for the production processes. Additionally, wet steam throttling resulted in a 2.51% increase in exergetic efficiency, a 1.60% drop in exergetic destruction rate, and a decrease in cost rates to 0.0675 USD/s.
1 Introduction
Brewers operate in a highly competitive business environment, aiming to reduce production costs, maintain beer quality, and minimize the environmental impact of by-products. The brewing process is energy-intensive, particularly in the brewhouse section (Scheller et al., 2008; Willaert and Baron, 2005). There have been various models and recommendations for optimizing energy usage in brewing processes (Dumbliouskaite et al., 2010; Tokos et al., 2010; Scheller et al., 2008; Mignon and Hermia, 1993). Bai et al. (2011) proposed an energy consumption model for brewing processes based on production data. They evaluated energy consumption patterns employing three modeling analyses and found out that results from their simulation analyzed and forecasted energy consumption for beer brewing processes effectively. Fadare et al. (2010) found out that mash conversion and wort boiling processes accounted for the majority of the total inefficiency in a malt drink plant and proposed process heat integration for steam-loaded components to improve energy efficiency. Hence, reducing energy intensity in brewhouse mashing and wort boiling processes could allow for the design of heat supply components at a lower capacity.
In Slawitsch et al. (2014), the effects of brewing parameter changes on the energy demand for main brewhouse processes for real and hypothetic sites were studied using a developed brewing model. A 710,000 hL capacity hypothetic site showed possible energy intensity values of 4.84 and 7.62 MJ/hL for mashing and wort boiling processes, respectively, and they found that new temperature profiles in these operations could support the integration of low-temperature process heating in a brewhouse. Importantly, considering the increasing emphasis on carbon footprint and sustainability in manufacturing and production processes, there remains a continuous need to improve energy utilization per hectoliter of brewed products to minimize production costs.
Energy costs make up about 38 percent of the total beer production cost (Galitsky et al., 2003), and the beer industry, like other manufacturing sectors, cannot predict earnings due to the uncertainties surrounding energy prices in today’s market. Exergoeconomics is an approach that optimizes energy conversion systems in terms of exergy destruction and process cost formation. It helps to pinpoint variables that increase the total cost rates of equipment based on exergy destruction, external irreversibility, equipment capital recovery, and operations and maintenance (O&M) costs. Exergy costing assigns costs to a process stream based on its exergetic value, which is the rational basis for determining costs associated with a system’s internal and external irreversibilities (Bejan et al., 1996; Morosuk et al., 2012). However, cost is the amount of input resources required to produce a product. It is an emergent property that arises from the interplay among components in the course of productive operations (Valero and Torres, 2009). And unlike thermodynamic properties, costs are not inherent to a component or a product. Thus, to evaluate cost accurately, a standardized rule based on physical properties is necessary.
In the exergoeconomics study, methodologies such as Engineering Functional Analysis (EFA), Exergetic Cost Method (EXCEM), Average Costing Method (AVCO), Last-In, First-Out method (LIFO), and Specific Exergy Costing (SPECO) have been developed. These methodologies are classified into two major approaches: the Lagrangian-based approach and the exergoeconomic accounting-based approach. The Lagrangian-based approach optimizes an entire system and evaluates marginal cost using partial derivatives (Frangopoulos, 1992). In the accounting-based methodology, the exergoeconomic evaluation is primarily to cost product streams, with the cost of input streams from upstream components assumed or known, and the evaluation of components based on established variables (Erlach et al., 2001).
Although exergoeconomics has been a field of study since 1984 (Tsatsaronis, 2007), there are limited reports on its application in food processing systems. Most of the existing studies have focused on food drying operations (Hepbasli et al., 2010; Gungor et al., 2012; Li et al., 2020; Tinoco-Caicedo et al., 2020; Erbay and Kocay, 2012). Interestingly, no study has explored the potential of brewing operations in open literature. Expectedly, exergoeconomic studies of brewing operations would aid brewers to accurately evaluate and minimize their costs, ensuring more efficient and sustainable processes. Moreover, they can stay ahead of the competition by producing high-quality beer at cost-effective prices. Hence, this study examined the exergetic and exergoeconomic performances of wort production at a large-scale industrial brewery in Nigeria, using the Specific Exergy Costing (SPECO) approach. The focus was to quantify the energy consumption, exergetic destruction rate, functional efficiency, improvement potentials, and cost of processed streams for wort production. Also, components with the highest relevance concerning exergy destruction and cost rates were identified. Expectedly, the research findings will be useful to stakeholders in the brewing sector and academia in optimizing wort production for better sustainability.
2 Materials and method
2.1 Brewery description
The facility under study is a Tier-1 brewery that produces over 1.8 million hectoliters annually. It offers premium alcoholic and non-alcoholic malt drinks, with remarkable corporate social responsibilities. To generate process heat, the brewery used three sequenced boiler sets that produced 15,000 kg of steam per hour. Electricity was supplied by the national grid via an 800 kVA transformer and five onsite power generating sets, including one 800 kVA, three 1,000 kVA, and one 1,250 kVA.
2.2 Operation and process descriptions of wort production sections
Wort is a primary product resulting from the conversion of brewing grains, and it is an aqueous solution containing fermentable sugars (such as glucose, fructose, sucrose, maltose, and maltotriose), as well as assimilable nitrogen, oxygen, biotin (a vitamin), calcium, and trace elements (Fox and Bettehausen, 2023). It is processed from starch-rich cereals. Approximately 70%–75% of the sugars in wort are fermentable, while the remaining composition consists of unfermentable longer-chain saccharides and polymers (Mua and Jackson, 1995). Wort plays a central role in beer production and is responsible for the high thermal load associated with brewing operations.
The wort brewing process in craft and large breweries is divided into two primary sections: the grains handling and milling room (also called Milling Room, MR) and the brewhouse (BH). The grains handling and milling room involves handling and milling malted barley and adjunct (maize) grains to produce grist, which is then utilized in the brewhouse. Figure 1 provides a combined schematic illustration of the grains handling and milling room (MR) and brewhouse (BH) sections. The grains handling and milling room encompasses various processes including: Transportation of Malted Grains into silos (TMG), Discharge of Adjunct maize Grains into storage (DAG), Silo Aspiration (SAP), Loading of Malted Grains (LMG), Loading of Adjunct maize Grains (LAG), Destoning (DSG), Demetallizing (DML), Dedusting (DDG), Hammer Milling (HM), Malt Grist Holding (MGH), Adjunct maize Grist Holding (AGH), and Premashing (PMG). The premasher handles three processes, as shown in Figure 1: premashing of adjunct maize into the adjunct kettle, Stream 3a; premashing of adjunct malt barley into the adjunct kettle, Stream 3b; and premashing of malted barley into the mash tun, Stream 3c.
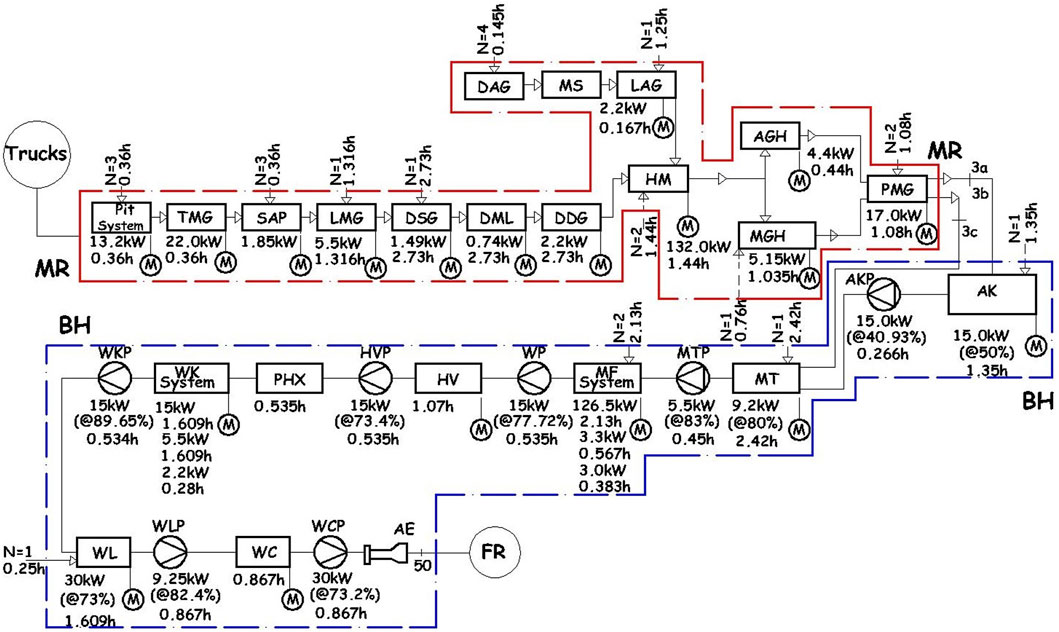
Figure 1. Process chart for wort production depicting components’ operational power and duration and human energy expenditure figures. MR = Milling Room {TMG = Transportation of malted barley grains to silos; SAP = Silo aspiration system; LMG = Loading of malted barley grains; DSG = Destoner; DML = Demetallizer; DDG = Deduster; HM = Hammer miller; MGH = Malt grist holder; DAG = Discharge of adjunct grains; MS = Maize Store; LAG = Loading of adjunct grist; AGH = Adjunct grist holder; PMG = Premasher}. BH = Brewhouse {AK = Adjunct Kettle; AKP = Adjunct Kettle Pump; MT = Mash Tun; MTP = Mash Tun Pump; MF = Mash Filter; WP = Wort Pump; HV = Holding Vessel; HVP = Holding Vessel Pump; PHX = Preheater; WK = Wort Kettle; WKP = Wort Kettle Pump; WL = Whirlpool; WLP = Whirlpool Pump; WC = Wort Cooler; WCP = Wort Cooler Pump; AE = Aerator}. N = Number of assigned person (s). FR = Fermentation Room. MR Section: BH Section.
The brewhouse, often referred to as the “kitchen,” is the section where saccharification and sparging of mash, cooking, clarification, and cooling of wort take place. The brewhouse comprises an Adjunct Kettle (AK), Mash Tuns (MT), Meura Filter 2001 (MF), Holding Vessel (HV), wort preheater (PHX), Wort Kettle (WK), Whirlpool (WL), Trub tank (TB), Wort Cooler (WC), Chilled Water Tank (CWT), Very Hot Water Tank (VHWT), Hot Water Tank (HWT), and seven different pumps (Adjunct Kettle Pump (AKP), Mash Tun Pump (MTP), Wort Pump (WP), Holding Vessel Pump (HVP), Wort Kettle Pump (WKP), Whirlpool Pump (WLP), and Wort Cooler Pump (WCP). The wort kettle is a thermal vessel responsible for three crucial processes in the brewhouse: the wort preboiling (WKPB), wort boiling (WKB), and wort stripping (WKS) to produce wort of desired physiochemical profiles.
2.3 General research framework
2.3.1 Data sources and gathering procedures
Data were collected by directly recording operating parameters for three types of energy input (electrical, human, and thermal) and the mean values of the recorded data (basic properties for brewing streams and components) over a 1-year brewing period were used for analyses. Technical specifications of components were obtained from equipment sheets or number plates. Where vendor quotations and past invoices of purchased brewing components were not available, historical data, cost estimation models, and online prices (from matche.com and czechminibreweries.com, Supplementary Table SA1) were used to estimate component costs.
The Purchase Equipment Costs (PECs) were generated and the popular power sizing model and cost index model were adopted for evaluating the PECs of components that were not directly available for year 2019. The cost index model was used for cost escalations for two different years based on the Chemical Engineering Plant Cost Index. CEPCI.
2.3.2 General assumptions
The energy and exergy aspects of all components and sections of the wort production line were evaluated based on the following general considerations: a) Steady-state conditions were assumed for all process streams and components; b) Potential, kinetic, and chemical interactions energy effects were not considered; c) Dead state temperature and pressure were set to 25°C and 1 bar, respectively; d) Brewing grains at the milling room’s entry points were at dead state.
2.4 Formulation of energy effects for component processes
The energy inputs for the brewing processes were defined as follows.
2.4.1 Human energy
Energy expenditure in human is influenced by individual characteristics like age, gender, functional capacity, and anthropometrics. The Equation 1 employed for the evaluation of human energy expenditure in Dhanushkodi et al. (2016) was adopted:
N is the count of persons involved and t is the time required to complete an activity in hours.
2.4.2 Electrical energy
The electrical energy inputs for components were evaluated based on the rating of motors (P), duration of operation (t) for a batch process as defined by Equation 2
Where motor efficiency,
2.4.3 Energy content of material streams
The available heat content
Where,
The
Where
At the brewery studied, the brewing process involved using malted barley and adjunct maize to create the wort. The compositions of these ingredients matched the results from the brewery’s laboratory. The compositions of the brewing grains and the models for specific heat and density evaluations are detailed in Supplementary Table SA2.
2.4.4 Formulation of energy efficiencies
The thermal efficiency of a production section
Where
The thermal efficiency of a component,
Where
The overall energy efficiency of the wort system was computed based on Equation 5c
Where
2.5 Propagation of uncertainties for energy inputs
As presented in Gertsbakh (2003), Equation 6 was adopted to evaluate uncertainties in energy values to aid data reproducibility and representativeness
2.6 Formulation of exergetic effects of material and energy streams
Mass and exergy balance rates for streams of a component k were evaluated as defined in Equations 7, 8, respectively:
Regarding food streams, the specific physical exergetic effect is assessed using the equation for incompressible condensed substance.
The exergetic effect associated with energy streams for a component’s process was defined by Equation 9
Both human and electrical energy inputs have physical exergetic effects equivalent to their energy values. For steam and hot water process streams, the specific physical exergetic effect was evaluated using the specific enthalpies and entropies of the streams’ states as defined in Equation 10.
For food streams, the specific physical exergetic effect was estimated using the Equation 11, for incompressible condensed substance:
The values of
2.7 Exergetic performance models
To comprehensively capture irreversibility and improvement potential, four exergetic performance indicators were utilized, as relying solely on exergetic efficiency is inadequate.
a) Functional Exergetic Efficiency, FEE,
Exergetic efficiency is a measure that assesses the effectiveness of exergetic inputs within a process or chain. It invariably presents a lower value than energetic efficiency due to the representation of deviation of the current food chain from ideality (Zisopoulos, 2016).
b) Exergy Destruction Rate,
c) Exergetic Improvement Potential, IP: The IP was defined by Equation 13 (Zisopoulos et al., 2015; Dogbe et al., 2017):
The concept of Improvement Potential provides a means of assessing the potential for improvement in a process, with the understanding that the maximum improvement for a given process equates to its total exergy loss, limited by techno-economic constraints.
A component/system with a high IP indicates low efficient use of resources and great potential for improvement.
d) Exergetic sustainability index, SI: The SI was defined by Equation 14 (Dogbe et al. (2017); Zisopoulos et al. (2015)):
The sustainability index signifies a superior efficiency for a process with a higher value and it is the reciprocal of exergetic destruction ratio,
2.8 Exergoeconomic parameters formulations
The exergoeconomic investigation of a system deploys the combined applications of exergetic and economics analyses to generate important data necessary for the cost-effective operation of system components by evaluating the costs of materials, energy streams, and destroyed exergy. Applicable economics formulations for main components were defined below.
2.8.1 Economics models for component costs
Due to the limited availability of vendor quotations and previous invoices for brewing components purchased from the brewery under investigation, this study has relied on historical data, cost estimation models, and online prices sourced from matche.com (2014), Czechminireweries.com (2024) to provide an approximate estimate of component costs. Careful consideration has been given to ensure that reasonable costs are employed in the calculation of Purchase Equipment Costs (PECs) as detailed in appendix Supplementary Table SA2. The power sizing equation (Equation 15) and the cost escalation model (Equation 16) were utilized to perform the estimation of PECs.
Where,
For cost escalation across different years (Towler and Sinnott, 2008),
2.8.2 Formulation of economics models for amortized cost rates of components,
The amortized cost rates of components,
In 2019, the brewery invested in a new brewhouse. In order to make well-informed economic decisions regarding the equipment, the annual equivalent capital cost is computed as the levelized or amortized cost over its service life. It is important to note that sunk costs are not considered relevant, but the equipment’s value depreciates over time with a corresponding salvage value, as shown in Equation 18 (Chan, 2007).
I = TCI for a component and
The total operating costs over year N can be modelled as Equation 21 (Chan, 2007)
In the absence of comprehensive O&M costs from the brewery, Equation 22 (θ = 6%, Fajardo et al., 2015; Almoghrabi and Fellah, 2022) was adopted to estimate the O&M costs of components
Combining Equations 18, 22, the levelized total cost rate of owning, operating, and maintaining a component was then defined by Equation 23:
The following key parameters were utilized in the evaluations of
2.8.3 Formulation of exergy costing and auxiliary equations
The cost rate and auxiliary cost equations are used to evaluate the costs related with materials and energy streams associated to a productive component. Generally, the cost rates for upstreams are considered known so as to evaluate product cost of processed stream within a component. The generalized Equation 24, for cost rates associated with a component, k, was defined based on Specific Exergy Costing (SPECO) methodology, as defined in Bejan et al. (1996):
Where,
The exergy rates (
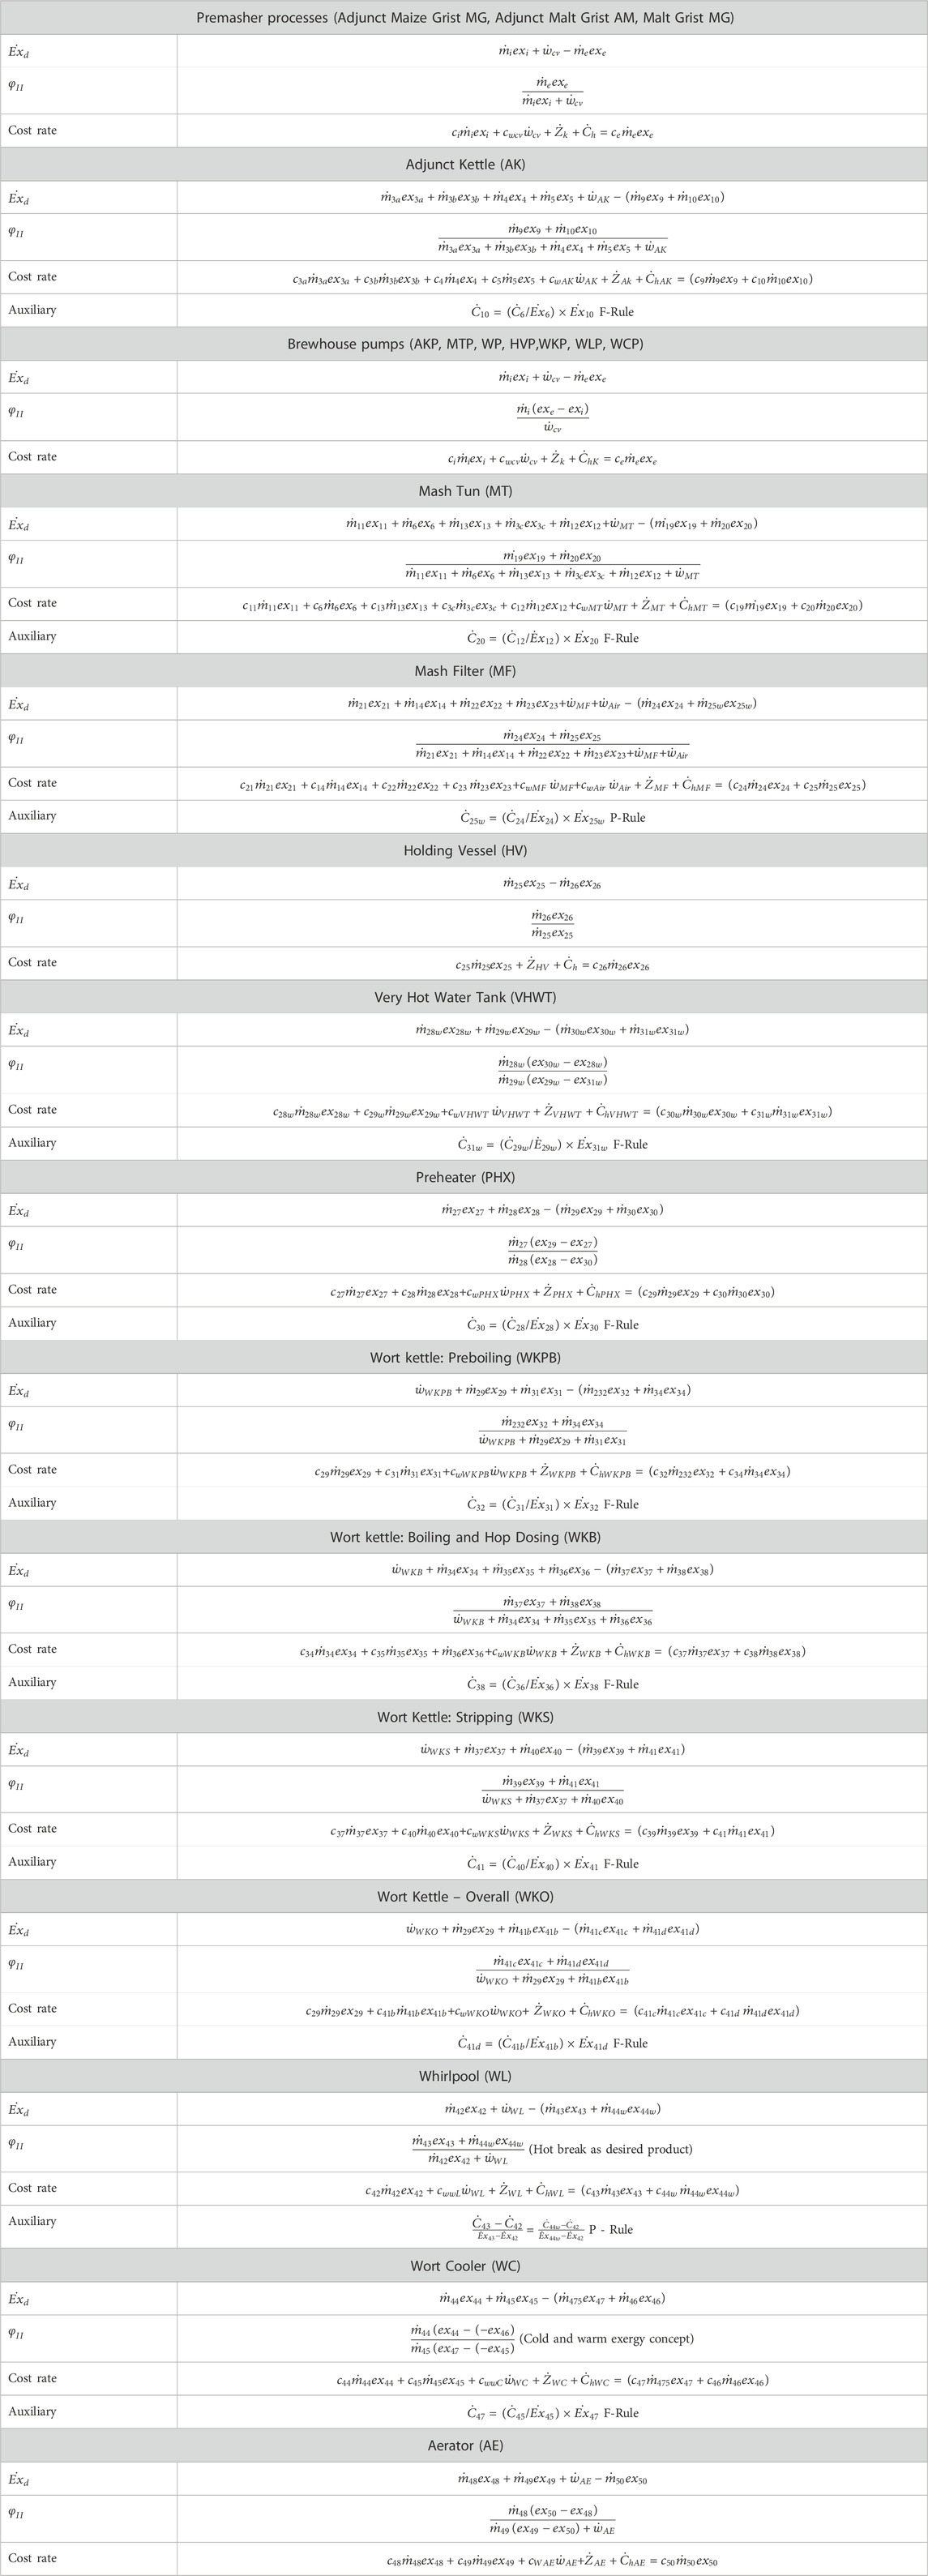
Formulation of an auxiliary cost equation is only necessary for components with more than one exit stream. Based on the F and P principles defined in Lazzaretto and Tsatsaronis (2006), Table 1 shows the exergetic, cost rate and auxiliary equations for the main components in the wort production. When evaluating the cost rate of streams,
2.8.4 Formulation of exergoeconomic performance variables
The variables were defined by Equations 25–27 as presented in Bejan et al. (1996) and are utilized in this study:
3 Results and discussion
MS Excel and Engineering Equation Solver (EES) were the tools used to model, process data, and generate performance values for system components.
3.1 Total energy consumption pattern for the wort production system
For the studied site, 1950 kg adjunct maize grains, 800 kg adjunct malted barley, and 7300 kg malted barley, are fed into the milling room and processed into premashed products. Each brew produces 346.98 hL of high-gravity wort at the brewhouse.
3.1.1 Energy consumptions for components in the milling room
The cumulative specific energy was estimated as (15.8 ± 0.2) MJ/hL with 84.09% and 15.85% thermal and electrical energy contributions respectively. The hammer miller was pinpointed as the top consumer of electricity with estimated value of (700 ± 20) MJ and distantly followed by the premasher (50 ± 2) MJ. The premasher is responsible for all the heating load of the milling room with an overall thermal energy input of (5,000 ± 30) MJ. The overall thermal efficiency of the premasher was evaluated as 74.45%. Notably, the destoner (0.74 ± 0.01) MJ, pit system (0.58 ± 0.02) MJ, and hammer miller (0.6 ± 0.1) MJ are top consumers of human energy.
3.1.2 Energy consumption for components in the brewhouse
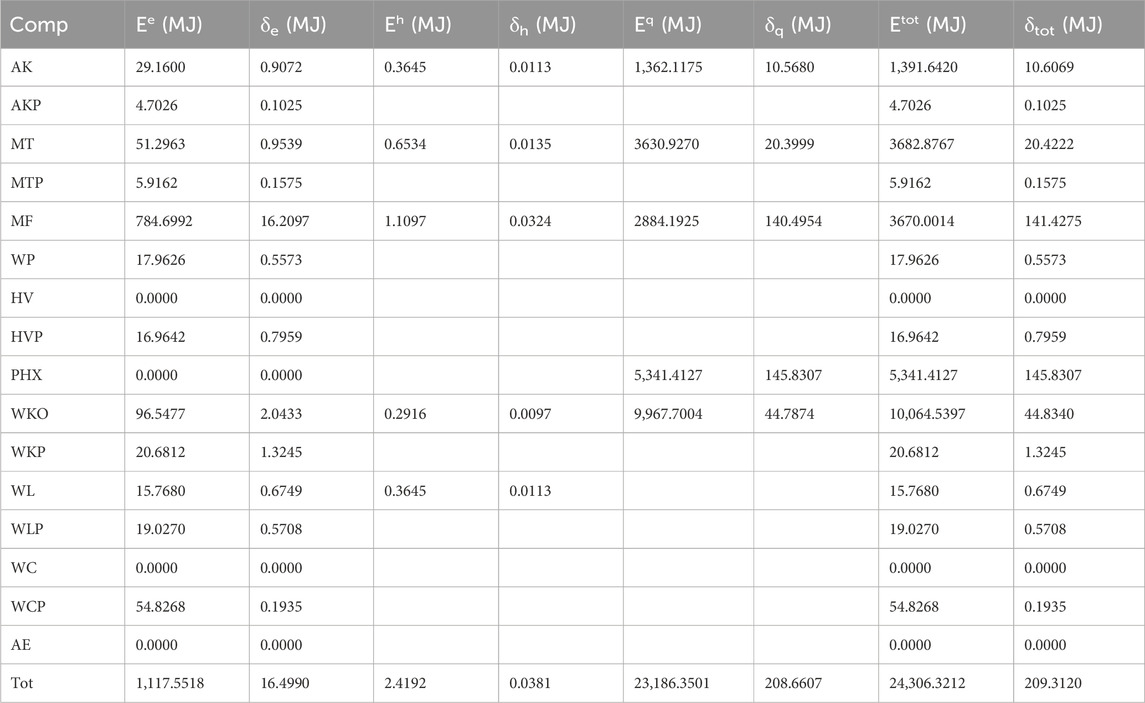
Table 2 presents the energy pattern for components of the brewhouse. The electrical, thermal and cumulative energy intensities for the section are respectively computed as (3.2 ± 0.1) MJ/hL, (67 ± 1) MJ/hL and (70 ± 1) MJ/hL. The wort kettle was the biggest consumer with an estimated total energy intensity value of (29.0 ± 0.7) MJ/hL.
Table 2 also indicates that the wort kettle and preheater were the highest consumers of total energy, accounting for 41.38% and 21.96% respectively. The mash filter and wort kettle were the top electricity users. The section’s thermal efficiency was measured at 27.41%, with the wort kettle and preheater contributing to 60.66% of the supplied thermal energy.
3.1.3 Overall energy consumption pattern
The energy consumption analysis for the production system revealed that the total specific energy for a 346.98 hL high-gravity brew was (86 ± 1) MJ/hL at an operational energy efficiency of 30.35%. This energy was derived from electrical (5.7 ± 0.2) MJ/hL, thermal (80 ± 1) MJ/hL, and manual (0.017 ± 0.002) MJ/hL sources. The brewhouse accounted for the largest portion of energy consumption, representing 56.35% of electrical energy, 83.47% of thermal energy, and 81.66% of the total energy input. The milling room was the primary source of human energy input, contributing 57.28% to the total human input.
3.2 Exergetic performances of the wort production system
The main brewing feedstock handled in the milling room does not undergo significant temperature and pressure changes as they moved from the pit system through the hammer miller to the premasher. The premasher, however, involves hydration of the feedstock at a temperature well above the dead state; hence, the premasher is the only milling room component with considerable exergetic changes between input and output streams. In effect, the useful works of all milling room components, except that of the premasher, are all considered exergetic destructions since no exergetic changes are noticeable in the product stream across the components.
3.2.1 Exergetic performance for components in the milling room
In Table 3, the premasher’s thermal and overall exergetic efficiencies are estimated to be 75.70% and 48.78% respectively. There is an improvement potential of 0.0516 MW and an exergetic destruction rate of 0.1286 MW, which constituted 36.55% of the overall exergetic destruction rate for the milling room. The milling room’s exergetic efficiency, exergetic improvement potential, and exergetic sustainability index were evaluated as 21.42%, 0.2764 MW, and 1.2726, respectively.
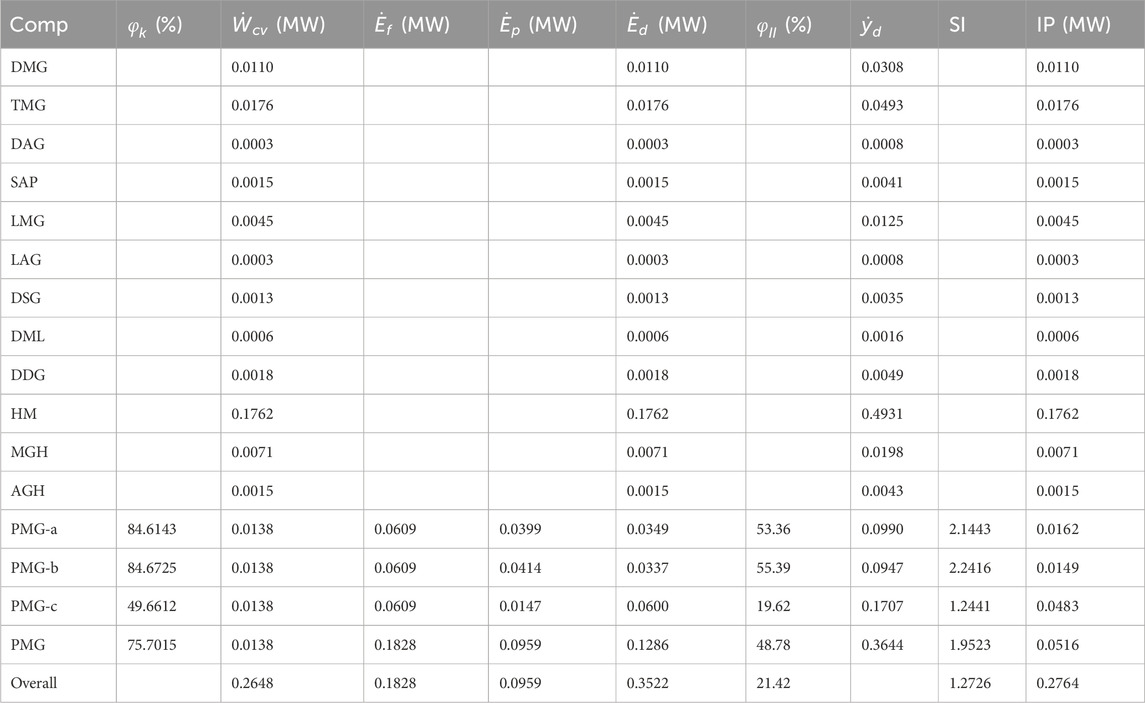
Table 3. Results of thermal energy efficiency and exergetic performances of milling room components.
3.2.2 Exergetic performance indicators for components in the brewhouse
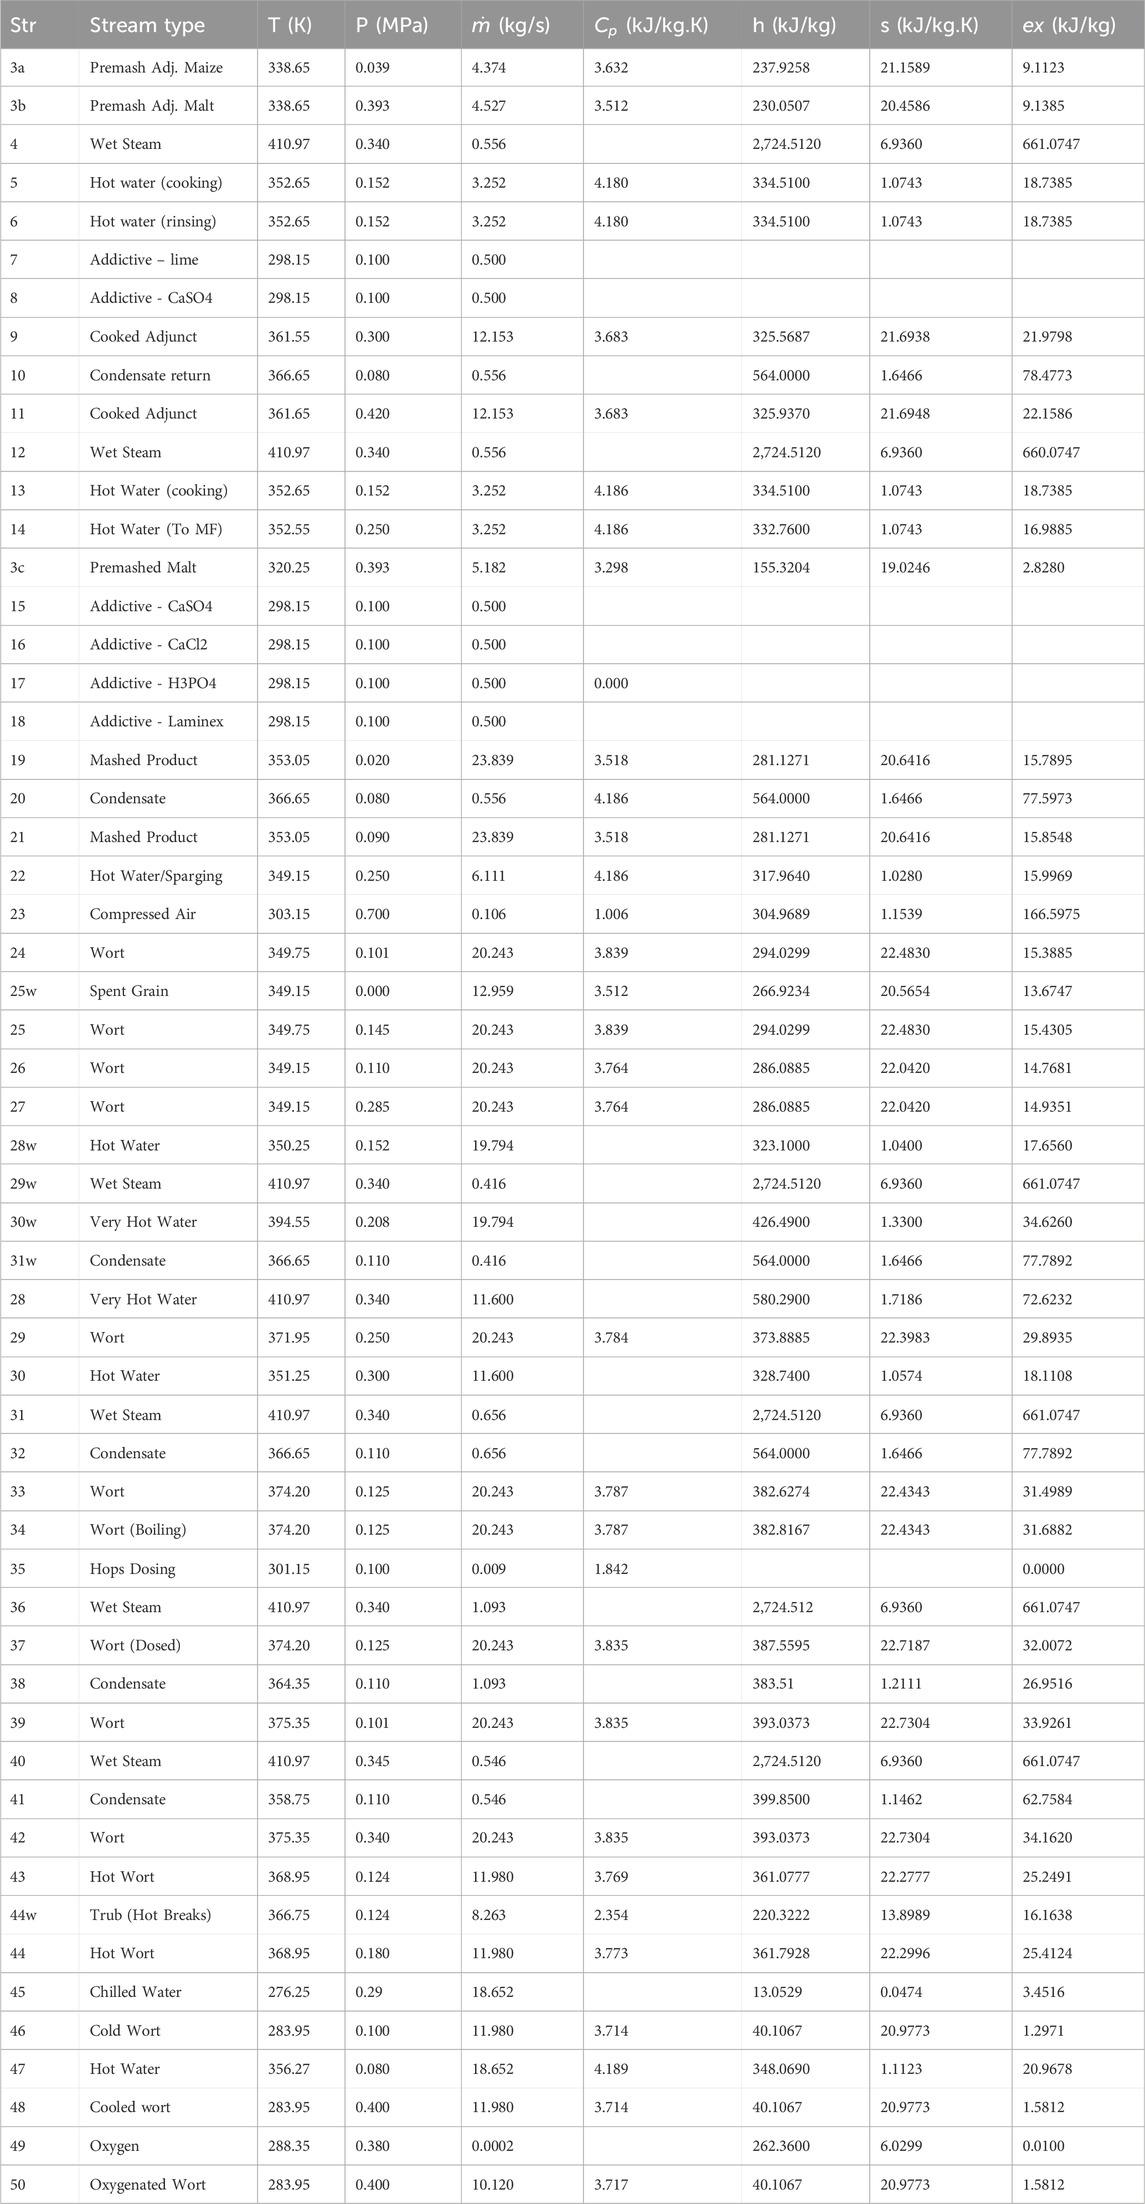
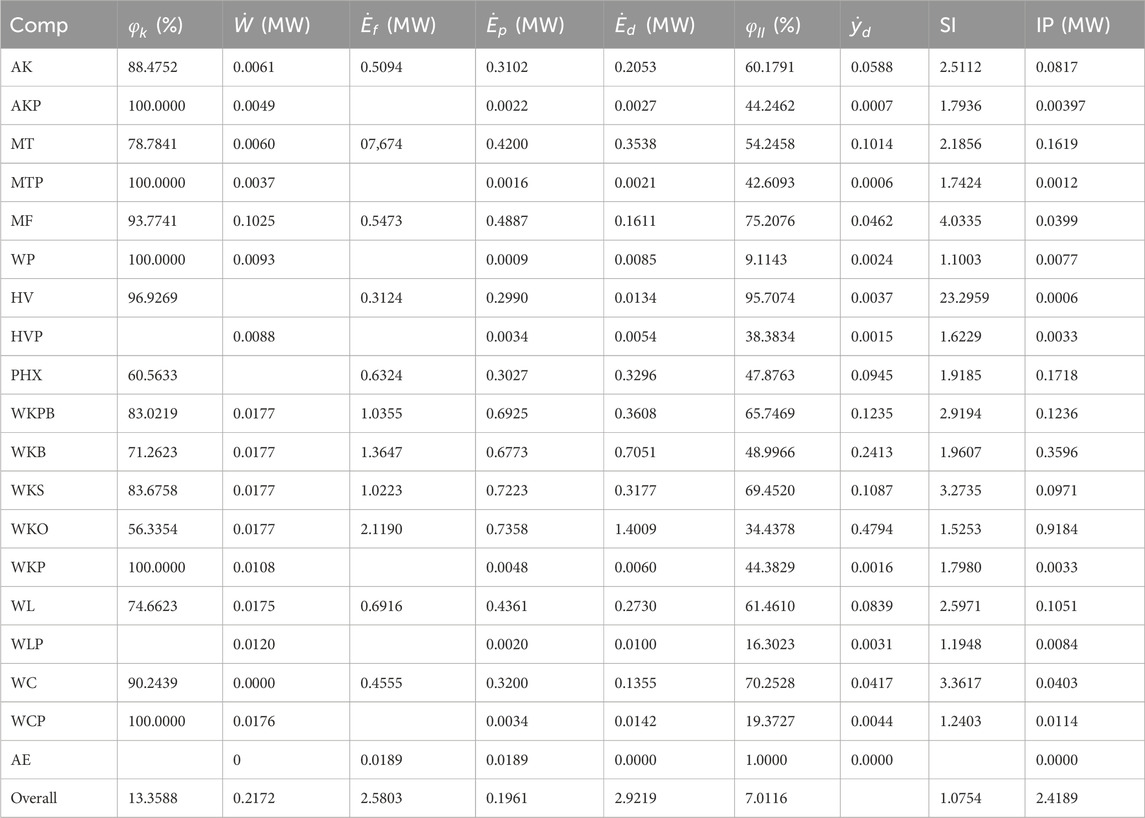
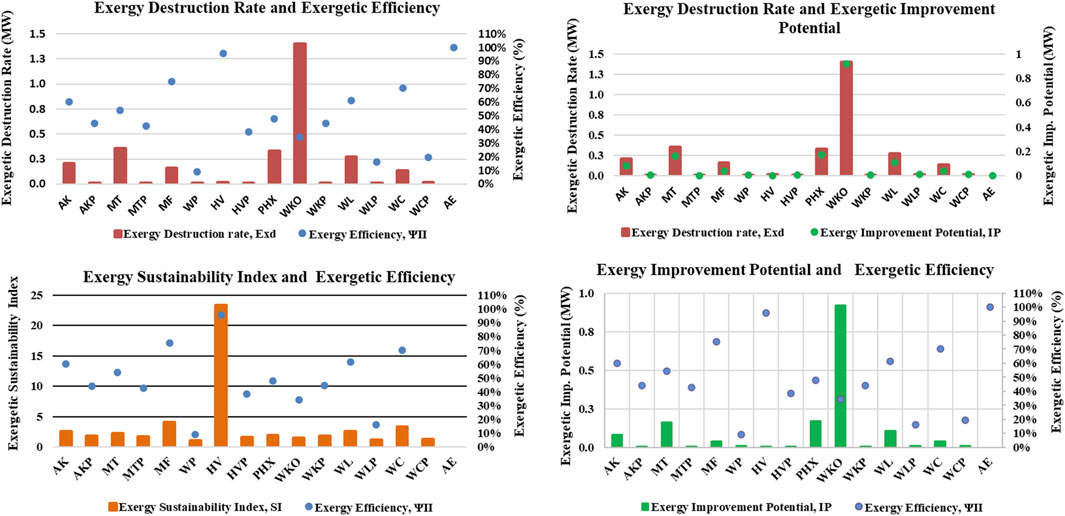
The thermodynamic properties of the process streams of the brewhouse are shown in Table 4. In Table 5, the brewhouse exergetic performances showed that the destruction rate, efficiency, improvement potential rate, and sustainable index were 2.9219 MW, 7.0116%, 2.4189 MW and 1.0754, respectively. The wort kettle had the highest destruction rate distantly followed by the mash tun and wort preheater. During wort stripping, there is rapid heat transfer from the kettle to the wort, leading to high exergy destruction. The finite temperature differential between the steam and surroundings during wort boiling also increases irreversibility. Also, the wort experienced a remarkable drop in exergetic value due to the exergy loss accompanying the 5% water content stripped off. This exergy cannot be accounted for since the stripped-off content is not captured or reused. Even though the first heating process, wort pre-boiling, has the least exergy destruction rate, there is a potential to avoid this destruction if the exit temperature of the wort from the preheater increased to the needed wort boiling temperature.
Thus, thermal insulation of the wort kettle based on its economic viability should be of interest in the optimization efforts for the component. The lowest destruction rates were found in the pumps with a total percentage of 1.66%. The wort pump WP, wort whirlpool pump WLP, and wort cooler pump WCP, were the least efficient components in the brewhouse with exergetic efficiencies of 9.11%, 6.30%, and 19.37%, respectively.
The holding vessel, mash filter, and wort cooler were the main components with the most efficient exergetic efficiencies of 95.71%, 75.21%, and 70.25%, respectively. The contribution of the pumps to the brewhouse’s exergetic destruction rate was found to be insubstantial based on their functional exergetic efficiency values. The cumulative exergy destruction ratio of the three pumps was only 1.01%. The low exergy destruction ratio and functional efficiency of the pumps indicated that their inefficiencies stemmed from oversized mechanical work inputs from the electric motors powering the pumps, rather than from external irreversibility. Therefore, utilizing well-sized motors that supply the required pressure head for the wort transfers would enhance the pump’s exergetic efficiency.
Improving the exergetic efficiencies of the wort kettle (34.44%), preheater (47.88%) and the mash tun (54.25%) will significantly raise the brewhouse efficiency. While thermal insulation and throttling of the wet steam, so that steam heating is done at the programmed specific enthalpy of 2,724.51 kJ/kg and at a considerably lower temperature, provide substantial improvements of the kettle and tun, a pressure controller provides good improvement in the preheater’s efficiency. The mash filter and wort cooler, despite demonstrating relatively high exergetic efficiencies, remain contributors to the overall brewhouse exergy destruction, comprising 9.12% of the total. This suggests potential for further improvement. The exergetic heat loss of the mash filter can be attributed to the sparging process, specifically the substantial heat release during the initial 5–7 min. Proposed solutions encompass the exploration of a retrofit heat recovery system and the reduction of sparging cycle duration. Regarding the wort cooler, the predominant source of external irreversibility is the heat transfer between the cold exergy of the chilled water and the hot exergy of the hot wort, as well as heat absorption from the surroundings.
Figure 2 dashboard shows exergetic indicators and reflects that high destruction rates indicate low sustainability index and great potential for improvement. Components with higher destruction rates have higher improvement potentials. However, while the preheater has a lower destruction rate than the mash tun, its potential for improvement is higher. Optimization potentials for the preheater were proposed in Section 3.4.2. The holding vessel, mash filter, and wort cooler were top performers, with high exergetic sustainability indices and efficiencies.
3.2.3 Overall exergetic performances of the wort production system
The exergetic destruction rate for wort production was calculated at 3.2737 MW, with a specific destruction rate of 9.4348 kW/hL and an operational exergetic efficiency of 6.61%. The potential for exergetic improvement was estimated at 2.5861 MW, with brewhouse operations identified as the cause of 89.25% of production inefficiencies.
3.3 Exergoeconomic analyses and performance indicators for system components
This section and its subsections assessed the exergoeconomic variables critical for the analyses of production line components. The objectives included understanding how cost rates were formed, identifying significant components and potential adjustments, and providing valuable data for improvements. To determine which components impact a section the most, the sum of the cost rates for exergy destruction rate and the capital investment and O&M
3.3.1 Exergoeconomic performance indicators for components of the milling room
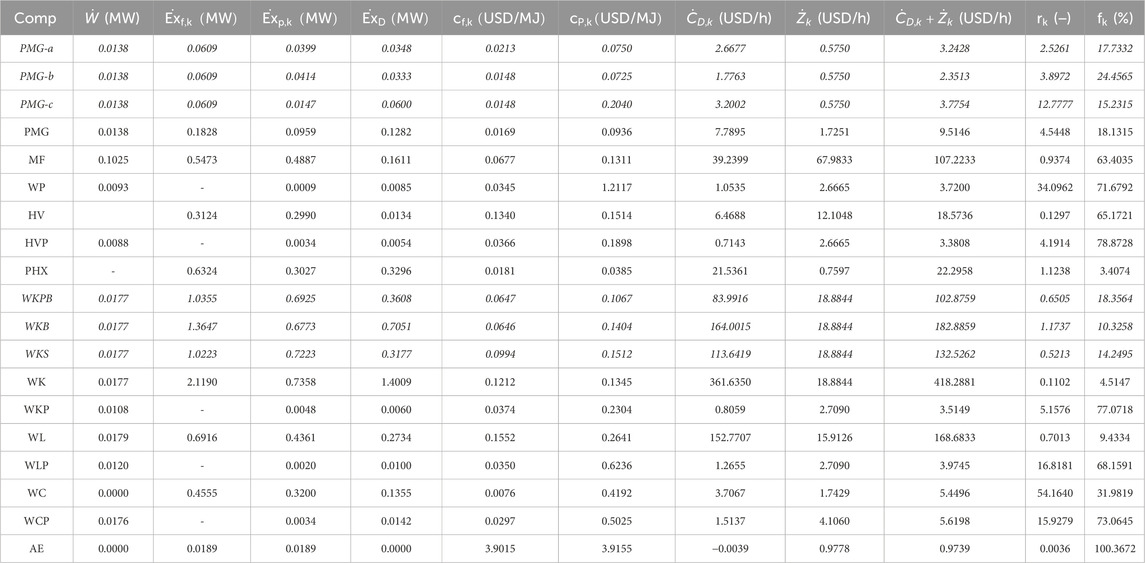
The first three rows, italicized, in Table 7 show the exergoeconomic variables of the three processes carried out in the premasher. The fourth row expresses the overall effects of the processes for the component. The premashing of the malt grist had the most significant total cost increase of the three processes; therefore, from an exergoeconomic standpoint, this process is the most relevant for the component. The
Overall, the low values of
3.3.2 Exergoeconomic performance indicators for components of the brewhouse
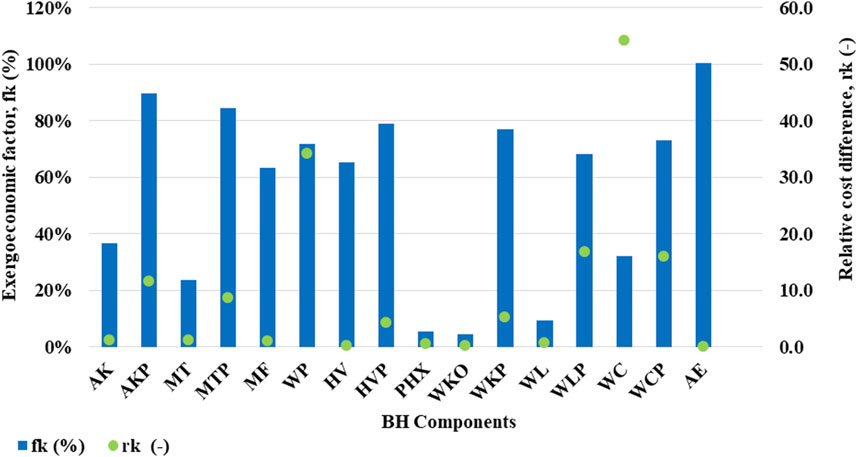
Table 7 also presents the exergoeconomic variables for each component in the brewhouse. The wort kettle, the whirlpool and the mash filter, in decreasing order, were pinpointed as the most significant components from an exergoeconomic standpoint. The wort kettle had the greatest impact on the brewhouse’s cost rate. Its exergoeconomic factor, Figure 3, reveals that the costs related to the wort kettle were mostly dominated by the exergy destruction cost rate. Hence, improving the kettle’s performance can reduce the cost of wort produced per hectoliter. To reduce exergy destruction, steam heating at low temperature, thermal cladding of kettle, and eliminating the preboiling phase are improvement potentials. Implementing these measures can increase the non-exergetic cost rate
The second most relevant component, the whirlpool, has a low
Therefore, it is expected that the cost-effectiveness of the wort production would improve if the whirlpool’s cost rate of exergy destruction is minimized even at the expense of increased
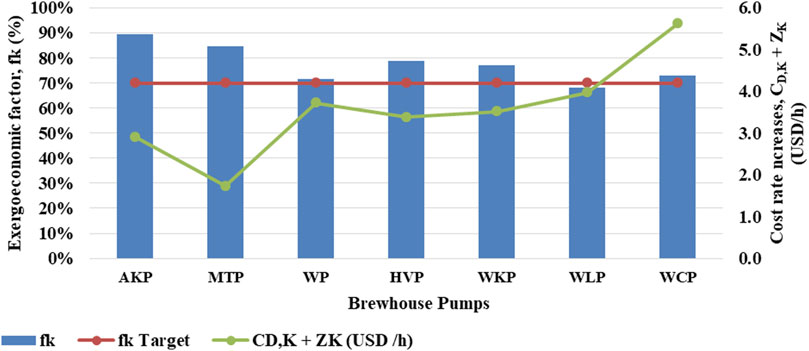
Hence, less efficient or smaller pumps will improve the overall cost-effectiveness of the wort processes. Unlike the remaining pumps in the section, the Whirlpool Transfer Pump, WLP, showed a remarkable and relatively low
The preheater had a very low
3.3.3 Relative performances of the wort system components and sections
Credible optimization efforts involving numerous components can result in practical benefits such as reduced energy consumption, minimized material usage, and lowered costs.
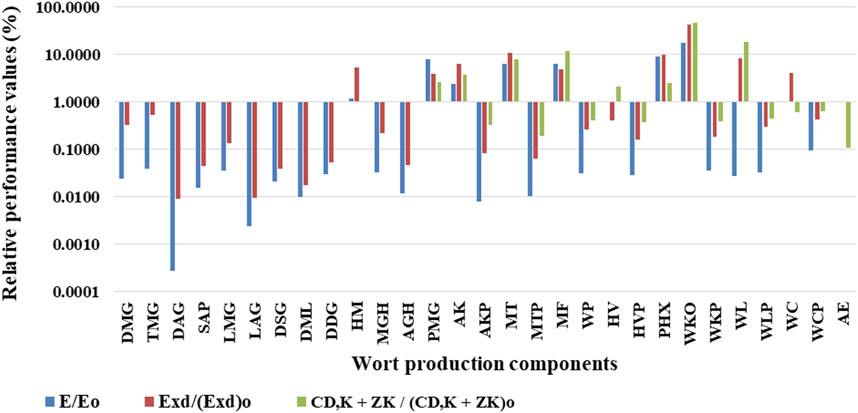
Figure 5 highlights the relative performances of all the components based on the tripod analyses conducted. From an energy analysis standpoint, the wort kettle, preheater, premasher, mash tun, and mash filter were identified as the top five significant components in decreasing order of energy consumption. From the exergy analysis standpoint, the wort kettle (42.7911%), mash tun (10.8086%), preheater (10.0683%), whirlpool (8.3522%), and adjunct kettle (6.2705%) were identified as the top five components with the highest rates of total exergy destruction. And from the exergoeconomic analysis, the wort kettle, whirlpool, mash filter, mash tun, and adjunct kettle were pinpointed as the top five most significant components in decreasing order with overall relative total cost increases of 46.7896%, 18.8689%, 11.9940%, 7.8957%, and 3.7985% respectively. This ranking outperforms that generated from exergetic analysis because it resulted from the combined studies of exergetic performance and economic viability for each component in the production line. The quality of the results from the exergoeconomic analyses is enhanced when evaluated values of non-exergetic cost rates are replaced with current prices supplied by equipment vendors.
In conclusion, the tripod analyses of the wort production have identified the wort kettle as the top priority component for optimization efforts. Improving the steam heating process conditions for the wort kettle, mash tun, and adjunct kettle, which are all connected to the same fuel stream, is expected to increase their thermodynamic efficiencies, decrease the total exergy destruction rate, and lower the cost rate of the wort produced. Other optimization potentials worth investigating for the wort processes include reduction in the mass flowrate of the very hot water supplied to the preheater and minimization of investment costs while optimizing volumetric flow rates and efficiencies of pumps for mash and wort transfers.
More importantly, the results of this research showed that the average energy intensity values for wort production, both electrical and thermal, were comparable to values reported for European breweries by Scheller et al. (2008), 0.84 kwh/hL and 10.2 kwh/hL, respectively. However, the presence of adjunct maize in the brewing ingredients (19.40% of the total brewing grains) resulted in noticeable variations in the values reported due to changes in the specific heat capacity and density of the mash produced. Additionally, other factors such as the age of brewing equipment, climatic differences, and adopted steam heating pressure in breweries, may have influenced the results. Further correlations between the findings of this research and reported literature on the three main wort production processes (mashing, heating, and wort boiling) are observable in Slawitsch et al. (2014) and Scheller et al. (2008). Slawitsch et al. (2014) developed a brewery model to evaluate the thermal load in brewing processes. The model was based on energy audits in various international breweries, representing 80%–90% of real brewery energy usage. The results from the model for three selected breweries of different sizes for mashing, heating, and wort boiling were as follows: 5.39–5.87 MJ/hL (Decoction) for mashing, 6.83–9.88 MJ/hL for heating, and 2.19–7.88 MJ/hL for wort boiling. These results aligned well with the values obtained from this research: mashing (6.38 MJ/hL, Decoction), heating (9.38 MJ/hL), and wort boiling (17.50 MJ/hL, 5% total evaporation). The variation in wort boiling values could be attributed to energy losses on brewing lines and the purity of brewing grains. The results also correlated well with the findings of Scheller et al. (2008) for European breweries: mashing (7.96 MJ/hL), heating (11.84 MJ/hL), and wort boiling (4.5% total evaporation) (10.87 MJ/hL). The study also observed an expected increase in thermal load for a 5%–4.5% total evaporation for wort stripping.
In comparison to dairy milk systems, the wort production system is less energy efficient. Oztuna (2023) found that a dairy milk system with fifteen operational components had an overall energy efficiency of 45.5%, while Yildrim and Genc (2017) reported an overall efficiency of 85.4% for milk powder production from whole milk using eight operational components. The lower energy efficiency of the wort production system can be attributed to its nineteen operational components, which create more sources of inefficiency.
The efficiency of a system is impacted by entropy production or exergetic destruction, which increases costs for O&M and other operating parameters. Similar production lines for processed materials might have a similar trend of exergoeconomic total cost increase (
3.4 Optimization potentials of key exergetic indicators using steam throttling mechanism
The analysis of the steam distribution conditions used in the heating process of brewing in the visited Anheuser-Busch InBev breweries in Nigeria suggests potential for improvement in energy efficiency and cost reduction of processed brews. By implementing steam throttling to just before the superheat conditions, optimization opportunities can be realized. The process of steam throttling results in a pressure drop leading to an increase in steam quality and a drop in temperature. Through adjustment of the wet steam pressure within its saturated region, notable effects on exergetic performance indicators were observed for the studied brewery, Figure 6. Specifically, at a throttled down value of 2.98 bars, the wet steam was found to approach its dry vapor state, representing the lowest throttled condition for wet steam at the predefined heating content, enthalpic value of 2,724.49 kJ/kg. Nevertheless, adjusting the steam heating pressure from 3.4 bars to 3.0 bars resulted in an enhancement of the exergetic efficiency of the wort production system, with an increase from 6.61% to 6.78%. This adjustment led to a notable 1.60% reduction in exergetic destruction and a decrease in cost rates from 0.0681 USD/s to 0.0675 USD/s. These positive changes can be attributed to the lower exergy value of the wet steam, which now possesses a higher dryness fraction and low temperature at the desired enthalpic value. However, the exergetic improvement potential changes from 2.5861 MW to 2.5140 MW with a corresponding change from 1.0708 to 1.0727 for the exergetic sustainability index. The analysis underscores the influence of pressure reduction via steam throttling on the exergoeconomic performance of the wort processing system, particularly in terms of fuel cost and the size of process heating brewing components. Notably, implementing steam throttling along the wort production line presents an annual cost-saving opportunity of USD 17,280.
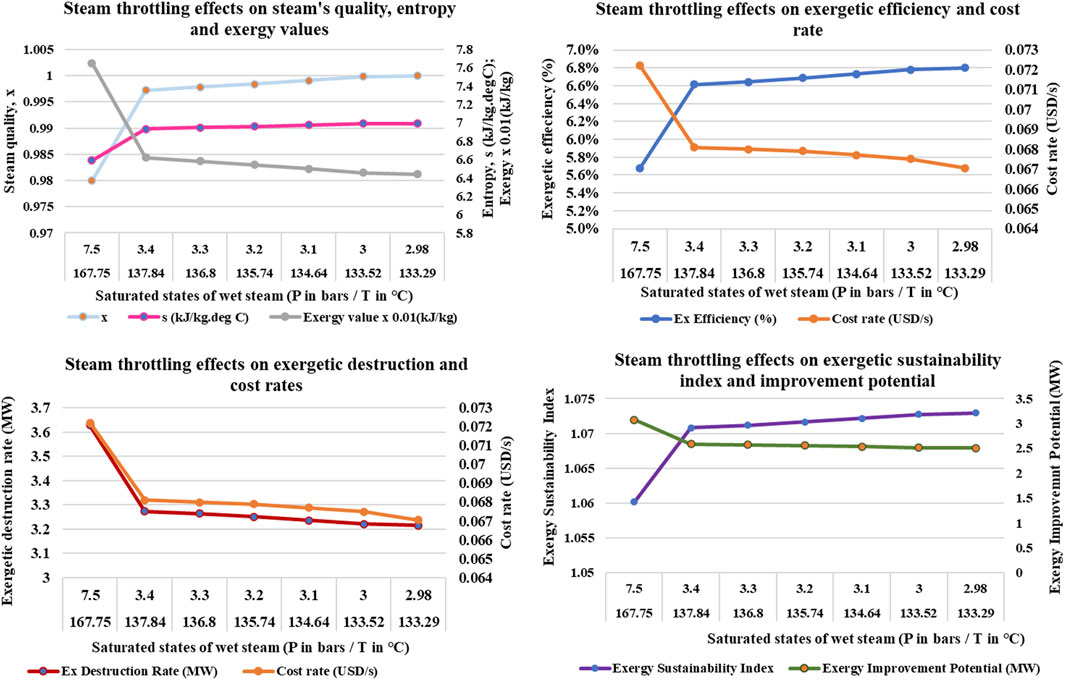
Figure 6. Effects of steam throttling on exergetic performance variables and cost rate for wort processing system.
4 Conclusion
This study analyzed the energy quality in the wort production of an industrial-scale brewery and identified the components that impact the performance of the process from energy, exergy and exergoeconomics standpoints. The energetic analyses showed that the energy requirements per hectoliter of high-gravity wort were estimated at (86 ± 1) MJ/hL with an operational energy efficiency of 30.35%. The top five significant components were identified as the wort kettle, preheater, premasher, mash tun, and mash filter. The exergetic analyses revealed that the overall exergetic destruction rate and specific destruction rate for the wort production were 3.2737 MW and 9.4348 k W/hL, respectively, at an operational exergetic efficiency of 6.61%. The overall improvement potential and sustainability index were estimated at 2.5861 MW and 1.0708, respectively. Additionally, the top five components with the highest rates of cumulative exergy destruction were the wort kettle (42.7911%), mash tun (10.8086%), preheater (10.0683%), whirlpool (8.3522%), and adjunct kettle (6.2705). Lastly, the exergoeconomic analyses revealed a cost rate of 0.0681 USD/s for wort production and pinpointed the most significant components as the wort kettle, whirlpool, mash filter, mash tun, and adjunct kettle. Further studies could focus on quantifying the cost savings accruable to the optimization potentials identified in the wort production.
Data availability statement
The original contributions presented in the study are included in the article/Supplementary Material, further inquiries can be directed to the corresponding author.
Author contributions
OS: Data curation, Formal Analysis, Investigation, Methodology, Software, Validation, Writing–original draft, Writing–review and editing. TS: Data curation, Formal Analysis, Investigation, Methodology, Software, Supervision, Validation, Writing–original draft, Writing–review and editing. OO: Conceptualization, Data curation, Formal Analysis, Investigation, Methodology, Software, Supervision, Validation, Writing–original draft, Writing–review and editing.
Funding
The author(s) declare that no financial support was received for the research, authorship, and/or publication of this article.
Conflict of interest
The authors declare that the research was conducted in the absence of any commercial or financial relationships that could be construed as a potential conflict of interest.
Publisher’s note
All claims expressed in this article are solely those of the authors and do not necessarily represent those of their affiliated organizations, or those of the publisher, the editors and the reviewers. Any product that may be evaluated in this article, or claim that may be made by its manufacturer, is not guaranteed or endorsed by the publisher.
Supplementary material
The Supplementary Material for this article can be found online at: https://www.frontiersin.org/articles/10.3389/fenrg.2024.1456688/full#supplementary-material
References
Almoghrabi, A., and Fellah, G. (2022). Thermoeconomic approach for evaluating the performance of multi-effect-mechanical vapor compression desalination unit. J. Eng. Res. (University of Tripoli) 33, 37–50.
Bai, J., Pu, T., Xing, J., and Niu, G. (2011). “Research on energy consumption analysis of beer brewing process,” in International Conference on Electronic and Mechanical Engineering and Information Technology, Harbin, Heilongjiang, China, August, 2011 (EMEIT), 12–14. doi:10.1109/EMEIT.2011.6022892
Chan, S. P. (2007). Contemporary engineering economics. 4th Ed. UpperSaddle, River: Pearson Education Inc.
Czechminireweries.com (2024). Production of breweries and equipment for production beer and fruit alcoholic beverages. Available at: https://www.czechminibreweries.com/# (Accessed March 5, 2019).
Dhanushkodi, S., Wilson, V. H., and Sudhakar, K. (2016). Energy analysis of cashew nut processing agroindustries: a case study. Bulg. J. Agric. Sci. 22 (4), 635–642.
Dogbe, S. E., Mandegari, M., and Gorgens, F. J. (2017). Exergetic diagnosis and performance analysis of a typical sugar mill based on Aspen Plus® simulation of the process. Energy 145, 614–625. doi:10.1016/j.energy2017.12.134
Dumbliauskaite, M., Becker, H., and Marechal, F. (2010). “Utility optimization in a brewery process based on energy integration methodology,” in Proceedings of ECOs.
Erbay, Z., and Koca, N. (2012). Energetic, exergetic, and exergoeconomic analyses of spraydrying process during white cheese powder production. Dry. Technol. 30 (4), 435–444. doi:10.1080/07373937.2011.647183
Erlach, B., Tsatsaronis, G., and Cziesla, F. (2001). A new approach for assigning costs and fuels to cogeneration products. Int. J. Appl. Thermodyn. 4 (3), 145–156.
Fadare, D. A., Nkpubre, D. O., Oni, A. O., Falana, A., Waheed, M. A., and Bamiro, O. A. (2010). Energy and exergy analyses of malt drink production in Nigeria. Energy 35, 5336–5346. doi:10.1016/j.energy.2010.07.026
Fajardo, J., Sarria, B., Castellon, L., and Barreto, D. (2015). “Thermoeconomic analysis of wheat flour agroindustrial plant,” in Proceedings of the 15th international mechanical engineering congress and exposition. IMECE2015.
Fox, P. G., and Bettenhausen, M. H. (2023). Variation in quality of grains used in malting and brewing. Front. Plant Sci. 14, 1172028. doi:10.3389/fpls.2023.1172028
Frangopoulos, A. C. (1992). Optimal synthesis and operation of thermal systems by the thermoeconomic functional approach. J. Eng. Gas. Turbines Power 114 (4), 707–714. doi:10.1115/1.2906646
Galitsky, C., Martin, N., Worrell, E., and Lehman, B. (2003). “Energy efficiency improvement and cost saving opportunities for breweries,” in A guide for energy and plant managers.
Genc, M., Genc, S., and Goksungur, Y. (2017). Exergy analysis of wine production: red wine production process as a case study. Appl. Therm. Eng. 117, 511–521. doi:10.1016/j.applthermaleng.2017.02.009
Gertsbakh, I. (2003). “Measurement uncertainty: error propagation formula,” in Measurement theory for engineers (Springer). doi:10.1007/978-3-662-08583-7_5
Gungor, A., Erbay, Z., and Hepbasli, A. (2012). Exergoeconomic (thermoeconomic) analysis and performance assessment of a gas engine–driven heat pump drying system based on experimental data. Dry. Technol. 30 (1), 52–62. doi:10.1080/07373937.2011.618897
Hepbasli, A., Colak, N., Hancioglu, E., Icier, F., and Erbay, Z. (2010). Exergoeconomic analysis of plum drying in a heat pump conveyor dryer. Dry. Technol. 28, 1385–1395. doi:10.1080/07373937.2010.482843
Intratec (2019). Chilled water cost: industrial utilities. Available at: www.intratec.us/products/water-utilities-cost/commodity/chilled-water-cost.
Lazzarettoa, A., and Tsatsaronis, G. (2006). SPECO: a systematic and general methodology for calculating efficiencies and costs in thermal systems. Energy 31, 1257–1289. doi:10.1016/j.energy.2005.03.011
Li, B., Li, C., Huang, J., and Li, C. (2020). Exergoeconomic analysis of corn drying in a novel industrial drying system. Entropy 22 (689), 1–18. doi:10.3390/e22060689
Matches.com (2014). Matches’ process equipment cost estimates. Available at: http://matche.com/equipcost/default.html (Accessed March 5, 2019).
Mignon, D., and Hermia, J. (1993). Using BATCHES for modeling and optimizing the brewhouses of an industrial brewery. Comput. Chem. Eng. 17, 51–56. doi:10.1016/0098-1354(93)80208-5
Morosuk, T., Tsatsaronis, G., Boyano, A., and Gantiva, C. (2012). Advanced exergy-based analyses applied to a system including LNG regasification and electricity generation. Int. J. Energy Environ. Eng. 3 (1), 1–9. doi:10.1186/2251-6832-3-1
Mua, J. P., and Jackson, D. S. (1995). Gelatinization and solubility properties of commercial oat starch. Starch-Starke 47 (1), 2–7. doi:10.1002/star.19950470103
Oztuna, T. O. (2023). Energy and production analysis of a dairy milk factory: a case of study. J. Therm. Eng. 9 (5), 1163–1176. doi:10.18186/thermal.1370731
Scheller, L., Michel, R., and Funk, U. (2008). Efficient use of energy in the brew house. MBAA TQ 45 (3), 263–267. Huppmann GmbH, Kitzingen, Germany.
Singh, P. R., and Heldman, R. D. (2013). “Introduction to food engineering,” in Food science and technology international series. 4th Ed. (Academic Press).
Slawitsch, M. B., Hubmann, M., Murkovic, M., and Brunner, C. (2014). Process modelling and technology evaluation in brewing. Chem. Eng. Process. Process Intensif. 84, 98–108. doi:10.1016/j.cep.2014.03.010
Tinoco-Caicedo, L. D., Lozano-Medina, A., and Blanco-Marigorta, M. A. (2020). Conventional and advanced exergy and exergoeconomic analysis of a spray drying system: a case study of an instant coffee factory in Ecuador. Energies 13, 5622. doi:10.3390/en13215622
Tokos, H., Pintaric, Z. N., and Glavic, P. (2010). Energy saving opportunities in heat integrated beverage plant retrofit. Appl. Therm. Eng. 30, 36–44. doi:10.1016/j.applthermaleng.2009.03.008
Towler, G., and Sinnott, R. (2008). Chemical engineering design: principles, practice and economics of plant and process design. Elsevier Inc.
Tsatsaronis, G. (2007). Comments on the paper ‘A brief commented history of exergy from the beginnings to 2004. Int. J. Thermodyn. 10 (4), 187–192.
Tsatsaronis, G., and Winhold, M. (1985). Exergoeconomic analysis and evaluation of energy-conversion plants—I. A new general methodology. Energy-The Int. J. 10 (1), 69–80. doi:10.1016/0360-5442(85)90020-9
Valero, A., and Torres, C. (2009). Thermoeconomic analysis. in Center of research for energy resources and consumption (Spain: Universidad de Zaragoza).
Waheed, M. A., Jekayinfa, S. O., Ojediran, J. O., and Imeokparia, O. E. (2008). Energetic analysis of fruit juice processing operations in Nigeria. Energy 33, 35–45. doi:10.1016/j.energy.2007.09.001
Willaert, G. R., and Baron, V. G. (2005). Applying sustainable technology for saving primary energy in the brewhouse during beer brewing. Clean. Techn Environ. Policy 7, 15–32. doi:10.1007/s10098-004-0249-8
Yildirim, N., and Genc, S. (2017). Energy and exergy analysis of a milk powder production system. Energy Convers. Manag. 149, 698–705. doi:10.1016/j.enconman.2017.01.064
Zisopoulos, F. K., Moejes, N. S., Rossier-Miranda, J. F., Goot, J. A., and Boom, M. R. (2015). Exergetic comparison of food waste valorization in industrial bread production. Energy 82, 640–649. doi:10.1016/j.energy.2015.01.073
Zisopoulos, K. F. (2016). Exergy analysis in industrial food processing. PhD thesis. Wageningen, NL: Wageningen University, 229. doi:10.18174/383689
Nomenclatures
CI Capital Investment
ex Specific exergy, kJ/kg
h Specific enthalpy, kJ
hl hectoliter
oP Degree Plato
PEC Purchase Equipment Cost
s Specific entropy, kJ/K
S Salvage value
x Mass fraction
X Dryness fraction
Subscripts
0 Reference conditions
D Destruction
e Exit properties of stream
F Fuel
i Inlet properties of stream
k Component k
o Outlet of a component
Q Heat energy
tot Total
W Electrical energy input
Superscripts
e Electrical energy
h Human energy
k Component
Greek Letters
ϴ Maintenance factor
Ƞ First Law Energy efficiency
ρ Density
δ Uncertainty
Ø Thermal efficiency of section
Keywords: exergoeconomics, exergy, energy, industrial brewing, mash, wort
Citation: Jemigbeyi OS, Salau TAO and Oyewola OM (2024) Energetic, exergetic, and exergoeconomic analyses of beer wort production processes. Front. Energy Res. 12:1456688. doi: 10.3389/fenrg.2024.1456688
Received: 29 June 2024; Accepted: 23 September 2024;
Published: 29 October 2024.
Edited by:
Hadi Taghavifar, UiT The Arctic University of Norway, NorwayReviewed by:
Claudia Gutiérrez-Antonio, Autonomous University of Queretaro, MexicoTolga Taner, Aksaray University, Türkiye
Ezequiel Godoy, Universidad Tecnológica Nacional, Argentina
Copyright © 2024 Jemigbeyi, Salau and Oyewola. This is an open-access article distributed under the terms of the Creative Commons Attribution License (CC BY). The use, distribution or reproduction in other forums is permitted, provided the original author(s) and the copyright owner(s) are credited and that the original publication in this journal is cited, in accordance with accepted academic practice. No use, distribution or reproduction is permitted which does not comply with these terms.
*Correspondence: O. M. Oyewola, b29veWV3b2xhMDAxQGdtYWlsLmNvbQ==, b295ZXdvbGFAYWxhc2thLmVkdQ==
 O. S. Jemigbeyi
 T. A. O. Salau1
 O. M. Oyewola