 Zhipeng Lv1
 Bingjian Jia
- 1State Grid Shanghai Energy Internet Research Institute, Shanghai, China
- 2Xinjiang Information Industry Co., Ltd., Urumqi, China
The reliability of the power supply for 5G base stations (BSs) is increasing. A large amount of BS backup energy storage (BES) remains underutilized. This study establishes a double-layer optimization distribution network (DN) considering BS clusters. An energy consumption characteristics and scheduling ability model of the BSs was established to address the differences in the characteristics of different traffic flows. A double-tier planning model for BS-joining grid market ancillary services is proposed. The upper-layer model addresses optimal tidal flow problems in DNs to minimize integrated operating costs, while the lower-layer model focuses on BES economic optimization. The double-layer model changes into a single-layer linear model using the Karush–Kuhn–Tucker (KKT) condition and the Big M method. Simulation validation using the IEEE-33 node DN proves that this approach can reduce DN operating costs, regulate voltage fluctuations, and guarantee economical and safe DN operation.
1 Introduction
Information and communication technologies, particularly cellular wireless networks, have been vigorously developed (Habibi et al., 2019; Xiong et al., 2019; Xiong et al., 2020). Compared with previous generations of base stations (BSs), current BSs have the characteristics of high bandwidth, high-density connections, high reliability, and low latency. This exponentially increases the power consumption (Fan et al., 2022; Sun et al., 2022). The specific capacities of backup energy storage (BES) batteries are deployed when constructing the BSs. It provides backup power to the BS in case of a utility power interruption. Owing to the exponential increase in the number of BSs and the power supply reliability of the distribution network (DN), the coordinated scheduling potential of idle BES should not be underestimated. Therefore, there is an urgent need to conduct a study on the coordinated scheduling of power grids that considers the energy consumption characteristics and scheduling ability of BSs, which is of great significance for improving the utilization value of BSs, avoiding the waste of idle resources, and improving the voltage quality.
Some scholars achieved specific results in their research on utilizing BES resources in BSs. Ma et al. (2021) established a double-layer optimization planning model for configuring a BS photovoltaic (PV) BES system, effectively reducing the peak load. This effectively increased the utilization rate of PV power generation and improved its in situ digestion of PV power generation. Han and Ansari (2014) modeled multiple BSs and their equipped renewable energy aggregates as microgrids. The switching operation strategies of the BSs are jointly optimized at the network level. Liu and Natarajan (2015) considered a BES at the BS by optimizing the transmit power and storage usage to reduce the cost. Yong et al. (2021) considered BS availability metrics. They evaluated the dispatchable capacity of a BS BES using a semi-Markov model. Most of the 5G BESs in the above literature participate in grid co-dispatch considering their economy. 5G BS clustering is a simple aggregation. The traffic characteristics of 5G base stations in different city zones differ. The communication load and residual capacity they generate impact the power grid differently. Therefore, analyzing the dynamic energy consumption of base stations in urban areas with different communication characteristics is necessary.
Nowadays, fewer studies take into account the participation of 5G base stations in distribution network planning (Yong et al., 2021; Guo et al., 2022), and further research is needed to scale up the application of 5G base stations and promote the synergistic optimization of network-side resources, such as base stations and distributed generation (DG) and energy storage systems (ESSs), within the distribution network (Cheema, 2020; Ma et al., 2022). Han et al. (2021) proposed a co-optimization method according to the Stackelberg game for demand–response-based DNs and BSs, which reduced the total energy cost and promoted PV consumption. Chen (2020) proposed an economic model for BS BES participation in response requirements, considering the over-discharge penalty. It is optimally solved using a double-layer serial structure algorithm comprising a wolf pack algorithm and a differential evolutionary algorithm. Johann et al. (2018) discussed a time-varying tariff-based energy management strategy. Consumption is improved while costs are minimized. Han and Ansari (2013) proposed the full utilization of renewable energy sources to reduce the energy exhaustion of individual BSs. The BSs with a higher proportion of renewable energy sources serve a larger number of users. Han and Ansari (2014) divided BSs into clusters based on the electrical distance. Sharing electrical energy in a cluster fully utilizes new energy. Although the above studies have proven the prospect of BS participation in DN scheduling, most are aimed at BS participation in DN PV consumption and distributed BES capacity allocation and have not been combined with on-load tap changers (OLTCs), static reactive power compensation (SVC) devices, or other network-side resources that are coordinated and optimized. Simultaneously, the above literature’s double-layer optimization algorithms are mostly heuristic-intelligent or reinforcement learning algorithms. Although heuristic intelligence algorithms can obtain an optimal solution under certain conditions, they can easily fall into a local optimum and are more dependent on the acceleration of the data. In contrast, reinforcement learning algorithms can deal with complicated environments and tasks. However, they require considerable computational resources and time for training and are more sensitive to parameter tuning and selection.
Based on the aforementioned issues, a double-layer optimization strategy for DNs considering BS clusters is proposed. First, we established the energy consumption characteristics and scheduling capability model of BSs with different communication traffic characteristics and analyzed the potential of BSs to participate in DN scheduling. We propose a two-layer cooperative scheduling optimization model for BSs to participate in grid-market auxiliary services. The upper-layer model solved the optimal tidal current problem to achieve the most negligible comprehensive operating cost. The lower-layer model solved the economic problems associated with the BS. Finally, through a simulation example analysis, it was verified that the BS cluster could coordinate to join the economic security dispatch of the DN, improve the voltage fluctuation, and reduce its own operating cost simultaneously under the premise of guaranteeing its power safety.
2 5G BS characterization model
Macro-BSs have more comprehensive coverage and higher power consumption, and only macro-BSs are equipped with self-containing BES at this stage. Hence, this study focuses on macro-BSs with tremendous dispatchable potential.
2.1 Basic structure of a 5G BS
The BS equipment primarily includes communication, electricity, and other equipment. The basic structure of a BS is illustrated in Figure 1. BS communication equipment typically comprises an active antenna system (AAU) and a building base band unit (BBU). Conversely, electrical equipment provides power supply and BES, whereas indoor inverter air-conditioning, rooftop distributed energy, and lighting are other equipment.
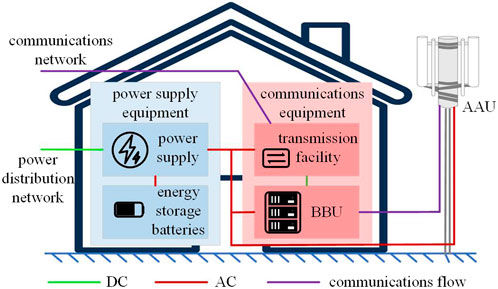
Figure 1. Basic structure of the 5G macro BS.
Under regular operation, the BS power supply provides most power demand by converting AC power from the distribution grid to DC power. In addition to the assurance of operational BS reliability when the distribution grid power supply is interrupted for a short period, the BSs are configured with a BES that can provide power to the communication equipment for a specified duration, typically 3 hours (Renga et al., 2018).
2.2 Operational characteristics of 5G BSs
2.2.1 5G BS energy consumption characteristics
Over 80% of the energy consumed in the BS communication load comes from the AAU (Hassan et al., 2019). It is susceptible to the intensity of the communication load, and its power consumption is positively proportional to the number of mobile users accessing the system.
The energy consumption of the BS equipment can be divided into static and dynamic types. Static power consumption is independent of the communication load. This is the primary energy consumption used to maintain regular operation. Essential energy consumption is the baseline energy consumption of the BBU, transmission equipment, and AAU. Dynamic power consumption refers to the portion linearly correlated with the service traffic. Its power consumption model is expressed in Equation 1.
where P5G,BS,t is the energy consumption of the BS at time t, Pactive,i,t is the energy consumption of BS i in the active state, Psleep,i,t is the energy consumption of BS i in the sleep state at time t, PS,i,t is the static energy consumption of BS i at time t, α is the energy consumption scaling factor of BS i, and PD,i,t is the dynamic energy consumption.
1) When the base station is in the active state, ε = 1. Its power loss Pactive consists of transmitting power PD,i,t and inherent power PS,i,t. With an increase in the BS’s communication load, the corresponding transmitting power PD,i,t increases linearly. The inherent loss PS,i,t refers to the loss in data processing units, power amplifiers, cooling devices, and other components, which changes negligibly with the communication load.
2) When the base station is in a sleep state, ε = 0. Its power loss is fixed as Psleep,i,t.
During the operation, 5G BS transmits signals via the AAU with a certain transmit power; then, these signals are propagated until the terminal devices receive them. In this study, a log-normal shadowing path-loss model is used to describe the propagation loss of 5G signals in outdoor environments (Xiong et al., 2019):
The constraint (Equation 2) defines the propagation path loss (in dB) between BS n and terminal s as a logarithm function of the horizontal distance from 5G BSs to terminal devices.
Based on the propagation path loss, the 5G BS’s transmit power PD,i,t and the terminal device’s received power PRec,i,t satisfy the Equation 3 relationship:
Because of the BS equipment limitations, dynamic energy consumption cannot reach the maximum value and is related to the mobile user communication data, which is expressed in Equations 4, 5.
where β is the coefficient reacting to the mobile user’s communication data and PD,max is the maximum value of the dynamic energy consumption, which is the output power corresponding to the AAU when the mobile user’s communication load is fully loaded.
2.2.2 5G BS BES safe power reserve capacity analysis
A 5G BS BES generally refers to energy consumption under full load for capacity allocation. The BS BES capacity can be found in two aspects: one part is the standby capacity used to guarantee the high-reliability power supply of the BS, and the other is the dispatchable capacity that can participate in the demand response (Frenger and Tano, 2019). With the uncertain change in the mobile users’ communication load, the standby and dispatchable capacity ratio will also change; however, its sum remains constant.
The safe capacity of the BS in each period can be determined from its dispatchable capacity. As shown in Equation 6.
where Cres,t,min is the safe power reserve capacity that the BS requires in period t, P5G.BS,t is the dispatchable capacity that can join the demand response, and Tres,min is the shortest power reserve time of the BS, which can be determined according to the calculation from the literature (Guo et al., 2021). This time is typically taken as 3 hours.
3 Double-layer optimization model for DNs considering the synergy between BS BES and grid-side resources
Considering the BS’s BES, DN and BS have decision variables in the double-layer power system structure. The upper-layer optimization model is a DN optimization model that considers multiple network-side resources. The lower-layer optimization model is a BS system model that considers the characteristics of communication traffic. Under the premise of guaranteeing the autonomy of each model and evaluating the competitive cooperative game relationship between the two models, the double-layer optimization model can iteratively realize the optimization of the entire system.
3.1 Upper DN modeling
3.1.1 Upper-layer objective function
The upper-layer model was used to find the DN optimal tidal current. Its optimization aims to reduce the total operating cost of the DN over the cycle. The expression for this objective function is in Equation 7.
where Cgrid is the cost of exchanging power with the grid; C5G is the revenue from power purchases by the BSs; CESS is the BES’s investment, operation, and maintenance cost; CCA is the cost of carbon emissions from the DN; and Closs is the cost of network loss from the DN. The details are in Equation 8.
where κ is the cost of carbon emissions corresponding to a unit of coal-consumed electricity generation, f is the coal consumption coefficient corresponding to a unit of electricity generation in the external grid, and close is the price per unit of network loss.
3.1.2 Upper-layer constraint
3.1.2.1 Power system current constraints
where pj and qj are the active and reactive power injected into node j, respectively; Pjk and Qjk are the active and reactive power flowing out of node j to the next node k, respectively; and Pij and Qij are the active and reactive power, respectively, flowing into node j from the previous node i.
The above power system trend constraints (Equation 9) are nonlinear constraints that are difficult to solve using the optimization algorithm and need to be relaxed by a second-order cone, and the linearization results are in Equation 10.
3.1.2.2 Security constraints
where Qgrid,t is the reactive power of the distribution grid interacting with a higher grid at time t (Equation 11).
3.1.2.3 Power balance constraints
where pload and qload are the active and reactive loads of each node of the DN, respectively, and PIN and QIN are the active and reactive powers injected into each node of the DN, respectively (Equation 12).
3.1.2.4 Active management equipment constraints
Active DN management equipment includes OLTCs, group-switching capacitor banks (CBs), SVCs, ESSs, and DGs (Dong et al., 2020).
3.2 Lower-layer 5G BS BES model
The lower-layer model solves the BS system operation during the scheduling cycle (24 h). The decision variables are the BS purchased and sold power and the 5G external PV output.
3.2.1 Lower-level objective function
The lower-level optimization objective is to minimize the overall cost of the BS cluster system. The objective function is expressed in Equation 13.
where C5G is described in detail above, c5G.PV,t is the purchase and sale price of electricity from the grid, and P5G.PV,t is the external PV output at time t of 5G.
3.2.2 Lower-level constraint
3.2.2.1 BS backup storage charging and discharging constraints
There is a direct link between backup storage capacity and charging and discharging power. Ensuring that the capacity is within its limits throughout the cycle is vital. The backup storage capacities are equal during the first and last periods of the cycle.
where E5G.ESS,t is the BS BES’s capacity in period t; ' is its self-discharge rate; '5G.ch,t and '5G.dis,t are the BS BES’s charging and discharging efficiencies, respectively; and '5G.dis,t and '5G.ch,t are the BS BES’s charging and discharging identifications, respectively.
3.2.2.2 BS BES SOC constraints
From the BS BES charging and discharging constraints (Equation 14), we can see that BS BES cannot be charged and discharged simultaneously at any given moment. Therefore, the 5G BS BES power loss relationship is discussed in separate cases.
When the BES is charged, the relationship is in Equation 15.
When the BES is discharged, the relationship is in Equation 16.
Here, Pinn,t represents the actual charging and discharging power of the BS BES in period t.
The BS BES SOC at moment t is shown in Equation 17.
where θSOC,t is the BS BES SOC in period t and Eremain,t is the remaining backup capacity of the BS BES in period t.
3.2.2.3 BS system power balance constraints
where load is the mobile user communication load of the 5G BS and P5G is the power purchased from the grid (Equation 18).
3.3 Solution method
Considering the game coupling between BS and DN in this iterative process, a two-layer optimization model for DN is proposed. Its decision variable transmission is more complex and remains a problem that needs to be solved. The Karush–Kuhn–Tucker (KKT) condition is a generalization of the Lagrange multiplier method and is a sufficiently necessary condition for an optimal solution for a convex optimization problem (Fang et al., 2016; Yang et al., 2024). Therefore, in this study, the Lagrangian function of the lower optimization model was conducted. The KKT conditional was used to transform the lower optimization model into the constraints of the upper optimization model. The upper objective function is optimized while ensuring that the lower objective function meets its constraints. Simultaneously, the transformed single-level model has a large number of 0–1 variables multiplied by the decision variables and is non-linear. To linearize the transformed model, 0–1 variables are introduced using the Big M method . It is finally transformed into a mixed-integer second-order cone problem. The solution process is shown in Figure 2.
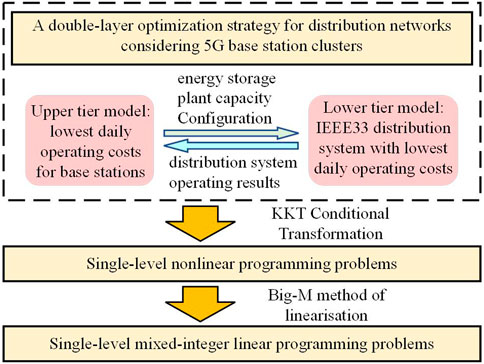
Figure 2. Schematic diagram of the solution process.
4 Example simulation and analysis
4.1 Example overview and parameterization
In this study, we consider an example of an IEEE-33 node DN. The validity and accuracy of the proposed two-layer optimization model are verified through simulation analysis. The topology is shown in Figure 3. The rated voltage of the system was 12.66 kV, and the rated power was 1 MVA. This study considered 1 day (24 h) as a scheduling cycle divided into 24 scheduling periods. The in-cycle load profile and DG output of the system are shown in Figure 4. The purchased and sold electricity tariffs for the distribution grid and the BS BES are listed in Table 1.

Figure 3. IEEE-33 node DN topology.
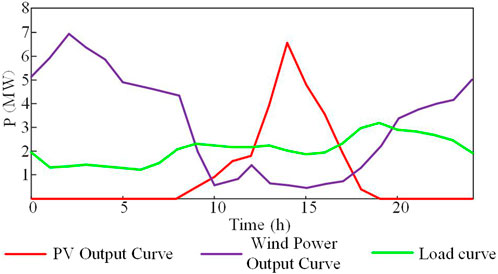
Figure 4. Load profile and DG output during the system cycle.
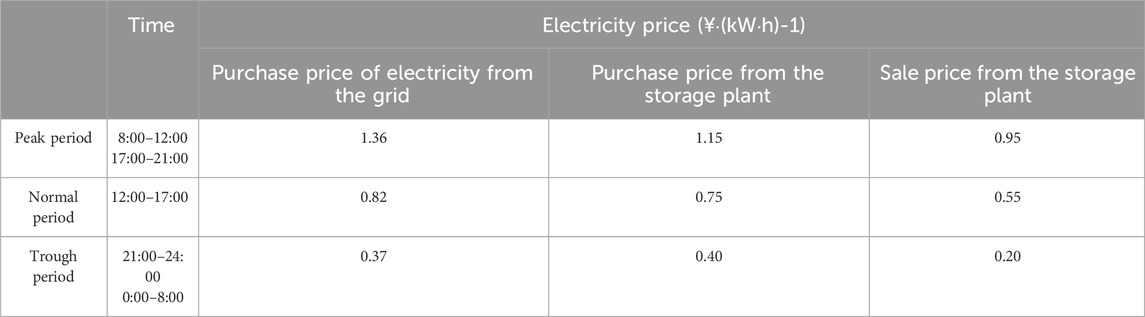
Table 1. Purchase and sale prices for electricity purchased from distribution grids and BES.
As shown in Figure 3, it is assumed that the DG is accessed at nodes 4, 9, 14, 20, and 28 to suit the requirements of this study. The parameters of each active management device were selected from Dong et al. (2020). There were 120 BSs in the DN. According to Equations 1–4, the communication load factor of a 5G base station is related to the region where it is located. As a result, all 5G base stations are divided into BS groups in three different urban geographical areas: industrial, commercial, and residential. A single BS’s maximum and minimum states of charge were 85% and 15%, respectively. The results of the safe power-reserve capacity analysis of each BS-cluster BES are shown in Figure 5.
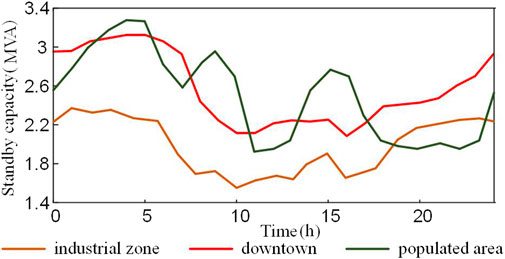
Figure 5. Safe power reserve capacity of backup storage for each 5G BS cluster.
We created three scenarios to validate the validity and accuracy of the proposed two-tier model.
Scenario 1: the active DN was configured with active management equipment, and the BS cluster was not configured with a BES. This served as the blank control group.
Scenario 2: the active DN was configured with active management equipment, and the BS clusters were configured with a BES. BES is not involved in distribution network co-scheduling. This is the traditional conditioning strategy.
Scenario 3: the active distribution grid was configured with active management equipment, and the BS clusters were configured with a BES. BES is involved in distribution network co-scheduling. This is the moderating strategy of this paper.
4.2 Effectiveness and accuracy of the movement control program
A comparison of scenarios 1 and 2 in Table 2 shows that after the BS clusters were equipped with a BES, each BS cluster’s power consumption was still supplied by utility power, with no change in the total operating costs for all BSs. However, the total operating cost of the DN in Scenario 2 is reduced by ¥36,087.2, which is 60.69% lower than that of the DN in Scenario 1. Scenarios 1 and 3 were compared, and the cost for each scenario was reduced to a different degree after backup storage was included in the dispatch. The total operating cost of all BSs was decreased by ¥3,503.1, which is 25.97% lower than that of BSs in Scenario 1. This indicates that the participation of backup storage in the DN co-dispatch facilitates the involvement of BS clusters in the electricity market for higher returns.
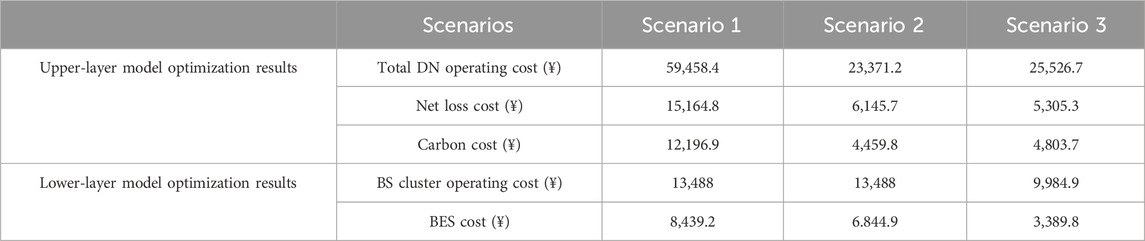
Table 2. Double-layer optimized scheduling results.
Meanwhile, as shown in Table 2, the DN total operating cost in Scenario 3 is ¥25,526.7, which is 57.07% lower than that in Scenario 1. The cost of carbon emissions for Scenario 3 is ¥4,803.7, which is 60.62% lower than that for Scenario 1. The ESS and BS cluster BES charge–discharge line diagrams are shown in Figure 6. Scenario 3: BS clusters introduce a BES for co-scheduling. The reduced number of ESS charged and discharged minimizes the utilization of the existing ESS in the DN. The introduction of a BES in BSs can reduce the ESS capacity allocation. This enables a reduction in ESS operating costs. It can be observed that BS clusters configured with a BES to participate in the synergy can reduce the DN’s total operating cost and provide certain low-carbon benefits.
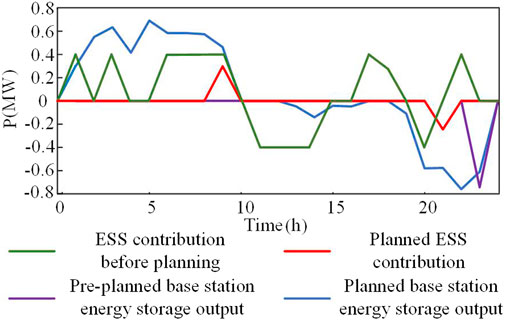
Figure 6. ESS and 5G base station cluster backup storage energy charge/discharge line graphs.
The voltage distributions of scenarios 1, 2, and 3 are shown in Figures 7–9, respectively. As shown in the figure, the individual node voltages are not out of bounds because of the access to active management devices. However, the voltage fluctuations at the system nodes were extensive. Scenarios 1 and 2 are compared. Although the peak-to-valley voltage difference in Scenario 1 is lower than that of Scenario 2, the voltage fluctuation in Scenario 2 is significantly reduced. Scenario 2 is then compared with Scenario 3. The peak-to-valley voltage difference for Scenario 3 is 0.62, which is 43.327% lower than that of Scenario 2. Meanwhile, Scenario 3 does not have the sudden valley-end voltage as in Scenario 2, and the voltage level is smoother.
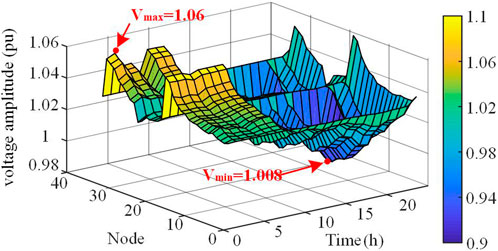
Figure 7. Voltage distribution of nodes in Scenario 1.

Figure 8. Voltage distribution of nodes in Scenario 2.
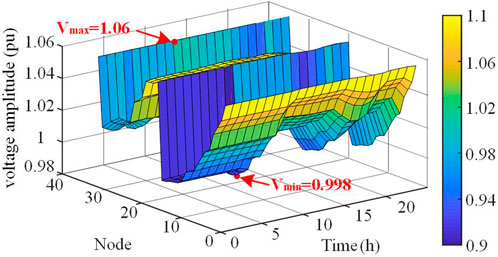
Figure 9. Voltage distribution of nodes in Scenario 3.
The comparison of active management equipment output before and after 5G base station cluster backup storage participation in coordination is shown in Figure 10. Compared with the traditional regulation strategy, the CB and SVC reactive outputs of the regulation strategy in this paper are reduced to some extent. However, the voltage level does not worsen as a result. Instead, it also improves. It can be seen that the participation of backup energy storage in cooperative dispatch can ensure that the voltage level is at an acceptable level. At the same time, it reduces the utilization of the grid-side resources of the distribution network to increase their service life, thereby reducing operating costs.
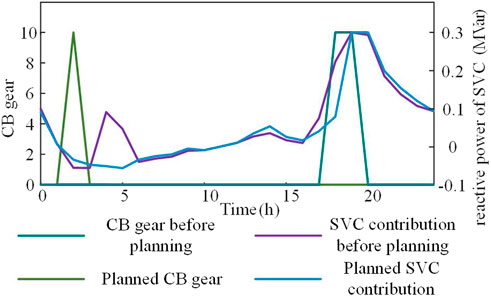
Figure 10. Output of reactive power compensation devices before and after optimization.
5 Conclusion
In this study, we constructed a model of the energy consumption characteristics and dispatchable capacity of BSs in various urban areas. A double-layer optimal scheduling strategy for DNs that considers BS clusters is proposed. The upper-layer model solved the optimal tidal flow problem of the DN, while the lower-layer model focuses on BES economic optimization. Using the Karush–Kuhn–Tucker condition, the lower-level model is transformed into upper-level constraints, and the Big M method converts the nonlinear model into a linear programming problem. The accuracy and precision of the proposed model were verified through numerical simulations and analyses. The following conclusions were drawn: 1) the proposed method reduces the DN total operating cost by 57.07% compared to BS clusters without a backup storage configuration. The total BS operating costs were 25.97% lower than those of the traditional strategies. The rationale is as follows: it fully uses the BS’s redundant ES and revitalizes existing ES scheduling resources. Consequently, there is less need for an ESS in the DN, which reduces investment costs. 2) BS-clustering collaboration can regulate voltage fluctuations, reduce DN losses, and increase DN voltage levels. Compared to the traditional strategy, the proposed method reduces the network loss cost and voltage volatility by 13.67% and 24.57%, respectively. The self-provided BES output of the BS can help the grid cut peaks, fill valleys, and reduce the burden on the primary grid and liaison lines. This creates considerable low-carbon benefits, along with improved economics. In subsequent studies, the energy consumption BS will consider the effects of temperature and humidity. This facilitates a more realistic BS model. Meanwhile, the participation of BS in other ancillary markets, such as distribution network frequency regulation, is also a focus of our future research.
Data availability statement
The original contributions presented in the study are included in the article/supplementary material; further inquiries can be directed to the corresponding author.
Author contributions
ZL: data curation, investigation, methodology, software, and writing–original draft. BJ: conceptualization, data curation, formal analysis, funding acquisition, resources, and writing–original draft. ZS: formal analysis, funding acquisition, resources, and writing–original draft. FY: formal analysis, project administration, validation, and writing–original draft. SZ: formal analysis, project administration, validation, and writing–original draft.
Funding
The author(s) declare that financial support was received for the research, authorship, and/or publication of this article. This study was supported by the Science and Technology Project of the State Grid Corporation of China under Grant No. 52420524000D.
Conflict of interest
Author BJ was employed by Xinjiang Information Industry Co., Ltd.
The remaining authors declare that the research was conducted in the absence of any commercial or financial relationships that could be construed as a potential conflict of interest.
The authors declare that this study received funding from the Science and Technology Project of the State Grid Corporation of China. The funder had the following involvement in the study: the study design, collection and the decision to submit it for publication.
Publisher’s note
All claims expressed in this article are solely those of the authors and do not necessarily represent those of their affiliated organizations, or those of the publisher, the editors, and the reviewers. Any product that may be evaluated in this article, or claim that may be made by its manufacturer, is not guaranteed or endorsed by the publisher.
References
Cheema, K. M. (2020). A comprehensive review of virtual synchronous generator. Int. J. Electr. power and energy Syst. 120, 106006. doi:10.1016/j.ijepes.2020.106006
Chen, J. L. G. (2020). An optimal demand response strategy for communication base stations with installing a nanobackup energy storage system. Nanosci. Nanotechnol. Lett. 12 (6).
Dong, W., Xu, Z. H., Liu, X. H., Wang, L. S. B., and Xiao, S. P. (2020). Irregular subarray tiling via heuristic iterative convex relaxation programming. IEEE Trans. Antennas Propag. (4), 68.
Fan, Y., Wang, B., Wei, J., Tan, M., and Ran, H. (2022). A hierarchical distributed operational framework for renewables-assisted 5G base station clusters and smart grid interaction. Front. Energy Res. 10, 943189. doi:10.3389/fenrg.2022.943189
Fang, X., Li, F., Wei, Y., and Cui, H. (2016). Strategic scheduling of energy storage for load serving entities in locational marginal pricing market. Iet Generation Transm. and Distribution 10 (5), 1258–1267. doi:10.1049/iet-gtd.2015.0144
Frenger, P., and Tano, R. (2019) “More capacity and less power: how 5G NR can reduce network energy consumption,” in 2019 IEEE 89th vehicular Technology conference (VTC2019-Spring). IEEE.
Guo, L., Ding, Y., Bao, M., and Zeng, D. (2021). A Bi-Level model for the bidding strategy of an inter-regional electricity trading aggregator considering reliability requirements and transmission losses. IEEE Access 9, 13476–13487. doi:10.1109/access.2021.3051654
Guo, W., Mao, Y., Chen, Y., and Zhang, X. (2022). Multi-objective optimization model of micro-grid access to 5G base station under the background of China’s carbon peak shaving and carbon neutrality targets. Front. Energy Res. 10, 1032993. doi:10.3389/fenrg.2022.1032993
Habibi, M. A., Nasimi, M., Han, B., and Schotten, H. D. (2019). A comprehensive survey of RAN architectures toward 5G mobile communication system. Ieee Access 7, 70371–70421. doi:10.1109/access.2019.2919657
Han, J., Liu, N., Huang, Y., and Zhou, Z. (2021). Collaborative optimization of distribution network and 5G mobile network with renewable energy sources in smart grid. Int. J. Electr. Power and Energy Syst. 130, 107027. doi:10.1016/j.ijepes.2021.107027
Han, T., and Ansari, N. (2013). On optimizing green energy utilization for cellular networks with hybrid energy supplies. IEEE Trans. Wirel. Commun. 12 (8), 3872–3882. doi:10.1109/tcomm.2013.051313.121249
Han, T., and Ansari, N. (2014). Smart grid enabled mobile networks: jointly optimizing base station operation and power distribution. ICC 2014 - 2014 IEEE Int. Conf. Commun. IEEE.
Hassan, H. A. H., Renga, D., Meo, M., and Nuaymi, L. (2019). A novel energy model for renewable energy-enabled cellular networks providing ancillary services to the smart grid. IEEE Trans. Green Commun. and Netw., 1.
Johann, L., Teng, J. L., and Sumei, S. (2018). Cost-aware renewable energy management with application in cellular networks. IEEE Trans. Green Commun. and Netw. 2, 316–326. doi:10.1109/tgcn.2017.2778051
Liu, C., and Natarajan, B. (2015). Power management in heterogeneous networks with energy harvesting base stations. Phys. Commun. 16 (sep), 14–24. doi:10.1016/j.phycom.2015.03.001
Ma, X., Duan, Y., Meng, X., Zhu, Q., Wang, Z., and Zhu, S. (2021). Optimal configuration for photovoltaic storage system capacity in 5G base station microgrids. Glob. Energy Interconnect. 4 (5), 465–475. doi:10.1016/j.gloei.2021.11.004
Ma, X., Zhu, Q., Duan, Y., Meng, X., and Wang, Z. (2022). Optimal configuration of 5g base station backup energy storage considering sleep mechanism. Glob. Energy Interconnect., 005.
Renga, D., Hassan, H. A. H., Meo, M., and Nuaymi, L. (2018). Energy management and base station on/off switching in green mobile networks for offering ancillary services. IEEE Trans. Green Commun. Netw. 2 (3), 868–880. doi:10.1109/tgcn.2018.2821097
Sun, M., Zhao, X., Tan, H., and Li, X. (2022). Coordinated operation of the integrated electricity-water distribution system and water-cooled 5G base stations. Energy 238, 122034. doi:10.1016/j.energy.2021.122034
Xiong, L., Liu, X., Zhang, D., and Liu, Y. (2020). Rapid power compensation-based frequency response strategy for low-inertia power systems. IEEE J. Emerg. Sel. Top. Power Electron. 9 (4), 4500–4513. doi:10.1109/jestpe.2020.3032063
Xiong, L., Liu, X., Zhao, C., and Zhuo, F. (2019). A fast and robust real-time detection algorithm of decaying DC transient and harmonic components in three-phase systems. IEEE Trans. Power Electron. 35 (4), 3332–3336. doi:10.1109/tpel.2019.2940891
Yang, S., Wang, C., Sun, S., Cheng, Y., and Yu, P. (2024). Cluster partition-based two-layer expansion planning of grid–resource–storage for distribution networks. Front. Energy Res. 12, 1390073. doi:10.3389/fenrg.2024.1390073
Keywords: double-layer optimization, 5G base station, Karush–Kuhn–Tucker condition, economics, power distribution network
Citation: Lv Z, Jia B, Song Z, Yang F and Zhou S (2024) A double-layer optimization strategy for distribution networks considering 5G base station clusters. Front. Energy Res. 12:1454382. doi: 10.3389/fenrg.2024.1454382
Received: 25 June 2024; Accepted: 09 August 2024;
Published: 28 August 2024.
Edited by:
Wei Qiu, Hunan University, ChinaReviewed by:
Zheng Gong, China University of Mining and Technology, ChinaFan Xiao, Hunan University, China
Copyright © 2024 Lv, Jia, Song, Yang and Zhou. This is an open-access article distributed under the terms of the Creative Commons Attribution License (CC BY). The use, distribution or reproduction in other forums is permitted, provided the original author(s) and the copyright owner(s) are credited and that the original publication in this journal is cited, in accordance with accepted academic practice. No use, distribution or reproduction is permitted which does not comply with these terms.
*Correspondence: Bingjian Jia, dGFucmVueXVAc3R1Lmh1dC5lZHUuY24=