 Manuel Corrales-Gonzalez
 George Lavidas
 Andrea Lira-Loarca
 Giovanni Besio
- 1Department of Civil, Chemical and Environmental Engineering, University of Genoa, Genoa, Italy
- 2Department of Hydraulic Engineering, Faculty Civil Engineering and Geosciences, Delft University of Technology, Delft, Netherlands
Nowadays, numerous governments have instituted diverse regulatory frameworks aimed at fostering the assimilation of sustainable energy sources characterized by reduced environmental footprints. Solar, wind, geothermal, and ocean energies were subject to extensive scrutiny, owing to their ecological merits. However, these sources exhibit pronounced temporal fluctuations. Notably, ocean dynamics offer vast energy reservoirs, with oceanic waves containing significant amounts of energy. In the Central American Pacific context, the exploration of wave energy resources is currently underway. Accurate numerical wave models are required for applied studies such as those focused on the estimation of exploitable wave power; and even more so in Central American region of the Pacific Ocean where existing numerical models simulations have so far relied on coarse resolution and limited validation field data. This work presents a high-resolution unstructured wave hindcast over the Central American Pacific region, implemented using the third-generation spectral wave model WAVEWATCH III over the period between 1979 and 2021. The results of the significant wave height have been bias-corrected on the basis of satellite information spanning 2005 to 2015, and further validation was performed using wave buoy and acoustic Doppler current profiler (ADCP) records located in the nearshore region of the Central America Pacific coast. After correction and validation of the wave hindcast, we employed the dataset for the evaluation and assessment of wave energy and its possible exploitation using different wave energy converters (WECs). This evaluation addressed the need to diverse the energy portfolio within the exclusive economic zones of Guatemala, El Salvador, Honduras, Nicaragua, Costa Rica, Panama, Colombia, and Ecuador in a sustainable manner. Moreover, a comprehensive analysis was carried out on the advantages of harnessing wave energy, juxtaposed with the imperative of regulatory frameworks and the current dearth of economic and environmental guidelines requisite for development within the region.
1 Introduction
In recent years, oceans have captured global attention due to changes and threats affecting marine life and coastal socio-economic activities. The need for understanding these changes and the development of resilient measures have become the starting point for developing predictive models with increasingly novel techniques. In addition, the recent world geopolitical situation in terms of energy supply to societies (Boungou and Yatié, 2022; Wan et al., 2023) has had important impacts on the energy market, which has given priority to the exploration of diverse energy sources to enhance energy security and maximize the usage of the energy mix with special attention to renewable resources (Decastro et al., 2024; UN, 2022).
One of the most untapped sources of renewable energies, despite their high and renewable energetic content, are those related to the ocean, i.e., marine energies. There are different ways to take advantage of marine renewable energy (MRE): wave energy, tidal energy, salinity gradients, and ocean thermal conversion (Kumar et al., 2022). The exploitation of MRE depends on the geographical location and metocean conditions, as well as the regulations chiefly on marine spatial planning and environment policies (Freeman et al., 2024; Salvador and Ribeiro, 2023; Soukissian et al., 2023; Ferrari et al., 2020). Moreover, wave energy technologies, as the rest of MRE, are mostly at the stages of its development, seeking to refine such technologies, understand and quantify the uncertainties associated with implementing energy conversion devices, and project economically feasible maintenance and operational conditions for wave energy converters (WECs) (Vieira et al., 2024).
Waves contain a substantial amount of energy, conservatively 3–5 times higher than wind energy (Waters, 2008); specifically, the wind gravity wave component, characterized by periods between 5 and 20 s, presents the highest energetic content (Holthuijsen, 2010) with respect to other oscillatory phenomena present in the ocean. A significant advantage of the exploitation of wave energy, similar to other marine energies from currents, saline gradients, or wind and solar radiation, is that wave energy can be estimated using wave hindcast (for historical and hence statistical analysis) and forecast models (for operational conditions at the short term and long-period changes for climate projections, for example) (Lehmann et al., 2017; Tawn and Browell, 2022).
Additionally, wave energy assessment has been developed traditionally on the basis of numerical models at different scales; some researchers employed global simulations, which provide comprehensive analysis across the whole globe but with a relatively coarse resolution (Gunn and Stock-Williams, 2012; Cornett, 2008). On the other hand, in order to develop site-specific analysis, simulations should be carried out at a high resolution, either in space or time. These types of analyses are usually developed for regional areas, such as the Mediterranean Sea (Lavidas and Venugopal, 2017a; b; Dialyna and Tsoutsos, 2021; Amarouche et al., 2020; Foteinis, 2022; Rasool et al., 2022), the Baltic Sea (Soomere and Eelsalu, 2014), the Indian Sea (Kumar and Anoop, 2015; Amrutha and Kumar, 2019), the South Pacific Ocean (Liu et al., 2023; Medina et al., 2023), the South China Sea (Kamranzad and Lin, 2020), and the Pacific nearshore regions of the American continent (Gorr-Pozzi et al., 2021; Ventura et al., 2022; Mediavilla and Sepúlveda, 2016; Lucero et al., 2017; Contestabile et al., 2015; Mazzaretto et al., 2020; Rusu and Onea, 2017). Despite previous studies in America evaluating wave power, none of them have evaluated WEC performance in the Central American Pacific region.
Regional wave energy evaluations have been developed using the wave numerical models, which provide wave integral parameters useful for such assessments. Several wave numerical models exist for the Pacific nearshore regions of the American continent. Examples include the early wave databases generated along the Chilean coasts by Fournier et al. (2004) and later by Beyá et al. (2017), as well as the wave database produced a 10-year worldwide wave hindcast (Arinaga and Cheung, 2012), using the WAVEWATCH III model. In addition, global wave hindcast and forecast data are available, most of which are openly accessible over the Pacific Ocean and specifically in the Central America region (NWS-NOAA, 2021; CMEMS, 2021; Perez et al., 2017). The wave databases generated for these specific regions were validated with few wave records due to the scarcity of measured wave data. The wave hindcast databases developed for the Pacific region of the American continent are listed in Table 1.
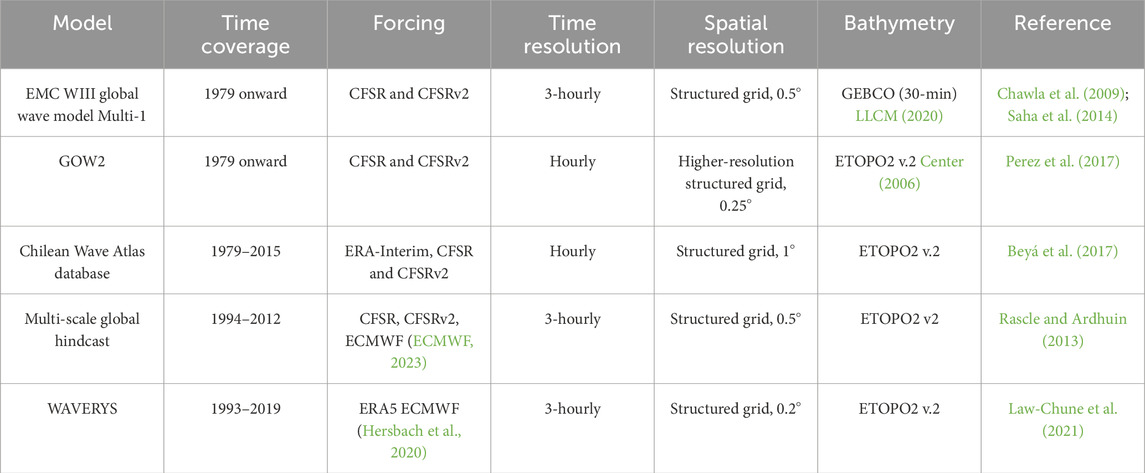
Table 1. Numerical wave models generated onto the Pacific coast of Central America.
Models such as those used by NWS-NOAA (2021) and CMEMS (2021) use data assimilation, which improves accuracy by integrating satellite data, compensating for the lack of in situ measurements and increasing the reliability of the models in remote areas, mainly in regions with poor observational coverage.
The analysis of wave energy assessments present in the literature suggests that lower potential wave energy is present in lower latitude regions (Rusu and Onea, 2017), wherein the wave energy extracted can be feasible if WECs are designed or adapted to such wave climates (Bozzi et al., 2018). In addition, the distribution of wave climates around the world has shown a high percentage of swells approaching the Pacific coasts of Central America, according to Mazzaretto and Menendez (2024). This is due to the predominant wind action in the high-latitude regions, and the wave propagates toward the lower latitudes.
Although several investigations have shown that marine regions at high latitudes offer greater wave energy potential averaged over time than the intertropical regions, the energy density cannot be extracted constantly throughout the year due to seasonality, and extreme events pose challenges in terms of survivability and durability of the wave energy conversion devices. These factors make inter tropical regions attractive, where the amount of wave energy potential is not high but is more constant over time and less destructive for the devices (milder extreme conditions) (Martinez and Iglesias, 2020; Portilla-Yandun and Guachamin-Acero, 2023).
The development of marine energy exploitation projects still lacks a detailed and sound analysis of the specific devices. In particular, for wave energy exploitation, there is no well-established technology that could be adopted worldwide because wave climate is significantly different across locations spread worldwide This shortcoming justifies the development of the present research dedicated to exploring and implementing a detailed wave energy assessment through high-resolution numerical models and the analysis of possible wave energy conversion in the Pacific Ocean of Central America compared to other regions of the world. Furthermore, the efficiency of wave energy converters depends on their sizes, location, and the PTO design, coupled with the metocean conditions of the specific sites (Aderinto and Li, 2019; Bozzi et al., 2014). In order to couple the information about the wave resource and different wave energy converters, several indices have been proposed. The development of different indices has been justified mainly because the different indicators have been developed taking into account different aspects related to the resource, the device, and a combination of the former two and economic aspects (Martinez and Iglesias, 2020; Lavidas, 2020). Research and development methodologies such as those described by Cruz et al. (2010), along with numerical models (Raghavan et al., 2024), are employed for the design of wave energy exploitation technologies, considering device dynamics and its interaction with the waves. Other approaches allow instead the evaluation of scaling through the Froude similarity law, adapting pre-existing converters to given wave conditions based on power matrices, for example, as performed by Lin et al. (2024) or Martić et al. (2024).
The present study aims to develop a detailed and reliable analysis of possible wave energy exploitation along the Pacific coast of Central America. The objective is intended to be achieved by the development and implementation of a new unstructured wave hindcast over the Pacific Ocean with a higher spatial resolution over the Pacific coast of Central America, reaching 1 km resolution in space along the shorelines and a time resolution of 1 h over the entire simulation period. The hindcast is then adjusted and optimized on the basis of satellite records over the Central American region. Hence, validation is performed using nearshore observation located along the Pacific coast of Central America. Wave climate obtained by this modeling approach is then employed for a pioneering evaluation of nine WECs located in 16 specific sites located near the coast of different countries in the target region. Analyses of the performances of the devices tailored for the specific wave climate of the different locations and cascade effects on possible environmental positive impacts (due to the substitution of energy sources, from non-renewable to renewable) are then presented.
The remainder of this paper is structured as follows: Section 2 presents the methodology used for the wave hindcast and wave energy assessment. Section 3 presents the main results and discussion, and finally, Section 4 presents the final remarks.
2 Materials and methods
A wave modeling optimization method has been developed for fulfilling the wave data requirements focused over the Central American Pacific Ocean. Simulations performed by a third-generation wave spectral model allow us to estimate the wave integral parameters and, subsequently, perform the model calibration, followed by a model correction procedure; finally, the model validation has been performed employing data from the nearshore region. Thereafter, a wave power potential assessment was performed, followed by the evaluation of nine floating body WECs over the studied region, based on the corrected and validated wave database generated in the previous step. These two stages of the methodology procedure are detailed in Sections 2.1, 2.2, respectively.
2.1 Wave hindcast
The spectral wave model WAVEWATCH III (hereinafter WWIII) version 6.07 (Björkqvist et al., 2020; Tolman et al., 2009) has been employed to implement a wide wave hindcast for the whole Pacific region, making use of an unstructured triangular mesh over the whole Pacific Ocean. The resolution of the mesh increases over the Central America Pacific region delimited by the latitudes −4° and 14° and longitudes between −92.7° and −76.6° (see Figure 1). Numerical modeling was conducted using an implicit numeric scheme, with previous tests evaluating mesh resolution and time steps. The mesh triangulation methodology employed in this study employed the Delaunay enhanced refinement technique presented by Engwirda (2014). The entire Pacific Ocean basin was considered in order to obtain the wave conditions developed in the Central American region boundary and used as initial conditions for the following time steps in the model.
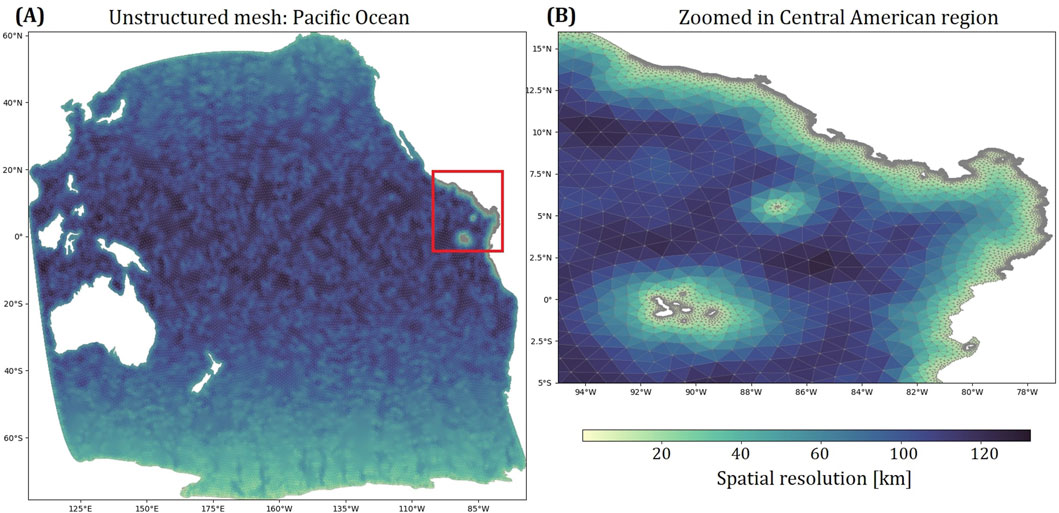
Figure 1. Unstructured mesh over the Pacific Ocean domain. (A) Pacific ocean domain and (B) the focused region (Pacific of Central America) and the mesh spatial resolution.
The development of the computational grid must be a trade-off between the spatial resolution and computational cost as an increasing resolution close to the coastline requires a smaller time step in order to ensure stability (explicit methods) or accuracy (implicit methods). Based on this reasoning, a grid with 44,445 computational nodes was established, as shown in Figure 1, which allows the use of high-performance computers to obtain high-fidelity results within feasible computational times. The final mesh resolution ranges from 120 km in the open ocean progressively reducing to 1 km along the shorelines along the Central American Pacific coast.
The numerical model setup involved different tests, taking into account standard model configuration sets for source terms in WWIII. The parametrization families ST4 (Ardhuin et al., 2010; Rascle and Ardhuin, 2013) and ST6 (Rogers et al., 2012; Zieger et al., 2015) provide different sets of physics–mathematical tuning parameters. Both parametrization families mainly consider the effects of wave generation and dissipation, which are adjusted through parameters acting on the governing wave action equation.
The calibration of the model has been carried out by implementing 13 different parametrizations and evaluating both ST4 and ST6 parametrization families. The model parameters were tuned as follows: first, we started with the default values of the parameters proposed in the WWIII manual (WW3DG, 2019); subsequently, we adjusted the values of the parameters related mainly to wind input forcing, atmosphere–sea surface interaction, nearshore bottom friction, and wave energy dissipation through different mechanisms. The aspects mentioned above present parameters or coefficients that have a noticeable influence on the transformation of wave energy density.
These parametrization families allow the WWIII users to calibrate the modeled data to any recorded wave data. Moreover, wind input field databases from ERA-5 (Hersbach et al., 2020), CFSR (Saha et al., 2010), and CFSRv2 (Saha et al., 2014) were employed as forcing conditions. The Unresolved Obstacles Source Term (UOST) WWIII source term package (Mentaschi et al., 2019; 2018; 2015) has been employed to take into account subgrid obstacles, such as small islands. Additional details on the model setup are provided in Table 2.
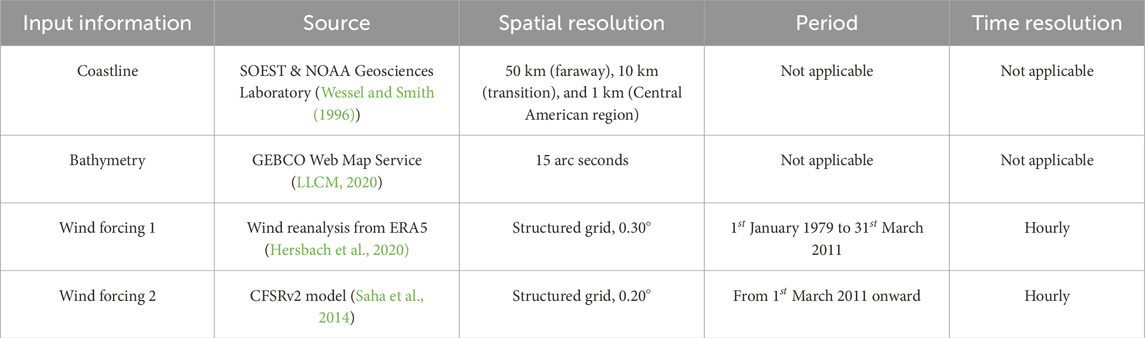
Table 2. Input data considered in the proposed numerical wave model.
The WWIII model uses four different time steps to resolve the global, spatial, intra-spectral, and minimum source term time steps, respectively. The evaluated time steps, employed parametrizations, and the wave input data are presented in Tables 3, 4, in which 13 different model parametrizations were evaluated. In particular, ERA5 wind data were used as wind forcing of the WWIII model in 12 of the 13 numerical simulation tests, while the remaining test used the linked databases CFSR and CFSRv2.
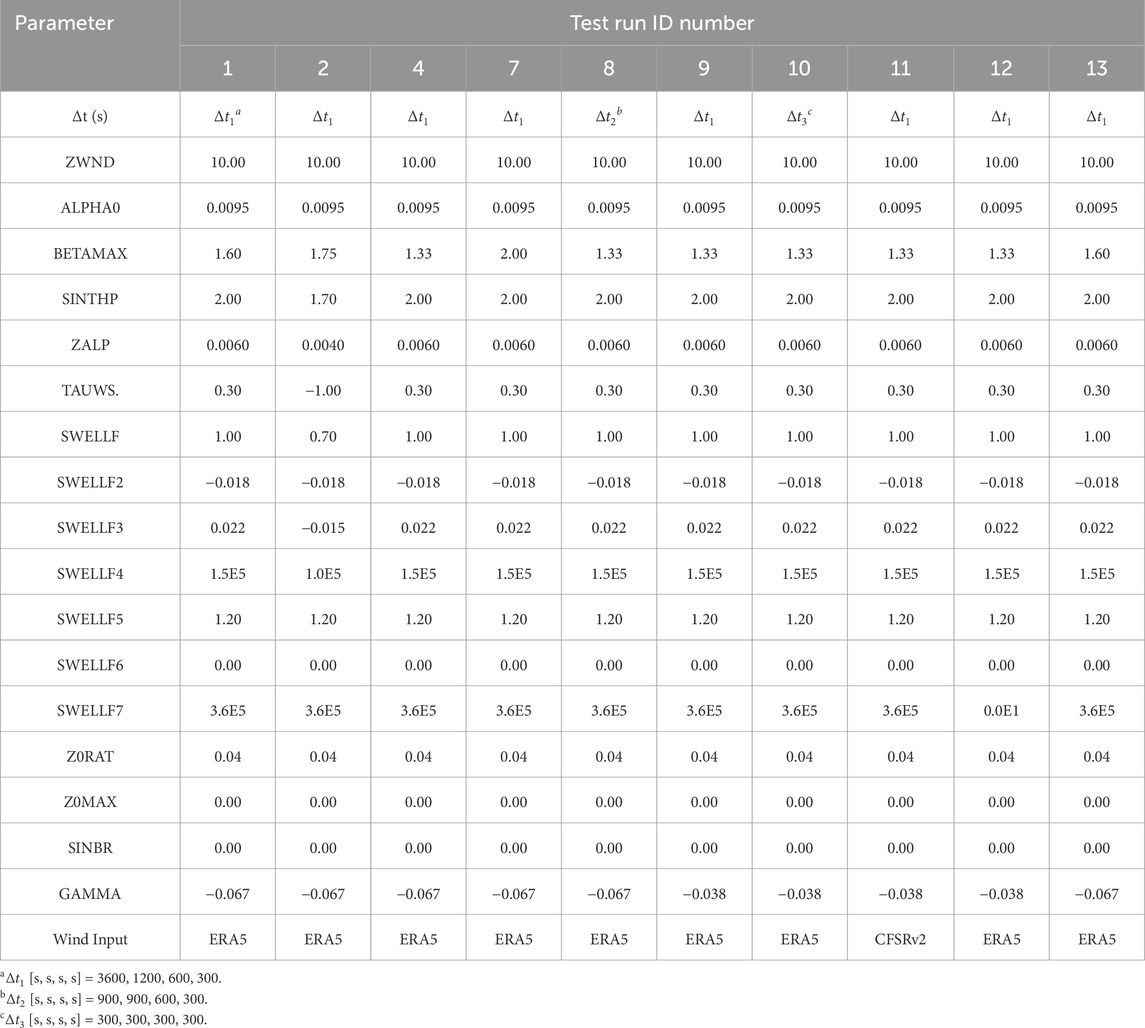
Table 3. Configuration of the evaluated ST4 source package. The setup parameter names are in accordance with the nomenclature in the WWIII manual (WW3DG, 2019).
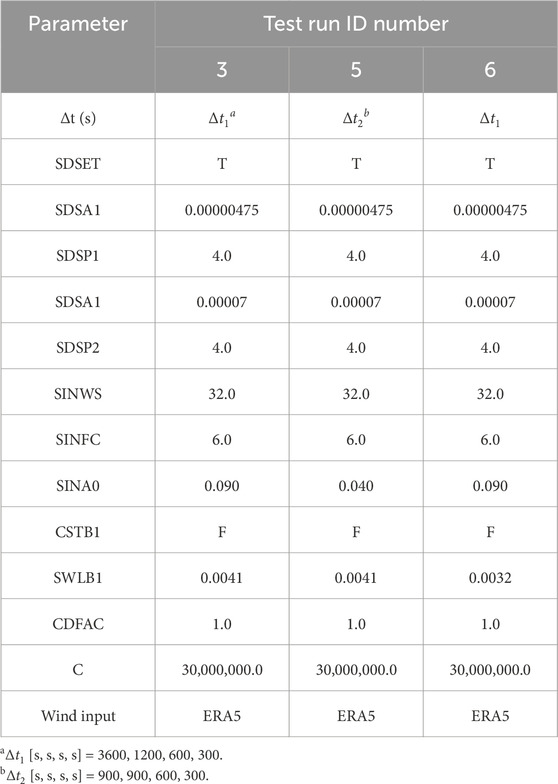
Table 4. Configuration of the evaluated ST6 source package. The setup parameter names are in accordance with the nomenclature in the WWIII manual (WW3DG, 2019).
The results obtained using the different model setups for the zeroth-order moment wave height (or
where the subscript
Then, several commonly used statistics of fit, such as the Pearson correlation coefficient
where
where
The three statistics mentioned earlier are linked through the so-called Taylor diagram (Taylor, 2001). A water depth criterion has also been evaluated as part of model optimization, which is based on the ratio between the water depth
where
The last stage of the model optimization involved verifying the validity of the wave numerical modeling. Useful wave measurement campaigns from different time windows were gathered from in situ wave measurements in the marine regions of El Salvador, Costa Rica, Colombia, and Ecuador, which were compared with the modeled and satellite-based corrected
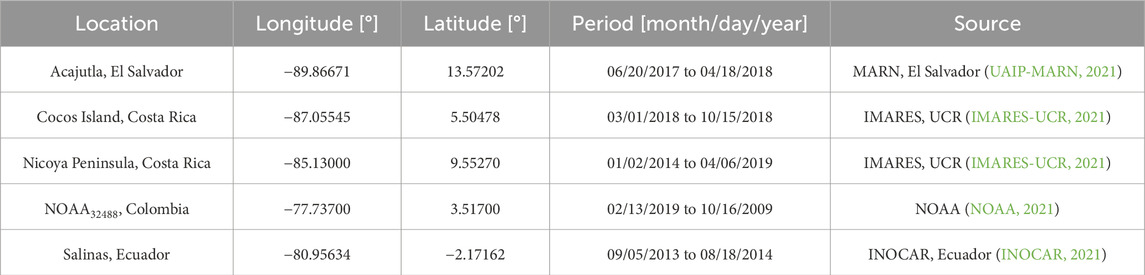
Table 5. Wave measurements employed in the model validation.
Most of the wave records were logged using the acoustic Doppler current profiler (ADCP), as in El Salvador and Costa Rica, and through wave buoys, as in Colombia and Ecuador (see Table 5). The statistics, including
Finally, the parametrization that generated the best adjustment based on the Taylor diagrams described above is then selected and is verified by the model validation. Furthermore, such chosen parametrization was employed to produce the hindcast database employed for the subsequent wave energy resource and WEC assessments.
2.2 Wave energy conversion
Hourly wave data from a period between
where
where
Regarding the evaluation of WECs, this study considered the evaluation of one WEC unit per assessed type and not a WEC array. The total energy produced by a WEC,
where
Different indexes expressing the performances of the devices have been employed in order to implement a potential exploitation analysis taking into account several aspects. The capacity factor
The assessment of the performance of a WEC using
where
The environmental impact of decarbonization
where EF corresponds to the emission factor of 532 g
2.3 Scaling of wave energy converters
The energy extraction capacities of the different WECs are modified by the variation in the WEC dimensions. The development of an analysis of possible exploitation depending on the size of the conversion device implies some assumption in the ‘scaling’ process. Among these assumptions, one of the most important is the use of power matrices for assessing possible WEC energy production. Such WEC power matrices have been resized based on the Froude similarity law. This consideration ensures that the flow regime is indeed turbulent and that the potential energy extracted by the converter being scaled falls within an acceptable range of accuracy (Lin et al., 2024). Additionally, Falcão and Henriques (2014) derived the scaling rules (based on Froude similarity) through dimensional analysis. Sheng et al. (2014) conducted a similar study and concluded that this type of scaling is appropriate but the validity for high Reynolds numbers, an assumption that is taken as true in this evaluation, needs careful consideration. A WEC design must consider not only the production of the power matrix but also the tailored design to be made for specific wave conditions and power production curves, given the respective converter type and mechanical damping characteristics (Cruz et al., 2010). In agreement with previous studies as the one presented by Schmitt and Elsäßer (2017), WECs can scale their geometry but taking into account that power take-off (PTO) scaling is based on device forces and velocities (as opposed to device characteristic length and current velocity for Froude similarity), indicating that the two subsystems do not scale according to the same similarity law.
Adapting the sizes of the WECs allows for more efficient exploitation of the wave climate at a location that could be completely different from the wave climate, for which the specific device has been developed. From a theoretical point of view, this approach requires to adopt a so-called ‘similarity’. In the case of sea waves, we employed the
2.4 Sites for wave energy exploitation
The sites for the potential wave energy exploitation analysis were selected based on several aspects, such as their proximity to coastal cities in different countries along the region, the water depth, and the location of the nodes in the mesh of the wave model. The existence of the limit of the continental shelf in the Pacific seaboard has been taken into account in order to limit the costs for installation; the limit has been defined as where the seabed sinks from shallower depths of approximately 300 m to deeper depths of the order of thousands of meters (Lemenkova, 2019). Target locations are shown in Figure 2.
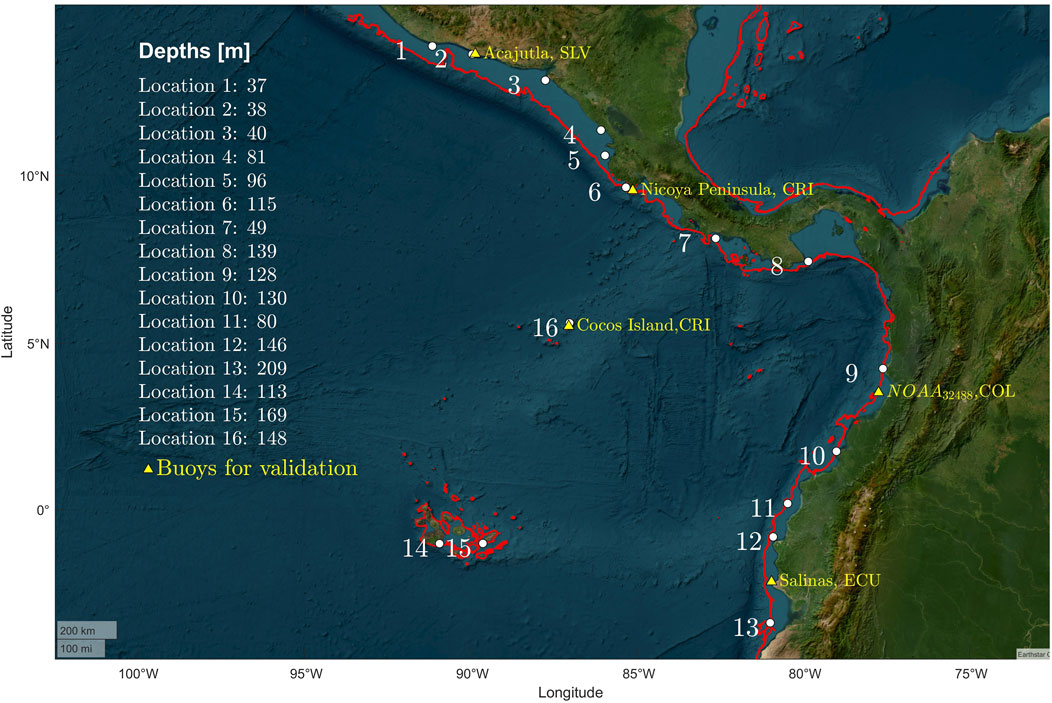
Figure 2. Wave energy converter assessment studied sites and locations of the employed buoys in the model validation. Red lines correspond to the 300-m-depth isolines.
The selected locations for evaluating the wave power exploitation are sited in nearshore regions, and considering that the wave hindcast used was built for a wide domain, the chosen model is well-suited for both applications: WWIII strikes a balance between large-scale oceanic and nearshore wave modeling due to its spectral resolution and capabilities over unstructured grids, allowing for detailed simulations in complex coastal regions. Likewise, WWIII integrates nearshore processes such as refraction, diffraction, and bottom friction with upgraded data processing and handling computational packages.
3 Results and discussion
The present section presents the results obtained during the development of the wave hindcast and discusses the wave exploitation analysis.
3.1 Wave hindcast
The implementation of the hindcast dataset has included the realization of model calibration and tuning at first glance, employing different settings for the evaluation of the so-called ‘source terms’ in WWIII; in the second step, the best-performing setting of the model has been compared against the observation in the Pacific coastal zone of Central America using ADCP data for the wave height and wave period. The comparison has been implemented on the bias-adjusted dataset, as illustrated in Section 2.1.
3.1.1 Hindcast calibration
Regarding model test performance, it has been noted that the most promising setting corresponds to the use of the ST4 source terms (setting run test number 10 reported in Table 3). As mentioned in Section 2, the variation in the parameters in the source term packages sought to adjust the coefficients involved in the wave energy transformation processes.
The adjustment between the significant wave height logged by satellite missions and the modeled
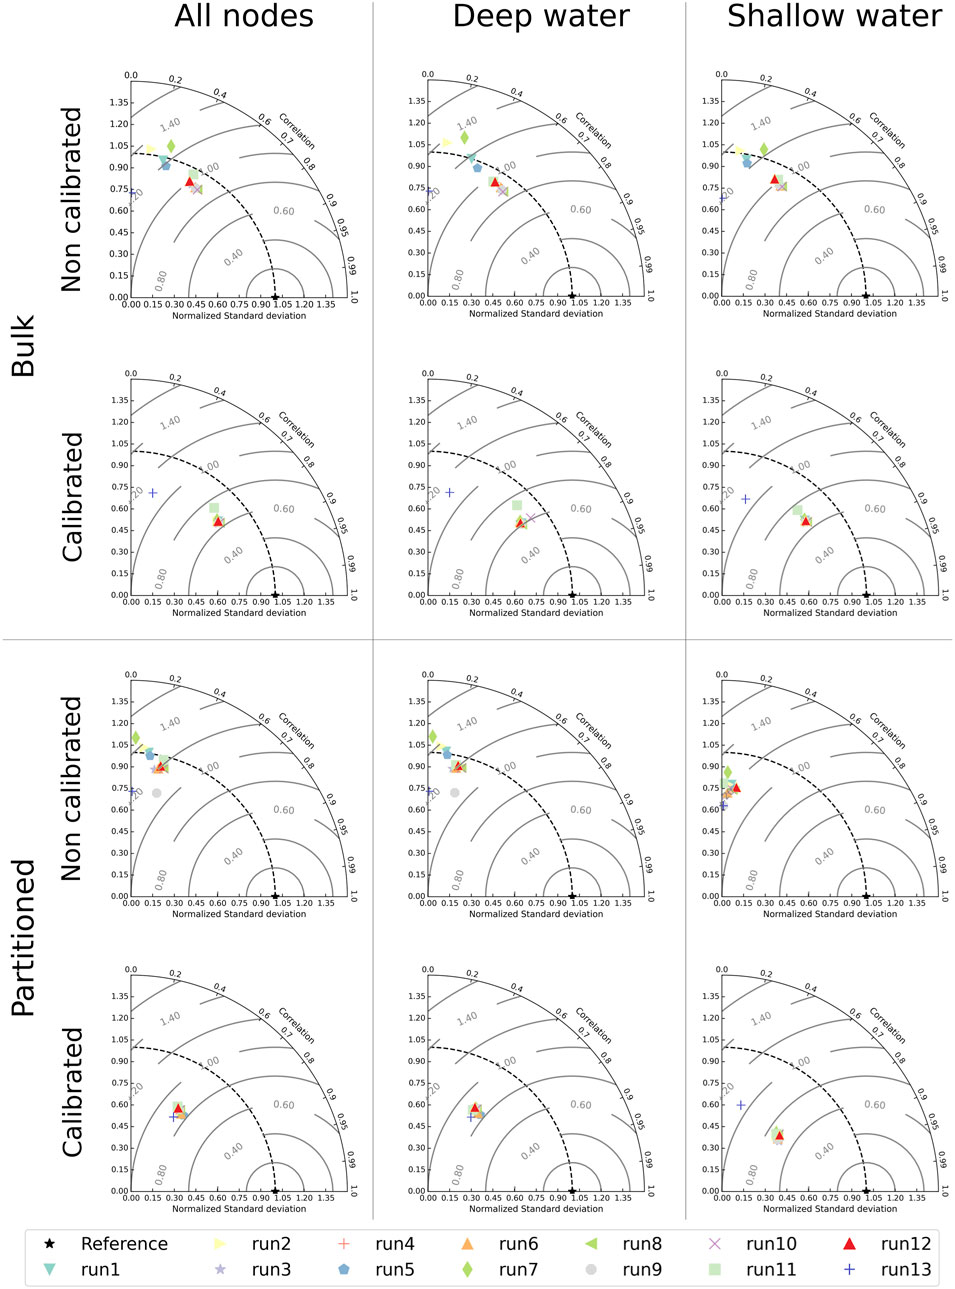
Figure 3. Performances of different model setups without calibration and with calibration (bulk and partitioned) for different sets of grid nodes depending on the water depth.
Specifically, it was observed that the test run number 10 matches better with the satellite records for both bulk and partition-based corrections. In the case of the bulk-based correction,
According to the results presented in rows 2 and 4 of the subplots in Figure 3, it was observed that the bulk correction yielded better fits than the spectral partition-based correction for deep water, shallow water, and all nodes collectively. Additionally, a comparative evaluation with respect to the configurations referred to as
In terms of water depths at model nodes’ locations, the configuration defined in the test run number 10 produces more accurate
The turbulent Reynolds numbers present in the ST4 source term package were also evaluated by varying the swell parameter dissipation processes (
This choice is based on the fact that although the test runs 9 and 10 are the best-performing setups, test run 10 presents a more efficient correction based on bulk parameters rather than test run 9, which requires the partitioned correction.
Figure 4 reports a summary of the performances for the chosen set-up of the model (run 10 considering bulk correction) before and after the bulk correction. The values of the error indicators reveal that the model performs better in deep waters than in shallow waters (as already depicted in Figure 3).
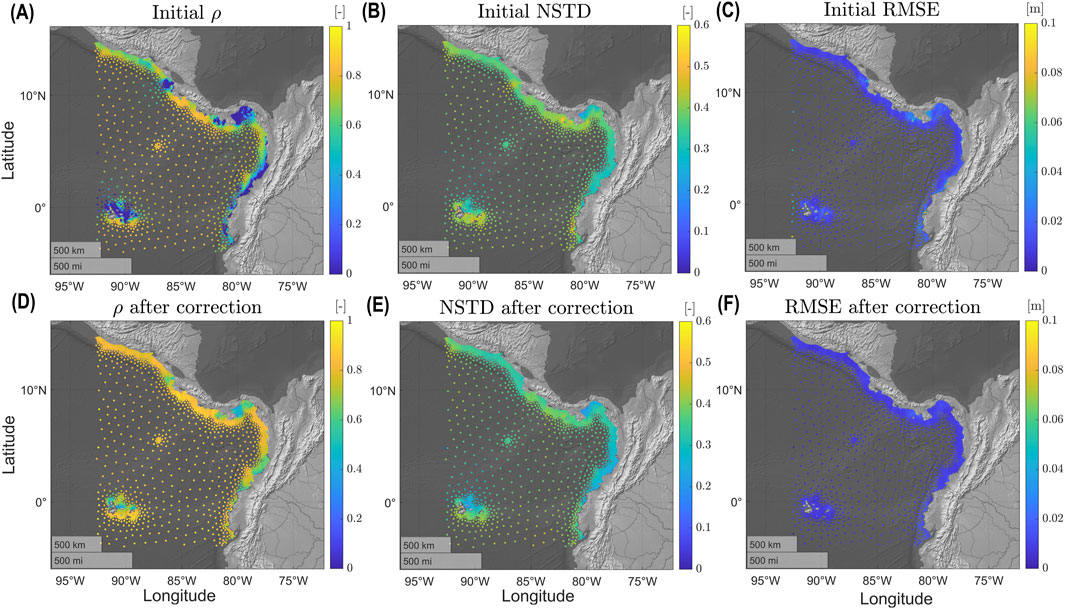
Figure 4. Goodness-of-fit statistics at the computational nodes by employing the optimized model (test run 10, bulk correction): (A)
It was noted that the correlation tends to be lower in deep water rather than in the coastal regions, as shown by the statistics in panels (D), (E), and (F) of Figure 4. Run 10 produced the highest
3.1.2 Model validation
Once the
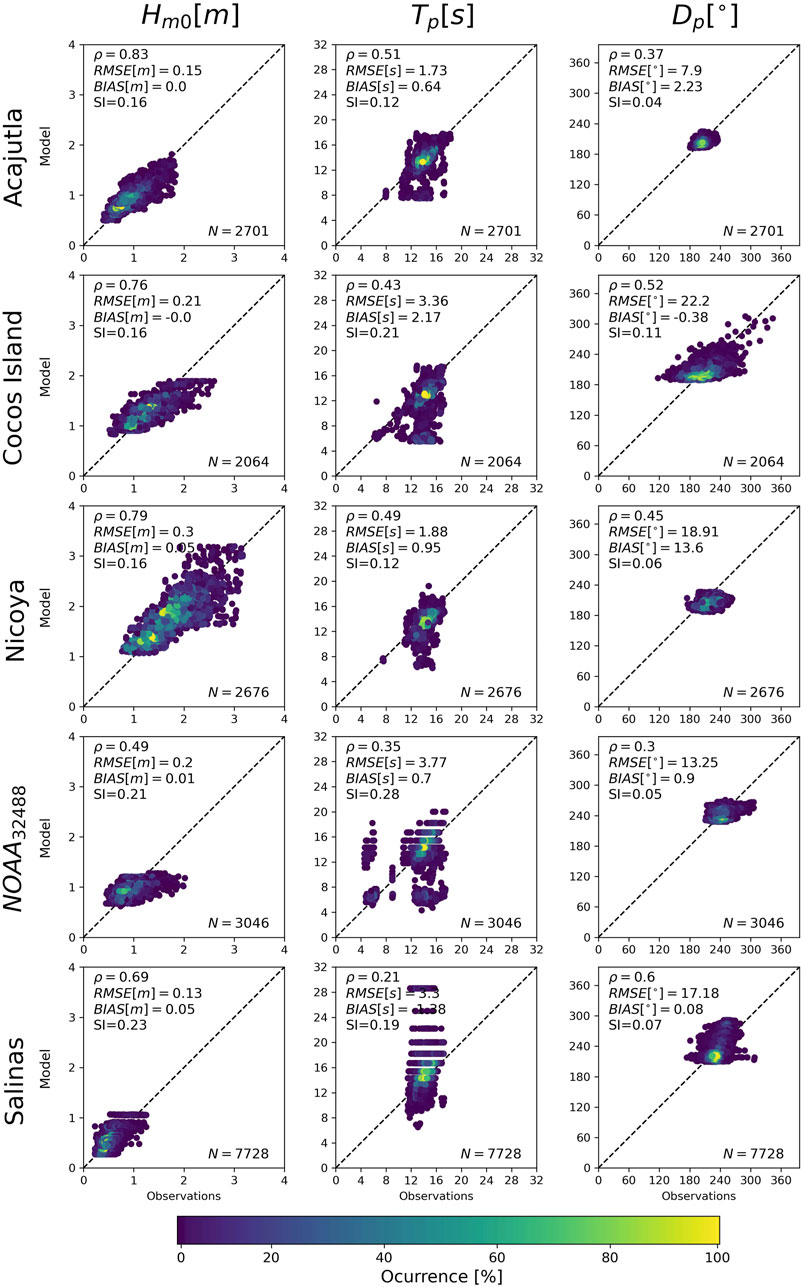
Figure 5. Model vs. observation frequency for
3.2 Wave energy exploitation
3.2.1 Wave energy assessment
A preliminary insight into the availability of the wave energy resource can be derived from the spatial distribution of the wave energy flux across all grid points in the numerical domain for the Central American Pacific zone.
Figure 6 presents the mean annual
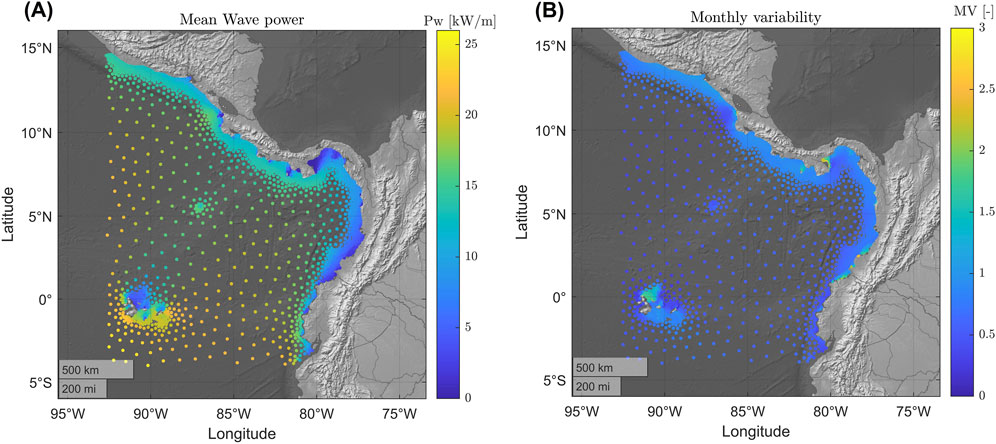
Figure 6. Annual mean wave power (A) and monthly variability
3.2.2 Performance of wave energy converters
A preliminary analysis of WEC performances has been implemented on the basis of different indices commonly employed in the literature for this type of assessment. Figure 7 shows the main findings of the wave energy assessment analysis and the potential exploitation of the energy potential. In particular, the potential energy production
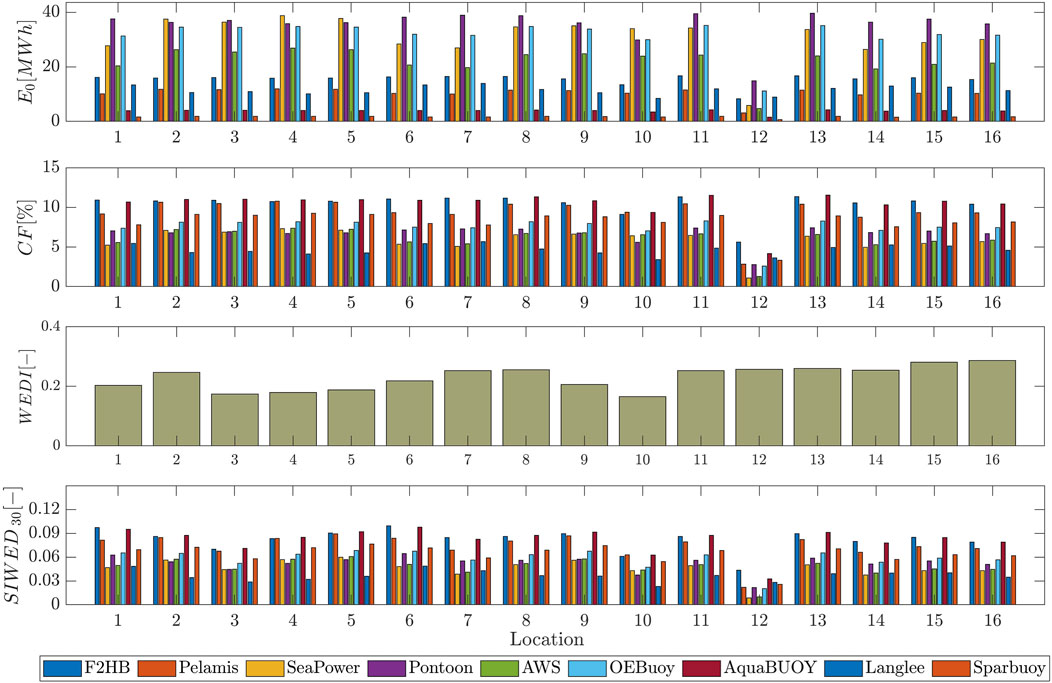
Figure 7. WEC performance indexes:
At first glance, the results clearly show that for all the indexes taken into account, location 12 is not promising at all for a possible wave energy exploitation project because it presents low values of
In order to understand the potentiality of possible wave energy harvesting in the target area, we can refer to socio-economic statistics of the region (WorldBank, 2014), which indicate that the electricity consumption per capita, in the area between Guatemala and Ecuador (i.e., Central America region), ranges between values of approximately 500 and 2,100 kWh. Thus, even if wave energy exploitation cannot completely substitute non-renewable energy source of the coastal area of the region, it could anyway represent a valid ingredient of the energy mix for the countries of the Central America region if properly optimized and designed.
We explored the information provided by
In addition,
Moreover, the inefficiency of the
A further evaluation was conducted seeking a higher performance on the WEC extraction, such as through WEC scaling. Figure 8 presents the amount of increase in the capacity factor with respect to the prototype value for the 9 assessed converters at all 16 locations. It is interesting to note that location 12 is the most affected in terms of
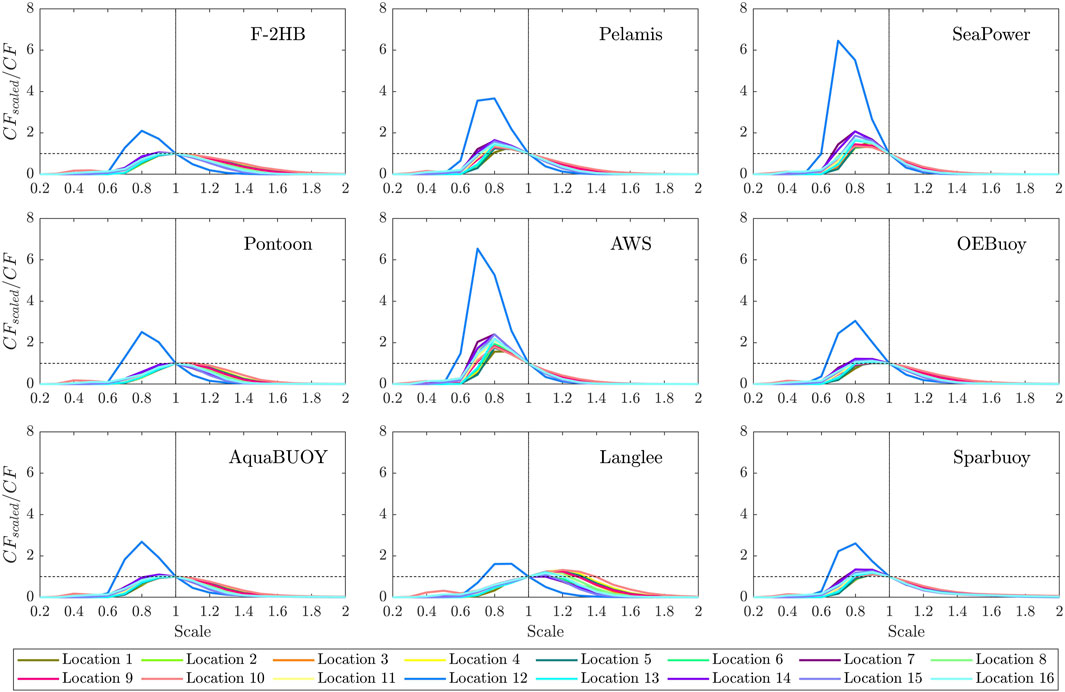
Figure 8.
An interesting finding is related to the Langlee converter: unlike the other WECs, Langlee requires an upsizing of its dimensions to improve the
SeaPower reaches similar values as the previous one, an increase of 35% in the
Finally, the WEC-producing higher
The scaling procedure allowed us to estimate new results for the
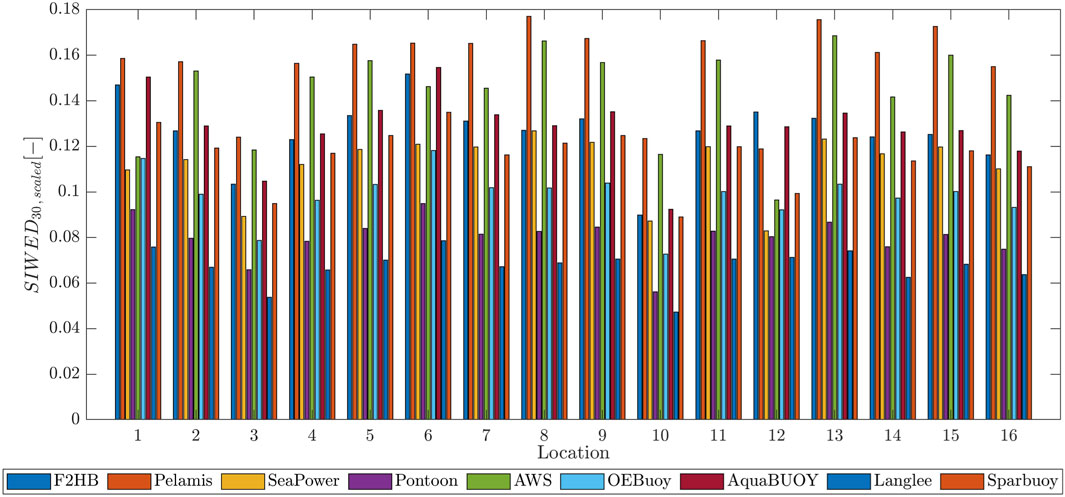
Figure 9.
It was evident that for all converters, the SIWED magnitudes were significantly increased when scaling is performed. The Langlee converter, whose
Finally, we also analyzed the possible impacts on the environmental side, developing a preliminary estimation of the savings in fossil fuel consumption for energy production if wave energy exploitation were to be developed in the Pacific coastal zone of Central America. Based on the average values for all locations shown in Figure 10, approximately up to 3,977.0 tons of
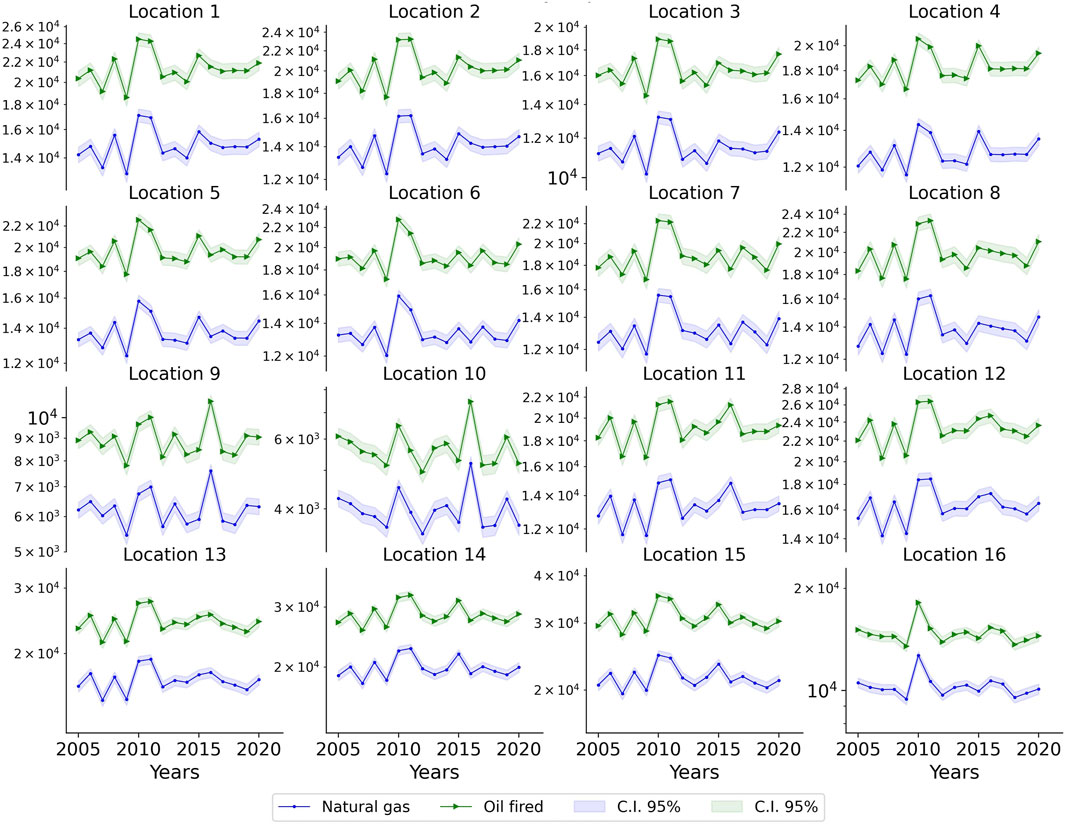
Figure 10. Avoided
Location 9 corresponds to the place where the equivalent avoided
Nevertheless, no legal framework was established regarding the WEC implementation along the studied region, given the lag in the issue of marine energy deployment, thus hindering a proper socio-economic assessment of wave energy converters. Thus, it makes it difficult to define the optimal number of WECs needed in a farm to meet a specific electrical energy demand, whether using prototypes or scaled up versions. Nowadays, there are policies such as guidelines dictated by the International Organization for Standardization (ISO) guidelines for the life cycle assessment of converters (Zhai et al., 2021) that can be adopted and adapted to this region.
Furthermore, the marine ecological agreement between countries in this region could be taken as a starting point for the discussion and delimitation of marine energy exploitation areas. Although in recent years, first investigations on marine energy conversion were encouraged through conferences and incentives for countries in this part of the world (Shadman et al., 2023), there is still a long way to go. Further exploration on the subject will definitely contribute to achieving sustainable development goals and advancing the use of clean energy in the coming years.
4 Conclusion
The first part of this study describes the generation of a new wave hindcast, its optimization, and its validation over the Central American Pacific region with high spatial and time resolution from 1980 to 2021. Then, several tests of the WWIII model configuration have been assessed, including the evaluation of two source terms packages. It is concluded that the ST4 terms package (Ardhuin et al., 2010; Rascle and Ardhuin, 2013) provides the best model performance compared to satellite data for
In addition, bias adjustment for the wave significant height has been implemented using a two-step
The validated hindcast database can be used for various ocean and coastal applications such as the design of structures and/or for climatic and wave analysis due to its high resolution in space and time (hourly resolution for the entire period). The hindcast comprises integral quantities (
The results of the wave energy assessment suggested that the Pacific region of Central America presents a medium wave energy potential with respect to global wave energy potential. However, the wave energy exploitation could be promising due to the low variable wave conditions throughout the year, as shown by the monthly variability analysis. In addition, resizing and adapting the energy converters to the average wave conditions in such a region can lead to an increase in the performances of the exploitation through significant increases of the target indexes employed in the study (
In terms of WEC performance assessment, the feasibility of the
In conclusion, the best converter, in terms of WEC efficiency over time, for all locations corresponds to Pelamis, based on the
It was demonstrated that the abandoning non-renewable energies produced from natural gas and oil (fossil fuels) contributes to the achievement of the goal 7 of the 2030 Agenda, which focuses on universal access to affordable, reliable, and modern sustainable energy for all.
The present study achieves the two fundamental research objectives: first, the development of optimized wave hindcasting data over the Pacific Ocean with high space and time resolution in the Central American zone and, second, the evaluation of potential wave energy exploitation using technical indexes, representing a pioneering evaluation throughout the assessed region.
Data availability statement
The raw data supporting the conclusions of this article will be made available by the authors, without undue reservation.
Author contributions
MC-G: data curation, investigation, methodology, project administration, visualization, writing–original draft, writing–review and editing. GL: conceptualization, formal analysis, methodology, writing–original draft. AL-L: conceptualization, supervision, writing–original draft. GB: conceptualization, funding acquisition, supervision, writing–original draft, writing–review and editing.
Funding
The author(s) declare that no financial support was received for the research, authorship, and/or publication of this article.
Acknowledgments
MC-G would like to express gratitude to the Ocean Energy Systems and their research scholarships, OES-BECS, and the International Network on Offshore Renewable Energy (INORE) for partially supporting this study through an award in 2022. CINECA is acknowledged for providing computational resources under the ISCRA-C projects: WPAC-1, WPAC-2 and WPAC-3. The authors also acknowledge the Oceanographic Institute of the Navy INOCAR of Ecuador, the Marine, River, and Estuarine Engineering Unit IMARES of the University of Costa Rica and the Ministry of Environment and Natural Resources MARN of El Salvador for providing the wave data required for the validation of the wave model.
Conflict of interest
The authors declare that the research was conducted in the absence of any commercial or financial relationships that could be construed as a potential conflict of interest.
Publisher’s note
All claims expressed in this article are solely those of the authors and do not necessarily represent those of their affiliated organizations, or those of the publisher, the editors, and the reviewers. Any product that may be evaluated in this article, or claim that may be made by its manufacturer, is not guaranteed or endorsed by the publisher.
References
Aderinto, T., and Li, H. (2019). Review on power performance and efficiency of wave energy converters. Energies 12, 4329. doi:10.3390/en12224329
Albuquerque, J., Antolínez, J. A., Rueda, A., Méndez, F. J., and Coco, G. (2018). Directional correction of modeled sea and swell wave heights using satellite altimeter data. Ocean. Model. 131, 103–114. doi:10.1016/j.ocemod.2018.09.001
Amarouche, K., Akpınar, A., Bachari, N. E. I., and Houma, F. (2020). Wave energy resource assessment along the algerian coast based on 39-year wave hindcast. Renew. Energy 153, 840–860. doi:10.1016/j.renene.2020.02.040
Amrutha, M., and Kumar, V. S. (2019). Changes in wave energy in the shelf seas of India during the last 40 years based on era5 reanalysis data. Energies 13, 115. doi:10.3390/en13010115
Ardhuin, F., Rogers, E., Babanin, A. V., Filipot, J.-F., Magne, R., Roland, A., et al. (2010). Semiempirical dissipation source functions for ocean waves. part i: definition, calibration, and validation. J. Phys. Oceanogr. 40, 1917–1941. doi:10.1175/2010jpo4324.1
Arinaga, R. A., and Cheung, K. F. (2012). Atlas of global wave energy from 10 years of reanalysis and hindcast data. Renew. Energy 39, 49–64. doi:10.1016/j.renene.2011.06.039
Babarit, A., Hals, J., Muliawan, M. J., Kurniawan, A., Moan, T., and Krokstad, J. (2012). Numerical benchmarking study of a selection of wave energy converters. Renew. energy 41, 44–63. doi:10.1016/j.renene.2011.10.002
Bastos, A. S., Souza, T. R. C. d., Ribeiro, D. S., Melo, M. d. L. N. M., and Martinez, C. B. (2023). Wave energy generation in Brazil: a georeferenced oscillating water column inventory. Energies 16, 3409. doi:10.3390/en16083409
Beyá, J., Álvarez, M., Gallardo, A., Hidalgo, H., and Winckler, P. (2017). Generation and validation of the chilean wave atlas database. Ocean. Model. 116, 16–32. doi:10.1016/j.ocemod.2017.06.004
Björkqvist, J.-V., Vähä-Piikkiö, O., Alari, V., Kuznetsova, A., and Tuomi, L. (2020). Wam, swan and wavewatch iii in the Finnish archipelago–the effect of spectral performance on bulk wave parameters. J. Operational Oceanogr. 13, 55–70. doi:10.1080/1755876X.2019.1633236
Boungou, W., and Yatié, A. (2022). The impact of the Ukraine–russia war on world stock market returns. Econ. Lett. 215, 110516. doi:10.1016/j.econlet.2022.110516
Bozzi, S., Archetti, R., and Passoni, G. (2014). Wave electricity production in Italian offshore: a preliminary investigation. Renew. Energy 62, 407–416. doi:10.1016/j.renene.2013.07.030
Bozzi, S., Besio, G., and Passoni, G. (2018). Wave power technologies for the mediterranean offshore: scaling and performance analysis. Coast. Eng. 136, 130–146. doi:10.1016/j.coastaleng.2018.03.001
Busswell, G., Ash, E., Piolle, J.-F., Poulter, D., Snaith, H., Collard, F., et al. (2010). “Project globwave,” in Proceedings of the third international workshop SeaSAR 2010, held at ESA ESRIN (frascati, Italy), 25–29. January, 2010).
Center, N. (2006). 2-minute gridded global relief data (etopo2) v2. United States: National Geophysical Data Center N.
Chawla, A., Tolman, H. L., Hanson, J. L., Devaliere, E.-M., and Gerald, V. M. (2009). Validation of a multi-grid wavewatch iii modeling system. NOAA/MMAB Contrib., 281.
Contestabile, P., Ferrante, V., and Diego, V. (2015). Wave energy resource along the coast of santa catarina (Brazil). Energies 8-12, 14219–14243. doi:10.3390/en81212423
Cornett, A. M. (2008). “A global wave energy resource assessment,” in ISOPE international Ocean and polar engineering conference (ISOPE) (Ottawa, Canada: ISOPE–I).
Corrales-Gonzalez, M., Lavidas, G., and Besio, G. (2023). Feasibility of wave energy harvesting in the ligurian sea, Italy. Sustainability 15, 9113. doi:10.3390/su15119113
Cruz, J., Sykes, R., Siddorn, P., and Taylor, R. E. (2010). Estimating the loads and energy yield of arrays of wave energy converters under realistic seas. IET Renew. Power Gener. 4, 488–497. doi:10.1049/iet-rpg.2009.0174
Dean, R. G., and Dalrymple, R. A. (1991). Water wave mechanics for engineers and scientists, 2. Singapore: world scientific publishing company.
Decastro, M., Rusu, L., Arguilé-Pérez, B., Ribeiro, A., Costoya, X., Carvalho, D., et al. (2024). Different approaches to analyze the impact of future climate change on the exploitation of wave energy. Renew. Energy 220, 119569. doi:10.1016/j.renene.2023.119569
De Leo, F., Cremonini, G., Corrales-González, M., and Besio, G. (2024). Climate analysis of wave systems for multimodal sea states in the mediterranean sea. Appl. Ocean Res. 142, 103813. doi:10.1016/j.apor.2023.103813
Dialyna, E., and Tsoutsos, T. (2021). Wave energy in the mediterranean sea: resource assessment, deployed wecs and prospects. Energies 14, 4764. doi:10.3390/en14164764
Engwirda, D. (2014). Locally optimal delaunay-refinement and optimisation-based mesh generation. PhD thesis. Sydney, Australia: The University of Sydney.
Falcão, A. F., and Henriques, J. C. (2014). Model-prototype similarity of oscillating-water-column wave energy converters. Int. J. Mar. Energy 6, 18–34. doi:10.1016/j.ijome.2014.05.002
Ferrari, F., Besio, G., Cassola, F., and Mazzino, A. (2020). Optimized wind and wave energy resource assessment and offshore exploitability in the mediterranean sea. Energy 190, 116447. doi:10.1016/j.energy.2019.116447
Foteinis, S. (2022). Wave energy converters in low energy seas: current state and opportunities. Renew. Sustain. Energy Rev. 162, 112448. doi:10.1016/j.rser.2022.112448
Fournier, C., Pantoja, C., Resio, D., and Scott, D. (2004). “The development of a 40 year wave climate for the entire chilean coastline,” in Coastal structures 2003, 689–701.
Freeman, M., Rose, D., Copping, A., Garavelli, L., and Hemery, L. (2024). From science to consenting: environmental effects of marine renewable energy
Gorr-Pozzi, E., García-Nava, H., Larrañaga, M., Jaramillo-Torres, M. G., and Verduzco-Zapata, M. G. (2021). Wave energy resource harnessing assessment in a subtropical coastal region of the pacific. J. Mar. Sci. Eng. 9, 1264. doi:10.3390/jmse9111264
Gunn, K., and Stock-Williams, C. (2012). Quantifying the global wave power resource. Renew. Energy 44, 296–304. doi:10.1016/j.renene.2012.01.101
Guo, C., Sheng, W., De Silva, D. G., and Aggidis, G. (2023). A review of the levelized cost of wave energy based on a techno-economic model. Energies 16, 2144. doi:10.3390/en16052144
Hersbach, H., Bell, B., Berrisford, P., Hirahara, S., Horányi, A., Muñoz-Sabater, J., et al. (2020). The era5 global reanalysis. Q. J. R. Meteorological Soc. 146, 1999–2049. doi:10.1002/qj.3803
Holthuijsen, L. H. (2010). Waves in oceanic and coastal waters. New York, United States: Cambridge University Press.
INOCAR (2021). Instituto oceanografico y antartico de la armada de ecuador. Accessed on: January 19, 2021
Kamranzad, B., and Lin, P. (2020). Sustainability of wave energy resources in the south China sea based on five decades of changing climate. Energy 210, 118604. doi:10.1016/j.energy.2020.118604
Kumar, S., Baalisampang, T., Arzaghi, E., Garaniya, V., Abbassi, R., and Salehi, F. (2022). Synergy of green hydrogen sector with offshore industries: opportunities and challenges for a safe and sustainable hydrogen economy. J. Clean. Prod. 135545doi, 135545. doi:10.1016/j.jclepro.2022.135545
Kumar, V. S., and Anoop, T. (2015). Wave energy resource assessment for the indian shelf seas. Renew. Energy 76, 212–219. doi:10.1016/j.renene.2014.11.034
Lavidas, G. (2020). Selection index for wave energy deployments (siwed): a near-deterministic index for wave energy converters. Energy 196, 117131. doi:10.1016/j.energy.2020.117131
Lavidas, G., and Venugopal, V. (2017a). A 35 year high-resolution wave atlas for nearshore energy production and economics at the aegean sea. Renew. Energy 103, 401–417. doi:10.1016/j.renene.2016.11.055
Lavidas, G., and Venugopal, V. (2017b). Wave energy resource evaluation and characterisation for the libyan sea. Int. J. Mar. energy 18, 1–14. doi:10.1016/j.ijome.2017.03.001
Lavidas, G., Venugopal, V., and Friedrich, D. (2017). Wave energy extraction in scotland through an improved nearshore wave atlas. Int. J. Mar. Energy 17, 64–83. doi:10.1016/j.ijome.2017.01.008
Law-Chune, S., Aouf, L., Dalphinet, A., Levier, B., Drillet, Y., and Drevillon, M. (2021). Waverys: a cmems global wave reanalysis during the altimetry period. Ocean. Dyn. 71, 357–378. doi:10.1007/s10236-020-01433-w
Lehmann, M., Karimpour, F., Goudey, C. A., Jacobson, P. T., and Alam, M.-R. (2017). Ocean wave energy in the United States: current status and future perspectives. Renew. Sustain. Energy Rev. 74, 1300–1313. doi:10.1016/j.rser.2016.11.101
Lemenkova, P. (2019). Geophysical modelling of the middle America trench using gmt. Ann. Valahia Univ. Targoviste. Geogr. Ser. 19, 73–94. doi:10.2478/avutgs-2019-0008
Lin, J., Peng, W., Jiang, J., and Wang, L. (2024). Cost-effectively laboratory experimental techniques for performance assessment of scale-down wave energy converters. Ocean. Eng. 297, 117061. doi:10.1016/j.oceaneng.2024.117061
Liu, J., Meucci, A., Liu, Q., Babanin, A. V., Ierodiaconou, D., Xu, X., et al. (2023). A high-resolution wave energy assessment of south-east Australia based on a 40-year hindcast. Renew. Energy 215, 118943. doi:10.1016/j.renene.2023.118943
Lucero, F., Catalán, P. A., Ossandón, Á., Beyá, J., Puelma, A., and Zamorano, L. (2017). Wave energy assessment in the central-south coast of Chile. Renew. Energy 114, 120–131. doi:10.1016/j.renene.2017.03.076
Martić, I., Degiuli, N., and Grlj, C. G. (2024). Scaling of wave energy converters for optimum performance in the adriatic sea. Energy 294, 130922. doi:10.1016/j.energy.2024.130922
Martinez, A., and Iglesias, G. (2020). Wave exploitability index and wave resource classification. Renew. Sustain. Energy Rev. 134, 110393. doi:10.1016/j.rser.2020.110393
Mazzaretto, O. M., Lucero, F., Besio, G., and Cienfuegos, R. (2020). Perspectives for harnessing the energetic persistent high swells reaching the coast of Chile. Renew. Energy 159, 494–505. doi:10.1016/j.renene.2020.05.031
Mazzaretto, O. M., and Menendez, M. (2024). A worldwide coastal analysis of the climate wave systems. Front. Mar. Sci. 11, 1385285. doi:10.3389/fmars.2024.1385285
Mediavilla, D. G., and Sepúlveda, H. H. (2016). Nearshore assessment of wave energy resources in central Chile (2009–2010). Renew. energy 90, 136–144. doi:10.1016/j.renene.2015.12.066
Medina, G. G., Yang, Z., Li, N., Cheung, K. F., and Lutu-McMoore, E. (2023). Wave climate and energy resources in American Samoa from a 42-year high-resolution hindcast. Renew. Energy 210, 604–617. doi:10.1016/j.renene.2023.03.031
Mentaschi, L., Kakoulaki, G., Vousdoukas, M., Voukouvalas, E., Feyen, L., and Besio, G. (2018). Parameterizing unresolved obstacles with source terms in wave modeling: a real-world application. Ocean. Model. 126, 77–84. doi:10.1016/j.ocemod.2018.04.003
Mentaschi, L., Pérez, J., Besio, G., Mendez, F., and Menendez, M. (2015). Parameterization of unresolved obstacles in wave modelling: a source term approach. Ocean. Model. 96, 93–102. doi:10.1016/j.ocemod.2015.05.004
Mentaschi, L., Vousdoukas, M., Besio, G., and Feyen, L. (2019). alphabetalab: automatic estimation of subscale transparencies for the unresolved obstacles source term in ocean wave modelling. SoftwareX 9, 1–6. doi:10.1016/j.softx.2018.11.006
Mork, G., Barstow, S., Kabuth, A., and Pontes, M. T. (2010). Assessing the global wave energy potential. Int. Conf. Offshore Mech. Arct. Eng. 49118, 447–454. doi:10.1115/OMAE2010-20473
Perez, J., Menendez, M., and Losada, I. J. (2017). Gow2: a global wave hindcast for coastal applications. Coast. Eng. 124, 1–11. doi:10.1016/j.coastaleng.2017.03.005
Portilla-Yandun, J., and Guachamin-Acero, W. (2023). “Wave spectral analysis for designing wave energy converters,” in Proceedings of the European Wave and Tidal Energy Conference, Bilbao, Spain, 3rd– 7th September 2023, 15. doi:10.36688/ewtec-2023-175
Portilla-Yandún, J., Salazar, A., Sosa, J., Latandret, S., and Cavaleri, L. (2020). Modeling multiple wave systems in the eastern equatorial pacific. Ocean. Dyn. 70, 977–990. doi:10.1007/s10236-020-01370-8
Raghavan, V., Simonetti, I., Metrikine, A. V., Lavidas, G., and Cappietti, L. (2024). A new numerical modelling framework for fixed oscillating water column wave energy conversion device combining bem and cfd methods: validation with experiments. Ocean. Eng. 301, 117543. doi:10.1016/j.oceaneng.2024.117543
Rascle, N., and Ardhuin, F. (2013). A global wave parameter database for geophysical applications. part 2: model validation with improved source term parameterization. Ocean. Model. 70, 174–188. doi:10.1016/j.ocemod.2012.12.001
Rasool, S., Muttaqi, K. M., Sutanto, D., and Hemer, M. (2022). Quantifying the reduction in power variability of co-located offshore wind-wave farms. Renew. Energy 185, 1018–1033. doi:10.1016/j.renene.2021.12.120
Rinaldi, G., Portillo, J., Khalid, F., Henriques, J., Thies, P., Gato, L., et al. (2018). Multivariate analysis of the reliability, availability, and maintainability characterizations of a spar–buoy wave energy converter farm. J. Ocean Eng. Mar. Energy 4, 199–215. doi:10.1007/s40722-018-0116-z
Rogers, W. E., Babanin, A. V., and Wang, D. W. (2012). Observation-consistent input and whitecapping dissipation in a model for wind-generated surface waves: description and simple calculations. J. Atmos. Ocean. Technol. 29, 1329–1346. doi:10.1175/jtech-d-11-00092.1
Rusu, L., and Onea, F. (2017). The performance of some state-of-the-art wave energy converters in locations with the worldwide highest wave power. Renew. Sustain. Energy Rev. 75, 1348–1362. doi:10.1016/j.rser.2016.11.123
Saha, S., Moorthi, S., Pan, H.-L., Wu, X., Wang, J., Nadiga, S., et al. (2010). The ncep climate forecast system reanalysis. Bull. Am. Meteorological Soc. 91, 1015–1058. doi:10.1175/2010bams3001.1
Saha, S., Moorthi, S., Wu, X., Wang, J., Nadiga, S., Tripp, P., et al. (2014). The ncep climate forecast system version 2. J. Clim. 27, 2185–2208. doi:10.1175/jcli-d-12-00823.1
Salvador, S., and Ribeiro, M. C. (2023). Socio-economic, legal, and political context of offshore renewable energies. Wiley Interdiscip. Rev. Energy Environ. 12, e462. doi:10.1002/wene.462
Schmitt, P., and Elsäßer, B. (2017). The application of froude scaling to model tests of oscillating wave surge converters. Ocean. Eng. 141, 108–115. doi:10.1016/j.oceaneng.2017.06.003
Shadman, M., Roldan-Carvajal, M., Pierart, F. G., Haim, P. A., Alonso, R., Silva, C., et al. (2023). A review of offshore renewable energy in south America: current status and future perspectives. Sustainability 15, 1740. doi:10.3390/su15021740
Sheng, W., Alcorn, R., and Lewis, A. (2014). Assessment of primary energy conversions of oscillating water columns. i. hydrodynamic analysis. J. Renew. Sustain. Energy 6. doi:10.1063/1.4896850
Soomere, T., and Eelsalu, M. (2014). On the wave energy potential along the eastern baltic sea coast. Renew. energy 71, 221–233. doi:10.1016/j.renene.2014.05.025
Soukissian, T., O’Hagan, A. M., Azzellino, A., Boero, F., Brito e Melo, A., Comiskey, P., et al. (2023). European offshore renewable energy: towards a sustainable future
Tawn, R., and Browell, J. (2022). A review of very short-term wind and solar power forecasting. Renew. Sustain. Energy Rev. 153, 111758. doi:10.1016/j.rser.2021.111758
Taylor, K. E. (2001). Summarizing multiple aspects of model performance in a single diagram. J. Geophys. Res. Atmos. 106, 7183–7192. doi:10.1029/2000JD900719
Tolman, H. L. (2009). User manual and system documentation of wavewatch iii tm version 3.14. Tech. note, MMAB Contrib., 276.
UN (2022). Sustainable development goals progress report 2022. sdg report. Economic and Social Council, 14–15.
Vanegas-Cantarero, M. M., Pennock, S., Bloise-Thomaz, T., Jeffrey, H., and Dickson, M. J. (2022). Beyond lcoe: a multi-criteria evaluation framework for offshore renewable energy projects. Renew. Sustain. Energy Rev. 161, 112307. doi:10.1016/j.rser.2022.112307
Ventura, Y., Rodriguez, Y., Odériz, I., Chavez, V., Mori, N., Felix, A., et al. (2022). New assessment of wave energy in relation to geomorphological and demographic characteristics on the pacific coast of baja California, Mexico. Front. Mar. Sci. 9, 872707. doi:10.3389/fmars.2022.872707
Vieira, M., Macedo, A., Alvarenga, A., Lafoz, M., Villalba, I., Blanco, M., et al. (2024). What future for marine renewable energy in Portugal and Spain up to 2030? forecasting plausible scenarios using general morphological analysis and clustering techniques. Energy Policy 184, 113859. doi:10.1016/j.enpol.2023.113859
Wan, Z., Su, Y., Li, Z., Zhang, X., Zhang, Q., and Chen, J. (2023). Analysis of the impact of suez canal blockage on the global shipping network. Ocean & Coast. Manag. 245, 106868. doi:10.1016/j.ocecoaman.2023.106868
Waters, R. (2008). Energy from ocean waves: full scale experimental verification of a wave energy converter. Electricity: Uppsala University. Ph.D. thesis.
Wessel, P., and Smith, W. H. (1996). A global, self-consistent, hierarchical, high-resolution shoreline database. J. Geophys. Res. Solid Earth 101, 8741–8743. doi:10.1029/96jb00104
Wg, I. (2013). The physical science basis. Contribution of working group I to the fifth assessment report of the intergovernmental panel on climate change 1535.
Windt, C., Davidson, J., and Ringwood, J. V. (2021). Numerical analysis of the hydrodynamic scaling effects for the wavestar wave energy converter. J. Fluids Struct. 105, 103328. doi:10.1016/j.jfluidstructs.2021.103328
WW3DG (2019) User manual and system documentation of WAVEWATCH III version 6.07, 333. NOAA/NWS/NCEP/MMAB Tech. Note. NOAA-EMC).
Zhai, Q., Li, T., and Liu, Y. (2021). Life cycle assessment of a wave energy converter: uncertainties and sensitivities. J. Clean. Prod. 298, 126719. doi:10.1016/j.jclepro.2021.126719
Zhao, Z., Holbrook, N. J., Oliver, E. C., Ballestero, D., and Vargas-Hernandez, J. M. (2020). Characteristic atmospheric states during mid-summer droughts over central America and Mexico. Clim. Dyn. 55, 681–701. doi:10.1007/s00382-020-05283-6
Zheng, C.-w., Wu, D., Wu, H.-l., Guo, J., Shen, C., Tian, C., et al. (2022). Propagation and attenuation of swell energy in the pacific ocean. Renew. Energy 188, 750–764. doi:10.1016/j.renene.2022.02.071
Keywords: Pacific Ocean, wave climate, wavewatch III, marine renewable energy, wave energy converter, capacity factor, selection index for wave energy deployment
Citation: Corrales-Gonzalez M, Lavidas G, Lira-Loarca A and Besio G (2024) Wave energy assessment and wave converter applicability at the Pacific coast of Central America. Front. Energy Res. 12:1454275. doi: 10.3389/fenrg.2024.1454275
Received: 24 June 2024; Accepted: 26 August 2024;
Published: 13 September 2024.
Edited by:
Milad Shadman, Federal University of Rio de Janeiro, BrazilReviewed by:
Luiz Paulo De Freitas Assad, Federal University of Rio de Janeiro, BrazilRaad Qassim, Federal Rural University of Rio de Janeiro, Brazil
Copyright © 2024 Corrales-Gonzalez, Lavidas, Lira-Loarca and Besio. This is an open-access article distributed under the terms of the Creative Commons Attribution License (CC BY). The use, distribution or reproduction in other forums is permitted, provided the original author(s) and the copyright owner(s) are credited and that the original publication in this journal is cited, in accordance with accepted academic practice. No use, distribution or reproduction is permitted which does not comply with these terms.
*Correspondence: Manuel Corrales-Gonzalez, bWFudWVsYWxlamFuZHJvLmNvcnJhbGVzZ29uemxlekBlZHUudW5pZ2UuaXQ=