 Zhengguo Qin1Yuanyuan Liu1Chasen Tongsh1
 Zhiming Bao1,2*Hongtao Li3Kangcheng Wu3Zhe Deng3Bowen Qin3*
 Qing Du1
 Kui Jiao1,2
- 1State Key Laboratory of Engines, Tianjin University, Tianjin, China
- 2National Industry-Education Platform for Energy Storage, Tianjin University, Tianjin, China
- 3Dongfeng Motor Corporation Research and Development Institute, Wuhan, China
The flow field serves as an important component of proton exchange membrane fuel cells (PEMFCs) for maintaining the hydration of the membrane and discharge of excessive water. In this study, a transparent polycarbonate plate was used as the cathode end plate of the PEMFC. The water management capacity of the PEMFCs with different cathode flow fields was evaluated. The movement and evolution patterns of water droplets, film, and columns in different flow fields were analyzed. The results show that liquid water is discharged faster as the cross-section of the flow channel becomes smaller. The performance of the PEMFC with a partially-narrowed flow field is higher due to better water management capacity and forced convection of gas reactant. Liquid water exists mostly in the form of liquid columns in the parallel flow channel, damaging the uniformity of gas distribution. The wavy flow field is likely to be flooded due to the difference of water movement velocity in different channel regions. In addition, a volume of fluid (VOF) model was developed to quantitatively evaluate the water management performance of each type of flow field. The water movement patterns in the different flow channels were concluded. This study provided real-time observations of water movement in the flow channel, revealing a correlation between water management capabilities and the performance of the PEMFC.
1 Introduction
To reduce carbon emissions and environmental pollution caused by the extensive use of fossil fuels, the search for renewable and eco-friendly energy solutions has been an important issue worldwide (Jewell et al., 2018). Proton exchange membrane fuel cell (PEMFC) is considered one of the most promising energy transfer devices due to its high power density and zero emission (Jiao et al., 2021a; Parekh, 2022; Yao et al., 2024). Improving the water management capacity is one of the most important subjects among many engineering challenges for the PEMFC (Jiao et al., 2021b; Huo and Hall, 2023). A certain membrane hydration is required to promote effective ionic conductivity during the PEMFC operation. Too little water would dry the membrane out. Excessive accumulation of liquid water can lead to flooding, which induces localized hot spots and corrosion of cell components including electrodes, gas diffusion layer (GDL), etc. Then limited reactive gas transport will negatively affect the performance, durability, and stability of PEMFCs (Min and Zhou, 2023; Wang et al., 2021; Nagulapati et al., 2023).
To improve the water management capacity of the cell, it is necessary to understand the liquid water movement within the flow field plates to achieve its structural optimization (Sun et al., 2023). According to research reports, the main techniques that can observe the water inside the fuel cell are neutron imaging technique (NIT) (Martinez et al., 2019; Manzi-Orezzoli et al., 2019), nuclear magnetic resonance imaging (NMR) (Mrad et al., 2023), X-ray radiography(XRR) (Kato et al., 2022; Tongsh et al., 2021; Martens et al., 2019), and optical visualization of PEMFCs (Rahimi-Esbo et al., 2017; Banerjee and Kandlikar, 2014), etc. The optical visualization technique uses hollowed-out flow field plates and transparent endplates to enable direct observation of liquid water within the flow channel. The method offers the advantage of high spatial and temporal resolution to capture the highly localized two-phase flow dynamics present in the channels, which has low operation cost and high convenience (Hu and Cao, 2016; Aslam et al., 2019). Zhan et al. (2012) applied the optical visualization technique and found that liquid water tends to accumulate in the region near the ridge due to flow rate difference and condensation of water vapor within the pores of GDL. At the same time, if the wall of the flow channel is more hydrophilic than the GDL surface, it tends to result in a liquid film covering the wall. Yin et al. (2022) achieved clear side imaging of water droplets in the flow channel of the PEMFC by using a high-speed camera. There are three stages of water droplet evolution. They are the growth stage, the oscillation stage, and the removal stage. The force balance of the water droplet in the three stages was revealed while the PEMFCs were operating. Rahimi- Esbo et al. (2020) designed a transparent PEMFC stack for investigating and evaluating the water management capacity when it operated at dead-end and open-end modes. An empirical correlation for estimating the required time for opening of purge valve was presented. Pei et al. (2022) obtained the liquid water distribution in the flow field through a transparent PEMFC. The liquid water formation characteristic was estimated according to the electric quantity produced. Based on transparent fuel cells segmented by printed circuit board, Meng et al. (2023) successfully revealed the correlation between cathode liquid water distribution and current density distribution in PEMFCs, which guides the flow field design and the development of water management strategies in fuel cell stacks. However, experimental observations are not able to obtain the details of interfacial changes. Therefore, many numerical simulation methods have also been applied in PEMFC flow channel research (Wang Y. et al., 2023; Zhao et al., 2023; Wang Z. et al., 2023). Among them, the volume of fluid (VOF) method has been widely used as a macroscopic interfacial capture method to study the two-phase flow characteristics in the flow channel. It was used to study the effects of the cross-section shapes of the PEMFC channel, the surface contact angles, the inlet velocities of air and water, as well as different droplet distributions on the water removal characteristics (Liao et al., 2022; Anyanwu et al., 2019; Chen et al., 2020). Dang and Zhou (2023) developed a three-dimensional VOF model to study the water removal process in cathode flow fields. They implemented a dynamic contact angle model to simulate the liquid behavior on GDLs. The observed liquid behavior agrees well with optical visualization results.
Above all, most of the studies focus on the liquid water movement in a single kind of flow field, but no comparisons between different flow fields have been made. Some of the studies are based on offline devices. There is no consideration for the stochastic behavior of water generation in real fuel cells. In this study, an optical visualization fuel cell test system was designed and constructed to compare the water evolution patterns within different cathode flow fields during cell operation. The correspondence between the liquid water drainage in the flow field and the cell performance was analyzed by combining the polarization curve test and electrochemical impedance spectroscopy test (EIS). After that, based on the real-time observation results, an accurate VOF model was built to research the two-phase flow characteristics in the flow channel. The local optimization of the flow field structure was further discussed to provide an important theoretical reference for the improved water management capacity of PEMFCs.
2 Methodology
2.1 Experimental setup
A visualized cathode PEMFC was designed as shown in Figure 1A, the active area of the PEMFC in this study is 25 cm2. The membrane electrode assembly (MEA) is produced by Wuhan WUT HyPower Technology Co., Ltd., which includes a membrane of 8 um, carbon papers of 167 um, and catalytic layers (CLs) with 0.1 and 0.4 mg cm−2 Pt loadings, corresponding to the anode and cathode, respectively. A heating pad is affixed to the anode plate for cell operating temperature control. The anode flow field plate is made of graphite with parallel flow fields cut on it. The visualized cathode consists of a hollowed-out flow field plate, a transparent plate, and a windowed end plate. The transparent plate is 8 mm thick, made of polycarbonate to prevent deformation during operating temperature, and is engraved with inlet and outlet air channels. The thickness of the hollowed-out flow field plate is equal to the height of the flow channel, which is 0.3 mm, and is made of stainless steel plated with gold (Dongguan SinoEtch Technology Co., Ltd.) to ensure electrical conductivity. The flow fields studied include parallel field, wavy flow field, and partially-narrowed flow field as shown in Figure 1C. The structural parameters of each flow field are shown in Table 1.
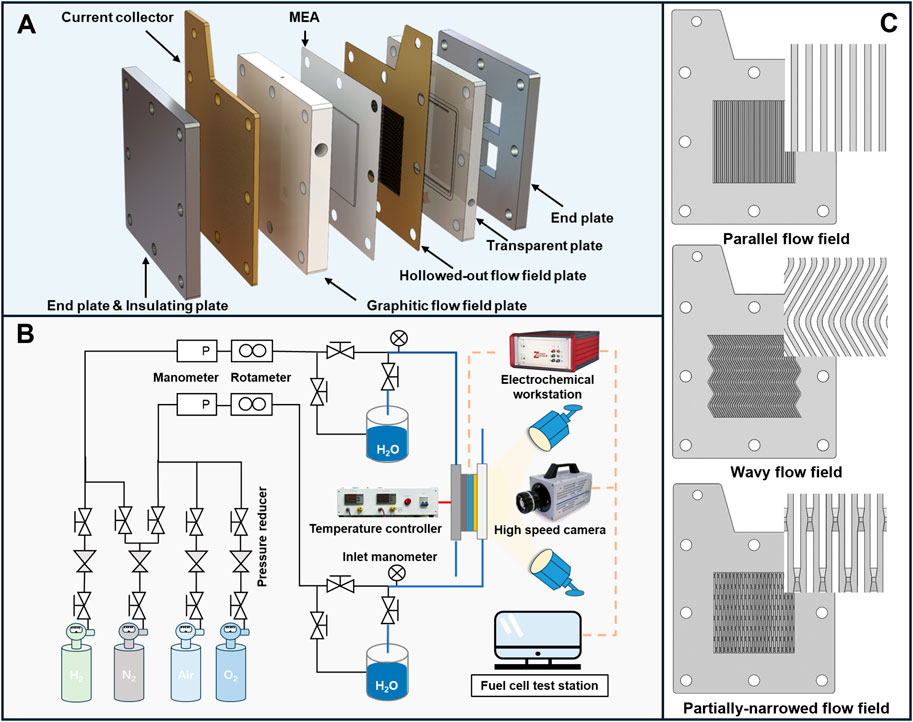
Figure 1. Assembly and testing of transparent PEMFCs: (A) Structure of cathode transparent fuel cell; (B) Schematic of the experimental system (Gong et al., 2023); (C) Cathode hollowed-out flow field plates.
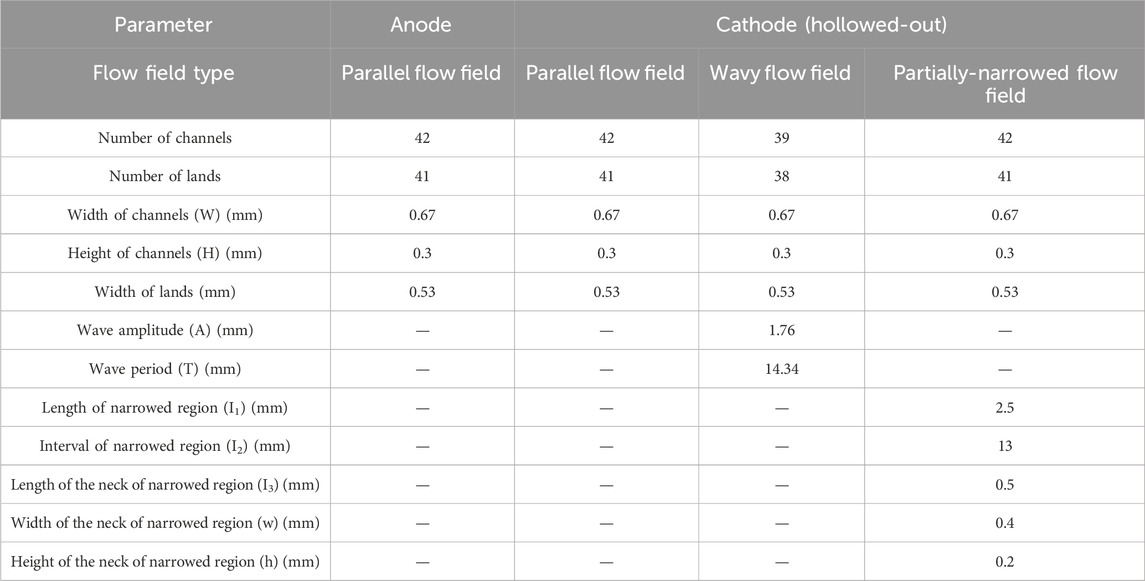
Table 1. Structural parameters of different flow fields in the experimental PEMFC.
After the PEMFCs were assembled, the experiments were carried out by using a 400 W fuel cell test system (Ningbo Baite Testing Equipment Co., Ltd.), an electrochemical workstation (Zahner Zennium E), and a high-speed camera (Photron fastcam sa1.1) as shown in Figure 1B. A cold light source was chosen to avoid temperature interference during the shooting process. Performance analysis and real-time observation of liquid water can be performed in parallel. The specific operating conditions are shown in Table 2.
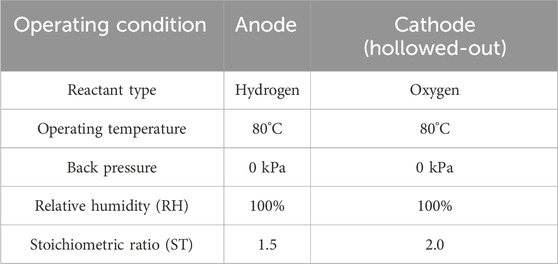
Table 2. Operating conditions of the PEMFCs.
2.2 Numerical model
A VOF model was employed in the study to investigate the gas transport and liquid water dynamics in the different flow fields. Grid independence test and model validation have been conducted in our previous works (Bao et al., 2019; Bao et al., 2020). The model selected the two sides of the flow channel as the inlet and outlet, respectively. Figure 2 shows the computation domain for the straight flow channel, wavy channel, and partially-narrowed channel. The initial and boundary conditions of cases are listed in Table 3. The liquid is initialized in the form of a droplet near the inlet of the flow channel. The inlet velocity is given as 3.3 m s−1, approximately equalling to the gas velocity in the operating PEMFC under 1.2 A cm−2. Total pressure (1 atm) is defined at the outlet and non-slip boundary is set for all the walls. The static contact angles of surfaces set in the model are derived from the averaged values measured at different places, as shown in Figure 3.
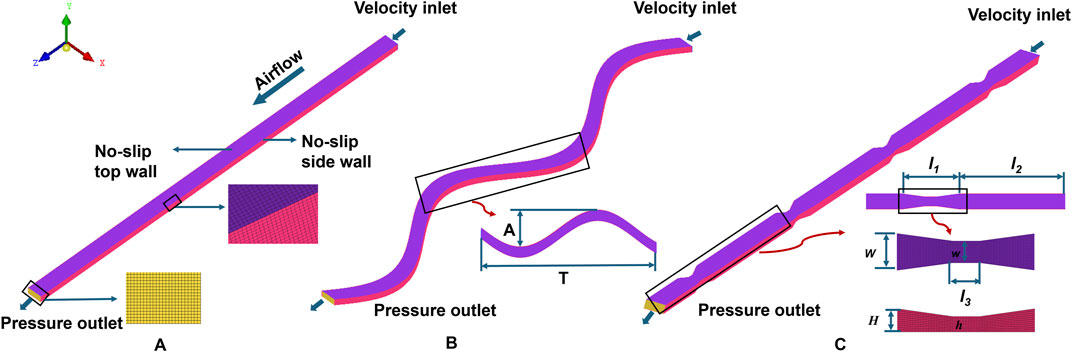
Figure 2. Computational domain of geometric channels under investigation (A) schematic illustration straight channel (B) schematic illustration wavy channel (C) schematic illustration partially-narrowed channel.
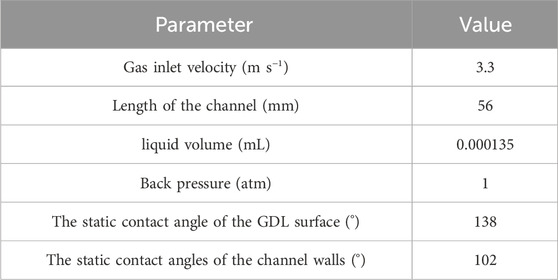
Table 3. Initial and boundary conditions for the cases in this study.
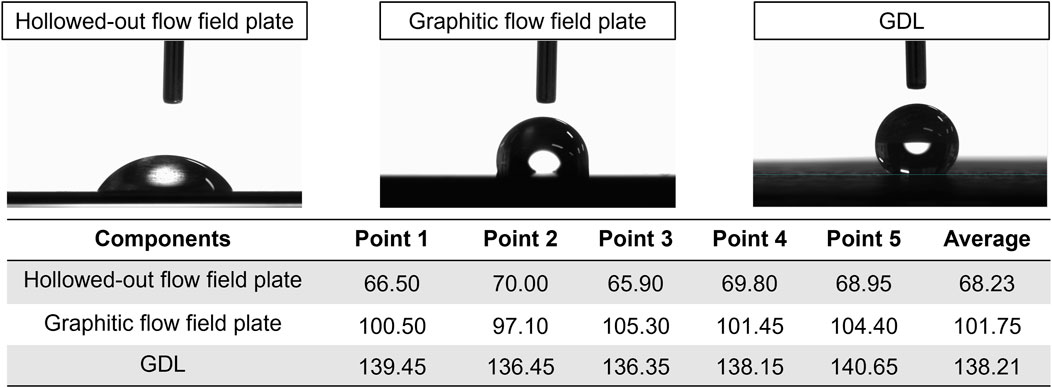
Figure 3. The static contact angles of surfaces for different components in the PEMFC.
The VOF method represents local phase change in the computational domain by defining phase volume fraction and realizes the capture of the phase interface by solving the phase volume fraction equation. The governing equations of the VOF method are as follows (Hirt and Nichols, 1981; Pilliod and Puckett, 2004):
where
where the subscripts l and g denote the liquid and gas phases, respectively.
The boundary conditions are simplified by defining the modified pressure pd:
where
3 Results and discussion
3.1 In-situ optical visualization of liquid water in flow fields
After the activation process in constant potential mode, the PEMFCs assembled with different flow fields were tested separately. According to Figure 4A, it is found that the parallel flow field and the wavy flow field have similar performance, while the partially-narrowed flow field shows the highest performance among the three, even in high current densities. It shows better water management capacity and efficient mass transfer. As shown in Figures 4B, C, the ohmic impedance of the PEMFC assembled with a partially-narrowed flow field is higher than the one with the parallel flow field, but the mass transfer and activation losses are reduced. The periodic narrowed channels in the partially-narrowed flow field lead to an enhanced gas mass transfer in the through-plane direction while the gas flow rate is also increased. However, the high gas flow rate reduces the hydration of the membrane compared with the parallel flow field. The wavy flow field has higher ohmic losses than the parallel flow field due to the bigger hollowed-out region, which causes larger electron transport resistance. It is proved by the I-V test in the Figure 4D. The test was conducted by replacing the MEA with a carbon paper to focus on the difference in contact resistance between the hollowed-out flow field plates and GDLs. However, the periodic change of gas flow direction increases the mass transfer to the GDL. The mass transfer and activation losses are reduced, resulting in the cell performance similar to that with the parallel flow field.
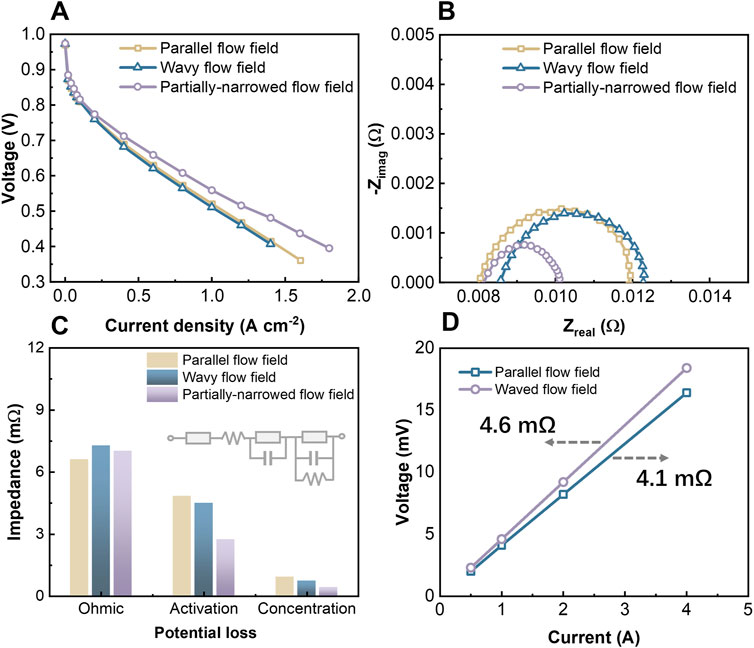
Figure 4. Experimental comparison of PEMFCs with different cathode flow fields: (A) Polarization curves; (B) EIS test results and (C) equivalent circuit (Tongsh et al., 2024) fitting results under 1.2 A cm−2; (D) The electrical contact resistance difference between GDLs and hollowed-out flow field plates.
The comparison of different flow fields on real-time observation results is consistent with the performance comparison. As shown in Figure 5, there is water accumulating in the flow channels of the parallel flow field, mostly in the form of liquid columns and liquid droplets. The liquid droplets move much faster than the liquid column. Because the gas tends to flow through the flow channel with less flow resistance. Once there is a channel blocked by liquid columns, the gas flow flux will be reduced, and the liquid column removal speed will be reduced as well. The phenomena lead to uneven distribution of the reactants in the flow channel. Fortunately, the pressure difference between the inlet and outlet of the channels always exists. The liquid column can still move slowly by the force. The moving speed of liquid columns is lower and lower with the number of water increasing in a channel as shown in Figure 5C. Specifically, the liquid column size will gradually decrease with the gas blowing. Then the column discharges or breaks up when the liquid column size is small enough. This is because water is constantly sticking to the walls in the form of film as it flows through channels due to the hydrophilicity of the channel walls, which is proved in Figure 3. Besides, confined chambers are formed between the liquid columns when multiple liquid columns are present in a flow channel. The heat generated in the active region surrounded by the liquid columns and walls is not easily carried away, which increases the possibility of causing localized hot spots.
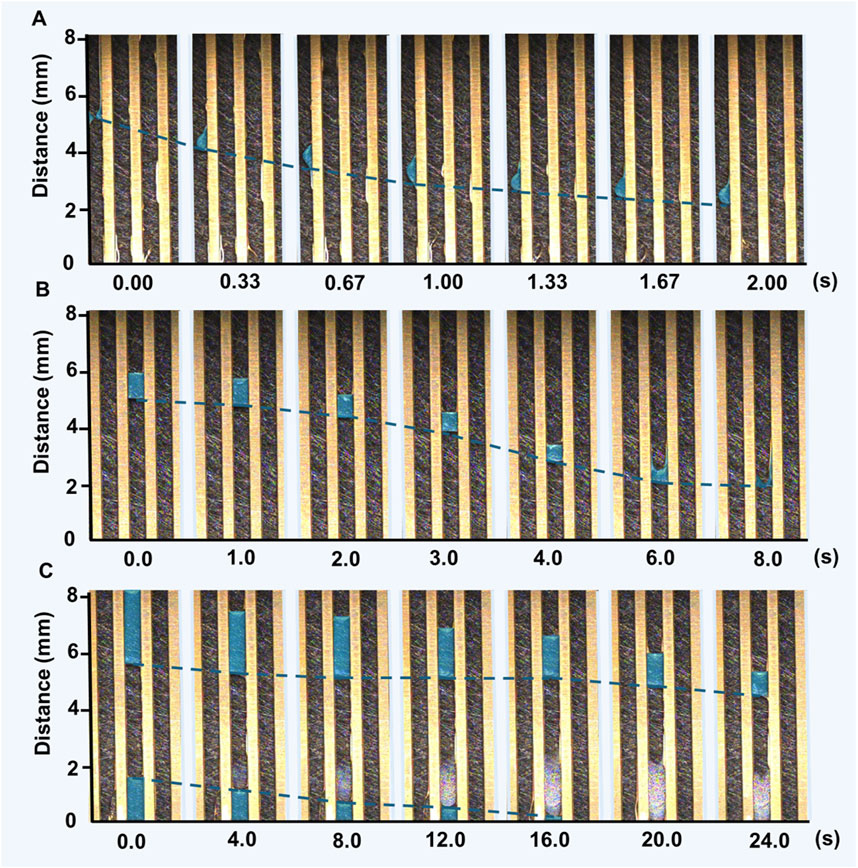
Figure 5. Real-time observations of liquid water movement in the parallel flow field: (A) Movement of droplets; (B) Movement of a liquid column; (C) Movement of multiple liquid columns in a single flow channel.
For the wavy flow field, although the periodic change of gas flow direction can improve the water removal capacity, which is proved by the EIS test result in Figure 4B, there is still water accumulation in the channels as shown in Figure 6A. An interesting phenomenon was discovered. The droplets move faster when they pass through non-bending regions than bending regions. In this case, the retention of droplets in the bend region is likely to cause the accumulation of liquid water, which in turn leads to the restriction of the reactant transfer efficiency. However, the partially-narrowed flow field shows excellent drainage ability. As shown in Figure 6B, the periodic change of the cross-sectional area of the partially-narrowed channel increases the gas flow rate significantly. The liquid water removal velocity in partially-narrowed flow fields is significantly higher than that in parallel flow fields. Although the membrane hydration is lower, the gas transfer in the through-plane direction is enhanced. This is reflected in the EIS test results as shown in Figure 4B. Therefore, the partially-narrowed flow field is conducive to the transmission of gas to the electrode reaction interface, improving the utilization rate of reactants and discharging the products in time. It has excellent performance.
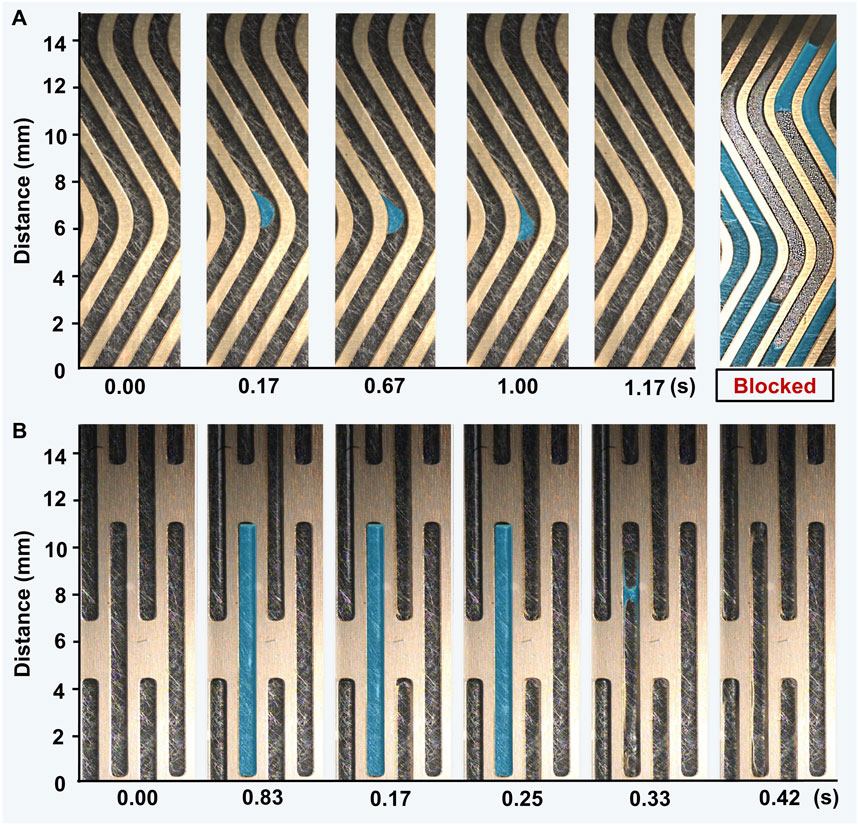
Figure 6. Real-time observations of liquid water movement in the different flow fields: (A) Velocity differences of liquid droplets through different regions of the wavy flow channel; (B) Rapid movement of liquid water in the partially-narrowed flow field.
3.2 Model analysis of liquid behaviors in a single flow channel
To quantitatively evaluate the water management performance of each type of flow field, this section investigated the water removal process of a single droplet in a single flow channel regarding liquid behaviors, pressure drop, coverage ratio, and droplet velocity. As shown in Figures 7A–C, we placed the same droplet at the inlet of different flow channels. It was found that the gas flow resistance is increased when a wavy or partially-narrowed channel is placed in the flow field as shown in Figure 7D. For a straight channel, the droplet moves fast in the channel if there is no water blockage happening. Liquid water tends to adhere on the side walls of channels under gas flow. In contrast, for a wavy channel, the contact of water with the GDL surface is reduced due to centrifugal force and adsorption on the hydrophilic wall when a droplet passes through the bending region, then the coverage ratio is low as shown in Figure 7E. The droplet moves slower in the wavy flow field due to the change in flow direction as shown in Figure 7F. The droplet shows an increase in velocity as they pass through each neck in the partially-narrowed flow channel, along with break-up into small droplets, which is consistent with experimental observation. Although the coverage ratio is slightly larger, it shows superior water removal capacity because of increased gas flow rate by narrowed regions. This can prevent the accumulation of droplets and improve the mass transfer efficiency of the reactants.
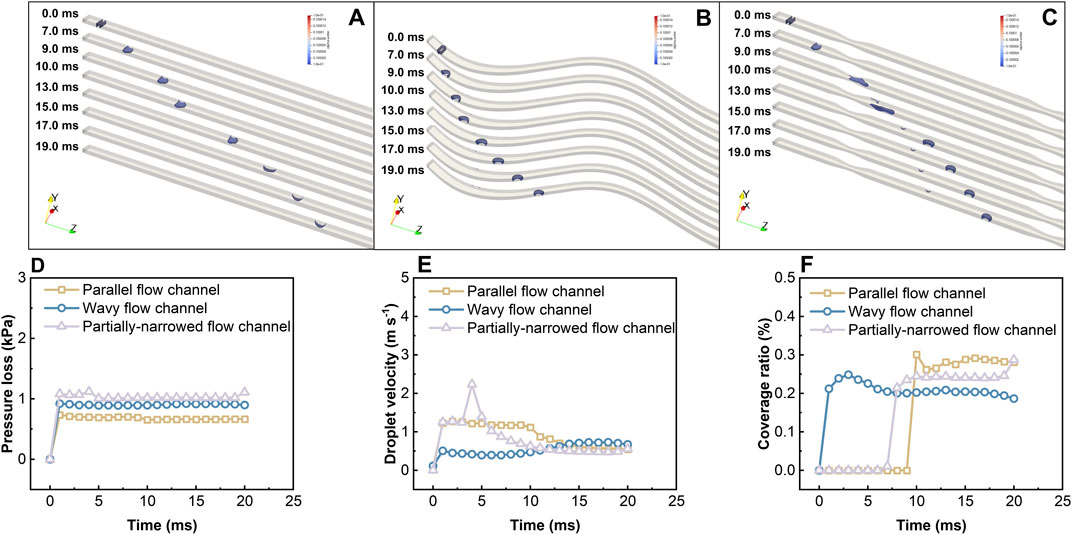
Figure 7. Temporal evolution of a droplet in the (A) straight channel, (B) wavy channel, and (C) partially-narrowed channel. The comparison of (D) pressure loss, (E) movement velocity, and (F) coverage ratio for water droplets among different flow channels.
3.3 Optimization of the partially-narrowed flow channel
To further optimize the water management capacity of the partially-narrowed flow channel. The width of neck of the partially-narrowed channel were reduced from 0.4 to 0.3, 0.2 mm. The observed moving behavior of liquid water in the channels is shown in Figures 8A, B. The flow resistance and the water droplet moving velocity will increase with the neck width decrease, which is shown in Figures 8C–E. Correspondingly, the breakup of liquid droplets is more significant. When the neck width is 0.2 mm, the surface coverage of droplets in the GDL is extremely small, which means that liquid water can be discharged efficiently in the form of small droplets. Reducing cross-section area of the neck or increasing the number of narrowed parts will help discharging water from the fuel cell. However, the excessive pressure loss in the flow channel will reduce the net power output. The flow rate connects the hydration of membrane. Therefore, it is necessary to arrange the neck area and number according to the actual operating conditions of the fuel cell.
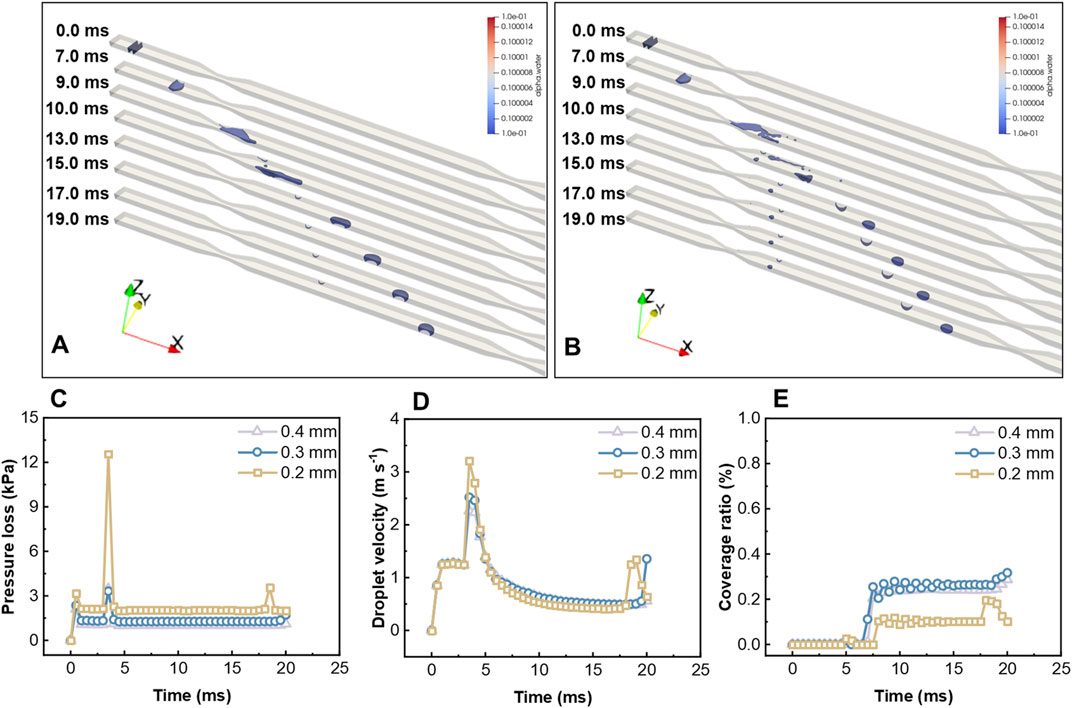
Figure 8. Temporal evolution of a droplet in the partially-narrowed flow channels with the neck width of (A) 0.3 mm and (B) 0.2 mm in the narrowed region. The comparison of (C) pressure loss, (D) movement velocity, and (E) coverage ratio for water droplets in the partially-narrowed flow channels with different neck widths.
As shown in the Figures 9A, B, for a partially-narrowed flow channel, each narrowed region in the flow channel could induce droplet break-up. In this study, the interval length between narrowed regions in the partially-narrowed flow channel is denoted by I2. There is no clear difference in droplet behavior when I2 is 19 or 13 mm. As shown in the Figures 9C–E, when I2 is reduced to 6.5 mm, a slight increase in the pressure drop in the flow channel occurs. The movement velocity and the surface coverage in the GDL of droplets show large fluctuations. Specifically, the fluctuations of the coverage ratio are between 0.2% and 0, which indicates that decreasing the interval between narrowed regions is favorable for the removal of liquid water. Compared to reducing the width of the neck, this option can achieve liquid water removal with a slight increase in pressure loss, which is a more effective. As shown in Figure 10, the partially-narrowed flow channel with different interval lengths of narrowed regions was applied to the cathode flow field to assemble a conventional fuel cell with 25 cm2 active area. It was found that a performance enhancement in line with expectations occurred. Compared to the parallel flow field, the net power density of the PEMFC assembling partially-narrowed flow field with I2 of 13 mm as well as 6.5 mm is increased by 22% and 43% under the voltage of 0.65 V, respectively (Nathanial et al., 2016). At high current densities, partially-narrowed flow fields show good drainage capacity, which ensures the efficiency of the reactive gas transport and reduces the concentration and activation losses.
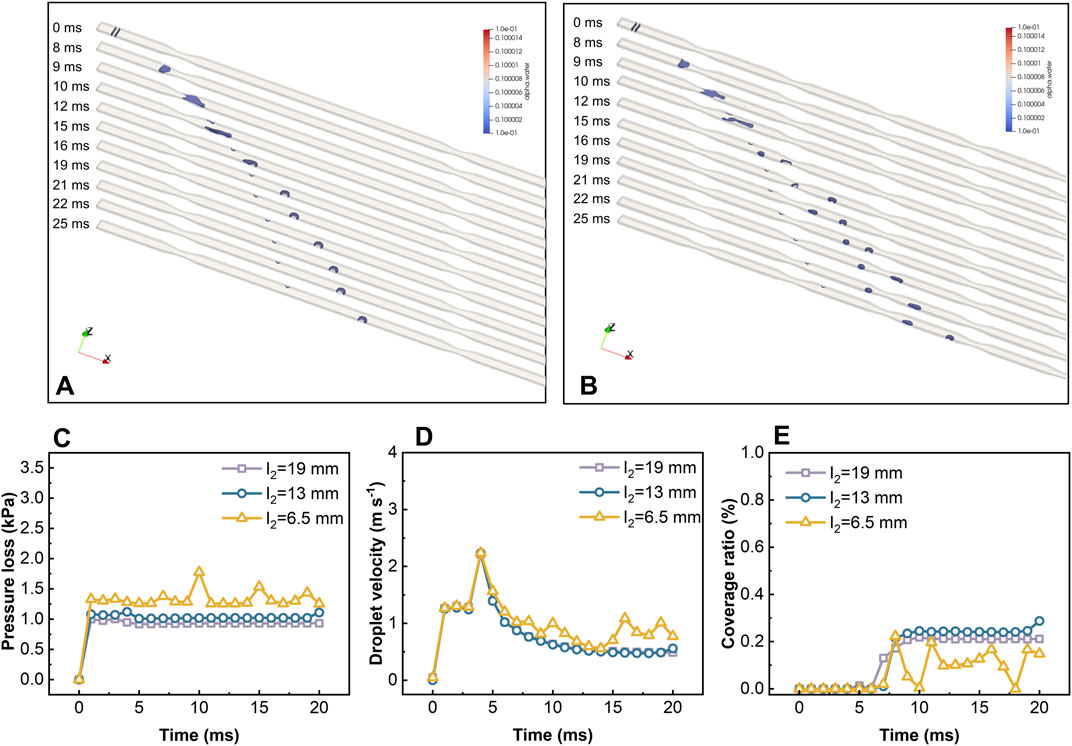
Figure 9. Temporal evolution of a droplet in the partially-narrowed flow channels with the interval between narrowed regions of (A) 19 mm and (B) 6.5 mm. The comparison of (C) pressure loss, (D) movement velocity, and (E) coverage ratio for water droplets in the partially-narrowed flow channels with different intervals of narrowed regions.
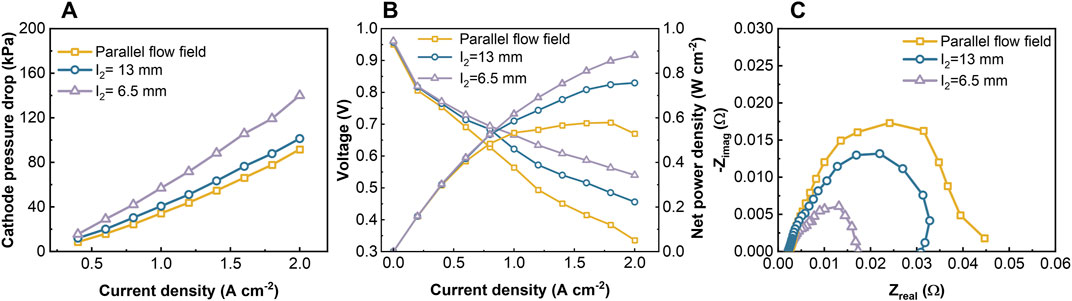
Figure 10. Comparison of the flow fields based on the partially-narrowed flow channel. Experimental comparison of the (A) pressure drop; (B) polarization curve and net power density; (C) EIS test result under 2.0 A cm−2.
4 Conclusion
Water management capacity is essential for the performance and stable operation of PEMFCs. This study used an optical visualization method to achieve real-time observation of liquid water inside different cathode flow fields during cell operation. The behaviors of liquid water in different flow fields were studied. A VOF model was built to quantify the liquid removal performance of different channels. The main conclusions are as follows:
1. Compared with the parallel flow field, the mass transfer loss of the PEMFCs with wavy flow field and partially-narrowed flow field is lower. The reason is that the gas flow direction changes periodically, which enhances both reactant distribution and through-plane convection. Specifically, the gas flow rate and pressure are periodically changed in the partially-narrowed flow field, which promotes the under-rib cross flow with MEA.
2. In the wavy flow field, the liquid water is removed more slowly but covers a smaller area of GDL surface than the parallel flow field because the inertia effect induced by the periodically changed gas flow direction enhances the adhesion effect of side walls. A lower coverage area of GDL surface indicates a higher mass transfer efficiency between flow field and GDL.
3. In the partially-narrowed flow field, periodically changed gas flow rate promotes both the discharge and the breakup of liquid droplets/columns at the necks of narrowed zones. But membrane hydration could be reduced by the increased pressure drop and through-plane convection. Therefore, the area of the necks and interval length between narrowed regions of the partially-narrowed flow field should be designed considering the change of ohmic loss and pumping loss.
Data availability statement
The original contributions presented in the study are included in the article/supplementary material, further inquiries can be directed to the corresponding authors.
Author contributions
ZQ: Conceptualization, Methodology, Validation, Writing–original draft. YL: Methodology, Software, Writing–original draft. CT: Data curation, Methodology, Writing–original draft. ZB: Funding acquisition, Methodology, Supervision, Writing–review and editing. HL: Project administration, Writing–original draft, Supervision. KW: Project administration, Writing–original draft, Methodology. ZD: Project administration, Writing–original draft. BQ: Methodology, Project administration, Supervision, Writing–original draft. QD: Funding acquisition, Resources, Writing–review and editing. KJ: Funding acquisition, Resources, Writing–review and editing, Methodology, Supervision.
Funding
The author(s) declare that financial support was received for the research, authorship, and/or publication of this article. This research is supported by the National Key Research and Development Program of China (Grant No. 2023YFB4005800), and the China National Postdoctoral Program for Innovative Talent (Grant No. BX20230258).
Conflict of interest
Authors HL, KW, ZD and BQ were employed by company Dongfeng Motor Corporation Research and Development Institute.
The remaining authors declare that the research was conducted in the absence of any commercial or financial relationships that could be construed as a potential conflict of interest.
The author(s) declared that they were an editorial board member of Frontiers, at the time of submission. This had no impact on the peer review process and the final decision.
Publisher’s note
All claims expressed in this article are solely those of the authors and do not necessarily represent those of their affiliated organizations, or those of the publisher, the editors and the reviewers. Any product that may be evaluated in this article, or claim that may be made by its manufacturer, is not guaranteed or endorsed by the publisher.
References
Anyanwu, I. S., Hou, Y., Xi, F., Wang, X., Yin, Y., Du, Q., et al. (2019). Comparative analysis of two-phase flow in sinusoidal channel of different geometric configurations with application to PEMFC. Int. J. Hydrog. Energy 44, 13807–13819. doi:10.1016/j.ijhydene.2019.03.213
Aslam, R. M., Ingham, D. B., Ismail, M. S., Hughes, K., and Pourkashanian, M. (2019). Simultaneous thermal and visual imaging of liquid water of the PEM fuel cell flow channels. J. Energy Inst. 92, 311–318. doi:10.1016/j.joei.2018.01.005
Banerjee, R., and Kandlikar, S. G. (2014). Liquid water quantification in the cathode side gas channels of a proton exchange membrane fuel cell through two-phase flow visualization. J. Power Sources 247, 9–19. doi:10.1016/j.jpowsour.2013.08.016
Bao, Z., Niu, Z., and Jiao, K. (2019). Numerical simulation for metal foam two-phase flow field of proton exchange membrane fuel cell. Int. J. Hydrog. Energy 44 (12), 6229–6244. doi:10.1016/j.ijhydene.2019.01.086
Bao, Z., Wang, Y., and Jiao, K. (2020). Liquid droplet detachment and dispersion in metal foam flow field of polymer electrolyte membrane fuel cell. J. Power Sources 480, 229150. doi:10.1016/j.jpowsour.2020.229150
Chen, R., Qin, Y., Ma, S., and Du, Q. (2020). Numerical simulation of liquid water emerging and transport in the flow channel of PEMFC using the volume of fluid method. Int. J. Hydrog. Energy 45, 29861–29873. doi:10.1016/j.ijhydene.2019.07.169
Dang, D. K., and Zhou, B. (2023). Effects of pin shapes on gas-liquid transport behaviors in PEMFC cathode. J. Power Sources 557, 232584. doi:10.1016/j.jpowsour.2022.232584
Gong, Z., Wang, B., Xing, Y., Xu, Y., Qin, Z., Chen, Y., et al. (2023). High-precision and efficiency diagnosis for polymer electrolyte membrane fuel cell based on physical mechanism and deep learning. eTransportation 18, 100275. doi:10.1016/j.etran.2023.100275
Hirt, C. W., and Nichols, B. D. (1981). Volume of fluid (VOF) method for the dynamics of free boundaries. J. Comput. Phys. 39 (1), 201–225. doi:10.1016/0021-9991(81)90145-5
Hu, M., and Cao, G. (2016). Research on the performance differences between a standard PEMFC single cell and transparent PEMFC single cells using optimized transparent flow field unit–Part I: design optimization of a transparent flow field unit. Int. J. Hydrog. Energy 41, 2955–2966. doi:10.1016/j.ijhydene.2015.12.144
Huo, D., and Hall, C. (2023). Data-driven prediction of temperature variations in an open cathode proton exchange membrane fuel cell stack using Koopman operator. Energy AI 14, 100289. doi:10.1016/j.egyai.2023.100289
Jewell, J., McCollum, D., Emmerling, J., Bertram, C., Gernaat, D. E. H. J., Krey, V., et al. (2018). Limited emission reductions from fuel subsidy removal except in energy-exporting regions. Nature 554, 229–233. doi:10.1038/nature25467
Jiao, K., Wang, B., Du, Q., Wang, Y., Zhang, G., Yang, Z., et al. (2021b). Water and thermal management of proton exchange membrane fuel cells Elsevier. doi:10.1016/B978-0-323-91116-0.00001-8
Jiao, K., Xuan, J., Du, Q., Bao, Z., Xie, B., Wang, B., et al. (2021a). Designing the next generation of proton-exchange membrane fuel cells. Nature 595 (7867), 361–369. doi:10.1038/s41586-021-03482-7
Kato, A., Kato, S., Yamaguchi, S., Suzuki, T., and Nagai, Y. (2022). Mechanistic insights into water transport in polymer electrolyte fuel cells with a variation of cell temperature and relative humidity of inlet gas elucidated by operando synchrotron X-ray radiography. J. Power Sources 521, 230951. doi:10.1016/j.jpowsour.2021.230951
Liao, J., Yang, G., Li, S., Shen, Q., Jiang, Z., Wang, H., et al. (2022). Study of droplet flow characteristics on a wetting gradient surface in a proton exchange membrane fuel cell channel using lattice Boltzmann method. J. Power Sources 529, 231245. doi:10.1016/j.jpowsour.2022.231245
Manzi-Orezzoli, V., Mularczyk, A., Trtik, P., Halter, J., Eller, J., Schmidt, T. J., et al. (2019). Coating distribution analysis on gas diffusion layers for polymer electrolyte fuel cells by neutron and X-ray high-resolution tomography. ACS Omega 4, 17236–17243. doi:10.1021/acsomega.9b01763
Martens, I., Vamvakeros, A., Chattot, R., Blanco, M. V., Rasola, M., Pusa, J., et al. (2019). X-ray transparent proton-exchange membrane fuel cell design for in situ wide and small angle scattering tomography. J. Power Sources 437, 226906. doi:10.1016/j.jpowsour.2019.226906
Martinez, N., Porcar, L., Escribano, S., Micoud, F., Rosini, S., Tengattini, A., et al. (2019). Combined operando high resolution SANS and neutron imaging reveals in-situ local water distribution in an operating fuel cell. ACS Appl. Energy Mater. 2, 8425–8433. doi:10.1021/acsaem.9b01266
Meng, K., Zhou, H., Yang, G., Chen, W., and Chen, B. (2023). Local performance response behavior during liquid water transport of a hydrogen–oxygen proton exchange membrane fuel cell: an experimental investigation. Energy Conv. Manag. 293, 117510. doi:10.1016/j.enconman.2023.117510
Min, T., and Zhou, Q. (2023). Effects of liquid water on transport in the catalyst layer of proton exchange membrane fuel cells. Front. Energy Res. 11, 1330124. doi:10.3389/fenrg.2023.1330124
Mrad, C., Perrin, J., Kaddouri, A. E., Guendouz, L., Mozet, K., Dillet, J., et al. (2023). NMR characterization of proton exchange membranes in controlled hygrometry conditions. J. Membr. Sci. 688, 122111. doi:10.1016/j.memsci.2023.122111
Nagulapati, V., Shiva Kumar, S., Annadurai, V., and Lim, H. (2023). Machine learning based fault detection and state of health estimation of proton exchange membrane fuel cells. Energy AI 12, 100237. doi:10.1016/j.egyai.2023.100237
Nathanial, J. C., Travis, S., Anthony, D. S., and Park, J. W. (2016). Experimental optimization of parallel and interdigitated PEMFC flow-field channel geometry. Int. J. Hydrog. Energy 41 (2), 1213–1223. doi:10.1016/j.ijhydene.2015.11.153
Parekh, A. (2022). Recent developments of proton exchange membranes for PEMFC: a review. Front. Energy Res. 10, 956132. doi:10.3389/fenrg.2022.956132
Pei, H., Xiao, C., and Tu, Z. (2022). Experimental study on liquid water formation characteristics in a novel transparent proton exchange membrane fuel cell. Appl. Energy 321, 119349. doi:10.1016/j.apenergy.2022.119349
Pilliod, J. D., and Puckett, E. D. (2004). Second-order accurate volume-of-fluid algorithms for tracking material interfaces. J. Comput. Phys. 199 (2), 465–502. doi:10.1016/j.jcp.2003.12.023
Rahimi-Esbo, M., Ramiar, A., Ranjbar, A. A., and Alizadeh, E. (2017). Design, manufacturing, assembling and testing of a transparent PEM fuel cell for investigation of water management and contact resistance at dead-end mode. Int. J. Hydrog. Energy 42, 11673–11688. doi:10.1016/j.ijhydene.2017.02.030
Rahimi- Esbo, M., Ranjbar, A. A., and Rahgoshay, S. M. (2020). Analysis of water management in PEM fuel cell stack at dead-end mode using direct visualization. Renew. Energy 162, 212–221. doi:10.1016/j.renene.2020.06.078
Sun, F., Su, D., Li, P., and Dong, X. (2023). A novel 3D fine-mesh flow field design and performance analysis for proton exchange membrane fuel cells. J. Power Sources 584, 233572. doi:10.1016/j.jpowsour.2023.233572
Tongsh, C., Liang, Y., Xie, X., Li, L., Liu, Z., Du, Q., et al. (2021). Experimental investigation of liquid water in flow field of proton exchange membrane fuel cell by combining X-ray with EIS technologies. Sci. China Technol. Sci. 64, 2153–2165. doi:10.1007/s11431-021-1815-6
Tongsh, C., Wu, S., Jiao, K., Huo, W., Du, Q., Park, J. W., et al. (2024). Fuel cell stack redesign and component integration radically increase power density. Joule 8 (1), 175–192. doi:10.1016/j.joule.2023.12.003
Wang, X. R., Ma, Y., Gao, J., Li, T., Jiang, G., and Sun, Z. (2021). Review on water management methods for proton exchange membrane fuel cells. Int. J. Hydrog. Energy 46, 12206–12229. doi:10.1016/j.ijhydene.2020.06.211
Wang, Y., Wu, K., Zhao, H., Li, J., Sheng, X., Yin, Y., et al. (2023). Degradation prediction of proton exchange membrane fuel cell stack using semi-empirical and data-driven methods. Energy AI 11, 100205. doi:10.1016/j.egyai.2022.100205
Wang, Z., Liu, Z., Fan, L., Du, Q., and Jiao, K. (2023). Application progress of small-scale proton exchange membrane fuel cell. Energy Rev. 2, 100017. doi:10.1016/j.enrev.2023.100017
Yao, J., Wu, Z., Wang, B., Yang, Y., Yang, F., Zhang, Z., et al. (2024). High-stability dead-end anode proton exchange membrane fuel cells by purge optimization. J. Power Sources 595, 234062. doi:10.1016/j.jpowsour.2024.234062
Yin, Y., Li, Y., Qin, Y., Li, M., Liu, G., Zhang, J., et al. (2022). Ex-situ experimental study on dynamic behaviors and detachment characteristics of liquid water in a transparent channel of PEMFC. Renew. Energy 187, 1037–1049. doi:10.1016/j.renene.2022.02.031
Zhan, Z., Wang, C., Fu, W., and Pan, M. (2012). Visualization of water transport in a transparent PEMFC. Int. J. Hydrog. Energy 37, 1094–1105. doi:10.1016/j.ijhydene.2011.02.081
Keywords: PEMFC, optical visualization, water movement, transparent end plate, VOF model
Citation: Qin Z, Liu Y, Tongsh C, Bao Z, Li H, Wu K, Deng Z, Qin B, Du Q and Jiao K (2024) In-situ visualization and structure optimization of the flow channel of proton exchange membrane fuel cells. Front. Energy Res. 12:1454007. doi: 10.3389/fenrg.2024.1454007
Received: 24 June 2024; Accepted: 27 August 2024;
Published: 11 September 2024.
Edited by:
Xianguo Li, University of Waterloo, CanadaReviewed by:
Pablo A. García-Salaberri, Universidad Carlos III de Madrid, SpainTaikai Liu, Guangdong Academy of Sciences, China
Copyright © 2024 Qin, Liu, Tongsh, Bao, Li, Wu, Deng, Qin, Du and Jiao. This is an open-access article distributed under the terms of the Creative Commons Attribution License (CC BY). The use, distribution or reproduction in other forums is permitted, provided the original author(s) and the copyright owner(s) are credited and that the original publication in this journal is cited, in accordance with accepted academic practice. No use, distribution or reproduction is permitted which does not comply with these terms.
*Correspondence: Zhiming Bao, em1iYW9AdGp1LmVkdS5jbg==; Bowen Qin, cWluYndAZGZtYy5jb20uY24=