 Yi Liang1
 Yunxia Xu
- 1Guangzhou Power Supply Bureau, Guangdong Power Grid Co., Ltd, Guangzhou, China
- 2Sichuan Energy Internet Research Institute, Tsinghua University, Chengdu, China
There is a relative lack of research aimed at developing a comprehensive index system for low-carbon development of power systems in load-intensive cities in China. First, this paper outlined the main challenges faced in the urban power system development process and determined development goals and key indexes that combined the macro goals and requirements of constructing new power systems with the development characteristics and trends of load-intensive urban power systems. Second, a comprehensive index system and evaluation method for the low-carbon development of power systems was proposed to consider the perspectives of safety, efficiency, clean energy, low carbon, and flexibility. Finally, the effectiveness of the proposed index system and evaluation method was verified by taking the development of actual power systems in ultra-large-load-intensive cities as an example, providing support for the development decision making of actual urban power system construction and transformation.
1 Introduction
Accelerating the low-carbon transformation of the power system and building a new type of power system is an important way to achieve the “dual carbon” goal in China (Hou et al., 2022). According to statistics, urban energy consumption accounts for 85.1% of the total energy consumption in China at present, and the power industry accounts for about 42% of the total CO2 emissions in the energy industry (IPCC, 2014; Sun et al., 2022). In addition, the National Development and Reform Commission of China issued the “Guidelines for the Preparation of Carbon Peaking Pilot Implementation Plans” on 20 October 2023, which proposed to carry out the first batch of carbon peaking pilot construction in 15 provinces and regions, with the main body of pilot city construction being prefecture-level and above cities. It is clear that accelerating the low-carbon transformation of the urban power industry and building a new type of urban power system plays an important pioneering and exemplary role. However, the construction of a new urban power system in China (referred to as urban system construction) is still in its infancy, and it is faced with problems such as insufficient experience, unclear focus, and lack of systematic indexes. System construction difficulties are further aggravated by large differences in load characteristics, power supply structures, power grid forms, and new technology applications in major cities. Therefore, at this stage, under the framework of the dual carbon goal and new energy system construction requirements, it is urgent to study and judge the development trend, analyze the main problems and challenges faced by the city’s power system characteristics, development basis, and resource endowment, and research index systems for new power systems to provide support for urban system construction and development decision-making.
In recent years, domestic and foreign research on evaluation index systems for low-carbon power systems has been carried out, and some results have been achieved. Foreign studies in related fields mainly focus on the technical and economic evaluation of a single type of new energy after grid connection (Thango et al., 2021; Verma et al., 2021), which rarely involves the whole power system level. In China, research in related fields is relatively extensive (Zeng et al., 2011). Shang (2009) describes the development characteristics and technical and theoretical support of a low-carbon power grid. Sun et al. (2014) and Qi (2019) put forward quantitative evaluation methods in comprehensive evaluation index systems for low-carbon power grids from large power grids and distribution networks, respectively. Huang et al. (2016), Li et al. (2011), and Guo et al. (2022) consider information automation and risk assessment and propose an intelligent evaluation index system of new energy high penetration systems by using different algorithms. Liu (2022) put forward an evaluation system of key technologies of the modern power grid based on a pilot. Zhao et al. (2021), Zhang et al. (2019), and Li and Chen (2019) proposed a new power system evaluation method to support the replacement of traditional power sources with new energy sources for integrated energy systems at the park or regional levels.
To sum up, existing studies have evaluated the index systems and methods for constructing low-carbon systems at different scales from a single perspective, such as low-carbon, flexible, or intelligent, but a comprehensive evaluation for the construction of new power systems in super-large, load-intensive cities that can support the current urban system construction work is relatively lacking.
To solve the above problems, this paper first analyzes the main problems and challenges that may be faced in the process of urban system construction. It determines the development goals, which are based on the objective requirements of the construction of new power systems and the development characteristics of load-intensive urban power systems in China. Then, an index system considering multiple objectives and reasonable evaluation methods applicable to constructing new power systems in load-intensive cities is proposed. An actual urban power system is taken as an example to verify the effectiveness of the proposed index system, which provides support for urban system construction and development decision-making.
2 Analysis of characteristics and construction objectives of a new urban power system
2.1 Ensure the supply and demand balance, security, and stability of the power system
Balancing the supply and demand for the new power system with a high proportion of new energy is the primary task (Liu et al., 2023). Especially in load-intensive cities, the load level is high, and the load peak-valley difference is large. Large-scale new energy grid connections further exacerbate the difficulty of system peak regulation due to output volatility, randomness, and even anti-peak regulation characteristics (Zhang and Kang, 2022). During some difficult peak load balancing periods, some conventional generators may enter the deep peak shaving state, sacrificing the efficiency and economy of such unit operations. Therefore, it is important to develop reasonable, balanced scheduling strategies to ensure system supply and demand balance and efficient economical operation by considering the power supply support level within the region and the power transmission characteristics of the external communication channels.
To ensure high-level and high-quality urban load electricity consumption, it is necessary to continuously improve the power grid structure, increase the N-1 pass rate of the power grid, and approach the main distribution network level of advanced cities such as New York, Munich, and Singapore that have fully achieved N-1 requirements (Liu et al., 2014). In addition, most new energy sources are connected to the power grid through power electronic devices, which have the characteristics of low inertia, weak stability, weak anti-interference, and decentralized control (Zhang et al., 2022). The large-scale integration of new energy into the grid may bring stability problems in typical scenarios. First, under heavy load conditions, the strong voltage support point of the power grid hub is limited, and the high or low output of new energy may have an impact on the voltage stability of the system. Second, a low system short-circuit ratio may lead to synchronization and stability issues with new energy. Third, the new energy grid connections may impact the power angle stability of conventional units in the nearby area.
Therefore, urban system construction should not only ensure the most basic balance between the supply and demand of electricity and power but also improve the safety and stability of system operation to achieve a high-quality power supply. It is necessary to consider the impact of new energy grid connections on system operations from the perspective of safety and efficiency, combined with the load characteristics of the system, the support capacity of local power sources, and external transmission channels. The key indexes that measure the balance between the supply and demand of the system should be considered, such as load peak-valley difference, source load matching degree, power/electricity self-sufficiency rate, etc. The key indexes that reflect the stability of the system operation also need to be considered, such as transmission and distribution equipment meeting N-1 standards and short-circuit current margin, etc.
2.2 Ensure energy upgrade, energy savings, and emissions reduction of the power system
The energy consumption and carbon emissions targets for urban system construction in China’s “Carbon Peak Guidelines” are required. Focusing on the power industry, the main task of the power supply side is to change the energy structure of the power supply, with a focus on the upgrading and transformation of thermal power and the development and utilization of new energy. The main task of the load side is to promote the energy consumption revolution, with a focus on promoting the substitution of electricity for energy terminals.
Therefore, to ensure energy upgrade energy saving and emissions reductions, it is necessary to start from clean and low-carbon perspective, focusing on indexes that measure the energy structure on the power side, such as the proportion of new energy installed capacity and the proportion of clean thermal power generation, the proportion of terminal electricity consumption that measures the level of electricity consumption on the load side, the proportion of alternative electricity consumption, and the unit GDP carbon emissions that measure the level of urban carbon emissions, the electricity carbon emission intensity, and other indexes.
2.3 Enhance the flexible adjustment ability of the power system
During the construction and development of urban power systems, large-scale new energy is continuously connected to the power supply side. Electric vehicles and virtual power plants on the load side are constantly developing. These changes form a “double high” characteristic of uncertainty on both the source and load sides of the system and lead to a sharp increase in the system’s demands for flexibility, including frequent peak shaving and emergency regulation (Wei et al., 2023a). Therefore, it is urgent to fully tap into the flexibility resources in the system and respond to the increasing demand for flexibility.
It is difficult to build large capacity regulating power plants in load-intensive urban power systems due to the limitations of land spatial resources (Wei et al., 2023b). Therefore, flexibility transformation can start with the local stock of conventional thermal power as much as possible to further enhance the depth of unit peak shaving. Second, based on the construction conditions of the system and the economic comparison of new energy storage technologies, an appropriate scale of energy storage systems can be reasonably arranged, and the urgent and difficult problems of weak links in the system can be solved by fully utilizing the excellent active and reactive power rapid adjustment capabilities of new energy storage. Third, with the city’s large-scale and centrally adjustable industrial and commercial load clusters and the resource advantages of many electric vehicles, measures such as establishing virtual power plants, improving demand-side response mechanisms, and expanding the charging facility network for electric vehicles entering the vehicle to grid (V2G) network can be taken to enhance the flexible regulation capability on the load side.
Therefore, in order to enhance the flexible adjustment ability in the process of urban system construction, it is necessary to start from the perspective of flexibility and focus on the conventional power supply flexibility transformation ratio and peak shaving depth indexes reflecting the power supply side, energy storage side response ability indexes, load side demand response ability indexes, and vehicle network interaction index indexes.
The main characteristics and construction goals of building an urban system are summarized in Table 1.
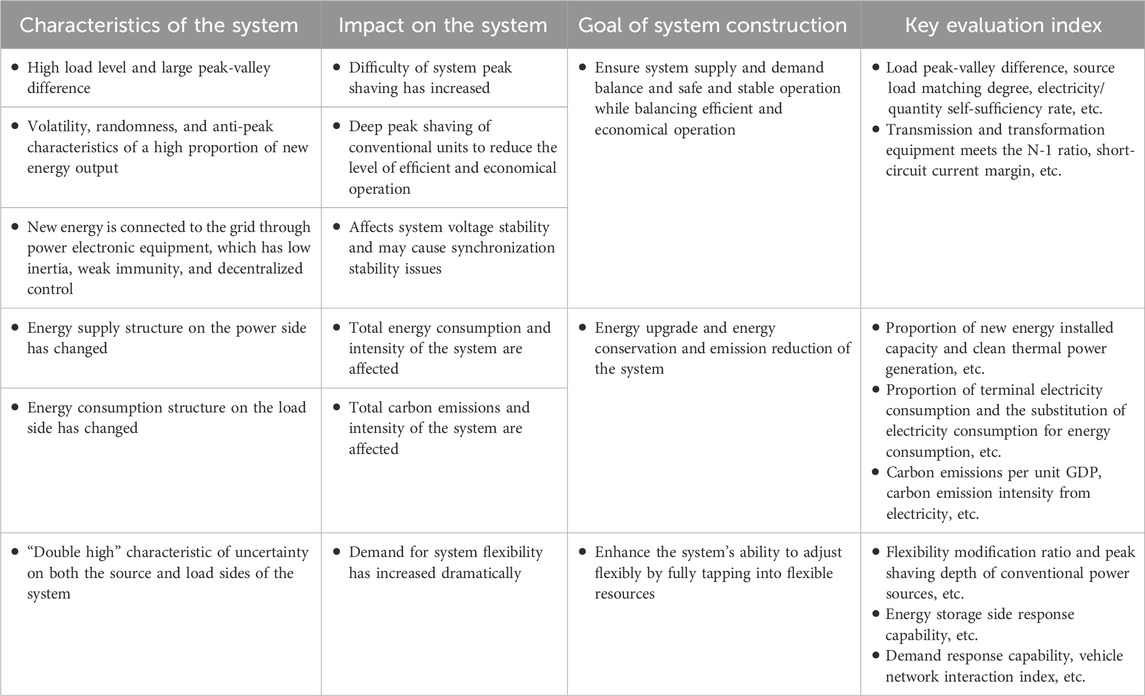
Table 1. Main characteristics and construction goals of the new urban power system.
3 The index system for the new urban power system
Based on the construction goals of the new urban power system, this paper adopts the analytic hierarchy process (AHP) with the major goals of safety, efficiency, clean energy, low carbon, and flexibility as the primary indexes and appropriately expands the secondary indexes, proposing a comprehensive evaluation index system suitable for the construction of new power systems in load-intensive cities, as shown in Table 2.
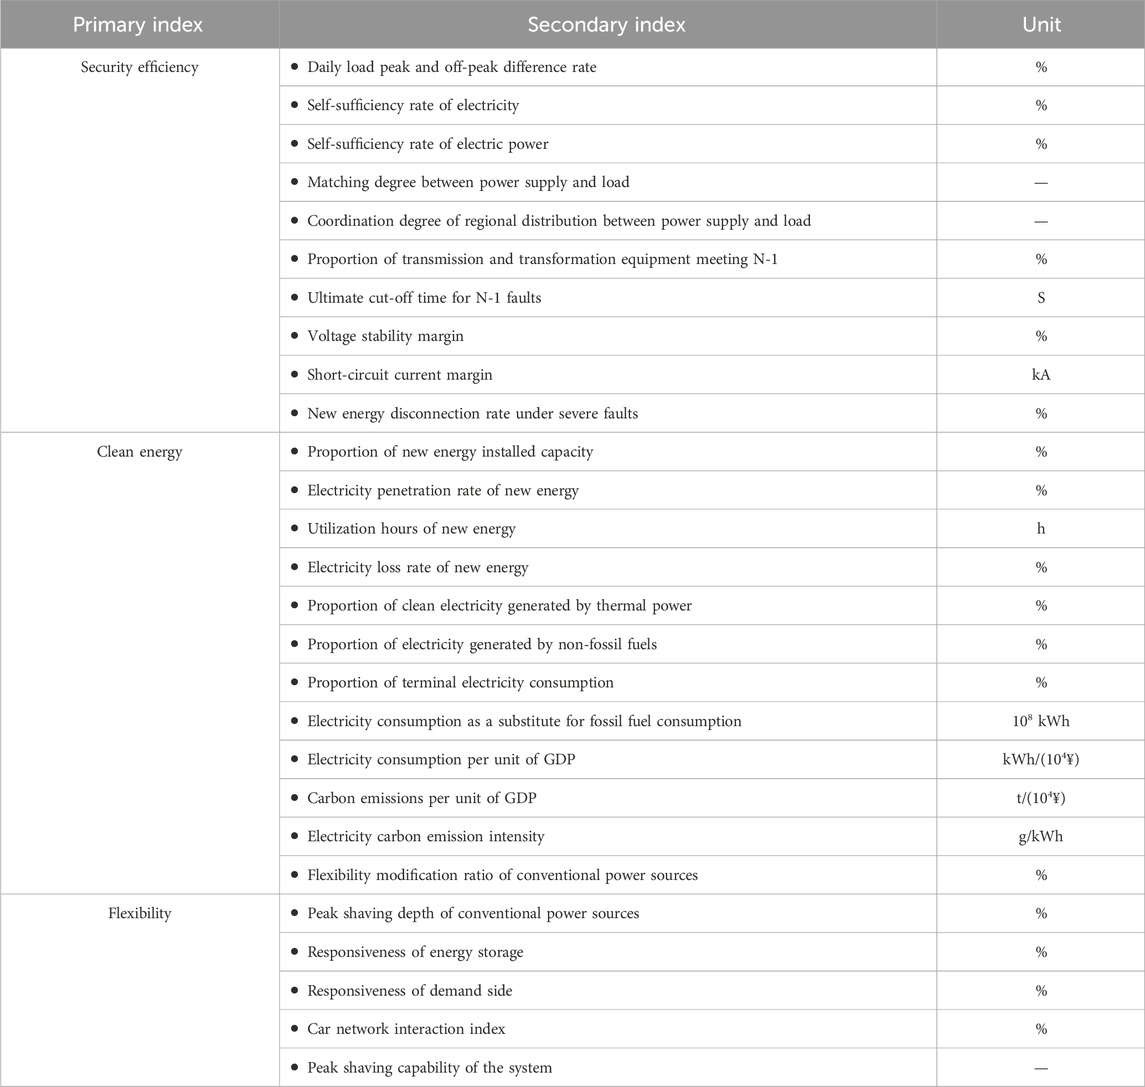
Table 2. Index system for a new power system in load-intensive cities.
3.1 Indexes of security efficiency
(1) Daily load peak and off-peak difference rate-
This index refers to the ratio of the maximum daily peak-valley difference of the system to the maximum daily load within 24 h, reflecting the degree of imbalance in the power grid load at different times. It can be calculated from Equation 1.
where
(2) Self-sufficiency rate of electricity-
This index refers to the proportion of local power generation to the total social electricity consumption during the statistical period, which reflects the degree of self-sufficiency in regional electricity supply. It can be calculated from Equation 2.
where
(3) Self-sufficiency rate of electric power-
This index refers to the proportion of local power output to average load demand during the calculation period, which reflects the degree of self-sufficiency in regional electricity supply (Wang et al., 2022). It can be calculated from Equation 3.
where
(4) Matching degree between power supply and load-
This index refers to the ratio of the installed capacity of local power sources to the maximum local load, which reflects the adequacy of regional power supply. It can be calculated from Equation 4.
where
(5) Coordination degree of regional distribution between power supply and load-
This index refers to the variance value between the source load matching degree of each area in the system and the overall source load matching degree of the system, which reflects the degree of matching between the system load demand and the geographical spatial distribution of the power supply. It can be calculated from Equation 5.
where
(6) Proportion of transmission and transformation equipment meeting N-1-
This index refers to the total number of areas in the system, which refers to the proportion of single transmission and transformation components (mainly considering 110 kV and above lines and main transformers) in the system that meet the N-1 operation of the power grid after a fault occurs, which reflects the safety and stability level of the power grid (Li et al., 2014). It can be calculated from Equation 6 and Equation 7.
where
(7) Ultimate cut-off time for N-1 faults-
This index refers to the longest duration of critical stable operation that a system can withstand after an N-1 fault occurs, reflecting the system’s ability to withstand N-1 continuous faults (Grid Operation and Control (China), 2019). This index can obtained according to the transient stability calculation results of the power system to be studied, which requires professional power system simulation and analysis software.
(8) Voltage stability margin-
This index refers to the proportion of the difference between the current operating point voltage and the instability critical point voltage of a node, which gradually increases the system load and reflects the distance between the current-voltage stability level of the system and the voltage collapse point. It can be calculated from Equation 8.
where
(9) Short-circuit current margin-
This index refers to the ratio of the difference between the short-circuit current and the short-circuit current limit generated after a three-phase or single-phase short-circuit fault occurs in the station bus of the system, which reflects the distance between the system short-circuit current level and the rated breaking current of the switch. It can be calculated from Equation 9.
where
(10) New energy disconnection rate under severe faults-
This index refers to the proportion of the off-grid capacity of new energy units to the installed capacity of new energy in the region after a serious system failure, which reflects the ability of new energy units to withstand faults. It can be calculated from Equation 10.
where
3.2 Clean energy indexes
(1) Proportion of new energy installed capacity-
This index refers to the proportion of new energy installed capacity in the system to all power supply installed capacity during the statistical period, which reflects the degree of green transformation of the system’s power supply structure (Li et al., 2023). It can be calculated from Equation 11.
(2) Electricity penetration rate of new energy-
This index refers to the ratio of the active output of new energy to the system load at a certain moment, which reflects the supporting capacity of new energy to the system load. It can be calculated from Equation 12.
where
(3) Utilization hours of new energy-
This index refers to the ratio of new energy generation to installed capacity in the system during the statistical period (LI et al., 2023), which reflects the utilization level of new energy generation equipment. It can be calculated from Equation 13 and Equation 14.
where
(4) Electricity loss rate of new energy-
This index refers to the ratio of new energy curtailment to electricity generation in the system during the statistical period (Zhang et al., 2022), which reflects the level of new energy consumption in the system. It can be calculated from Equation 15 and Equation 16.
where
(5) Proportion of clean electricity generated by thermal power-
where
(6) Proportion of electricity generated by non-fossil fuels-
This index refers to the proportion of non-fossil energy (including hydropower, wind power, photovoltaic, nuclear power, biomass power, etc.) generated to the total power generation of all power sources in the system during the statistical period (National Development and Reform Commission (China), 2021), which reflects the clean and low-carbon level of the system’s power structure. It can be calculated from Equation 19.
where
(7) Proportion of terminal electricity consumption-
This index refers to the proportion of electricity consumption in the total amount of final energy consumption (National Energy Administration (China), 2021), which reflects the level of energy consumption reform on the load side of the system. It can be calculated from Equation 20.
where
(8) Electricity consumption as a substitute for fossil fuel consumption-
This index refers to the required amount of electricity to replace direct coal, direct fuel (gas), and other energy consumption methods to meet the same needs or achieve the same goals.
(9) Electricity consumption per unit of GDP-
This index refers to the electricity consumption per unit of GDP, which is the ratio of the total social electricity consumption to the GDP during the statistical period (National Energy Administration (China), 2014). It can be calculated from Equation 21.
where
(10) Carbon emissions per unit of GDP-
This index refers to the ratio of the total carbon emissions of the whole society to the gross domestic product during the statistical period, which reflects the carbon emission efficiency in the process of social and economic development (Zhang et al., 2010). It can be calculated from Equation 22.
where
(11) Carbon emissions from electricity supply-
This index refers to the ratio of total carbon emissions generated by the power system in providing electricity to the total electricity consumption of the whole society during the statistical period (Wei et al., 2024). It can be calculated from Equation 23.
where
3.3 Flexibility indexes
(1) Flexibility modification ratio of conventional power sources-
where
(2) Peak shaving depth of conventional power sources-
This index refers to the ability of conventional thermal power units to reduce their output and operate at the lowest stable combustion load level due to the significant difference in peak and valley load of the power system. It reflects the active output regulation rate and regulation capacity of thermal power units in response to load changes. It can be calculated from Equation 25.
where
(3) Responsiveness of energy storage-
This index refers to the ratio of the total installed capacity of pumped storage, new energy storage, and other energy storage systems to the total installed capacity of power sources, which reflects the development level of energy storage resources in the system. It can be calculated from Equation 26.
where
(4) Responsiveness of demand side-
This index refers to the proportion of load that can be reduced by electricity users participating in demand response and generator capacity to the maximum load of the system, which reflects the support capacity of adjustable resources on the user side for the system. It can be calculated from Equation 27.
where
(5) Car network interaction index-
This index refers to the ratio of the capacity of charging facilities that can participate in V2G to the total capacity of charging facilities, which reflects the level of interaction and coordination control between the power system and electric vehicles. It can be calculated from Equation 28.
where
(6) Peak shaving capability of system-
This index refers to the ratio of the total peak shaving capacity of controllable power sources to the peak-valley difference of the system’s maximum load, which reflects the ability of the power supply structure to cope with severe load fluctuations. It can be calculated from Equation 29.
where
4 The method of comprehensive evaluation
To use the comprehensive index system proposed in this paper, it is necessary to further determine index evaluation standards, set index scoring standards, assign index weights, calculate and analyze evaluation results, and achieve comprehensive evaluation in specific application scenarios. The overall evaluation process is shown in Figure 1.

Figure 1. Evaluation process for constructing an index system for the urban system construction.
The specific steps are as follows:
Step 1: Building an applicable index system. Select indexes to form an applicable index system based on the specific situation and application scenarios of the city.
Step 2: Determine the range of index value. Determine a reasonable range of values based on the definitions and calculation methods of each index.
Step 3: Set scoring criteria for the index. Select a reasonable and universal scoring scale, such as a percentage-based scoring system, and divide the corresponding scoring ranges based on the index values.
Step 4: Assign weights to indexes. According to the degree of emphasis on each index for the specific application scenarios and the mutual constraints and relationships between indexes at the same level, the “1–9 scale method” is used to determine the relative importance scale value. Then, compare the importance of each index element at the same level with respect to the criteria of the previous level indexes pairwise and construct a judgment matrix according to Equations 30, 31. Finally, following Equations 32–37, the method of solving the eigenvector of the judgment matrix is used to calculate the relative weights of the compared index elements in the judgment matrix to the higher-level indexes. Normalization and consistency verification are also done in the process of solving these equations.
Judgment matrix:
where
Index weight assignment and normalization processing:
where
Step 5: Calculate the comprehensive evaluation score. Based on the scoring results and weight values of each index, calculate the combined total weight of each level index relative to the overall system goal according to Equation 38 and obtain the comprehensive evaluation result.
where
Step 6: Analyze and evaluate the results. Based on the comprehensive evaluation results, conduct a comprehensive comparative analysis of different schemes in terms of security efficiency, clean energy, and flexibility, and provide relevant suggestions for the urban system construction.
5 Verification of comprehensive evaluation for a new urban power system
5.1 Calculating boundaries
This paper takes the construction of an urban system in City Z as an example to verify the effectiveness of the proposed index system. City Z is a super-large, load-intensive city in the south of China. China’s development planning and power system planning are generally carried out on a 5-year time scale. The current stage is not far from 2025, and the most urgent task for the next stage of the power system is to achieve the carbon peak target by 2030. Therefore, this paper selects 2025 and 2030 as the two time nodes to apply the proposed index system for verification.
The relevant calculation and analysis are based on the characteristics, current development level, and reasonable planning data of the city’s power system, which reflects its development process and includes planned infrastructure development projects. As shown in Figure 2, City Z has identified the key construction targets for power source, power grid, power load, and energy storage during the periods based on the development level and resource endowment of its power system. The development trends and construction measures of each construction target are shown in Table 3. According to the relevant forecasts of City Z power grid planning and development, the power load, installed capacity of various power sources, and external power supply in 2025 and 2030 are shown in Table 4.
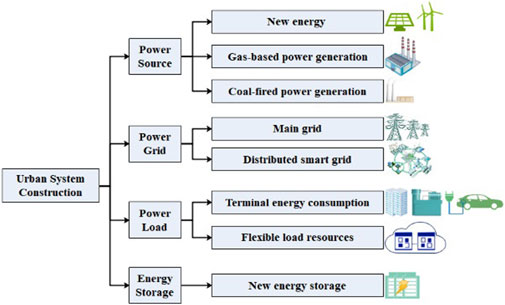
Figure 2. Key targets of urban system construction in City Z.
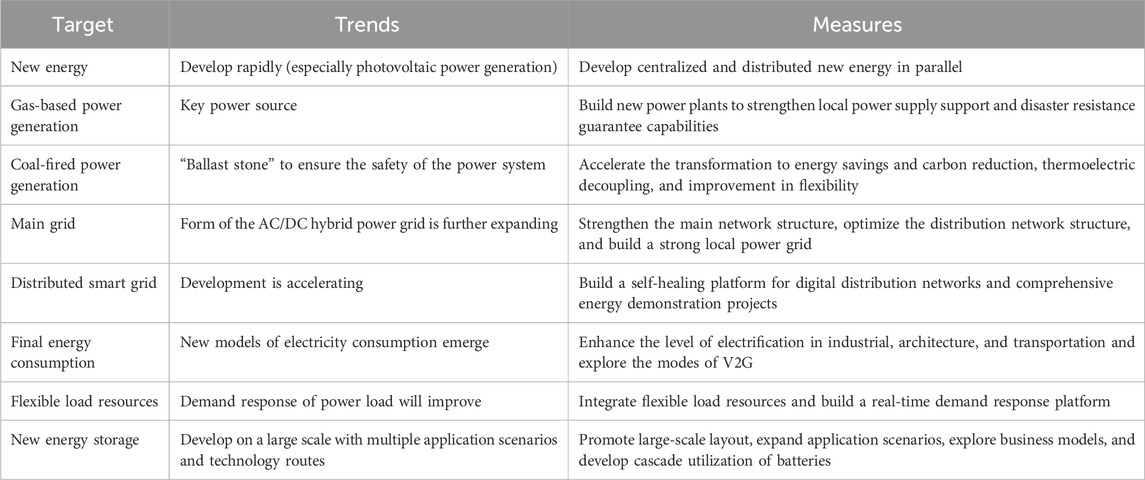
Table 3. Development trends and construction measures of construction targets in City Z.
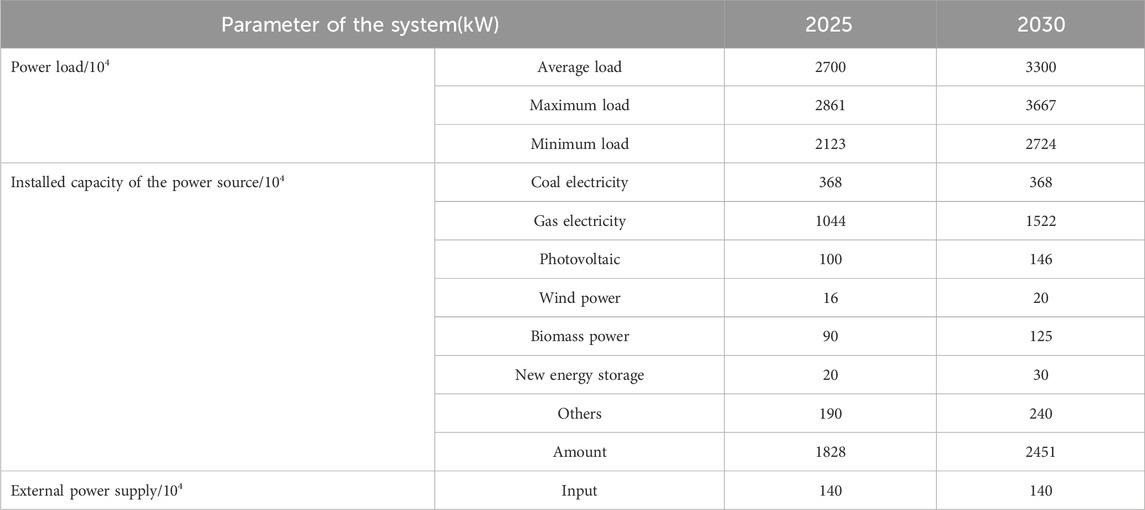
Table 4. Power load and installed capacity of system power sources in 2025 and 2030.
When calculating the balance between system supply and demand at the minimum load, the reserve capacity of the system is taken as 12% of the maximum load, the utilization capacity of coal-fired power units is taken as 92% of the installed capacity, gas power units is taken as 86%, small power sources connected to 110 kV are taken as 70%, and photovoltaic power sources connected to 10 kV are not outputted.
When calculating the peak shaving balance of the system at the minimum load level, the
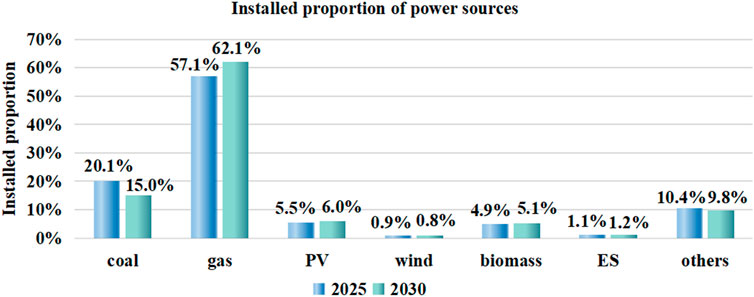
Figure 3. Installed proportion of power sources in 2025 and 2030.
5.2 Comparative analysis of construction effectiveness between 2025 and 2030
According to the calculation boundaries of the City Z power system, quantitative calculations of the relevant evaluation indexes are used to compare and analyze the effectiveness of urban new system construction in 2025 and 2030. Based on the proposed evaluation index system, a correlation matrix is established, and weights are normalized to obtain the weights, value ranges, and score settings for each index, as shown in Table 5.
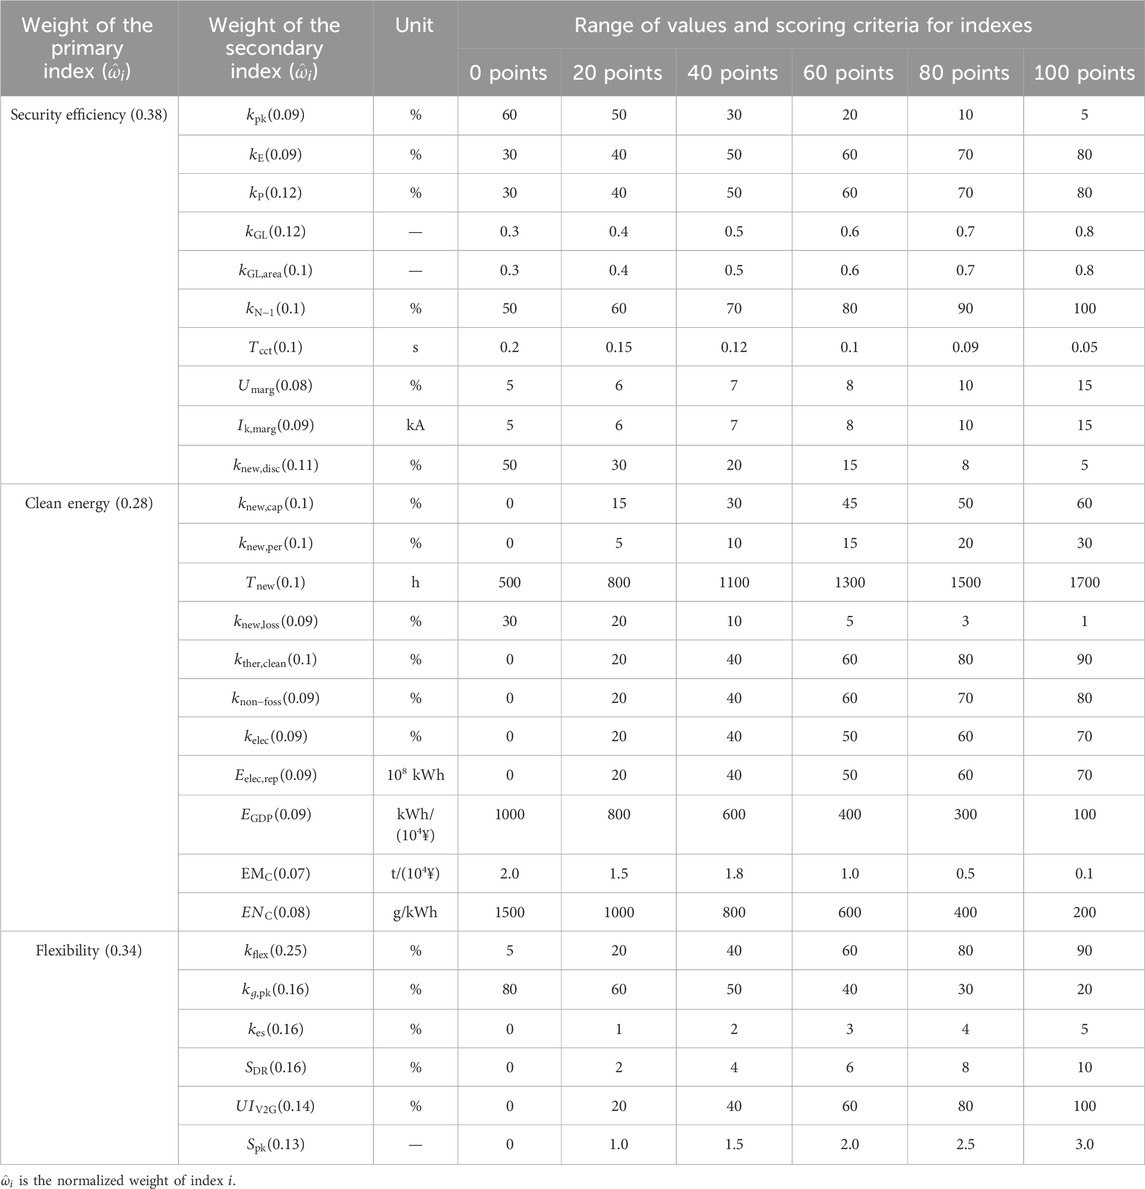
Table 5. Weights, value ranges, and score settings of the comprehensive index.
The relevant departments of City Z have set the target values of the relevant indexes to meet the phased goals of urban system construction and peaking carbon emissions during the two stages. According to the calculation boundaries given in Section 5.1, the forecasted index values can be calculated by applying the proposed index system. The forecasted value and the target value of each index are compared, and if the forecasted value does not meet the target value, the index is not up to standard. On the one hand, according to the field of the substandard index, the relevant links affecting the result can be analyzed, and targeted measures, such as strengthening infrastructure construction and adjusting resource investments, can be taken to improve the substandard index until it reaches the target value. On the other hand, planners can reassess whether the target value is reasonable; if it is not reasonable, the goals need to be reset to better fit the city’s development.
The comprehensive index of the city’s performance in building a new power system in 2025 and 2030 is calculated and shown in Table 6. The results in Table 6 show that the comprehensive evaluation results of system construction effectiveness in 2030 are significantly higher than those in 2025 overall. Specific analyses of various aspects follow.
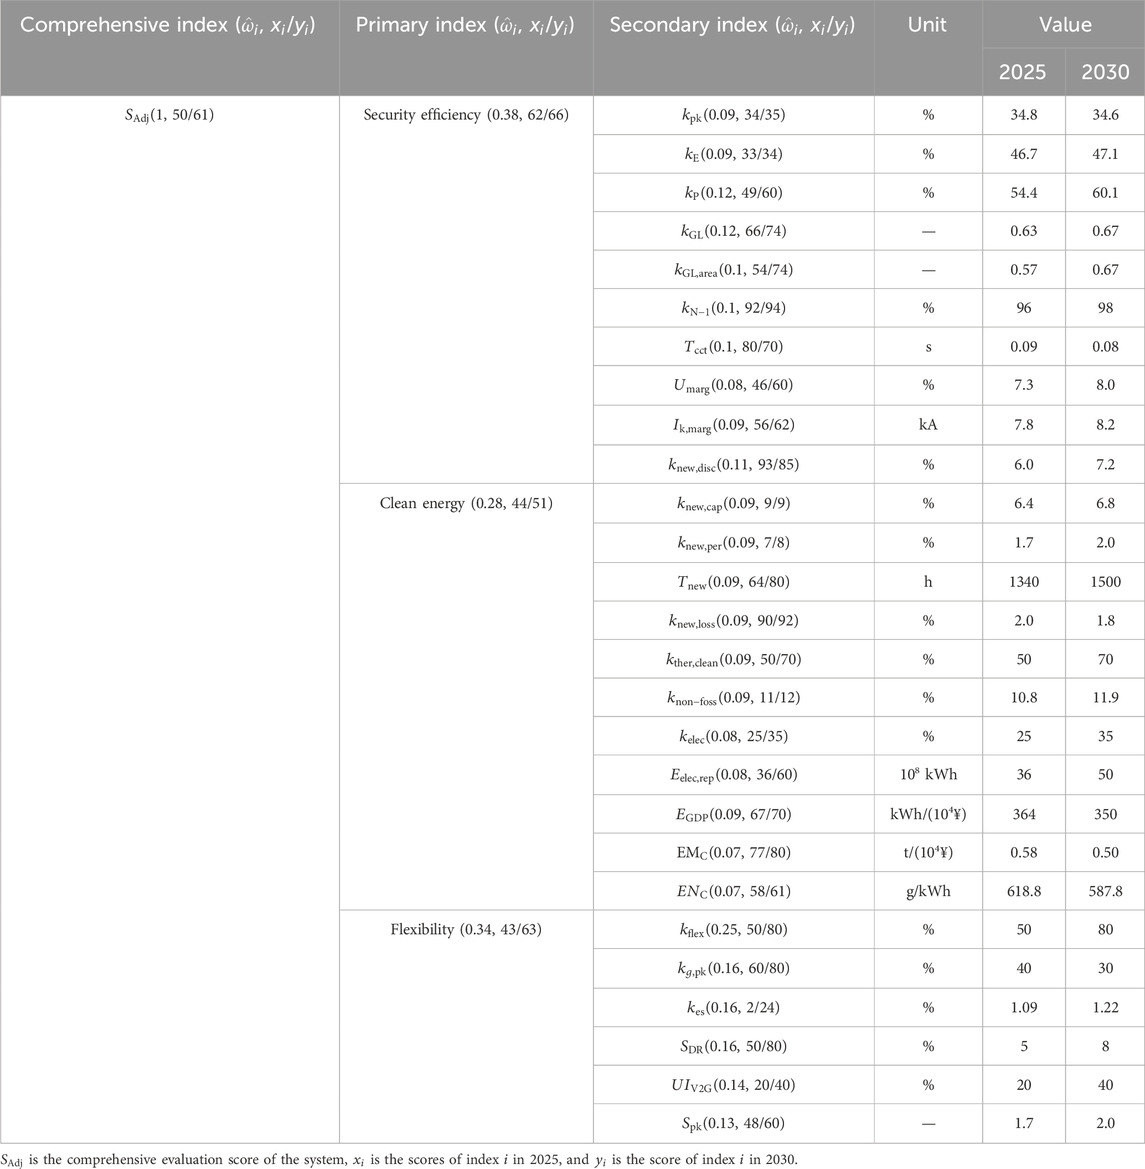
Table 6. Comparison of comprehensive indexes for system construction in 2025 and 2030.
5.2.1 Comparison of security efficiency
When optimizing the energy structure, the system takes measures such as controlling coal and reducing oil, increasing non-fossil energy in gas plants, and importing clean electricity to meet the demand for load growth, especially accelerating the construction of new gas power plants. As shown in Figure 3, during the periods, the scale of gas-based power increased significantly, with the installed proportion expected to increase to about 57.1% in 2025 and further increase to about 62.1% in 2030. Implementation of the above measures and relevant conclusions on security efficiency can be obtained from Table 6.
The
Although there is not much difference in the overall
In addition, the system enhances the stable operation level through measures such as strengthening the main grid structure and improving the distribution grid structure on the grid side. The
However, due to the gradual increase in the
5.2.2 Comparison of clean energy
On the power source side, City Z fully utilizes the rich solar energy resources in the region, accelerates the parallel construction of centralized photovoltaic systems using “fishery and light complementarity” and other distributed new energy projects, and carries out transformation around the existing coal-fired units. As shown in Figure 4, compared to 2025, the relevant indexes in 2030 that characterize the level of new energy development and utilization efficiency (such as the growth rate of
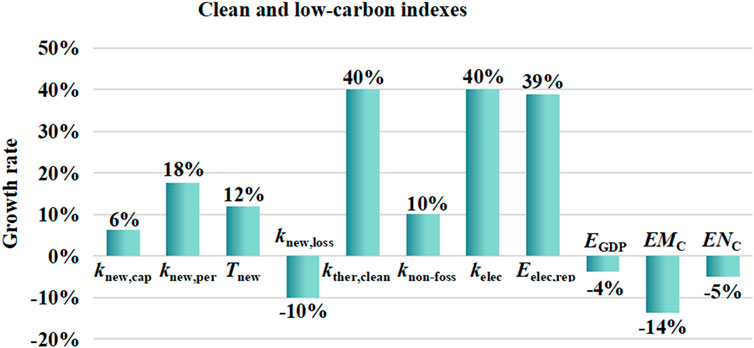
Figure 4. Growth rate of clean and low-carbon indexes in 2030 compared to 2025.
On the power load side, City Z vigorously promotes the level of electrification in industry, architecture, and transportation fields. The construction results can be shown in Figure 4; compared to 2025, we can see that the growth rates of
Similarly, as the process progresses, the energy consumption and carbon emission-related indexes, such as
Overall, the evaluation results of clean low carbon in 2030 are higher than those in 2025. However, the score in 2030 is still low (51 points); further urban system construction work is needed.
5.2.3 Comparison of flexibility
The city has taken measures such as accelerating the flexibility transformation of existing conventional thermal power, constructing diversified intelligent, interconnected comprehensive energy systems, rationalizing the layout of multiple types of large-scale new energy storage, and establishing real-time demand response platforms to comprehensively enhance the flexibility and adjustment ability of the system.
With the advancement of the construction process, as shown in Figure 5, compared to 2025, the indexes such as
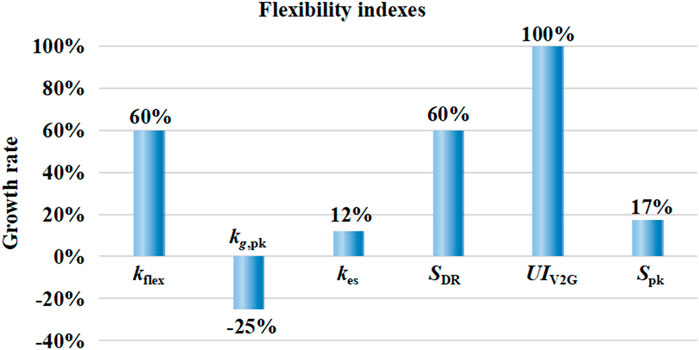
Figure 5. Growth rate of flexibility indexes in 2030 compared to 2025.
5.3 Analysis of the sensitivity of weight
The method of comprehensive evaluation in Section 4 shows that the evaluation results are not only affected by the planning and operation of the system but also by the index weight. Therefore, in order to study the sensitivity effect of weight, the paper considers that different experts may focus on different degrees of correlation between indexes, resulting in different index weights.
Three experts, A1, A2, and A3, were asked to participate in the evaluation of the system construction for City Z in 2025. As shown in Table 7, the index weight is obtained according to the index correlation matrix set by these experts. A1 offers a balanced weight, A2 is more concerned about security efficiency, and A3 is concerned about clean energy.
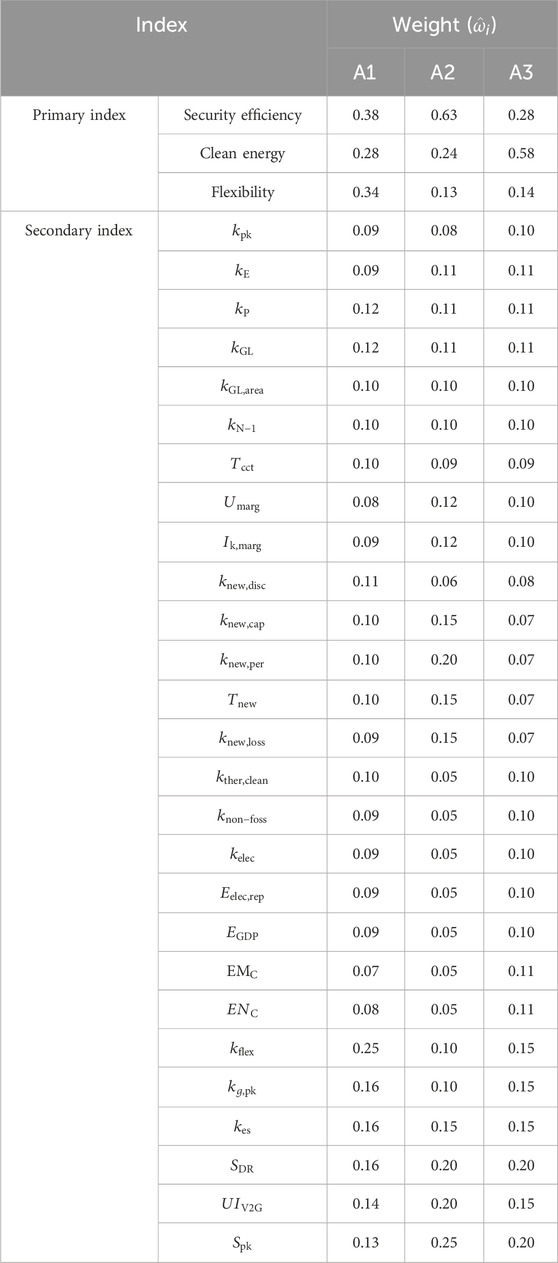
Table 7. Weight of the primary index by A1, A2, and A3.
The evaluation results considering expert weights are shown in Figure 6. Because the planning and operation of the system are certain, the value and score of the secondary index remain unchanged, so the score of the primary index mainly depends on the secondary index weight. In this case, although the three experts have different emphases on the weight of secondary indicators, due to the large number of indicators, the difference is reduced to a certain extent by normalization, reducing the variation in the primary indicator scores.
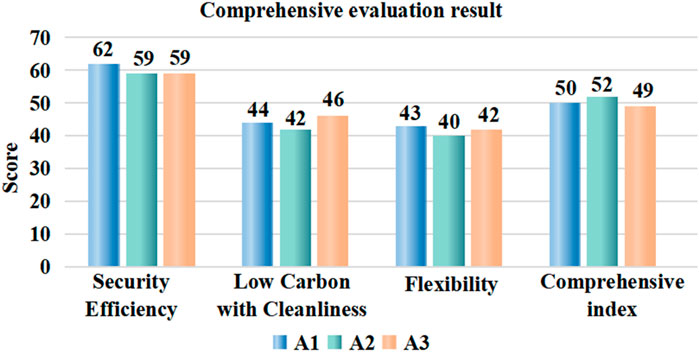
Figure 6. Comprehensive evaluation results for system construction in 2025 by experts A1, A2, and A3.
Comparing the comprehensive index in Figure 6, A1 sets relatively balanced weights for the primary index, and the comprehensive index score is 50 points. A2 gives the highest score (52 points), mainly because the expert gave the highest weight to the security efficiency, which effectively improves the overall evaluation results of the system. A3 gives the lowest score (49 points) because this expert pays more attention to clean energy. However, the system construction of City Z in 2025 has the lowest score in the aspect, which further reduces the overall evaluation result of the system.
6 Conclusion
This paper combines the overall requirements and the characteristics of low-carbon development of power systems in load-intensive cities. First, the development trends and goals of the system are understood. Second, a comprehensive index system and evaluation method suitable for urban system construction are proposed. Finally, the effectiveness of the proposed index system is verified using the actual urban power system of City Z as an example, and relevant conclusions are drawn as follows.
The construction of an index system should not only meet the constraints of national and regional macro goals but also combine with the actual development of the city, determine development goals according to local conditions, and expand the expected index to evaluate its own development. The index system can be continuously optimized at different stages of urban system construction based on changes in construction progress, work priorities, and social development level.
To ensure the balance between power supply and demand and stable operation of the system, it is necessary to take measures such as strengthening the construction of local power sources, strengthening the network structure, and optimizing the performance of new energy-related networks to improve the relevant indexes of security efficiency. Variables such as
To ensure the goals for energy upgrading and energy conservation are met, it is necessary to reduce system energy consumption and carbon emission-related indexes, such as
To meet the increasing flexibility requirements of the system, measures such as conventional thermal power flexibility transformation, comprehensive energy system construction, large-scale development of new energy storage, and demand response platform construction can be taken to fully tap into the flexible resources of various links within the system. Ultimately, the optimization of relevant evaluation indexes of flexibility (such as
As China is currently in the early stages of new power system construction, a small number of cities with high levels of economic development, intensive load and high dependence on external energy supply have been selected as demonstration projects. This paper selects the representative City Z for verification. In the future, with the construction and promotion of new urban power systems, further verification of different types of cities is needed, which includes unique characteristics, development foundations, resource endowments, major issues, and challenges. Furthermore, the proposed index system must be continuously optimized and adjusted to improve its applicability.
The proposed index system covers a wide range of indexes to adapt to the evaluation of urban system construction in most cities. In practical application, according to the specific conditions of urban development in different stages and the characteristics of different cities, appropriate screening or additional indexes can improve the accuracy of the evaluation. In addition, with the continuous development of technology, the evaluation can be combined with the actual power planning and operation system through big data, AI, and other technologies that can achieve real-time evaluation, and relevant suggestions can be given for the optimization and adjustment of each link (power source, power grid, power load, energy storage) to support the early completion of system construction.
Data availability statement
The original contributions presented in the study are included in the article/supplementary material; further inquiries can be directed to the corresponding author.
Author contributions
YL: conceptualization and writing–review and editing. HD: conceptualization, methodology, and writing–review and editing. YuG: data curation and writing–review and editing. LH: formal analysis and writing–review and editing. YaG: writing–original draft. ZL: software and writing–review and editing. FZ: validation and writing–review and editing. YX: methodology, writing–original draft, and writing–review and editing.
Funding
The author(s) declare that financial support was received for the research, authorship, and/or publication of this article. This research was funded by Guangzhou Power Supply Bureau, Guangdong Power Grid Co., Ltd, GDKJXM20222293(030100KK52222015).
Conflict of interest
Authors YL, HD, YuG, LH, YaG, ZL, and FZ were employed by Guangdong Power Grid Co., Ltd.
The remaining author declares that the research was conducted in the absence of any commercial or financial relationships that could be construed as a potential conflict of interest.
The authors declare that this study received funding from Guangzhou Power Supply Bureau, Guangdong Power Grid Co., Ltd,. The funder had the following involvement in the study: data collection and decision to publish.
Publisher’s note
All claims expressed in this article are solely those of the authors and do not necessarily represent those of their affiliated organizations, or those of the publisher, the editors, and the reviewers. Any product that may be evaluated in this article, or claim that may be made by its manufacturer, is not guaranteed or endorsed by the publisher.
References
Grid Operation and Control (China) (2019). Code on security and stability for power system (GB 38755-2019).
Guo, C., Liu, Z., Feng, B., Jiang, B., Guo, J., and Li, F. (2022). Research status and prospect of new-type power system risk assessment. High. Volt. Eng. 48 (9), 3394–3404. doi:10.13336/j.1003-6520.hve.20221101
Hou, J., Sun, W., Xiao, J., Jin, C., Du, E., Huang, J., et al. (2022). Collaborative optimization of key technology progress and low-carbon transition of power systems. Automation Electr. Power Syst. 46 (13), 1–9.
Huang, Z., Song, X., Liu, S., Han, L., Huang, F., Peng, Z., et al. (2016). Study on the evaluation index system and the key indexes of grid intelligence development. Distribution and Util. 33 (2), 42–47. doi:10.19421/j.cnki.1006-6357.2016.02.0083
IPCC (2014). Fifth assessment report climate change: mitigation of the climate change. London: Cambridge University Press.
Li, J., Li, R., Xun, C., Wu, X., Jiang, X., Tang, Z., et al. (2023). Research on the new power system index system. J. Electr. Eng., 1–11. Available at: http://kns.cnk0.jingshi2015.com/kcms/detail/10.1289.TM.20231012.1633.014.html.
Li, P., Huang, H., and Wu, X. (2014). Comparison of security and stability standards of transmission network in China and EU and USA. Automation Electr. Power Syst. 38 (1), 127–133.
Li, Q., Dai, H., and Wang, X. (2011). Study on assessment indexes system of coordinated development between new energy and smart grid. Energy China 33 (5), 25–28.
Liu, J., Liu, X., Lu, X., Zhang, D., Xu, Y., Xing, Y., et al. (2023). Coordinated planning layout method for system-level new energy storage of complex AC/DC power grids. High. Volt. Technol. 49 (07), 2711–2724. doi:10.13336/j.1003-6520.hve.20230246
Liu, W., Chen, J., and Liu, D. (2014). Comparative study on key indexes of power grid between Guangzhou and international advanced cities. East China Electr. Power 42 (07), 1341–1345.
Liu, Y. (2022). Evaluation methodology of key technologies in modern power grid construction. Popular Util. Electr. 37 (8), 41–42.
Li, Y., and Chen, Z. (2019). Study on regional electric energy substitution potential evaluation based on TOPSIS method of optimized connection degree. Power Syst. Technol. 43 (2), 687–693. doi:10.13335/j.1000-3673.pst.2018.0695
National Energy Administration (China) (2014). Terminology of energy saving for energy for electric power (DL/T 1365-2014).
Qi, S. (2019). Comprehensive evaluation of distribution network under low-carbon economy. Beijing: North China Electric Power University. (in Chinese).
Shang, J. (2009). Theoretical system and technical supporting system for energy-saving and emission-reducing of electric power system. Automation Electr. Power Syst. 33 (6), 31–35.
Sun, W., Liu, S., Wang, Y., and He, Y. (2022). Research on the relationship between provincial economy and CO2 emissions from the power industry in China: from static and dynamic aspects. Int. J. Glob. Warming (IJGW) 26, 141–161. doi:10.1504/IJGW.2022.120839
Sun, Y., Kang, C., Chen, S., Meng, J., Lu, C., and Luo, J. (2014). Low-carbon power grid index system and evaluation method. Automation Electr. Power Syst. 38 (17), 157–162.
Thango, B. A., Sikhosana, L. S., Nnachi, A. F., and Jordaan, J. A. (2021). Loss financial evaluation and total ownership cost of transformers in large-scale solar plants. 2021. IEEE PES/IAS Power Afr. Nairobi, Kenya, 1–5. doi:10.1109/PowerAfrica52236.2021.9543139
Verma, H., Tripathi, P., and Naqvi, A. M. (2021). “A comprehensive review on impacts of electric vehicle charging on the distribution network,” in 2021 international conference on control, automation, power and signal processing (CAPS). Jabalpur, India, 1–6. doi:10.1109/CAPS52117.2021.9730630
Wang, X., Meng, J., and Shi, F. (2022). An optimization model and comprehensive evaluation system for the synergistic evolution of coal-fired power plants and clean power sources. Power Syst. Prot. Control 50 (13), 43–52. doi:10.19783/j.cnki.pspc.226209
Wei, J., Tang, Z., and Wu, D. (2023b). “Research on technical path and strategy of spatial utilization of municipal infrastructure in high-ensity built-up areas,” in Annual national planning conference. Wuhan, China, 87–96. doi:10.26914/c.cnkihy.2023.042507
Wei, X., Liu, D., Gao, F., Liu, L., Wu, Y., and Ye, S. (2023a). Generation planning of a new power system considering the synergistic optimization operation of source and network load and storage under dual carbon objective. Power Grid Technol. 47 (09), 3648–3661. doi:10.13335/j.1000-3673.pst.2022.1966
Wei, X., Tan, X., Ruan, J., Lin, M., Qin, L., Sun, G., et al. (2024). Research on carbon emission factors of regional and provincial power grids from 2005 to 2021. Clim. Change Res., 1–17. doi:10.12006/j.issn.1673-1719.2023.276
Zeng, M., Lu, C., Tian, K., and Dong, J. (2011). Smart grid and support mechanisms for low-carbon power system. Automation Electr. Power Syst. 35 (23), 6–10.
Zhang, D., Kang, C., Lu, X., Liu, X., Zhang, N., and Xu, Y. (2022). High proportion of new energy systems in energy storage configuration scale argumentation. J. South. Power Grid Technol. 16 (04), 3–11. doi:10.13648/j.cnki.issn1674-0629.2022.04.001
Zhang, W., Liao, J., and Liao, R. (2010). Discussions on the concept of carbon emissions per unit of GDP. J. Hunan Univ. Soc. Sci. 24 (05), 74–76.
Zhang, X., Song, Y., and Huang, W. (2019). Evaluation of electric power replacement considering spatiotem-poral characteristics of power source structure. Electr. Power 52 (3), 61–67.
Zhang, Z., and Kang, C. (2022). Challenges and prospects for building new power systems under carbon neutrality. Proc. CSEE 42 (08), 2806–2819. doi:10.13334/J.0258-8013.PCSE.220467
Keywords: load-intensive city, comprehensive evaluation index system, security efficiency, clean energy, flexibility
Citation: Liang Y, Dong H, Gao Y, Hu L, Gao Y, Lin Z, Zeng F and Xu Y (2024) A comprehensive evaluation index system for low-carbon development of power systems in a load-intensive city. Front. Energy Res. 12:1453754. doi: 10.3389/fenrg.2024.1453754
Received: 24 June 2024; Accepted: 12 August 2024;
Published: 30 August 2024.
Edited by:
Zhong Ge, Yunnan University, ChinaCopyright © 2024 Liang, Dong, Gao, Hu, Gao, Lin, Zeng and Xu. This is an open-access article distributed under the terms of the Creative Commons Attribution License (CC BY). The use, distribution or reproduction in other forums is permitted, provided the original author(s) and the copyright owner(s) are credited and that the original publication in this journal is cited, in accordance with accepted academic practice. No use, distribution or reproduction is permitted which does not comply with these terms.
*Correspondence: Yunxia Xu, ODYyMzQ4MDM0QHFxLmNvbQ==