 Yusuf Muratoğlu
 Mehmet Songur
 Erginbay Uğurlu
 Devran Şanlı
- 1Department of Economics, Hitit University, Çorum, Türkiye
- 2Department of Economics, Dicle University, Diyarbakır, Türkiye
- 3Department of Economics and Finance, Istanbul Aydın University, Istanbul, Türkiye
- 4Bartın University, Faculty of Economics and Administrative Sciences, Department of Economics, Bartın, Türkiye
Since the contribution of economic sectors to GDP is heterogeneous, they also contribute differently to CO2 emissions and environmental degradation. In this regard, it is crucial to examine the Environmental Kuznets Curve (EKC) hypothesis at the sectoral level. Nevertheless, despite the extensive research conducted on the Environmental Kuznets Curve (EKC) hypothesis, significant gaps remain in the existing literature, particularly at the sectoral level. This study makes a novel contribution to the existing literature on the environmental EKC hypothesis by examining its validity across four distinct sectors: agriculture, industry, manufacturing, and services. Additionally, it makes a second contribution to the literature by examining the effect of energy consumption on CO2 asymmetrically, employing a novel panel non-linear ARDL (PNARDL) method. The study employs annual data from 38 OECD countries, spanning the period from 1990 to 2022. The findings demonstrate that the EKC hypothesis is valid for sectors other than the industrial sector and for the economy as a whole. The turning point of the Kuznets Curve for the total economy is estimated as $29250 GDP per capita. The PNARDL model’s error correction term (ect) is negative and significant. However, the magnitude of the term suggests that the system will return to long-term equilibrium after approximately 2.87 years following any shock. Asymmetric effects are valid for four sectors. Moreover, the empirical results clearly show that energy consumption has asymmetric effects on emissions in both the long and short run. Positive and negative shocks in energy consumption increase CO2 emissions in OECD economies in the long run. It has been determined that agriculture is the sector that causes the most environmental degradation by increasing CO2 emissions. This situation highlights the limited availability of productive capital equipment and renewable sources in the agricultural sector, even in OECD countries. As a result, the findings show that there is a different relationship between each sector’s GDP and CO2 emissions. It is important for policymakers to formulate sector-specific policies to reduce CO2 emissions while fostering GDP growth.
1 Introduction
The transformation of production processes that commenced with the Industrial Revolution has led to a rapid increase in energy consumption. The surge in energy production and consumption, particularly post-1980, has exerted significant pressure on the ecological balance (Song et al., 2021). Consequently, societies have prioritized addressing various environmental issues, such as climate change and global warming (Mujtaba et al., 2020; Ozcan et al., 2019). Primary energy sources are recognized as major contributors to global warming and environmental pollution (Gyamfi et al., 2021; Usman et al., 2022; Zhang et al., 2023). Global energy-related CO2 emissions grew by 0.9% or 321 Mt in 2022, reaching a new high of over 36.8 Gt (IEA, 2022 If no action is taken to address this situation, the likelihood of global temperatures rising by 4°C is 75%, and the likelihood of a rise by 8°C is 21% (Waldhoff and Fawcett, 2011). Therefore, high primary energy use causes environmental pollution and environmental degradation.
Energy use is directly linked to economic growth. Therefore, energy consumption is one of the most important responsible for environmental quality (Sinha et al., 2017). The pioneer of studies examining environmental pollution and economic growth are the studies of Grossman and Krueger (1991). They concluded that at lower national income levels, carbon dioxide emissions increase with GDP per capita, but at higher income levels, environmental pollution decreases. Other studies (Panayotou, 1993; Cole et al., 1997) also confirmed the inverted “U” curve between economic income and environmental degradation. In this context, based on the Kuznets Curve proposed by Kuznets (1955), the relationship between environment and income was accepted as the Environmental Kuznets Curve (EKC) in the literature. According to EKC, there is an inverted U-shaped correlation between environmental quality and income. Based on this, the relationship between carbon emissions and income under the EKC hypothesis has been the subject of many studies in the last 30 years (Selden and Song, 1994; Cole et al., 1997; Lean and Smyth, 2010; Van Hoa and Limskul, 2013; Kais and Sami, 2016; Balsalobre-Lorente et al., 2018; Nabavi-Pelesaraei et al., 2018; Kaab et al., 2019; Nabavi-Pelesaraei et al., 2019; Zafar et al., 2019; Cheikh et al., 2021; Wang et al., 2023; Sanli et al., 2023). These studies generally provide evidence of an inverted U-shaped relationship. Additionally, numerous studies in the literature provide evidence supporting the validity of the EKC hypothesis in different samples and with different environmental pollution indicators (Yilanci et al., 2022).
Although the relationship between environmental pollution and economic growth has been extensively studied by academics, it remains one of the most challenging issues for the global community. The validity of the EKC hypothesis has generally been examined in the literature for the entire economy. However, recent literature indicates that the economic structure plays a crucial role in assessing the validity of the EKC hypothesis. Neglecting this aspect may lead to misleading conclusions regarding the validity of the EKC hypothesis (Taşdemir, 2022). The relationship between carbon dioxide emissions and income may differ across economic sectors. Each sector’s energy requirements within an economy can differ based on the availability of energy resources, technological development, economies of scale, and government-implemented policies. For this reason, the fact that different sectors follow different paths in the production process may cause the relationship between carbon dioxide emissions and income to differ (Htike et al., 2021).
Limited attention has been paid in the literature to the validity of the EKC hypothesis on a sectoral basis. While the validity of the EKC hypothesis was examined from a sectoral perspective in the literature, the asymmetric effects of the variables were ignored. Therefore, this study examines the validity of the EKC hypothesis at the sectoral level for OECD countries using non-linear analysis techniques. OECD countries have a significant share in the world economy. The world’s total GDP in 2022 was 89.9 trillion dollars. OECD countries account for approximately 60% of this GDP value ($53.7 trillion) (WDI, 2023). Based on our literature review, there is only one article (Fujii and Managi, 2013) in the literature that investigates the EKC by sectors for 23 OECD countries, the first important gap in the literature is not to have research which considers all 38 member countries of OECD. The second gap is that the most recent study for a group of countries that are important economic powers such as OECD countries used 2005 data and no study has been conducted with current data. In our paper we use data from 38 OECD countries and the period is 1990–2022. In addition, our most important contribution to the relevant literature is to investigate the validity of the EKC hypothesis by taking into account the asymmetric effects with nonlinear analysis techniques.
The aim of this study is to examine the validity of the EKC hypothesis at the sectoral level for OECD countries. While numerous studies in the literature have explored the EKC hypothesis, there are still gaps, particularly at the sectoral level. The most important contribution of this study to the literature is the examination of the EKC hypothesis at the sectoral level with non-linear analysis techniques.
Compared to the number of papers investigating the EKC hypothesis in the context of the general economy, sector-based EKC papers are fewer and more recent. It can be seen from Table 1; the studies have been constricted to a limited number of sectors generally and country groups. In our literature review, we found only one article on OECD countries and none of the studies are on the OECD covering the last two decades. In our literature review, we found only one article on OECD countries and no study on the OECD covering the last 2 decades. In terms of the sector analyzed, while some articles focus on one sector, there are studies focusing on a few selected sectors or many more sectors. When the literature is examined, it is seen that there is no article using non-linear modeling and this is a gap in the literature. This study focuses on OECD countries, which have rarely been addressed in papers testing the EKC hypothesis at the sectoral level, and also models the relationship with a non-linear method that has not been used before in studies conducted in this context. We present a unique methodology to test the EKC hypothesis in OECD by showing their asymmetric movements. In this study, we not only show the asymmetric relationship, but also the long-run relationship and causality between the variables, but we emphasize the asymmetric relationship because it has not been addressed before.

Table 1. A brief literature.
In this context, the validity of the EKC hypothesis was investigated for the entire economy as well as for the agriculture, industry, manufacturing, and services sectors. In addition to the fact that the study is at a sectoral level, bringing together 38 OECD countries at the same time constitutes an important contribution of this study. On the other hand, the validity of the EKC hypothesis may be affected by the chosen econometric models and methods (Dinda, 2004; Stern, 2004; Pablo-Romero et al., 2017). For this reason, the study also examined the asymmetric relationships between energy consumption and carbon dioxide emissions within the framework of the model established. Unlike other studies in the literature, the Nonlinear Panel Autoregressive Distributed Lag (PNARDL) method was employed in this study, marking another noteworthy contribution to the literature.
The remainder of this study is organized as follows. The relevant literature review is presented in Section 2. Section 3 describes the econometric methodology used in the study. Section 4 provides information about the dataset used in the study. In Section 5, the study’s findings are presented. Section 6 concludes the article by discussing the findings.
2 Literature review
There literature about environmental Kuznets curve (EKC) hypothesis is very wide. The hypothesis of EKC claims that the relationship between economic growth and environmental pollution shows an inverted U-shaped relationship (Grossman and Krueger, 1991). Grossman and Krueger (1991) is a pioneering study of EKC hypothesis, many research followed this study and find different results such as U-shaped (Aslam et al., 2021; Brown et al., 2020; Isik et al., 2020; Pata, 2021), N-shaped (Bekun et al., 2021; Friedl and Getzner, 2003; Lorente and Álvarez-Herranz, 2016; Vincent, 1997) and inverted N-shaped (Esmaeilpour Moghadam and Dehbashi, 2018; Shao et al., 2011). Naveed et al. (2022) reveal the high number of studies that have been carried out on this subject by using 1,654 articles (1992–2022 period) on EKC from Scopus-Indexed journals in their literature review and content analysis. The authors state that thousands of academic papers aimed to test the likelihood of such an inverted U-shaped relationship since the 1990s. Their literature review shows that based on the total citations count of the papers the main papers about EKC are Arouri et al. (2012); Dinda (2004); Jalil and Feridun (2011); Kasman and Duman (2015); Sarkodie and Strezov (2019); Selden and Song (1994); Soytas et al. (2007); Stern (2004); Torras and Boyce (1998). The last information we use from the paper is that 62% of the studies reported the shape of EKC, 14% of the studies reported the U-shape, and the rest of the papers of the studies were reported other shapes.
In the literature the studies investigated EKC for the country, group of countries, region, or sector. In this paper we investigate the EKC in sector level and we found several studies in sector level. The papers which investigate sectors are Ben Abdallah et al. (2013); Hamit-Haggar (2012); Ma et al. (2019); Ren et al. (2014); Xu and Lin (2015, 2016) for country level and Ahmad et al. (2019); Fujii and Managi (2013, 2016); Pata (2018); Xu and Lin (2016, 2017) for group of country level. We summarized these papers in Table 1.
Pata et al. (2023) select for the four transport modes in the 13 EU countries which are Belgium, Denmark, Finland, France, Germany, Ireland, Italy, Netherlands, Norway, Portugal, Spain, Sweden and United Kingdom; and findings show that the EKC is valid for at least one transport mode in 10 of the 13 EU countries. Ahmad et al. (2019) uses gross regional product, urban population, added value of construction, energy consumption and population in their study then estimate several models by using AMG and DCCEMG models. The results show that long-run equilibrium relationship is confirmed among energy consumption, gross regional product and growth in the construction sector continues to be one of the key drivers of energy use and CO2 emissions.
Our literature review reveals that the only study on OECD countries is Fujii and Managi (2013). This study analyses sectors such as chemicals, construction, food and tobacco, manufacturing, machinery and construction, non-metallic minerals, paper, pulp and printing, steel and metal, transport equipment, wood and wood products between 1970 and 2005. 23 countries are used in the research. The results show that overall CO2 emissions show an N-shaped relationship and the EKC hypothesis for sector-level CO2 emissions was supported in wood and wood products, paper, pulp, and printing, and construction industries. Fujii and Managi, (2016) analyze eight environmental air pollutants carbon dioxide (CO2), methane (CH4), nitrous oxide (N2O), nitrogen oxide (NOx), sulfur oxide (SOx), carbon monoxide (CO), non-methane volatile organic compound (NMVOC), and ammonia (NH3), for whole country, 16 industries (industrial sector, mining and quarrying, food, beverages, and tobacco, textiles and textile products, leather, leather, and footwear, wood and products of wood and cork, pulp, paper, paper, printing, and publishing, coke, refined petroleum, and nuclear fuel, chemicals and chemical products, rubber and plastics, other non-metallic mineral, basic metals and fabricated metal, machinery, Nec, electrical and optical equipment, transport equipment, electricity, gas, and water supply, and construction) and find that CO2, N2O, and NMVOC emissions are observed to have EKC relationships on both the country level and the total industry level.
3 Econometric approach
The aim of this study is to examine the validity of the environmental EKC hypothesis for four different sectors (Agriculture, Industry, Manufacturing and Services) and to analyze the impact of energy consumption on CO2 asymmetrically. In accordance with this purpose, various steps were applied for econometric analysis.
Firstly, autocorrelation is analyzed using Wooldridge test for autocorrelation, heteroskedasticity is analyzed using Modified Wald test for groupwise heteroskedasticity and multicollinearity is analyzed using CD test for cross-section dependency.
Secondly, in line with the results obtained from the analysis, stationarity is tested with Pesaran (2007) CADF panel unit root test. Cointegration in the study was determined by Westerlund (2005) and Pedroni (1999, 2004) panel cointegration tests. The existence and direction of causal relationships in the panel are investigated with the JKS non-causality test (Juodis et al., 2021). Panel nonlinear ARDL was applied to examine the long-run parameters (Shin et al., 2014).
The empirical model explaining the EKC hypothesis for the OECD can be explained as follows in line with the purpose of the study and based on previous studies:
Where f is a functional representation, CO2, GDP, GDP2, EN, K, POP; t denote carbon dioxide emissions, gross domestic product, GDP squared, energy consumption, capital and population in the OECD at time t, respectively.
Based on the functional representation, we constructed the model in Equation 1 to explain CO2 emissions in OECD countries.
where β0 is the country fixed effect, CO2it is the logarithm of carbon dioxide emissions, GDPit is the logarithm of real gross domestic product, GDP2it is the logarithm of real gross domestic product squared, ENit is the logarithm of primary energy supply, Kit is logarithm of capital stock, POPit is the logarithm of population and μit is an independently and normally distributed error term.
The main objective of this study is to analyze the effects of sectoral GDPs and total GDP on CO2. However, it is important to analyze the positive and negative effects of energy consumption on CO2 with the help of a single model. In addition, an approach that can be used in non-stationary panels will be appropriate if the data of the variables to be used in the analysis contain unit roots. Panel ARDL method can be used in panels with non-stationary series. The linear panel ARDL approach was developed by Pesaran et al. (1996; 2001). According to the variables included in the analysis, we can represent the linear panel ARDL equation as in Equation 2.
Where Δ denotes the first difference, αi is the constant term, δsij (s = 1, 2, 3, 4, 5, 6) is the short-run coefficients, γki (k = 1, 2, 3, 4, 5, 6) is the long-run coefficients, εit is the error term. The optimal lag lengths of the first differenced variables (p1, p2, p3, p4, p5, p6) are determined according to the information criterion. Equation 3 represents Equation 2 with the error correction term added.
Where the linear error correction term is denoted by ecti,t-1. The parameter λi is equivalent to γ1i and represents the speed of error correction in the adjustment of the model to equilibrium for each unit.
Moreover, the non-linear panel ARDL method of Shin et al. (2014) based on the dynamic representation of heterogeneous panel data in the presence of asymmetry is also an appropriate approach to capture the short-run dynamics of variables and their adjustment to long-run equilibrium. However, the nonlinear panel ARDL approach is an asymmetric extension of the linear panel ARDL approach, and the nonlinear model is to detect short and long-run asymmetric movements with the help of an asymmetric error correction model.
The nonlinear panel ARDL approach allows for asymmetric responses of CO2 emissions to primary energy consumption and decomposes the exogenously fluctuating variable into two partial aggregates. The idea is that positive and negative shocks to primary energy consumption are expected to have different effects on CO2 emissions.
The nonlinear panel ARDL model constructed by adding short-run and long-run asymmetric relationships to the linear panel ARDL model in Equation 3 is shown in Equation 5.
The estimates from the coefficients
The asymmetric error correction term is denoted by ect′i,t, where
4 Data
The raw data used in the study were obtained from the World Bank’s World Development Indicators (WDI) and International Energy Agency (IEA) databases covering 38 OECD countries for the period 1990–2022 and processed by the authors. Information on the variables in the data set is presented in Table 2.
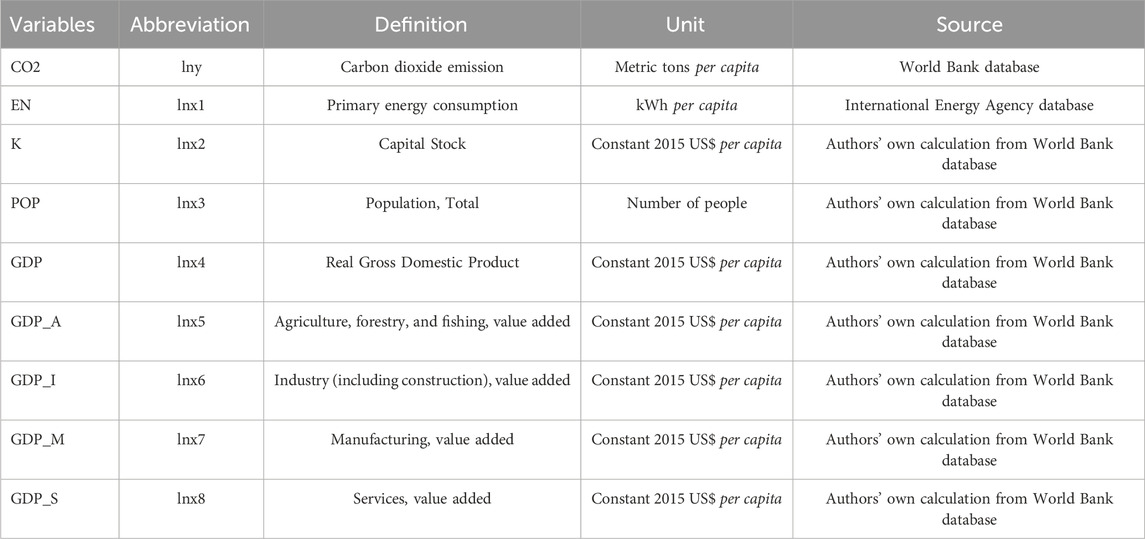
Table 2. Variable descriptions.
Capital stock data are computed from the investment series using the perpetual inventory method (PIM) following Nehru and Dhareshwar (1993) and Harberger (1978). In order to transform the data set from an unbalanced panel to a balanced panel, a small number of missing observations were estimated by the linear method.
Moreover, natural logarithm is used for all variables to obtain elasticities in a straightforward form and to mitigate heteroscedasticity. In order to minimize the scale effect of economies, all variables have been converted into per capita units.
5 Empirical findings
We initiate the analysis of the series compiled from the data of OECD countries by presenting descriptive statistics. Table 3 presents the descriptive statistics of the variables in the models.
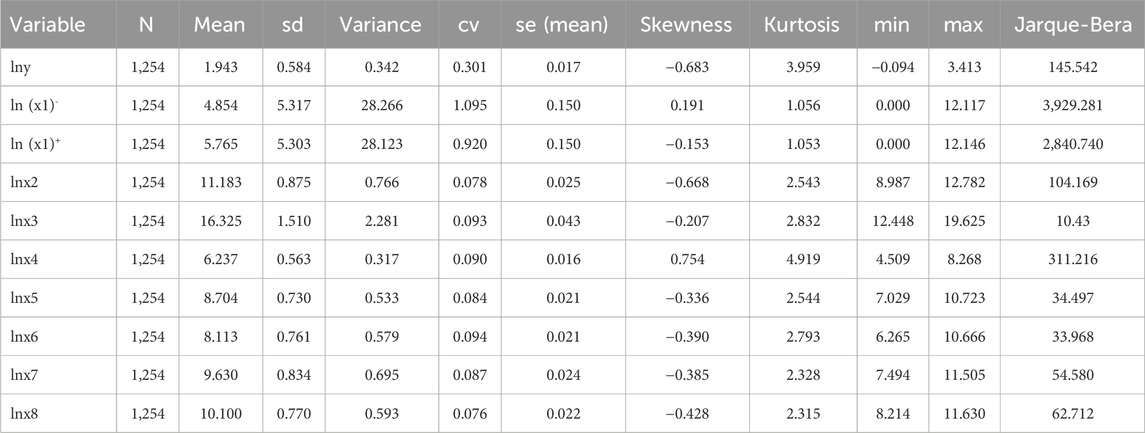
Table 3. Descriptive statistics of variables.
ln (x1)- and ln (x1)+ represent the negative and positive components of the energy consumption data obtained through Equation 4, respectively. Firstly, the high variance and standard deviation statistics of energy consumption series (lnx1-and lnx1+) in the table are remarkable. This indicates the existence of volatility and heterogeneity in terms of energy consumption in OECD economies. A very similar situation is also valid for the population (lnx3).
Table 4 shows the pairwise correlation matrix of the variables. As expected, CO2 emissions are positively correlated with the GDP per capita of the sectors. While the energy consumption increase series is negatively correlated with CO2, the energy consumption decrease series is positively correlated with CO2. In addition, CO2 emissions are positively correlated with the level of capital stock. However, there is no significant correlation between population and CO2.
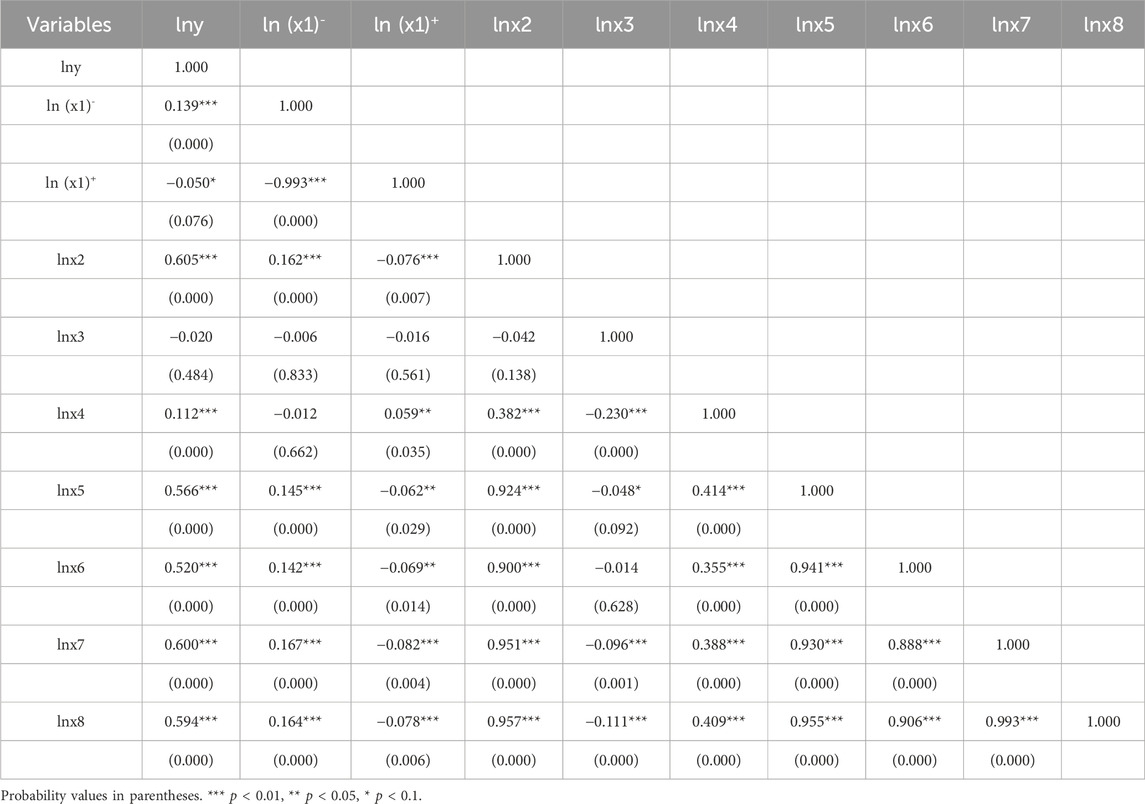
Table 4. Pairwise correlations.
Cross-sectional dependence in the series is examined using the parametric test procedure proposed by Pesaran (2004) under the null hypothesis of cross-sectional independence using both variables and residuals (see Table 5). The results show that, at the 1% significance level, the null hypothesis of cross-sectional independence is rejected for all series in the dataset.
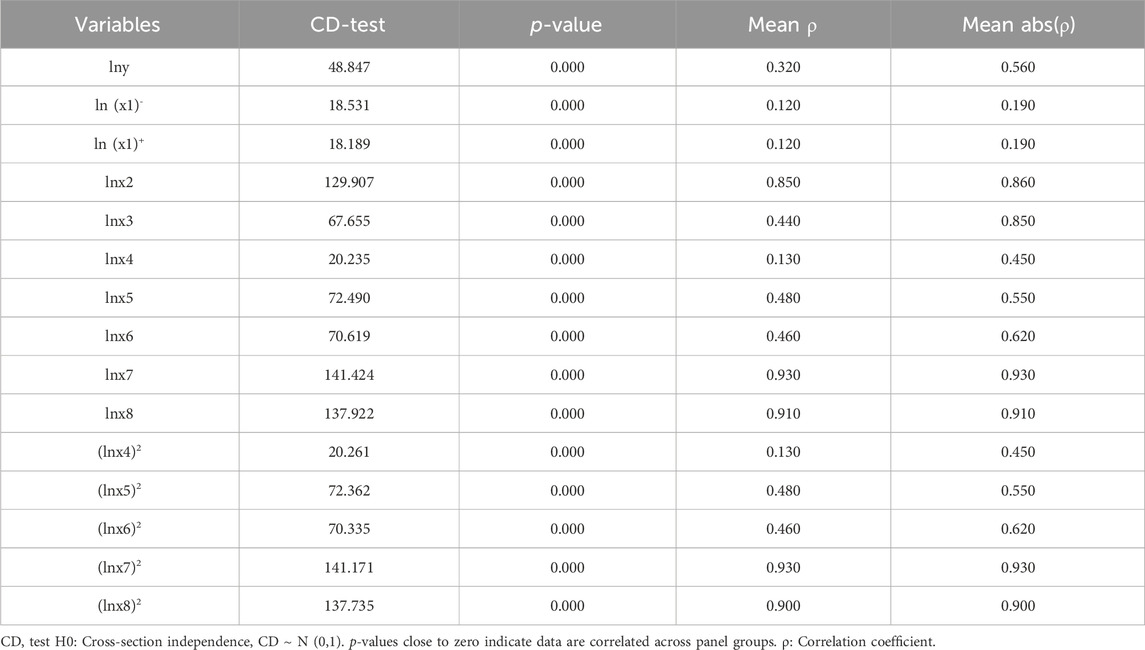
Table 5. Variables cross sectional dependency test results.
However, the findings regarding heteroskedasticity and autocorrelation in identifying residuals diagnostic are given in Table 6. The Wooldridge test for autocorrelation in the panel data shows that the null hypothesis of first-order autocorrelation is rejected with 1% statistical significance. Furthermore, the modified Wald statistic for testing groupwise heteroskedasticity indicates that the null hypothesis is rejected.
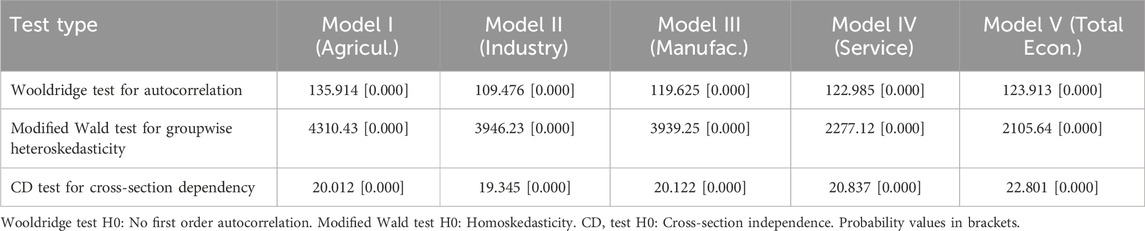
Table 6. Residual diagnostic.
Table 7 shows the level and first difference statistics of Pesaran (2007) CADF panel unit root test in the presence of cross-sectional dependence in the variables. The optimal lag length for the unit root test was determined using AIC. The findings of the CADF test with the constant and trend option show that all variables are I (1). Variables that are non-stationary in levels are stationary in their first differences.
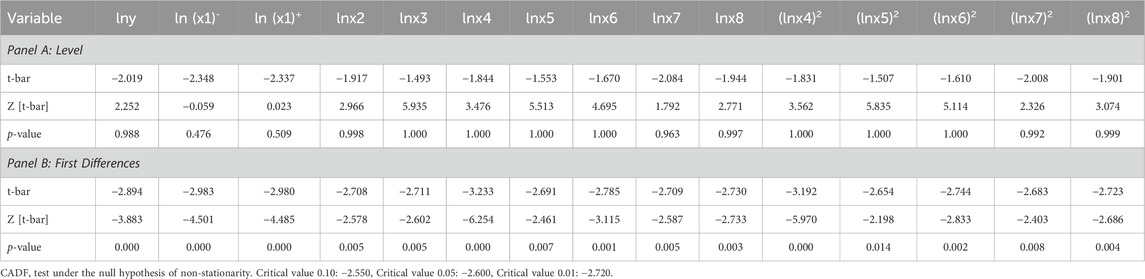
Table 7. CADF unit root test results.
Panel cointegration tests proposed by Westerlund (2005) and Pedroni (1999, 2004) have also been applied to test for the existence of a structural long-run relationship between variables. These tests are robust to cross-sectional dependence. The procedure of Levin et al. (2002) was followed for cross-sectional robustness of the statistics. Table 8 shows the computed values of cointegration tests. The statistics indicate that the null hypothesis of no cointegration should be rejected. In this case, cointegration relationship between the variables is valid and there are structural relationships between them in the long run.
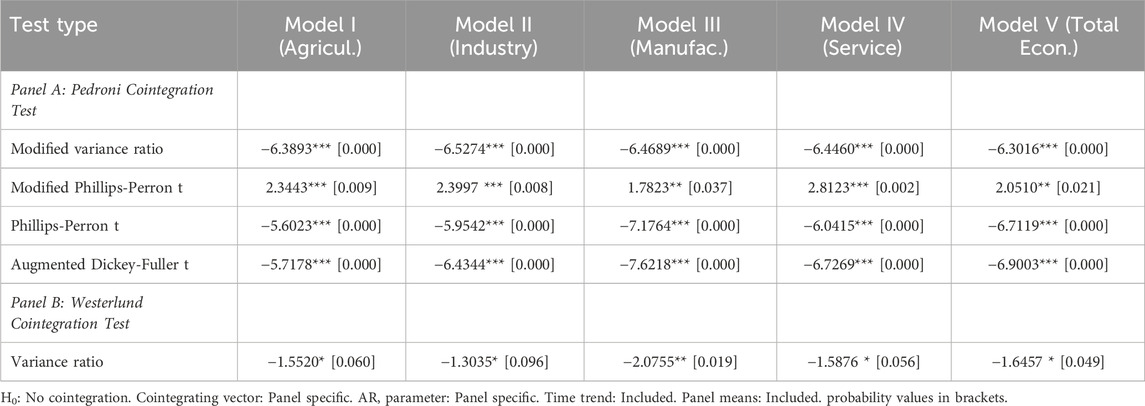
Table 8. Cointegration test.
The statistics presented in Table 9 show that the null hypothesis of the Juodis, Karavias, and Sarafidis (2021) JKS test should be rejected. Therefore, the explanatory variables in the models are the granger causes of carbon emissions. The JKS (2021) test provided evidence that the past values of the increase and decrease series of energy consumption, capital stock, population and GDP per capita are useful in forecasting CO2 in addition to the past values of CO2 alone.
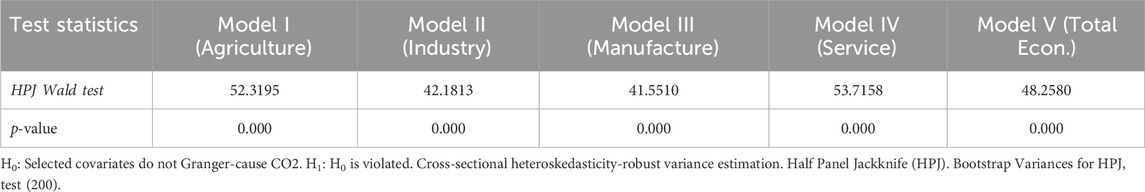
Table 9. JKS non-causality test.
The coefficient of the ECT is significant and negative, confirming the cointegration relationship between the variables. The ECT results of the models show that the system returns to long-run equilibrium in the range of 2.67 years (33 months) - 3.22 years (39 months) after a shock. However, there is strong evidence for the validity of the EKC hypothesis in other sectors excluding industry (see Table 10). Asymmetric effects of energy consumption are valid in the short and long run. The findings indicates that both an increase and decrease in per capita energy consumption lead to a rise in carbon emissions across all sectors and the economy as a whole, resulting in a decline in environmental quality (see Tables 10, 11). The impact of capital stock (lnk) and population (lnpop) on CO2 emissions is negative. The decrease in CO2 emissions due to an increase in capital stock is attributed to the efficient production structure of capital equipment. Similarly, the effect of population is believed to be linked to economies of scale. As the size of the country increases, cleaner and more efficient energy resources and capital-intensive production methods are employed.
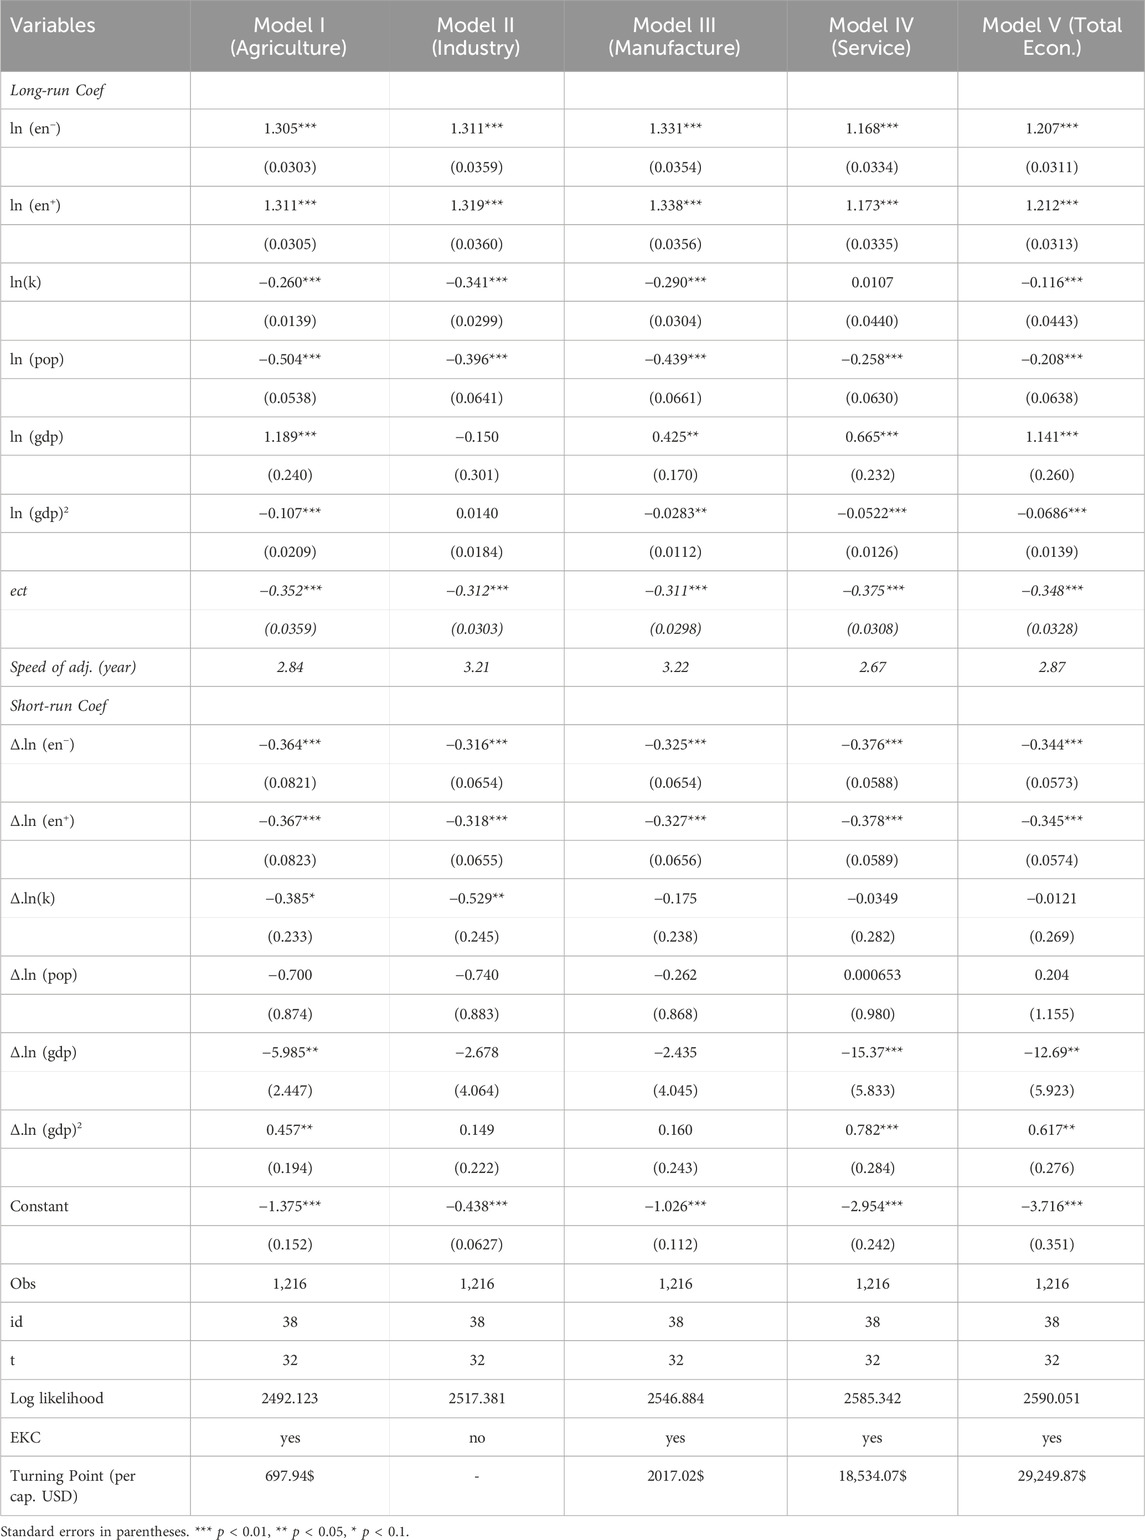
Table 10. Panel ARDL regression with asymmetric effect.
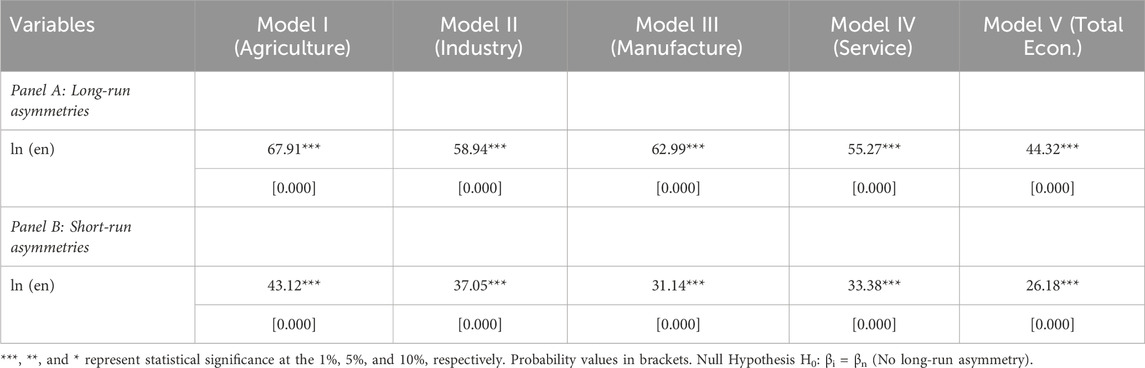
Table 11. Testing asymmetries.
In the service sector, the capital stock has no effect on CO2 emissions, while increases in the capital stock of other sectors lead to significant reductions in environmental degradation.
The fact that energy consumption increases environmental degradation in all sectors and the entire economy is still due to the intensity of primary energy use in the countries under consideration. Although the use of renewable energy has increased in OECD countries in recent years, this is still not at the desired level. In addition, the fact that the EKC hypothesis is not valid in the industry sector may be due to the intensive use of primary energy in the industry sector. Therefore, governments should reconsider their energy policies, especially in the industry sector, and should definitely increase renewable energy investments. It is seen that the coefficient value of the capital stock in the services sector is meaningless. This may be due to the fact that the capital stock used in the service sector is predominantly fixed assets. When all these are evaluated together, our findings provide important contributions to the literature. The first of these contributions is the demonstration that the asymmetric effects of energy consumption in all sectors and the economy in general have the same effect. In addition, in addition to the fact that the EKC hypothesis is not valid in the industrial sector of OECD countries, the fact that the validity of the EKC hypothesis in agriculture, manufacturing and service sectors is put forward also makes significant contributions to the literature.
Since 2022 is the last year of the data set, the estimated turning point graph for 2022 is presented in Graph 1. Of the 38 OECD countries, 16 are on the positively sloping part of the Kuznets curve (to the left of the turning point), according to the GDP per capita data corresponding to the estimated turning point obtained from the regression. The per capita income of these countries is below USD 29250, and environmental degradation continues to increase (see Graph 1). The fact that the EKC turning point shows significant differences among sectors is related to the share of the relevant sector in the economy. The results directly indicate that the service sector has the highest share in OECD economies, while the agricultural sector has the lowest share.
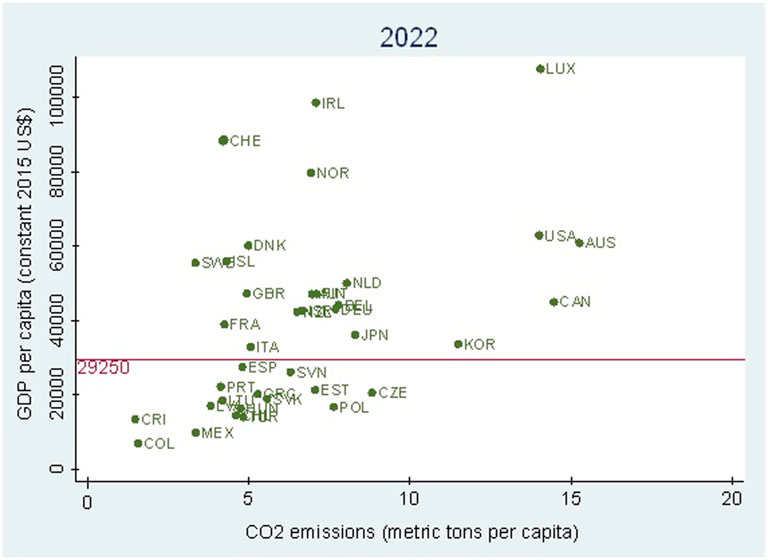
Graph 1. Scatter plot of per capita GDP and CO2 for year 2022.
Our findings on the aggregate and sectoral EKC hypothesis are consistent with the findings of recent studies such as Htike et al. (2021), Ferreira et al. (2022) and contrary to the findings for the industrial sector in Dogan and Inglesi-Lotz (2020).
6 Conclusion and discussions
The OECD is responsible for more than half of greenhouse gas emissions, making it the largest group of greenhouse gas emitting countries. This paper first analyses the impact of energy consumption asymmetry on CO2 using the PNARDL model with panel data for four sectors and 38 OECD economies for the period 1990–2022. Secondly, this paper investigates the relationship between income level and CO2 emissions in the context of the EKC hypothesis.
Our empirical results show that the EKC model is valid when the income-emissions relationship and total CO2 are taken into account, but differences emerge at the sectoral level.
We conclude that it may not be appropriate to generalize by aggregating sectors and use these findings for policy formulation. Because, as it is understood from the findings, sector-specific characteristics such as energy requirement, technological progress, resource endowment differentiate the income-emission relationship of each sector.
The empirical evidence substantiates the existence of the EKC hypothesis across all sectors, with the exception of the industrial sector. This result points to policy options for shifting industrial policies towards more renewable energy sources and increasing the green capital stock in industry sector. Moreover, in the industrial sector, the underlying causes of elevated emissions levels must be identified and comprehensive environmental policies must be established to reinforce existing environmental regulation policies. Nevertheless, the results indicate that increased economic growth in the agricultural, manufacturing, and service sectors has the potential to contribute to improvements in environmental quality. It is, therefore, incumbent upon policymakers to devise policies that promote economic growth while concurrently improving environmental quality.
The utilisation of hybrid and electric motorised agricultural vehicles in the agricultural sector has the potential to reduce CO2 emissions. It is recommended that the government provide support for the research and development of energy-saving hybrid and electric motorised agricultural vehicles.
It is recommended that the government implement subsidies for renewable energy generation systems, with the objective of increasing the use of renewable energy in the manufacturing sector.
The services sector includes sub-sectors with high energy consumption. It is therefore recommended that energy-saving appliances and building materials be promoted in these sectors.
However, the findings of our study suggest that the energy consumption-CO2 relationship is asymmetric both in the short and long run.
When the countries on the positive side of the Kuznets curve are analyzed, it is seen that they are generally OECD countries with relatively lower GDP per capita. These are generally the countries that left the Soviet Union (Slovakia, Slovenia, Estonia, Czech Republic, Poland, Croatia, etc.) and developing economies (Türkiye, Mexico, Colombia). The findings show that for countries falling behind the turning point, policies to increase renewable energy resources, especially in the industrial sector, are needed. It is necessary for OECD countries to restructure the industrial sector in an environmentally sustainable manner. For the sustainable development of the sector, its impact on the environment is crucial. Policies should be implemented to reduce CO2 emissions by spending on R&D in this area, developing human capital in these sectors and improving the technical efficiency of production technology in the development of environmentally friendly technologies.
The reasons why the EKC hypothesis is not valid in the industrial sector and the individual dynamics of other sectors await further clarification in future studies.
Data availability statement
The original contributions presented in the study are included in the article/Supplementary material, further inquiries can be directed to the corresponding author.
Author contributions
YM: Conceptualization, Data curation, Investigation, Methodology, Software, Supervision, Writing–original draft, Writing–review and editing. MS: Conceptualization, Data curation, Investigation, Methodology, Software, Writing–original draft, Writing–review and editing. EU: Conceptualization, Data curation, Investigation, Methodology, Software, Writing–original draft, Writing–review and editing. DS: Conceptualization, Data curation, Investigation, Methodology, Software, Supervision, Writing–original draft, Writing–review and editing.
Funding
The author(s) declare that financial support was received for the research, authorship, and/or publication of this article. The open access publication cost (APC) was funded by the authors.
Conflict of interest
The authors declare that the research was conducted in the absence of any commercial or financial relationships that could be construed as a potential conflict of interest.
Publisher’s note
All claims expressed in this article are solely those of the authors and do not necessarily represent those of their affiliated organizations, or those of the publisher, the editors and the reviewers. Any product that may be evaluated in this article, or claim that may be made by its manufacturer, is not guaranteed or endorsed by the publisher.
References
Ahmad, M., Zhao, Z.-Y., and Li, H. (2019). Revealing stylized empirical interactions among construction sector, urbanization, energy consumption, economic growth and CO2 emissions in China. Sci. Total Environ. 657, 1085–1098. doi:10.1016/j.scitotenv.2018.12.112
Arouri, M. E. H., Ben Youssef, A., M’henni, H., and Rault, C. (2012). Energy consumption, economic growth and CO2 emissions in Middle East and North African countries. Energy Policy 45, 342–349. doi:10.1016/j.enpol.2012.02.042
Aslam, B., Hu, J., Hafeez, M., Ma, D., AlGarni, T. S., Saeed, M., et al. (2021). Applying environmental Kuznets curve framework to assess the nexus of industry, globalization, and CO2 emission. Environ. Technol. & Innovation 21, 101377. doi:10.1016/j.eti.2021.101377
Balsalobre-Lorente, D., Shahbaz, M., Roubaud, D., and Farhani, S. (2018). How economic growth, renewable electricity and natural resources contribute to CO2 emissions? Energy Policy 113, 356–367. doi:10.1016/j.enpol.2017.10.050
Bekun, F. V., Alola, A. A., Gyamfi, B. A., and Yaw, S. S. (2021). The relevance of EKC hypothesis in energy intensity real-output trade-off for sustainable environment in EU-27. Environ. Sci. Pollut. Res. 28 (37), 51137–51148. doi:10.1007/s11356-021-14251-4
Ben Abdallah, K., Belloumi, M., and De Wolf, D. (2013). Indicators for sustainable energy development: a multivariate cointegration and causality analysis from Tunisian road transport sector. Renew. Sustain. Energy Rev. 25, 34–43. doi:10.1016/j.rser.2013.03.066
Brown, L., McFarlane, A., Campbell, K., and Das, A. (2020). Remittances and CO2 emissions in Jamaica: an asymmetric modified environmental kuznets curve. J. Econ. Asymmetries 22, e00166. doi:10.1016/j.jeca.2020.e00166
Cheikh, N. B., Zaied, Y. B., and Chevallier, J. (2021). On the nonlinear relationship between energy use and CO2 emissions within an EKC framework: evidence from panel smooth transition regression in the MENA region. Res. Int. Bus. Finance 55, 101331. doi:10.1016/j.ribaf.2020.101331
Cole, M. A., Rayner, A. J., and Bates, J. M. (1997). The environmental Kuznets curve: an empirical analysis. Environ. Dev. Econ. 2 (4), 401–416. doi:10.1017/S1355770X97000211
Congregado, E., Feria-Gallardo, J., Golpe, A. A., and Iglesias, J. (2016). The environmental Kuznets curve and CO2 emissions in the USA. Environ. Sci. Pollut. Res. 23 (18), 18407–18420. doi:10.1007/s11356-016-6982-9
Dinda, S. (2004). Environmental kuznets curve hypothesis: a survey. Ecol. Econ. 49 (4), 431–455. doi:10.1016/j.ecolecon.2004.02.011
Dogan, E., and Inglesi-Lotz, R. (2020). The impact of economic structure to the environmental Kuznets curve (EKC) hypothesis: evidence from European countries. Environ. Sci. Pollut. Res. 27, 12717–12724. doi:10.1007/s11356-020-07878-2
Erdogan, S., Fatai Adedoyin, F., Victor Bekun, F., and Asumadu Sarkodie, S. (2020). Testing the transport-induced environmental Kuznets curve hypothesis: the role of air and railway transport. J. Air Transp. Manag. 89, 101935. doi:10.1016/j.jairtraman.2020.101935
Esmaeilpour Moghadam, H., and Dehbashi, V. (2018). The impact of financial development and trade on environmental quality in Iran. Empir. Econ. 54 (4), 1777–1799. doi:10.1007/s00181-017-1266-x
Ferreira, E., Fuinhas, J. A., and Moutinho, V. (2022). An investigation of the environmental Kuznets relationship in BRICS countries at a sectoral economic level. Energy Syst. 13, 1031–1054. doi:10.1007/s12667-021-00459-3
Friedl, B., and Getzner, M. (2003). Determinants of CO2 emissions in a small open economy. Ecol. Econ. 45 (1), 133–148. doi:10.1016/S0921-8009(03)00008-9
Fujii, H., and Managi, S. (2013). Which industry is greener? An empirical study of nine industries in OECD countries. Energy Policy 57, 381–388. doi:10.1016/j.enpol.2013.02.011
Fujii, H., and Managi, S. (2016). Economic development and multiple air pollutant emissions from the industrial sector. Environ. Sci. Pollut. Res. 23 (3), 2802–2812. doi:10.1007/s11356-015-5523-2
Grossman, G. M., and Krueger, A. B. (1991). Environmental impacts of a north American free trade agreement. National Bureau of Economic Research. doi:10.3386/w3914
Gyamfi, B. A., Adedoyin, F. F., Bein, M. A., Bekun, F. V., and Agozie, D. Q. (2021). The anthropogenic consequences of energy consumption in E7 economies: juxtaposing roles of renewable, coal, nuclear, oil and gas energy: evidence from panel quantile method. J. Clean. Prod. 295, 126373. doi:10.1016/j.jclepro.2021.126373
Hamit-Haggar, M. (2012). Greenhouse gas emissions, energy consumption and economic growth: a panel cointegration analysis from Canadian industrial sector perspective. Energy Econ. 34 (1), 358–364. doi:10.1016/j.eneco.2011.06.005
Harberger, A. (1978). “Perspectives on capital and technology in less developed countries: in Artis, M,” in Contemporary economic analysis. Editor A. Nobay (London: Croom Helm).
Hashmi, S. M., Yu, X., Syed, Q. R., and Rong, L. (2024). Testing the environmental Kuznets curve (EKC) hypothesis amidst climate policy uncertainty: sectoral analysis using the novel Fourier ARDL approach. Environ. Dev. Sustain. 26 (7), 16503–16522. doi:10.1007/s10668-023-03296-9
Htike, M. M., Shrestha, A., and Kakinaka, M. (2021). Investigating whether the environmental Kuznets curve hypothesis holds for sectoral CO 2 emissions: evidence from developed and developing countries. Environ. Dev. Sustain. 24, 12712–12739. doi:10.1007/s10668-021-01961-5
International Energy Agency (2022). World energy outlook 2022. Available at: https://www.iea.org/reports/world-energy-outlook-2022.
Isik, C., Ahmad, M., Pata, U. K., Ongan, S., Radulescu, M., Adedoyin, F. F., et al. (2020). An evaluation of the tourism-induced environmental Kuznets curve (T-EKC) hypothesis: evidence from G7 countries. Sustain. Switz. 12 (21), 9150–9211. doi:10.3390/su12219150
Jalil, A., and Feridun, M. (2011). The impact of growth, energy and financial development on the environment in China: a cointegration analysis. Energy Econ. 33 (2), 284–291. doi:10.1016/j.eneco.2010.10.003
Juodis, A., Karavias, Y., and Sarafidis, V. (2021). A homogeneous approach to testing for Granger non-causality in heterogeneous panels. Empir. Econ. 60 (1), 93–112. doi:10.1007/s00181-020-01970-9
Kaab, A., Sharifi, M., Mobli, H., Nabavi-Pelesaraei, A., and Chau, K. W. (2019). Combined life cycle assessment and artificial intelligence for prediction of output energy and environmental impacts of sugarcane production. Sci. Total Environ. 664, 1005–1019. doi:10.1016/j.scitotenv.2019.02.004
Kais, S., and Sami, H. (2016). An econometric study of the impact of economic growth and energy use on carbon emissions: panel data evidence from fiftyeight countries. Renew. Sustain. Energy Rev. 59, 1101–1110. doi:10.1016/j.rser.2016.01.054
Kasman, A., and Duman, Y. S. (2015). CO2 emissions, economic growth, energy consumption, trade and urbanization in new EU member and candidate countries: a panel data analysis. Econ. Model. 44, 97–103. doi:10.1016/j.econmod.2014.10.022
Kuznets, S. (1955). Economic growth and income inequality. Am. Econ. Rev. 45 (1), 1–28. Available at: http://www.jstor.org/stable/1811581.
Lean, H. H., and Smyth, R. (2010). CO2 emissions, electricity consumption and output in ASEAN. Appl. Energy 87 (6), 1858–1864. doi:10.1016/j.apenergy.2010.02.003
Levin, A., Lin, C., and James Chu, C. (2002). Unit root tests in panel data: asymptotic and finite-sample properties. J. Econ. 108 (1), 1–24. doi:10.1016/S0304-4076(01)00098-7
Lorente, D. B., and Álvarez-Herranz, A. (2016). Economic growth and energy regulation in the environmental Kuznets curve. Environ. Sci. Pollut. Res. 23 (16), 16478–16494. doi:10.1007/s11356-016-6773-3
Ma, M., Cai, W., Cai, W., and Dong, L. (2019). Whether carbon intensity in the commercial building sector decouples from economic development in the service industry? Empirical evidence from the top five urban agglomerations in China. J. Clean. Prod. 222, 193–205. doi:10.1016/j.jclepro.2019.01.314
Moutinho, V., Varum, C., and Madaleno, M. (2017). How economic growth affects emissions? An investigation of the environmental Kuznets curve in Portuguese and Spanish economic activity sectors. Energy Policy 106, 326–344. doi:10.1016/j.enpol.2017.03.069
Mujtaba, A., Jena, P. K., and Mukhopadhyay, D. (2020). Determinants of CO2 emissions in upper middle-income group countries: an empirical investigation. Environ. Sci. Pollut. Res. 27, 37745–37759. doi:10.1007/s11356-020-09803-z
Nabavi-Pelesaraei, A., Rafiee, S., Mohtasebi, S. S., Hosseinzadeh-Bandbafha, H., and Chau, K. W. (2018). Integration of artificial intelligence methods and life cycle assessment to predict energy output and environmental impacts of paddy production. Sci. Total Environ. 631, 1279–1294. doi:10.1016/j.scitotenv.2018.03.088
Nabavi-Pelesaraei, A., Rafiee, S., Mohtasebi, S. S., Hosseinzadeh-Bandbafha, H., and Chau, K. W. (2019). Assessment of optimized pattern in milling factories of rice production based on energy, environmental and economic objectives. Energy 169, 1259–1273. doi:10.1016/j.energy.2018.12.106
Naveed, A., Ahmad, N., FathollahZadeh Aghdam, R., and Menegaki, A. N. (2022). What have we learned from Environmental Kuznets Curve hypothesis? A citation-based systematic literature review and content analysis. Energy Strategy Rev. 44, 100946. doi:10.1016/j.esr.2022.100946
Nehru, V., and Dhareshwar, A. (1993). A new database on physical capital stock: sources, methodology and results. Rev. Anal. Econ. (8), 37–59.
Ozcan, B., Tzeremes, P., and Dogan, E. (2019). Re-estimating the interconnectedness between the demand of energy consumption, income, and sustainability indices. Environ. Sci. Pollut. Res. 26, 26500–26516. doi:10.1007/S11356-019-05767-X
Pablo-Romero, M. D. P., Cruz, L., and Barata, E. (2017). Testing the transport energy-environmental Kuznets curve hypothesis in the EU27 countries. Energy Econ. 62, 257–269. doi:10.1016/j.eneco.2017.01.003
Panayotou, T. (1993). Empirical tests and policy analysis of environmental degradation at different stages of economic development. ILO Work. Pap. Available at: https://ideas.repec.org/p/ilo/ilowps/992927783402676.html.
Pata, U. K. (2018). Renewable energy consumption, urbanization, financial development, income and CO2 emissions in Turkey: testing EKC hypothesis with structural breaks. J. Clean. Prod. 187, 770–779. doi:10.1016/j.jclepro.2018.03.236
Pata, U. K. (2021). Renewable and non-renewable energy consumption, economic complexity, CO2 emissions, and ecological footprint in the USA: testing the EKC hypothesis with a structural break. Environ. Sci. Pollut. Res. 28 (1), 846–861. doi:10.1007/s11356-020-10446-3
Pata, U. K., Ahmed, Z., Eryilmaz, S., Zeren, F., and Gencer, Y. G. (2023). Analyzing the environmental Kuznets curve for transportation modes in European countries. Transp. Res. Part D Transp. Environ. 122, 103893. doi:10.1016/j.trd.2023.103893
Pedroni, P. (1999). Critical values for cointegration tests in heterogeneous panels with multiple regressors. Oxf. Bull. Econ. Statistics 61 (S1), 653–670. doi:10.1111/1468-0084.0610s1653
Pedroni, P. (2004). Panel cointegration: asymptotic and finite sample properties of pooled time series tests with an application to the PPP hypothesis. Econ. Theory 20 (3), 597–625. doi:10.1017/S0266466604203073
Pesaran, M. (2004) “General diagnostic tests for cross section dependence in panels (No. 435),” in Cambridge working papers in economics. University of Cambridge.
Pesaran, M. H. (2007). A simple panel unit root test in the presence of cross-section dependence. J. Appl. Econ. 22 (2), 265–312. doi:10.1002/jae.951
Pesaran, M. H., Shin, Y., and Smith, R. J. (1996) “Testing for the existence of a long-run relationship,” in Cambridge working papers in economics. University of Cambridge.
Pesaran, M. H., Shin, Y., and Smith, R. J. (2001). Bounds testing approaches to the analysis of level relationships. J. Appl. Econ. 16 (3), 289–326. doi:10.1002/jae.616
Raza, S. A., Shah, N., and Khan, K. A. (2020). Residential energy environmental Kuznets curve in emerging economies: the role of economic growth, renewable energy consumption, and financial development. Environ. Sci. Pollut. Res. 27 (5), 5620–5629. doi:10.1007/s11356-019-06356-8
Ren, S., Yuan, B., Ma, X., and Chen, X. (2014). International trade, FDI (foreign direct investment) and embodied CO2 emissions: a case study of Chinas industrial sectors. China Econ. Rev. 28, 123–134. doi:10.1016/j.chieco.2014.01.003
Sanli, D., Muratoğlu, Y., Songur, M., and Uğurlu, E. (2023). The asymmetric effect of renewable and non-renewable energy on carbon emissions in OECD: new evidence from non-linear panel ARDL model. Front. Environ. Sci. 11, 1228296. doi:10.3389/fenvs.2023.1228296
Sarkodie, S. A., and Strezov, V. (2019). Effect of foreign direct investments, economic development and energy consumption on greenhouse gas emissions in developing countries. Sci. Total Environ. 646, 862–871. doi:10.1016/j.scitotenv.2018.07.365
Selden, T. M., and Song, D. (1994). Environmental quality and development: is there a kuznets curve for air pollution emissions? J. Environ. Econ. Manag. 27 (2), 147–162. doi:10.1006/jeem.1994.1031
Shao, S., Yang, L., Yu, M., and Yu, M. (2011). Estimation, characteristics, and determinants of energy-related industrial CO2 emissions in Shanghai (China), 1994–2009. Energy Policy 39 (10), 6476–6494. doi:10.1016/j.enpol.2011.07.049
Shin, Y., Byungchul, Yu., and Greenwood-Nimmo, M. (2014). “Modelling asymmetric cointegration and dynamic multipliers in a nonlinear ardl framework,” in Festschrift in honor of peter schmidt. Editors R. C. Sickles, and W. C. Horrace (New York: Springer), 281–314. doi:10.1007/978-1-4899-8008-3_9
Sinha, A., Shahbaz, M., and Balsalobre, D. (2017). Exploring the relationship between energy usage segregation and environmental degradation in N-11 countries. J. Clean. Prod. 168, 1217–1229. doi:10.1016/j.jclepro.2017.09.071
Song, Y., Cheng, J., Zhang, Y., Dai, T., and Huang, J. (2021). Direct and indirect effects of heterogeneous technical change on metal consumption intensity: evidence from G7 and BRICS countries. Resour. Pol. 71, 101995. doi:10.1016/j.resourpol.2021.101995
Soytas, U., Sari, R., and Ewing, B. T. (2007). Energy consumption, income, and carbon emissions in the United States. Ecol. Econ. 62 (3), 482–489. doi:10.1016/j.ecolecon.2006.07.009
Stern, D. I. (2004). The rise and fall of the environmental kuznets curve. World Dev. 32 (8), 1419–1439. doi:10.1016/j.worlddev.2004.03.004
Taşdemir, F. (2022). Industrialization, servicification, and environmental Kuznets curve: non-linear panel regression analysis. Environ. Sci. Pollut. Res. 29 (5), 6389–6398. doi:10.1007/s11356-021-16012-9
Torras, M., and Boyce, J. K. (1998). Income, inequality, and pollution: a reassessment of the environmental Kuznets Curve. Ecol. Econ. 25 (2), 147–160. doi:10.1016/S0921-8009(97)00177-8
Usman, M., Jahanger, A., Makhdum, M. S. A., Balsalobre-Lorente, D., and Bashir, A. (2022). How do financial development, energy consumption, natural resources, and globalization affect arctic countries’ economic growth and environmental quality? An advanced panel data simulation. Energy 241, 122515. doi:10.1016/j.energy.2021.122515
Van Hoa, T., and Limskul, K. (2013). Economic impact of CO2 emissions on Thailand's growth and climate change mitigation policy: a modelling analysis. Econ. Model. 33, 651–658. doi:10.1016/j.econmod.2013.04.019
Vincent, J. R. (1997). Testing for environmental Kuznets curves within a developing country. Environ. Dev. Econ. 2 (4), 417–431. Scopus. doi:10.1017/S1355770X97000223
Waldhoff, S. T., and Fawcett, A. A. (2011). Can developed economies combat dangerous anthropogenic climate change without near-term reductions from developing economies? Clim. Change 107, 635–641. doi:10.1007/s10584-011-0132-7
Wang, Q., Yang, T., and Li, R. (2023). Does income inequality reshape the environmental Kuznets curve (EKC) hypothesis? A nonlinear panel data analysis. Environ. Res. 216, 114575. doi:10.1016/j.envres.2022.114575
Wang, Y., Zhang, C., Lu, A., Li, L., He, Y., ToJo, J., et al. (2017). A disaggregated analysis of the environmental Kuznets curve for industrial CO2 emissions in China. Appl. Energy 190, 172–180. doi:10.1016/j.apenergy.2016.12.109
Westerlund, J. (2005). New simple tests for panel cointegration. Econ. Rev. 24 (3), 297–316. doi:10.1080/07474930500243019
Xu, B., and Lin, B. (2015). Factors affecting carbon dioxide (CO2) emissions in China’s transport sector: a dynamic nonparametric additive regression model. J. Clean. Prod. 101, 311–322. doi:10.1016/j.jclepro.2015.03.088
Xu, B., and Lin, B. (2016). Reducing CO2 emissions in China’s manufacturing industry: evidence from nonparametric additive regression models. Energy 101, 161–173. doi:10.1016/j.energy.2016.02.008
Xu, B., and Lin, B. (2017). Assessing CO2 emissions in China’s iron and steel industry: a nonparametric additive regression approach. Renew. Sustain. Energy Rev. 72, 325–337. doi:10.1016/j.rser.2017.01.009
Yilanci, V., Cutcu, I., and Cayir, B. (2022). Is the environmental Kuznets curve related to the fishing footprint? Evidence from China. Fish. Res. 254, 106392. doi:10.1016/j.fishres.2022.106392
Zafar, M. W., Mirza, F. M., Zaidi, S. A. H., and Hou, F. (2019). The nexus of renewable and nonrenewable energy consumption, trade openness, and CO 2 emissions in the framework of EKC: evidence from emerging economies. Environ. Sci. Pollut. Res. 26, 15162–15173. doi:10.1007/s11356-019-04912-w
Zhang, T., Yin, J., Li, Z., Jin, Y., Ali, A., and Jiang, B. (2023). RETRACTED: a dynamic relationship between renewable energy consumption, non-renewable energy consumption, economic growth and CO2 emissions: evidence from Asian emerging economies. Front. Environ. Sci. 10, 2721. doi:10.3389/fenvs.2022.1092196
Keywords: energy consumption, environmental degradation, EKC hypothesis, panel NARDL, OECD countries
Citation: Muratoğlu Y, Songur M, Uğurlu E and Şanlı D (2024) Testing the environmental Kuznets Curve hypothesis at the sector level: Evidence from PNARDL for OECD countries. Front. Energy Res. 12:1452906. doi: 10.3389/fenrg.2024.1452906
Received: 21 June 2024; Accepted: 27 August 2024;
Published: 12 September 2024.
Edited by:
Liang Xu, Southwestern University of Finance and Economics, ChinaReviewed by:
Ibrahim Cutcu, Hasan Kalyoncu University, TürkiyeZhenhua Liu, China University of Mining and Technology, China
Copyright © 2024 Muratoğlu, Songur, Uğurlu and Şanlı. This is an open-access article distributed under the terms of the Creative Commons Attribution License (CC BY). The use, distribution or reproduction in other forums is permitted, provided the original author(s) and the copyright owner(s) are credited and that the original publication in this journal is cited, in accordance with accepted academic practice. No use, distribution or reproduction is permitted which does not comply with these terms.
*Correspondence: Devran Şanlı, ZGV2cmFuc2FubGlAZ21haWwuY29t
†ORCID: Yusuf Muratoğlu, orcid.org/0000-0003-1495-924X; Mehmet Songur, orcid.org/0000-0003-4763-9314; Erginbay Uğurlu, orcid.org/0000-0002-1297-1993; Devran Şanlı, orcid.org/0000-0003-4106-3799